cryogenic abrasive jet machining of …...cryogenic abrasive jet machining of polydimethylsiloxane...
TRANSCRIPT

Ryerson UniversityDigital Commons @ Ryerson
Theses and dissertations
1-1-2012
Cryogenic Abrasive Jet Machining ofPolydimethylsiloxane and Polytetrafluoroethyleneat Different TemperaturesAaron Glenn GradeenRyerson University
Follow this and additional works at: http://digitalcommons.ryerson.ca/dissertationsPart of the Engineering Science and Materials Commons, and the Mechanical Engineering
Commons
This Thesis is brought to you for free and open access by Digital Commons @ Ryerson. It has been accepted for inclusion in Theses and dissertations byan authorized administrator of Digital Commons @ Ryerson. For more information, please contact [email protected].
Recommended CitationGradeen, Aaron Glenn, "Cryogenic Abrasive Jet Machining of Polydimethylsiloxane and Polytetrafluoroethylene at DifferentTemperatures" (2012). Theses and dissertations. Paper 715.

CRYOGENIC ABRASIVE JET MACHINING OF POLYDIMETHYLSILOXANE AND
POLYTETRAFLUOROETHYLENE AT DIFFERENT TEMPERATURES
by
Aaron Glenn Gradeen, B.Sc, Queen’s University, Kingston ON Canada 2007
A thesis presented to Ryerson University
in partial fulfillment of the requirements for the degree of
Master of Applied Science
in the program of
Mechanical Engineering
Toronto, Ontario, Canada, 2012
Aaron Glenn Gradeen 2012 ©

ii
AUTHOR’S DECLARATION
I hereby declare that I am the sole author of this thesis or dissertation. This is a true
copy of the dissertation, including any required final revisions, as accepted by my
examiners.
I authorize Ryerson University to lend this thesis or dissertation to other
institutions or individuals for the purpose of scholarly research.
I further authorize Ryerson University to reproduce this thesis or dissertation by
photocopying or by other means, in total or in part, at the request of other
institutions or individuals for the purpose of scholarly research.
I understand that my dissertation may be made electronically available to the
public.
iii
ABSTRACT
Cryogenic Abrasive Jet Machining of Polydimethylsiloxane and
Polytetrafluoroethylene at Different Temperatures
Master of Applied Science, Mechanical Engineering, 2012, Aaron Glenn Gradeen
Yeates School of Graduate Studies, Ryerson University
The temperature dependence of the solid particle erosion of polydimethylsiloxane
(PDMS), polytetrafluoroethylene (PTFE) and high carbon steel using aluminum oxide particles
was investigated. The most efficient machining of PDMS occurred at approximately -178°C, at
angles of attack between 30° and 60°. Although it was demonstrated that PDMS could be
machined at temperatures above its glass transition, the erosion rate increased by a factor of more
than 10 when the machining temperature was below this point.
The maximum erosion in PTFE occurred at the coldest temperature of -177°C between
the angles of 30 and 90°. This scenario improved the erosion rate by more than a factor of five.
The erosion rate in high carbon steel was increased approximately twofold when lowering the
temperature from 17°C to -177°C.
The surface evolution results presented can be used to predict feature shapes both
polymers while minimizing cooling costs, minimizing mask wear or maximizing substrate
erosion.

iv
ACKNOWLEDGEMENTS
I would like to begin by sincerely thanking my supervisors, Dr. Marcello Papini and Dr.
Jan Spelt. Their commitment to this research and unwavering work ethic provided me with the
motivation required to complete my degree. Providing me with the opportunities to attend
conferences and publish my research is something I cannot convey my full gratitude for. This
thesis could not have been written without their sound advice and continual support.
I also must express great gratitude for the help of the technical support staff. Joseph
Amankrah and Andrew Heim were always available to lend their opinion or helping hand in
bringing my ideas to fruition. Many thanks to Qiang Li for always going out of his way to ensure
I had the resources to run my experiments. I would also like to thank Alan Machin for the
sharing of his equipment and ideas. I am also grateful for the support of Chao Ma in our
laboratory. The experimental aspect of this thesis would not have been possible without the
assistance of the technical support staff. The administrative support of Shirley Dacanay, Lynn
Reynolds and Mimi Lam also played a big role in making my experience here at Ryerson a
positive one.
I was incredibly lucky to be part of a research group that was always willing to lend a
helping hand when I hit a snag. A special thank you to Getu Hailu and David Ciampini for
always pointing me in the right direction.
Last but not least, none of this would have been possible without the constant support and
encouragement of my family. Thank You.
This research was supported by the Natural Sciences and Engineering Research Council
of Canada, Canada Research Chairs, Micralyne Inc., and Angstrom Power Inc.

v
Table of Contents
AUTHOR’S DECLARATION…………………………………….……………………ii
ABSTRACT…………………………………………………...…………………………….iii
ACKNOWLEDGEMENTS…………………………….…………..……………….…...iv
TABLE OF CONTENTS……………………………...………………………….………v
LIST OF TABLES……………………………………………..…………….……….……viii
LIST OF FIGURES……………………………………………………………..………….ix
LIST OF APPENDICES..……………………………………………………..………….xii
NOMENCLATURE………………………………………………………….…….……...xiii
1 Introduction .................................................................................................................................. 1
1.1 Motivation ............................................................................................................................. 1
1.2 Thesis Objective .................................................................................................................... 3
2 Literature Review......................................................................................................................... 4
2.1 Solid Particle Erosion ............................................................................................................ 4
2.1.1 Classifying Erosion......................................................................................................... 4
2.1.2 Erosion Mechanisms in Polymers .................................................................................. 4
2.1.3 Erodent and Target Properties Affecting Erosion .......................................................... 6
2.1.4 Erodent Velocity ............................................................................................................. 7
2.1.5 Angle Dependence of Erosion ........................................................................................ 7
2.1.6 Temperature Dependence of Material Properties ........................................................... 8
2.2 Abrasive Jet Micromachining of Features .......................................................................... 10
2.2.1 Abrasive Jet Micromachining of Ductile Materials ..................................................... 12
2.2.2 Second Strike Effects .................................................................................................... 13
2.2.3 Particle Mass Flux and Velocity Distribution .............................................................. 14
2.2.4 Jet Divergence .............................................................................................................. 15
2.2.5 Mask Edge Effects ........................................................................................................ 16
2.2.6 Cryogenic Erosion of Polymers and Steels .................................................................. 17
2.2.7 Temperature Dependence of Erosion in Glass ............................................................. 18

vi
2.3 Basic Heat Transfer ............................................................................................................. 20
2.3.1 Boiling Regimes of Heat Transfer ................................................................................ 20
2.3.2 Pool Boiling Heat Transfer ........................................................................................... 20
2.3.3 Flow Oscillations in Internal Cryogenic Flows ............................................................ 21
2.3.4 Impinging Cryogenic Jets and their Nusselt Number ................................................... 22
3 Design of Cryogenic Abrasive Jet Micromachining Apparatus ................................................ 24
3.1 Prototypes ............................................................................................................................ 24
3.1.1 Surface Flooding with Single Jet Entrainment ............................................................. 24
3.1.2 Symmetrical 90 Degree Entrainment with Manifold Mixing ....................................... 26
3.1.3 Upstream entrainment ................................................................................................... 28
3.1.4 Indirect Heat Exchanger/Cryogenic Abrasive Jet Machining Setup ............................ 30
4 Cryogenic Abrasive Jet Machining of Polydimethylsiloxane at Different Temperatures Attack
....................................................................................................................................................... 32
4.0.1 Preliminary Evidence for the Ability to Machine Polymers at Temperatures Above
Glass Transition ..................................................................................................................... 32
4.1 Experiments ......................................................................................................................... 33
4.1.1 Polydimethylsiloxane Sample Preparation ................................................................... 33
4.1.2 Characterization of Erosion Rate at Different Temperatures and Angles of Attack .... 33
4.1.3 Measurement of Mass Flow Rate ................................................................................. 37
4.2 Surface Evolution Modelling ............................................................................................. 37
4.3 Results and Discussion ........................................................................................................ 39
4.3.1 Centerline Particle Velocity and Surface Temperature ................................................ 39
4.3.2 Dependence of Erosion Rate on Angle of Attack in PDMS......................................... 42
4.3.3 Surface Evolution Prediction for Unmasked Channels in PDMS ................................ 46
4.3.4 Surface Evolution Prediction for PDMS Masked Channels ......................................... 51
4.3.5 Surface morphology and particle embedding in PDMS ............................................... 56
4.3.6 Volumetric Erosion per Unit Kinetic Energy in PDMS ............................................... 60
4.4 Summary of Findings and Results ...................................................................................... 61
5 Cryogenic Abrasive Jet Machining of Polytetrafluoroethylene at Different Temperatures ...... 63
5.1 Experiments ......................................................................................................................... 63
5.1.1 Cryogenic Abrasive Jet Machining Setup .................................................................... 63
5.1.2 Target Materials ............................................................................................................ 63
vii
5.1.3 Characterization of Erosion Rate at Different Temperatures and Angles of Attack .... 64
5.1.4 Micro-machining of Masked Channels in PTFE .......................................................... 65
5.1.5Particle Velocity ............................................................................................................ 65
5.2 Results and Discussion ........................................................................................................ 66
5.2.1 Dependence of Erosion Rate on Angle of Attack in PTFE .......................................... 66
5.2.2Dependence of Erosion Rate on Angle of Attack in High Carbon Steel ....................... 71
5.2.3 Masked Channels in PTFE ........................................................................................... 72
5.2.4 Profile Shapes ............................................................................................................... 75
5.2.5 Surface Morphology and Particle Embedding in PTFE ............................................... 76
5.2.6 Volume of PTFE Removed Per Unit Kinetic Energy of Erodent................................. 79
5.2.7 Temperature Dependence of Erosion in High Carbon Steel ........................................ 79
5.3 Summary of Findings and Results ...................................................................................... 81
6 Conclusions ................................................................................................................................ 82
6.2 Recommendations for Future Work .................................................................................... 83
8.0 References ............................................................................................................................... 90
Appendix A ................................................................................................................................... 85
Ratio of hole to channel depth................................................................................................... 85
Appendix B ................................................................................................................................... 86
Dependence of Erosion on the Slope of the Surface at the Leading Edge of the Abrasive Jet . 86
B1 Dependence of Erosion on the Slope of the Surface at the Leading Edge of the Abrasive
Jet ........................................................................................................................................... 87

viii
List of Tables
Table 4-1 Jet centerline velocities and target temperatures measured during erosion rate
experiments. The temperatures are the averages of the values measured before
machining each of the 3 repeat channels at each angle for a given heat exchanger length ...41
Table 4-2 Volumetric erosion rate of PDMS at normal incidence as a function of
temperature ............................................................................................................................45
Table 4-3 Best-fit variables of Eq. (4-8) for the curves of Figure 4-4 ...................................45
Table 4-4 Percentage error in predicted channel depths (90° angle of attack) ...................... 49
Table 4-5 Percentage error in predicted masked channel depths in PDMS at two different
temperatures ...........................................................................................................................56
Table 5-1 Volumetric erosion rate of PTFE at normal incidence as a function of
temperature. These values were used to calculate the normalized erosion rate, G(α), in
Fig. 5-1 ...................................................................................................................................73
Table 5-2 Best-fit variables of Eq. 4-8 for the curves of Figure 5-1 .....................................73
Table 5-3 Transition temperatures of PTFE [55] ................................................................... 74
Table 5-4 Percentage error in predicted channel depths in PTFE at two different
temperatures ...........................................................................................................................77
Table B1 – Channel depths for two different dosage methods ..............................................88

ix
List of Figures
Figure 1-1 Experimental apparatus for basic AJM [1] .......................................................... 1
Figure 1-2 Channel cross sectional view showing the placing of metal shims (dark grey)
used as a mask ........................................................................................................................2
Figure 2-1 Erosion improvement of PDMS at low temperatures [3] ..................................... 17
Figure 2-2 Brittle erosion enhancement in glass at low temperature [33] ............................. 19
Figure 3-1 Liquid nitrogen self pressurizing vessel setup .....................................................25
Figure 3-2 Contour plot of a hole drilled at an average temperature of -90°C using an
external liquid nitrogen jet .....................................................................................................26
Figure 3-3 Cross sectional profile of a hole drilled with a jet lacking uniform
temperature ............................................................................................................................26
Figure 3-4 Schematic of the equipment setup for symmetrical external entrainment ...........27
Figure 3-5 Nitrogen manifold and ABS ring in place with abrasive jet ................................28
Figure 3-6 Schematic of the apparatus machined to allow upstream injection of LN2 .........29
Figure 3-7 Upstream injection equipment in place ................................................................29
Figure 3-8 Schematic of final CAJM setup ...........................................................................30
Figure 3-9 Clamping device for the experiments done using PTFE, steel and glass .............31
Figure 4-1 Lengthwise profile of the variable temperature channel ......................................32
Figure 4-2 Front and side view of the abrasive jet nozzle orientation and direction of
PDMS target movement during the machining of a channel in the "backwards" mode ........33
Figure 4-3 Measured (symbols) hole to channel depths for holes machined at α= 90˚
with dwell time ∆t = 10 s, and channels machined at a scan speed vt = 0.5 mm/s ...............40
Figure 4-4 Normalized erosion rate as a function of angle of attack at: (a) -82°C, (b) -
127°C, (c) -178 °C. Data points are the measurements and the solid line is the best-fit
curve to G(α) ..........................................................................................................................43
Figure 4-5 Normalized erosion rate as a function of temperature at all oblique angles of
attack in PDMS ......................................................................................................................44
Figure 4-6 Comparison of measured channel profiles (symbols) and predictions (solid
lines) of Eq. (4-7) for machining at: (a) -82°C, (b) -127°C, (c) -178°C. Note the change
in depth scales at each temperature. 90° angle of attack........................................................48
Figure 4-7 G(α) altered (data points) to account for the incubation period seen at -82°C.
Original fit (solid line) from Figure 4-4 Normalized erosion rate as a function of angle of
attack at: (a) -82°C, (b) -127°C, (c) -178 °C. Data points are the measurements and the
solid line is the best-fit curve to G(α).a .................................................................................51
Figure 4-8 Mask holding device ............................................................................................52
Figure 4-9 Predicted (solid lines) and experimental profiles (data points) for masked
channels in PDMS at -180°C. . The location of the mask edge is shown as a dashed line.
The experimental first pass was used to fit the erosive efficacy (Eq. (2-11)) across the
mask opening .........................................................................................................................53
Figure 4-10 Predicted (solid lines) and experimental profiles (data points) for masked
channels in PDMS at -180°C. The location of the mask edge is shown as a dashed line.
The experimental fourth pass was used to infer the erosive efficacy (Eq. (2-11)) across
the mask opening using the method of [26] ...........................................................................54
Figure 4-11 Predicted (solid lines) and experimental profiles (data points) for masked
channels in PDMS at -65°C. The location of the mask edge is shown as a dashed line.
x
The experimental first pass was used to fit the erosive efficacy (Eq. 2-11)) across the
mask opening .........................................................................................................................55
Figure 4-102 Scanning electron micrographs of PDMS blasted at 90° in a single pass at
(a) -82°C and (b) -178°C .......................................................................................................56
Figure 4-13 EDX mapping of the distribution of Al (white spots) on two samples of
PDMS. The sample on the left was machined at -73°C and the sample on the right was
machined at -180°C ...............................................................................................................57
Figure 4-14 oblique views of the surface of PDMS a) single particle impact at -73°C,
30° angle of attack b)single particle impact at -180°C, 90° angle of attack c) repeated
impacts at -73°C, 30° angle of attack d) repeated impacts at -180°C, 90° angle of attack ...58
Figure 4-15 Scanning electron micrographs of PDMS: a) virgin surface that had been
cooled to -73°C, b) machined surface at -73°C. c) virgin surface that had been cooled to
-180°C, d) machined surface at -180°C, e) magnified view of dashed area shown in d .....60
Figure 4-16 Volume of eroded PDMS per unit kinetic energy of incident particles as a
function of impact angle for four temperatures .....................................................................61
Figure 5-1 Normalized erosion rate in PTFE as a function of angle of attack at: (a) Room
temperature (b) -76°C, (c) -107°C, (d) -182 °C. Data points are the measurements and
the solid line is the best-fit curve to G(α) Eq.(4-8) ................................................................68
Figure 5-2 Normalized erosion rate as a function of temperature at all oblique angles of
attack in PTFE........................................................................................................................69
Figure 5-3 Angle dependency of erosion in high carbon steel as a function of
temperature ............................................................................................................................72
Figure 5-4 Predicted (solid lines) and experimental profiles (data points) for masked
channels in PTFE at -180°C. The mask edge is shown as a dashed line. The
experimental first pass was used to fit the erosive efficacy to Eq. (5-2), suggested by
[26], across the mask opening ................................................................................................73
Figure 5-5 Predicted (solid lines) and experimental profiles (data points) for masked
channels in PTFE at -65°C. The mask edge is shown as a dashed line. The
experimental first pass was used to fit the erosive efficacy (Eq. (2-11)) across the mask
opening ...................................................................................................................................74
Figure 5-6 Normalized profile shapes in glass (room temperature), PDMS and PTFE (-
180°C and -65°C). Actual channel depths in brackets. PDMS profiles are the deepest
ones from Figs 4-8 and 4-12. PTFE profile at -180°C from a single channel blasted at
400 kPa with a scan speed of 1 mm/s. PTFE profile at -65°C from Fig. 5-4 ........................76
Figure 5-7 Particle embedding in PTFE at 17°C and 60, 75 and 90° nozzle angle of
attack ......................................................................................................................................77
Figure 5-8 Backscatter image of aluminum oxide (white dots) embedded in Teflon at
a)17°C (140 m/s), b)-182°C (49 m/s), c) -107°C (36 m/s), d) -76°C (58 m/s).Figure 5-7
Volumetric erosion per unit kinetic energy of erodent in PTFE ............................................78
Figure 5-9 Volumetric erosion per unit kinetic energy of erodent in PTFE as a function
of temperature and angle of attack .........................................................................................79
Figure 5-10 Ratio of channel depths in steel to glass as a function of angle of attack and
temperature ............................................................................................................................80
Figure 5-11 Ratio of channel depths in PTFE to glass as a function of angle of attack and
temperature ............................................................................................................................80

xi
Figure B-1 Profile showing the slope of the leading edge in PTFE machined at -180°C
and 400 kPa ............................................................................................................................87

xii
List of Appendices
Appendix A ........................................................................................................................85
Ratio of hole to channel depth........................................................................................85
Appendix B ........................................................................................................................86
Dependence of Erosion on the Slope of the Surface at the Leading Edge of the
Abrasive Jet ....................................................................................................................86
B1 Dependence of Erosion on the Slope of the Surface at the Leading Edge of the
Abrasive Jet ................................................................................................................87

xiii
Nomenclature
The definition of symbols in alphabetical order:
Symbol Name Unit
C Erosion constant Non-dimensional
D Diameter of particle µm
E Erosion rate mm3/kg, kg/kg
E(α) Erosion rate at an arbitrary angle mm3/kg
E90 Erosion rate at 90° angle of attack mm3/kg
G(α) Normalized erosion rate Non-dimensional
GP(α) Normalized erosion rate for PDMS or PTFE Non-dimensional
Gg(α) Normalized erosion rate for PDMS or PTFE Non-dimensional
Hp Hardness of particle GPa
Ht Hardness of target GPa
h Nozzle standoff distance mm
hc Convective heat transfer coefficient W/m2K
k Velocity exponent Non-dimensional
k2 Empirical constant Non-dimensional
K90 Empirical constant Non-dimensional
Mass flow of erodent kg/s
Mass flow of erodent during machining of a
channel at a nozzle angle attack
of α
kg/s
Mass flow of erodent during machining of a
channel at a nozzle angle attack
of 90°
kg/s
M(x) Scaling function for mass flux accounting
for mask edge effects Non-dimensional
n Empirical constant
n1,n2 Parametric exponent Non-dimensional
Nu Nusselt number Non-dimensional
r Radial position within the abrasive jet µm
V(x)
Velocity distribution of erodent particles
within the abrasive jet m/s
M&
αm&
90m&
xiv
zt Partial derivative of profile depth with
respect to time, t. µm/s
zx,zy
Partial derivative of profile depth with
respect to location within the channel, x and
y.
Non-dimensional
Greek Symbols
α Angle between the nozzle and the
target material °
β Nozzle focus coefficient Non-dimensional
φ(r) Particle mass flux distribution kg/s
θ Local impact angle between the incoming
erodent particle and the target surface rads
ρ Density of the target kg/m3

1
1 Introduction
1.1 Motivation
Abrasive jet micromachining (AJM) is a relatively new micro-fabrication technology in
which a jet of pressurized air is used to accelerate small particles towards a target surface which
is thus machined by solid particle erosion mechanisms. Figure 1-1 shows a basic AJM machining
setup.
Figure 1-1 Experimental apparatus for basic AJM [1].
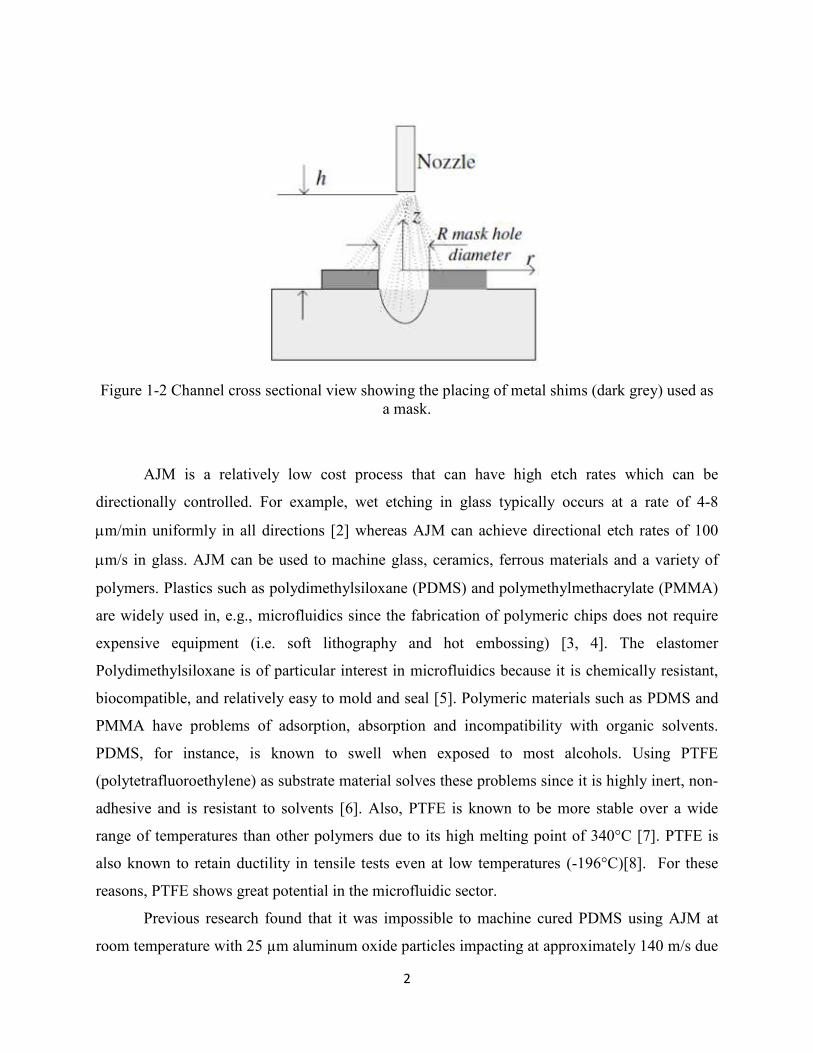
Erosion resistant masks patterned with small openings are typically used to define the features to
be machined. Below is an example of two metal masks placed parallel to one another in order to
produce a channel.
2
Figure 1-2 Channel cross sectional view showing the placing of metal shims (dark grey) used as
a mask.
AJM is a relatively low cost process that can have high etch rates which can be
directionally controlled. For example, wet etching in glass typically occurs at a rate of 4-8
µm/min uniformly in all directions [2] whereas AJM can achieve directional etch rates of 100
µm/s in glass. AJM can be used to machine glass, ceramics, ferrous materials and a variety of
polymers. Plastics such as polydimethylsiloxane (PDMS) and polymethylmethacrylate (PMMA)
are widely used in, e.g., microfluidics since the fabrication of polymeric chips does not require
expensive equipment (i.e. soft lithography and hot embossing) [3, 4]. The elastomer
Polydimethylsiloxane is of particular interest in microfluidics because it is chemically resistant,
biocompatible, and relatively easy to mold and seal [5]. Polymeric materials such as PDMS and
PMMA have problems of adsorption, absorption and incompatibility with organic solvents.
PDMS, for instance, is known to swell when exposed to most alcohols. Using PTFE
(polytetrafluoroethylene) as substrate material solves these problems since it is highly inert, non-
adhesive and is resistant to solvents [6]. Also, PTFE is known to be more stable over a wide
range of temperatures than other polymers due to its high melting point of 340°C [7]. PTFE is
also known to retain ductility in tensile tests even at low temperatures (-196°C)[8]. For these
reasons, PTFE shows great potential in the microfluidic sector.
Previous research found that it was impossible to machine cured PDMS using AJM at
room temperature with 25 µm aluminum oxide particles impacting at approximately 140 m/s due

3
to its ability to absorb the energy of the impacting particles [3]. Getu et al. [3] were able to
machine PDMS with 25 µm aluminum oxide particles at an impact velocity of approximately
140 m/s [9] using a cryogenic abrasive jet micromachining (CAJM) apparatus that cooled the
surface region to approximately -150°C. Due to lack of cryogenic flow control, this experimental
setup was only capable of blasting at the lowest temperature attainable while the surface was
being flooded with liquid nitrogen. It was therefore unknown as to how erosion behaved at the
intermediate temperatures.
In summary, both PDMS and PTFE have shown an increase in solid particle erosion, and
thus the machining material removal rate, when the machining temperature is dropped
significantly [3]. It is not, however, known how the material removal rate and the erosion
mechanisms change at intermediate temperatures, because the previous CAJM apparatus was
capable of only flooding the surface with liquid nitrogen, giving a single machining temperature.
A change in erosion mechanism usually manifests itself as a change in the dependence of the
erosion rate on the nozzle inclination angle, which, in turn, strongly affects the shape of the
machined feature [4]. As a result, the size and shape of micro-channels machined using CAJM
at these intermediate temperatures is also unknown. The thesis objectives in Section 1.2 outline
the steps that were taken to address this gap in the literature.
1.2 Thesis Objective
The overall objective of the thesis is to investigate how erosion in PDMS and PTFE are
affected by temperature and nozzle angle of attack in the range of 17 to -196°C. In order to
reach this primary objective, the following secondary objectives will be met:
(i) Design and implement a cryogenic abrasive jet machining apparatus which is capable of
blasting consistently and predictably at temperatures between 17 and -196°C.
(ii) Investigate the erosion magnitude and angle dependency in PDMS, PTFE and high carbon
steel (used as a mask material) at these temperatures.
(iii) Use the angle dependency results in existing surface evolution models in order to predict the
size and shape in unmasked and masked channel profiles in PDMS and masked channels PTFE.
(iv) Isolate the erosion per unit kinetic energy of the erodent by extracting the particle velocity
from the depth of a glass channel. Use this information to suggest optimal machining conditions.

4
2 Literature Review
2.1 Solid Particle Erosion
Solid particle erosion is a process in which material is removed through the repeated
impact of small solid particles. This can be undesirable in processes involving turbines,
pipelines, valve systems carrying particulate matter or any other industrial system exposed to a
particle laden environment. Solid particle erosion can also be used to process materials, such as
in surface hardening, burr removal, blast cleaning, and machining. An important example of a
machining process which can be used for rapid prototyping of microelectromechanical systems
(MEMS) and microfluidic chips is abrasive jet micro-machining (AJM).
2.1.1 Classifying Erosion
Erosion is typically quantified by mass of material removed per mass of erodent used,
i.e., the erosion rate. It is also typically categorized as being either ductile or brittle [10]. Feng et
al. state that brittle erosion due to angular particle impact is most commonly classified as being
associated with lateral cracking due to residual stresses from impact[10]. For brittle materials,
erosion is very sensitive to the hardness and fragility of erodents. Feng et al. state that higher
residual crack driving forces are created when the ratio of erodent to target hardness is increased.
Material removal is considered to be dominated by a brittle mechanism when the erosion
rate is maximized while the incident particle velocity is perpendicular to the surface.
Alternatively, ductile erosion is considered to dominate when the erosion rate is maximized at a
certain oblique angle, which depends on the material. Erosion rates at oblique angles in some
ductile materials can be up to 16 times larger than erosion at perpendicular incidence [11].
Oka [11] explains brittle erosion as being caused by repeated deformation of the surface
whereas ductile erosion is said to be dominated by particles cutting the surface. Brittle erosion is
thought to mainly occur due to the vertical impact energy of the particles and ductile erosion
mechanisms are thought to be caused by the horizontal impact energy of the particles responsible
for cutting.
2.1.2 Erosion Mechanisms in Polymers
Walley and Field [12] investigated the solid particle erosion of polyethylene, which is a
polymer considered to behave in a ductile manner since maximum erosion occurs when the
nozzle is inclined between 20 and 30° from the surface. Steel spheres with diameters between 2

5
and 8 mm were used to model single impacts of smaller sand particles (300- 600 µm) since high
speed photography had trouble capturing the small particles. The authors found that lips were
produced at the crater edge beyond a certain velocity and within a specific range of impact
angles. These lips produced by single particle impacts were typically weakly bonded to the
surface in metals but in polyethylene, these lips were strongly bonded. The drawing out of
filaments by rounded particles and the cutting off of chips by sharp particles were the two
erosion mechanisms found.
Arnold and Hutchings [13] briefly mentioned that the erosion mechanism in natural and
styrene-butadiene rubber is fatigue crack propagation. High tensile stresses in the surface are said
to cause the fine cracks to grow which in turn results in material removal. These rubbers behaved
in a ductile manner since erosion was maximized at about a 15° angle of attack. Scanning
electron micrographic analysis of the rubber surface eroded at a 30° angle of attack with silica
particles travelling at approximately 100 m/s resulted in a series of ridges running transversely to
the impact direction. Arnold and Hutchings [14] published a second paper which successfully
modeled erosion in rubber at normal incidence based on a material removal mechanism of
fatigue crack growth. Frictional traction of the particles during impact was said to be responsible
for crack growth.
Hutchings and Deuchar [15] investigated the solid particle erosion of unfilled elastomers.
The high resilience rubbers displayed transverse ridges with large globular fragments of rubber
attached and more rounded features on the surface. Besztercey et al. [16] found these same
ridges on the surface of silicon rubber after solid particle erosion at oblique angles. The erosion
mechanism of cyclic crack growth was proposed. The low resilience rubbers Hutchings and
Deuchar studied showed no directionality on the surface; only evidence of loosely attached
rubber fragments and numerous cracks and fissures were found. A catastrophic tearing process
which removed small fragments of rubber was suggested as the erosion mechanism. Harsha and
Thakre [17] also found micro-cracking to be the dominant failure mechanism in neat
polyetherimide even though it is considered to be a ductile polymer. Erosion by plastic
deformation at 60° was identified due to large fibrils that were cut from the substrate but still
adhered to the surface. Zahavi and Schmitt [18] also saw a lack of directionality in the erosion of
an elastomeric polyurethane coating at 15 and 30°. Elongated craters approximately 20% of the
particle size along with cracks and fragments of material were seen.
6
Barkoula and Karger [19] mentioned the basic material removal mechanisms of tearing
and fatigue for rubbers, cutting and chip formation for ductile polymers and crack
formation/brittle fracture for brittle polymers. For elastomers specifically, they gave two main
mechanisms of erosion. The first was tensile stresses due to frictional forces causing fine cracks
to grow in the surface which eventually resulted in material removal. The second was an increase
of steady strain because of incomplete strain relaxation between particle impacts. An interesting
point was also made that amorphous polymers tended to show more brittle features when
examined under microscope.
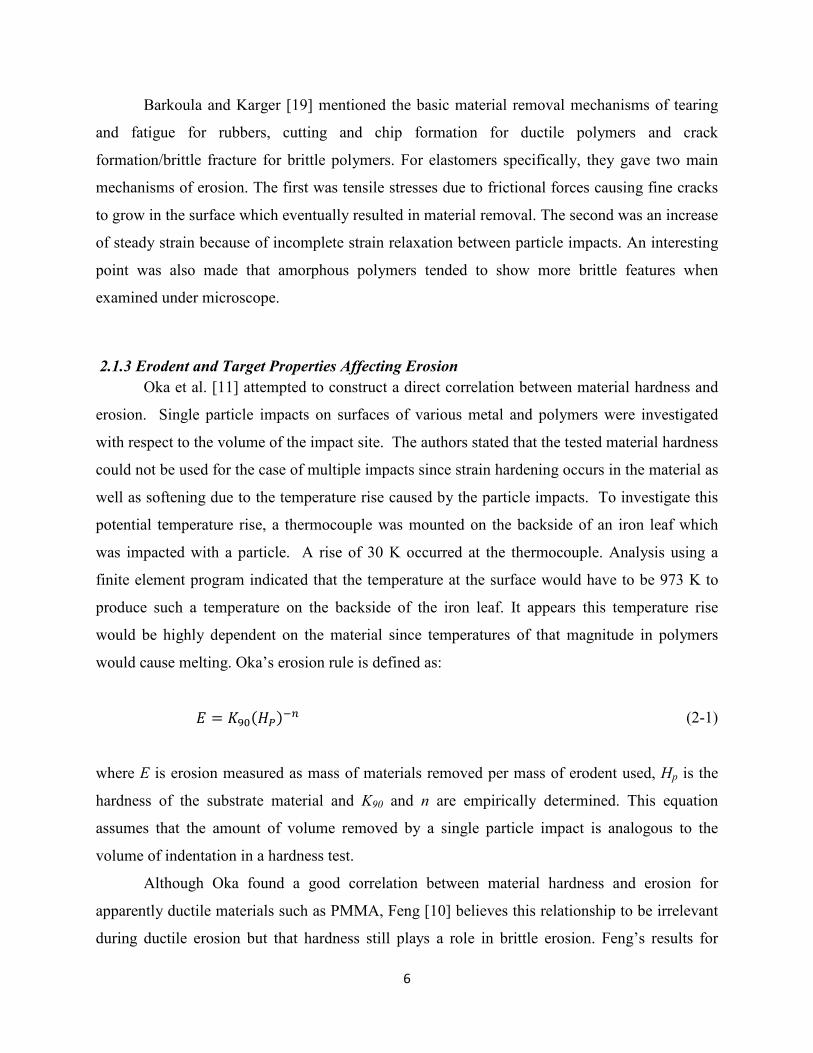
2.1.3 Erodent and Target Properties Affecting Erosion
Oka et al. [11] attempted to construct a direct correlation between material hardness and
erosion. Single particle impacts on surfaces of various metal and polymers were investigated
with respect to the volume of the impact site. The authors stated that the tested material hardness
could not be used for the case of multiple impacts since strain hardening occurs in the material as
well as softening due to the temperature rise caused by the particle impacts. To investigate this
potential temperature rise, a thermocouple was mounted on the backside of an iron leaf which
was impacted with a particle. A rise of 30 K occurred at the thermocouple. Analysis using a
finite element program indicated that the temperature at the surface would have to be 973 K to
produce such a temperature on the backside of the iron leaf. It appears this temperature rise
would be highly dependent on the material since temperatures of that magnitude in polymers
would cause melting. Oka’s erosion rule is defined as:
� � ������� (2-1)
where E is erosion measured as mass of materials removed per mass of erodent used, Hp is the
hardness of the substrate material and K90 and n are empirically determined. This equation
assumes that the amount of volume removed by a single particle impact is analogous to the
volume of indentation in a hardness test.
Although Oka found a good correlation between material hardness and erosion for
apparently ductile materials such as PMMA, Feng [10] believes this relationship to be irrelevant
during ductile erosion but that hardness still plays a role in brittle erosion. Feng’s results for

7
erosion on glass using diamond, silicon carbide, alumina and silica erodent particles gave the
following relationship
�� ∝ ��.����.�������: ����.��� (2-2)
where ρ is the density of erodent, V is the velocity of the erodent particles, D is the diameter of
the erodent particles, Hp is the hardness of the particles and Ht is the hardness of the target.
For ductile materials, Feng’s study concluded that the shape of the particles also affects erosion.
This dependence upon particle shape is not surprising since the main erosion mechanism in
ductile materials is cutting, and one would expect that sharper, more angular particles would
produce higher erosion rates.
2.1.4 Erodent Velocity
The velocity of the erodent particles is connected to the erosion rate through an empirical
power law relation expressed as [10];
� ∝ �� (2-3)
where E represents the volume or mass of material eroded per mass of erodent, V is the velocity
of the impacting particles and k is the experimentally determined velocity exponent. This is one
of the basic fundamental laws of erosion. The most basic of models would assume that the
erosion rate is proportional to the kinetic energy of the particle so k would have a value of two.
In reality, k values vary typically between 1 and 4.
2.1.5 Angle Dependence of Erosion
The angle at which maximum erosion occurs has important implications for the efficient
machining of materials using an abrasive jet. Oka et al. [20] studied the angle dependence of
erosion for various types of metals, a ceramic and a plastic material. The authors suggested a
semi-theoretical model that differentiated between the two mechanisms of erosion mentioned in

8
Section 2.1.1. The semi-theoretical equation was expressed in terms of material hardness and
impact angle as
� � ���������� ∝�! "#� $ �� ∝#� $ 1 &�' (2-4)
where α is the angle between the erodent trajectory and the substrate surface, K90 and n are
constants at normal impact angles, Hv is the hardness of the substrate material, and k2, n1 and n2
are constants determined by material properties. Oka et al. found that a plot of normalized
erosion (E(α)/E(90)) versus impact angle fit this model very well for all the metallic materials
tested. It was found that the peak in erosion occurred at an angle which became smaller as the
material hardness decreased. Therefore materials with a very large hardness value would be
expected to have a maximum erosion rate closer to 90° whereas materials with low hardness
values would have a maximum erosion rate closer to 15°. The shape of this normalized curve
was found to be independent of particle velocity within the ranges used (50-130 m/s). Particle
velocity was only seen to increase the amount of erosion by shifting the non normalized erosion
curve upwards. Oka’s model was unable to predict the erosive behavior of the ceramic material
with respect to impact angle and material hardness. Oka et al. conclude that if the material
hardness and erosion at normal angles is known, this formula can be used to effectively estimate
erosion at various impact angles.
2.1.6 Temperature Dependence of Material Properties
The mechanical properties of materials are known to be temperature dependent. A brief
review of how the erodent and substrate materials behavior changes with temperature is thus
warranted.
PDMS and PTFE are both polymeric materials. Polymers are long chains which are made
up of numerous single units called mers. The degree of polymerization is dictated by the length
of these polymers which in turn is controlled by energy available (ie. heat input) during
polymerization. There are three main categories of molecular structure for polymers. A linear
polymer forms a single continuous path from one end to the other with no branches. A branched
polymer has a main backbone with smaller branches leading from it. Finally, a cross linked
polymer is more like a network analogous to a spider web but without the degree of order. The

9
polymer structure dictates the mechanical properties of the material. Elastomers such as PDMS,
have a high degree of cross linking. PDMS is also considered to be an amorphous polymer due to
the degree of random entanglements and highly disordered states of the polymer structure.
Amorphous polymers tend to behave in a viscoelastic manner due to the Van der Walls bonds
formed between various folds of the polymer chain. This results in high strain rates causing
large amounts of stress due to the friction from the molecular motion [21]. PTFE, on the other
hand, is considered to be a linear polymer. This is because PTFE cannot be crosslinked due to its
chemical inertness [21].
Three main factors govern the ductility and toughness of polymers: strain rate,
temperature and molecular structure. Temperatures well below glass transition and high strain
rates result in the polymers fracturing as opposed to yielding. Upon fracture, the covalent bonds
between carbon atoms must be broken (chain scission) but the aforementioned secondary forces
of the Van der Walls bonds also play a major role. Stress concentrations can occur in polymers
due to non homogeneous entanglements. This means that some polymer chains can experience
large amounts of stress while others experience very little [21].
Boyer [22] performed an extensive review of research pertaining to the mechanical
properties of various polymers used for structural purposes. The author used data published
from electrical, electromagnetic and dynamic mechanical testing to infer how molecular motion
affects the mechanical properties, specifically impact strength, of these polymers. Boyer,
however, was quick to point out that using the stated glass transition and melting temperatures of
the polymer as a tool for predicting mechanical behavior is not sufficient. The glass transition
temperature is defined as the temperature in which a material transitions from ductile to brittle
behaviour due to a decrease in molecular mobility. It has been found that other transitions and
relaxations lie below and above glass transition (TG). Boyer attempted to correlate the β
relaxation parameter, which is a transition existing below TG, with the polymers impact strength
at room temperature. This was found to be a poor generalization since too many exceptions
existed for other polymers. The results summarized by Boyer also indicate that impact strength
decreases with temperature. This relationship is unique to each polymer so ultimately
correlations cannot be made regarding polymer fracture at various temperatures with this data.
The properties of the erodent particles are also important when characterizing erosion
from an abrasive jet. Temperature could affect the erosive behaviour of the particles themselves.

10
Since the most common type of abrasive used in AJM is aluminum oxide, a brief look into how
the mechanical properties behave at various temperatures is useful. Gonzalez et al. [23]
investigated the mechanical properties of alumina, specifically Young’s Modulus and yield
stress, from room temperature up to 1200 °C, where the onset of creep was observed. The results
showed a clear decrease in Young’s Modulus as temperature was increased. A linear decrease in
the hardness of alumina as the temperature was increased was also found. These results could be
extrapolated to lower temperatures in order to predict how the mechanical properties of alumina
change at cryogenic temperatures.
Khanna et al. [24] investigated the wear characteristics of alumina at cryogenic
temperatures. This study was motivated due to the need for appropriate material selection in
cryo-turbopumps in the space shuttle main engine. Structural ceramics, such as alumina, have a
low density and high hardness compared to the materials normally used (martensitic stainless
steel). This makes alumina an ideal candidate to increase bearing life. Ceramics are said to be
brittle due to the limited number of slip systems for plastic flow. The authors suggested that the
cryogenic temperatures cause surface hardening which triggers the onset of brittle fracture. This
type of fracture is confirmed by the presence of transgranular and intergranular fractures.
Khanna et al. conclude that cryogenic temperatures enhance the brittle fracture of alumina. This
conclusion suggests that fracture of the alumina particles upon impact of the cold susbtrate
surface could decrease the erosion rate since energy is expended during particle break up.
2.2 Abrasive Jet Micromachining of Features
Features can be machined using AJM by selectively etching the surface using patterned
masks which are highly resistant to solid particle erosion. Mathematical models have been
constructed in order to predict the growth and profile shapes of features such as micro-holes,
channels and planar areas.
ten Thije Boonkkamp and Jansen [25] took a mathematically rigorous approach to
surface evolution modeling which included finding an analytical solution to a partial differential
equation. They proposed a model which predicted the position of the machined surface based on
a brittle erosion process (i.e. only the normal component of the particle velocity contributes to
erosion). The erosion rate (ratio of mass of target material removed to the mass of abrasive used
to remove it) was related to the velocity as follows

11
E � C�|v|cosϑ0 (2-5)
where θ is the angle between the velocity vector and the surface normal vector, v is the velocity
of the particles, C is the erosion constant and k is the velocity exponent.
A partial differential equation for the surface position was obtained which was based
upon the speed in which the surface progresses, c, along with the partial derivatives of depth, z,
with respect to time, zt, and location zx and zy:
1� $ 231 4 15� 4 16� � 0 (2-6)
Slikkerveer’s model was then used to calculate the speed of the surface as
2 � 1�8 �92:�; (2-7)
where E is the erosion rate, ρs is the substrate density, φ is the particle mass flux in the direction
of velocity and θ is the angle between the velocity and the normal to the surface. Substituting the
equation for erosion rate, E, and the speed of the surface, c, into Eq. 2-6 results in:
1� $ <�8 ��9�1 4 15� 4 16�� �= � 0 (2-8)
Characteristic strip equations are then obtained to transform this partial differential
equation into a set of ordinary differential equations with initial conditions. An analytic solution
is obtained using a k value of 2. The resulting profiles obtained have much sharper features than
the experimental results. Also, the flat bottom predicted by their solution was not seen in the
experiment. ten Thije Boonkkamp and Jansen ignored second strike effects so the model was
unable to predict the udder shape at increasingly larger depths. Boonkamp suggested that further
study is required to predict how second strike effects alter the feature profile.

12
2.2.1 Abrasive Jet Micromachining of Ductile Materials
Most of the aforementioned studies focused on eroding brittle materials (mostly
borosilicate glass) at normal angles of attack. Getu et al. [4] and Ghobeity et al. [26] developed
surface evolution models that allow the prediction of the size and shape of features such as
micro-channels and micro-holes machined using AJM in ductile erosive polymers such as
PMMA [4, 26]. Getu et al. [4] found that the ductile erosion mechanism in polymers affected the
angle dependency of erosion, leading to feature shapes which were markedly different from
those in brittle materials such as glass. They found that micro-channels machined in PMMA
developed steep sidewalls and broad, flat bottoms, rather than the more V-shaped channels
typical of AJM in glass. A surface evolution model for ductile materials was used to predict the
profile of holes in PMMA.
The equation describing the depth, z, of feature shapes machined in ductile materials
using AJM, as a function of time, t, was expressed as [4]:
1�∗∗ � ?�∗�@∗3�1 4 15∗∗�AB�; (2-9)
where Eq.(2-9) has been nondimensionalized by normalizing the length variables to the nozzle
standoff distance; i.e. z*=z/h, x
*=x/h, The nondimensional time t
*=t/T has been normalized to the
amount of time, T, required to propagate the surface to a depth equal to the nozzle standoff
distance. z*t* and z*x* are the partial derivatives of the nondimensional depth of the surface with
respect to t* and x
*, respectively.
For ductile erosion, which is thought to be the main mechanism of erosion in polymers
[19], an angle dependency, G(θ), must be added to the surface evolution equation. The local
angle of attack, θ , depends on the local slope of the surface, zx, as
; � CD� $ EF22:� G H3HIJ∗K∗' LM
(2-10)
G(θ) expresses the dependence of the erosion rate on the local impact angle θ, between the
component of the velocity vector in the plane of the channel cross section and the local surface

13
tangent (See Fig. 4-2). It can be interpreted as the ratio of the erosion rate at the impact angle
θ divided by the erosion rate at 90°.
Ghobeity et al.[26] experienced a problem in predicting the surface evolution of deeper
holes due to an increase in particle embedding at around an aspect ratio of 0.6. It was thought
that this particle embedding slowed the erosion process.
Getu et al. [1] also investigated the surface evolution of holes and channels machined in
polymers, specifically PMMA, at oblique angles of attack. Since the already known velocity
distribution and mass flux for this particular setup at 90° cannot be inferred at other angles, a first
pass fit was used to determine the erosive efficacy of the jet for masked holes and channels. The
authors saw a significant difference in channel depth between the cases of forward scanning and
backward scanning. The scan direction was considered to be backwards when the horizontal
component of the particle velocity was moving in the same direction as the substrate. This
difference was attributed to particle embedding. Intermediate angles, specifically 55°, showed
the most noticeable difference in erosion with regards to scan direction. The forward scan speed
required more particles to erode the surface to a certain depth than the backwards scanning
process. This difference was attributed to the energy flux distribution difference between the
leading and trailing edges of the jet, which was said to affect particle embedding. Shipway et al.
[27] have suggested that the level of particle embedding is a function of the particle impulse
which is related to the normal component of velocity with respect to the surface. Getu et al. also
confirmed that particle embedding decreased erosion rate in PMMA by machining a hole with
particles initially embedded into the surface. The depth of this hole was shallower in comparison
to a hole with initially no particle embedding.
2.2.2 Second Strike Effects
Slikkerveer et al. [59] attempted to account for second strike effects in order to model the
udder shape evident at a certain depth to width ratio for stationary holes in AJM. It was assumed
that the particles rebounded with 20 to 50% of their original impact velocity. The rebound angle
was also kept as a variable between 0.8 and 1.2 for the purposes of fitting the experimental
results. Slikkerveer modeled second strike effects by introducing another term into the partial
differential equation that resulted in the prediction of an udder-like shape in the centre of the
feature which agreed with experimental observations. The PDE (Eq. 2-8) was then solved using
14
a numerical method (adapted Roe’s algorithm). Slikkerveer noted that the profiles became
increasingly difficult to predict as the features became deeper. This difficulty was suggested to
arise from particle spatial hindering as the feature became narrow at larger depths. It was claimed
that larger particles are not capable of eroding the deepest portion of the feature. The mask was
also thought to impede the particles from eroding the surface close to the boundaries.
Slikkerveer concluded by saying that the model could be improved by further investigating the
angle dependence of erosion for glass.
2.2.3 Particle Mass Flux and Velocity Distribution
Ghobeity et al. [46] modified ten Thije Boonkkamp and Jansen’s a surface evolution
model to include the particle flux and velocity distributions in the abrasive jet. The authors
experimentally verified their model along with a new method of determining the effects of the
mask on the erosive power distribution. Thick masks were used and were found to improve
channel edge definition. A phase Doppler particle analyzer (PDPA) was used to determine the
particle velocity distribution within the jet.
A novel method of obtaining the erosive efficacy was also introduced by Ghobeity et al.
in another study. By obtaining the surface profile of a shallow hole, the angle dependence of
erosion could be ignored in Eq. 2-9 (Section 2.2.3) and the erosive power distribution of the jet
could be inferred from a fitted polynomial of the surface,
�∗�@∗ � �∗�@ ∗�9∗�@ ∗ (2-11)
where V*(x*) and φ*(x*) are the particle velocities and mass flux distributions within the jet
respectively, normalized by their values at the centre of the jet.
The particle velocity distribution from the centre to the periphery of the jet was found to
be linear. A Weibull distribution was the most appropriate fit to particle mass flux, φ(r).
9�F � NOP QRST U� V�WXY Z= ' (2-12)
15
Eq. 2-12 shows that mass flux depends only on the radial location in the jet, r, and not the
angular position in the plane of the nozzle exit. NO represents the total mass flow rate of the jet,
βw is the experimentally determined nozzle focus coefficient and h is the standoff distance. This
flow focus coefficient is found to be unique for each nozzle and particle system.
Ghobeity et al. [46] had some unique results with a k value of 1.43. This value differs
from most quoted k values which lie between 2 and 4. This new k value was confirmed to be
correct for the blasting setup since it improved model predictions. These results were used to
obtain results for masked channels which accounted for mask interference effects (Section 2.2.5).
This “first pass” method greatly improved feature depth predictions from 32% errors down to
only 8% errors up to feature aspect ratios of 1.
2.2.4 Jet Divergence
Since the particle velocity distribution and mass flux are pertinent to the shape of the
eroded features, the characteristics of nozzles which affect these two parameters are briefly
reviewed.
Stevenson and Hutchings [7] investigated how the jet divergence was affected by the
particle velocity and the nozzle length. A novel method was used which measured the rate at
which a thin blue film was removed from a surface. This information was then used to
determine the nozzle focus coefficient, β. A nozzle with a larger β is more focused than one with
a smaller β. The authors found that the particle exit velocity was only slightly affected by the
nozzle length assuming the same pressure drop across the nozzles inlet and outlet. Also, length to
internal nozzle diameter ratios of over 30 were found to have a constant divergence angle. The
authors attributed this to the aerodynamic entry length of each nozzle. If the nozzle length was
well above the flow entry length then the flow focus coefficient would remain unchanged. The
flow focus coefficient was found to depend on particle velocity, but remained relatively constant
above a certain velocity threshold.
Shipway and Hutchings [28] found motivation for their study based on the fact that
erosion rates have appeared different under seemingly similar gas blast erosion tests. The
authors found that the gas plume was unaffected by the nozzle internal roughness whereas the
particle plumes were. Shipway and Hutchings found that the flow focus coefficient was smaller
for rough nozzles than for smooth nozzles, implying that smooth nozzles produce a more focused

16
jet. This is a logical result since the divergence of the particles is caused by interactions with the
nozzle wall. A rougher nozzle will result in larger rebound angles as the particles exit the nozzle.
For this reason, it is important to frequently replace nozzles since the flow of particles against the
nozzle wall will alter surface roughness over time. Shipway and Hutchings conclude that the
nozzle internal roughness plays a major part in the erosive efficacy of a jet. They suggest
quoting the flow focus coefficient while performing gas blast erosion tests so that the tests can be
directly compared.
2.2.5 Mask Edge Effects
Materials which have a high resistance to solid particle erosion are used to protect the
substrate surface and hence provide selective erosion. High carbon steels can be patterned or
strategically placed on the substrate surface in order to machine small holes or channels. The
presence of the mask is known to effect the erosive efficacy, E*(x*), near the mask edges. The
erosive efficacy describes the potential of an abrasive jet to remove material based on the
distribution of particle velocity and mass flux.
ten Thije Boonkamp and Jansen assumed the mask had an effect of linearly decreasing
the erosive efficacy near the channel edges. This resulted in a sharp transition point between the
mask affected area and the non mask affected area that, however, was not seen in experiments.
To better predict mask effects, Ghobeity et al. used a shallow first pass method to determine the
effect of the mask on the erosive efficacy for the channel. In another paper, Ghobeity et al. [29]
presented an analytical solution for modeling how the erosion profile was affected by mask
width and particle size distribution. In their model, if any portion of the particle hit the mask, it
was assumed to not contribute to erosion. The probability of a particle of a specific size
travelling through a certain position within the mask opening was transformed into the mass
probability by using the known density of the particle material. The result was
nondimensionalized with respect to the incoming mass flux at the centre of the jet, and
incorporated into the erosive efficacy expression for shallow features:
�∗�@∗ � N∗�@∗9∗�@∗�∗�@∗� (2-13)

17
where the velocity and particle flux to the mask opening have been normalized to their values at
the centre of the jet, at x=0, i.e. V*=V(x)/V(0) and φ*= φ(x)/ φ(0). Oscillating the abrasive jet in a
direction perpendicular to the scanning direction resulted in a non-dimensional velocity flux and
particle mass flux of one incident to the mask opening. This simplified the erosion equation
making the erosive efficacy through the mask opening, E*(x*), directly equal to M*(x*), an
expression for the mass flux accounting for mask edge effects. The analytical model was
compared to experimental results by substitution into the surface evolution model (Eq. (2-9)). It
was found to be in good agreement with the obtained profiles. A parametric study was also
performed which indicated that particle size distribution could have a major effect on the channel
profile and maximum depth. Using smaller particles could increase the sidewall slope and result
in deeper channels compared to using larger particles.
2.2.6 Cryogenic Erosion of Polymers and Steels
Getu et al. [3] investigated the erosion of PTFE, ABS and PDMS at room temperature
and cryogenic temperatures. The liquid nitrogen entraining into the abrasive jet at a 10 degree
angle was said to produce a surface temperature of about -150 °C.
Figure 2-1 Erosion improvement of PDMS at low temperatures [3]
Figure 2-1 shows how cooling by liquid nitrogen (LN2) can increase the erosion rate,
which only exhibits particle embedding at room temperature. The figure also reveals that PDMS

18
exhibits maximum erosion at normal angles of impact suggesting that LN2 causes a ductile
material to behave in a brittle manner. In all three polymers, the erosion rate at normal incidence
was increased but with PTFE the maximum erosion rate still occurred around 60 ° suggesting a
mix between ductile and brittle erosion still existed. Getu et al. also noted a decrease in the
amount of particle embedding and smoother surfaces under cryogenic blasting conditions.
Cryogenically assisted abrasive jet machining resulted in erosion at normal angles of incidence
in all three polymers, when at room temperature this was impossible.
Getu et al. also published another paper [30] which investigated the temperature
distribution beneath the abrasive jet for a stationary and moving substrate of PDMS using their
CAJM setup. The authors found that the thermal front moved approximately 12 times faster than
the material removal front. Temperature profiles beneath the scanning jet for various scans
speeds were produced using a finite element analysis. The model results and temperature
readings of embedded thermocouples again suggested that PDMS could be machined at
temperatures above the glass transition.
Urbanovich et al. [31] used nitrogen gas flowing within a coiled heat exchanger to
investigate the low-temperature erosion of ball bearing steel at various angles of attack, and
polyamide at 90° with quartz sand (0.2-0.315 mm diameter). The erosion rate of polyamide
increased by a factor of about six when cooled to -120°C. In another study, Urbanovich and
Kramchenkov [32] observed an erosion increase in steel (ShKh15) by a factor of 1.7 when the
blasting temperature was dropped from 293 K to 120 K.
2.2.7 Temperature Dependence of Erosion in Glass
Muju and Pathak [33] cooled a glass slide to liquid nitrogen temperatures to investigate
the possibility of increasing the erosion rate of glass while cooling during particle erosion. It
was found that the erosion rate was increased consistently by approximately 10-12%. The
results are shown in Figure 2-2 which compares hole depth for various standoff distances at
room temperature and liquid nitrogen temperatures.
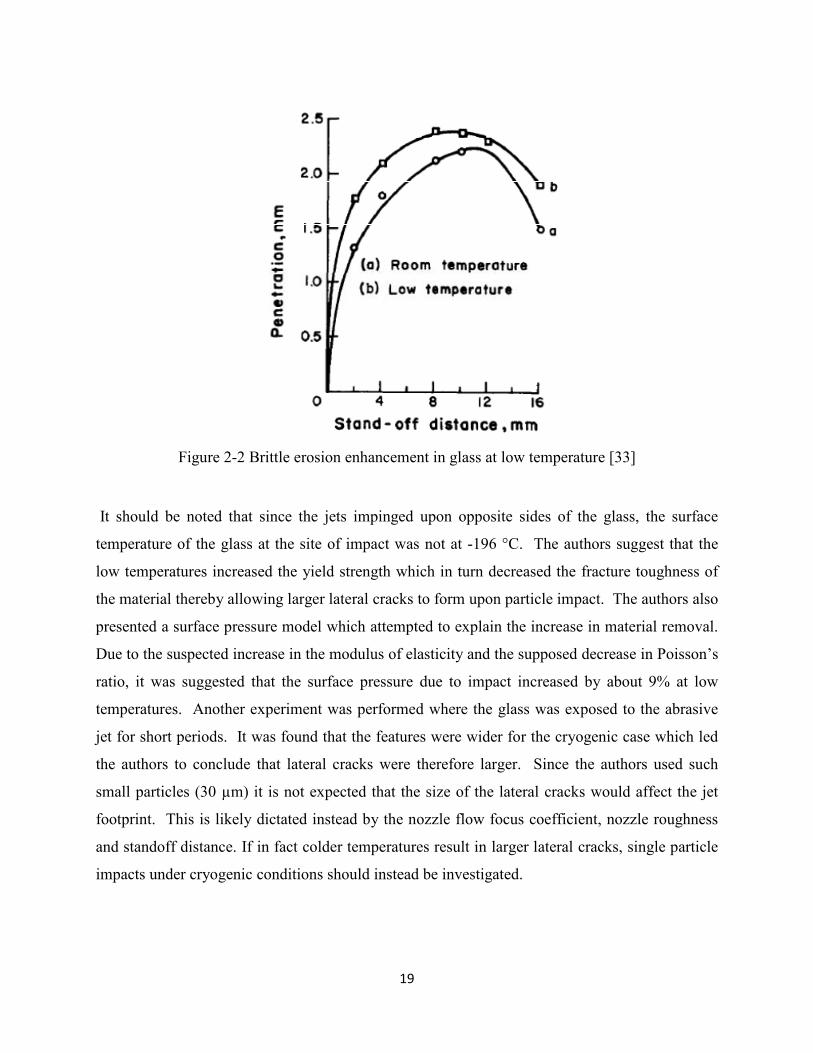
19
Figure 2-2 Brittle erosion enhancement in glass at low temperature [33]
It should be noted that since the jets impinged upon opposite sides of the glass, the surface
temperature of the glass at the site of impact was not at -196 °C. The authors suggest that the
low temperatures increased the yield strength which in turn decreased the fracture toughness of
the material thereby allowing larger lateral cracks to form upon particle impact. The authors also
presented a surface pressure model which attempted to explain the increase in material removal.
Due to the suspected increase in the modulus of elasticity and the supposed decrease in Poisson’s
ratio, it was suggested that the surface pressure due to impact increased by about 9% at low
temperatures. Another experiment was performed where the glass was exposed to the abrasive
jet for short periods. It was found that the features were wider for the cryogenic case which led
the authors to conclude that lateral cracks were therefore larger. Since the authors used such
small particles (30 µm) it is not expected that the size of the lateral cracks would affect the jet
footprint. This is likely dictated instead by the nozzle flow focus coefficient, nozzle roughness
and standoff distance. If in fact colder temperatures result in larger lateral cracks, single particle
impacts under cryogenic conditions should instead be investigated.
20
2.3 Basic Heat Transfer
Knowledge of the heat transfer mechanisms cooling the abrasive jet and the substrate
material will be useful when investigating how the polymer surface temperature evolves during
CAJM, and in the design of the CAJM apparatus (Section 3.1). To gain an understanding of
these mechanisms, some heat transfer theory is briefly reviewed.
2.3.1 Boiling Regimes of Heat Transfer
The phase of the impinging fluid exiting the nozzle will affect the magnitude and
mechanisms of convective heat transfer at the target surface. If the impinging jet is a liquid there
is an opportunity for phase change into a gas, referred to as the boiling regime. When air is used
as the carrier gas, oxygen is the first element to liquefy at approximately -182°C. For example, if
the heat exchanger of Section 3.1.4 cools the air enough to sufficiently liquefy it, large
convective heat transfer coefficients can be obtained. Various boiling regimes exist which
depend on the difference between the surface temperature and the liquid saturation temperature
(Te=Tsurface-Tsaturation). Stated in an order of increasing Te, the boiling regimes are; free
convection, nucleate, transition and film boiling [34]. A maximum heat flux exists in the upper
end of the nucleate boiling regime and is referred to as the critical heat flux (CHF). Nucleate
boiling can be identified by little bubbles forming at the heat transfer surface.
2.3.2 Pool Boiling Heat Transfer
Pool boiling is a method of heat transfer which could be used to cool the substrate or the
abrasive air mixture as it travels through the tubing (Section 3.1.4). Vader et al. [35] combined
submersion pool boiling with jet impingement cooling in order to cool a central processing unit.
Heat flux values of up to 80 W/cm2 (800000 W/m
2) were reported with a submerged sub-cooled
impinging liquid nitrogen jet. Assuming a temperature difference between the substrate and the
jet of 220°C, a convective heat transfer coefficient of about 3600 W/m2K is obtained.
Submersing the substrate provides a modest improvement in heat flux but also requires an
enclosure to contain the liquid which would be an added complication to the cooling system.
Pool boiling alone results in modest heat flux values compared to liquid jet impingement. Vader
states that typical values of pool boiling heat flux in liquid nitrogen are between 15 and 30
W/cm2 although critical heat flux values have been reported to be around 19 W/cm
2. Drach et al.
21
[36] use the Kutateladze critical heat flux correlation to obtain similar critical heat flux values for
pool boiling in liquid nitrogen. Using this correlation along with the parameters for liquid
nitrogen, a critical heat flux of 17 W/cm2 is obtained.
A drawback to pool boiling is that variable heat transfer rates cannot be obtained since
the only variable in pool boiling is the refrigerant. With jet impingement, many factors can
change the heat flux including nozzle dimensions, liquid velocity and nozzle standoff distance.
Pool boiling was found to produce sufficient heat flux values in order to cool the abrasive jet
mentioned in Section 3.1.4 without resulting in the need for inconveniently large heat
exchangers.
Kida et al. [37] study pool boiling heat transfer with liquid nitrogen to obtain heat flux
results for nucleate boiling. The authors state that heat flux versus Te values are difficult to
match to other experiments since the material surface plays such a critical role during nucleate
boiling. Due to this fact, it is difficult to predict exactly what length of heat exchanger would be
required to obtain the desired abrasive jet temperatures.
2.3.3 Flow Oscillations in Internal Cryogenic Flows
In order to conserve liquid nitrogen, equipment which delivers the minimal amount
required to cool the substrate surface had been proposed. Therefore the flow of cryogenic fluid at
a small scale was of interest. While studying the flow of liquid nitrogen in micro-channels,
Zhang et al. [38] found a temperature fluctuation with a frequency between 4 and 5 Hz. This
frequency corresponded to the same frequency of bubble formation in the flow. Hetsroni et al.
[39] also studied the pressure drop fluctuations with low amplitudes and high frequencies
ranging from 3.6 to 6.6 Hz. Wu and Cheng [40] observed lower frequency oscillations that were
said to be due to the fact that two phase and single phase flow alternate once the onset of
nucleate boiling occurs. Qi et al. also found oscillations but with a much larger period of about
60 s [41]. This oscillation is thought to be caused by a vapour bubble forming before the outlet
valve in the experimental setup. Sudden expansions in the flow line can therefore result in
flashing and undesirable two phase flow. These oscillations must be minimized in order to obtain
consistent cooling of the substrate surface.
Qi et al. [41] also mention a flow blocking phenomenon that occurs in a particular case of
nucleate boiling. It is thought that the discharge rate of the vapour patch in the outlet valve is

22
less than the flow rate through the micro-tube. Qi [41] states that if the generated vapour rate is
larger than the discharge rate of the vapour patch, the onset of nucleate boiling block will be
observed. A critical mass flow is suggested which predicts the onset of flow instability. It is
thought that if the mass flux is below this critical value, the vapour bubbles can be discharged
freely. This flow blocking phenomenon is proposed to be responsible for the failure of the
manifold design of Section 3.1.2 to produce liquid nitrogen at the four tube exits.
2.3.4 Impinging Cryogenic Jets and their Nusselt Number
The properties along the axis of the jet are critical when selecting jet impingement design
parameters. Chorowski [42] used the jet temperature, measured with a T-type thermocouple, and
a vane anemometer to determine the jet velocity in order to estimate heat transfer intensity for a
cryogenic flow for applications in cryosurgery. The cone angle of the cryogenic jet was found to
be constant at 13° independent of the various orifice sizes. Chorowski also experienced a large
increase in jet temperature from the nozzle exit to about 10 cm. Past this point, the jet
temperature remained constant. The large temperature increase in the region close to the nozzle
exit was attributed to a large amount of air mixing with the jet. This fact demonstrates that jet
temperature can also be controlled with the nozzle stand-off distance.
The Nusselt number is a dimensionless parameter in convective flow. It is used to
describe the ratio of convective heat transfer to conductive heat transfer within the fluid.
[\ � T]^# (2-14)
where L is a characteristic length, hc is the heat transfer coefficient and k is the thermal
conductivity of the fluid under study.
Huang and El Genk [43] experimentally determined an equation for the average Nusselt
number for an air jet cooling a uniformly heated flat plate. This Nusselt number was based on the
radial coordinates of the impinging jet at the substrate surface. The authors found that as long as
the dimensionless standoff distance H (standoff distance divided by nozzle diameter, D) was
greater than 2.0, the maximum Nusselt number occurred at the stagnation point. For values
below 2.0 the maximum Nusselt number was seen to occur at an r/D of 1.8-2.0. The maximum
Nusselt at the stagnation point was seen to occur at an H of 4.7. This Numax was found to be

23
highly dependent on the dimensionless radial coordinate in the jet. In other words, when the
stagnation heat transfer is maximized, the heat transfer in the periphery of the jet is not
necessarily at a maximum.
The Nusselt number can also be calculated based on correlations which are dependent
upon Prandtl number, Reynolds number, jet diameter and stand-off distance. Two such
correlations are the Martin correlation [44] for a gas jet and the Dittus Boelter correlation for
fully developed cryogenic flow [34].

24
3 Design of Cryogenic Abrasive Jet Micromachining Apparatus
A new CAJM apparatus was used to measure the solid particle erosion of PTFE, PDMS
and high carbon steel using 25 µm alumina particles at various angles of attack and at
temperatures between 17°C and -182°C. This chapter describes various prototype CAJM devices
that were designed and tested. In the final design, instead of using a separate cryogenic jet as in
Getu et al. [3], a heat exchanger was used to cool the pressurized abrasive air jet. This provided
better temperature control than the apparatus used by Getu et al. [3], and ensured that the target
surface was cooled symmetrically. This new device also enabled longer blasting periods.
3.1 Prototypes
Multiple prototypes were built and tested in order to achieve a blasting apparatus which
was capable of machining material at temperatures between room temperature and -196°C.
Initial prototypes focused on entraining a jet of liquid nitrogen with the abrasive particle after the
nozzle exit.
3.1.1 Surface Flooding with Single Jet Entrainment
The previous liquid nitrogen setup created by Getu et al. [3] used a pressure pot, which
contained a 500 mL Dewar full of liquid nitrogen pressurized by warm air at approximately 25
psig. Once pressurized, the liquid nitrogen flowed through an on/off plastic ball valve and out a
1.5 mm nozzle which was directed at the substrate surface. Getu et al used this apparatus to
obtain initial erosion results on PDMS at surface temperatures of approximately -150°C. This
equipment worked well for proof-of-concept, but it could not blast for extended amounts of time
and the flow rate of liquid nitrogen was not controllable.
In the first prototype of the present work, a nozzle holder was designed which allowed
the liquid nitrogen jet to be repeatably positioned with respect to the abrasive jet at various
angles and standoff distances. This setup also allowed an extra liquid nitrogen jet to be
positioned to either pre-cool the substrate surface or keep the abrasive jet cool before it hits the
surface. Figure 3-1 shows the design of this nozzle positioning system. This apparatus includes a
self pressurizing vessel which is kept at a constant pressure depending on the “pop” pressure of
the relief valve. A pop valve rated at 35 psi was typically used. The liquid nitrogen is forced out
of the vessel and through a ¼” stainless steel tube which contains a precise metering valve used
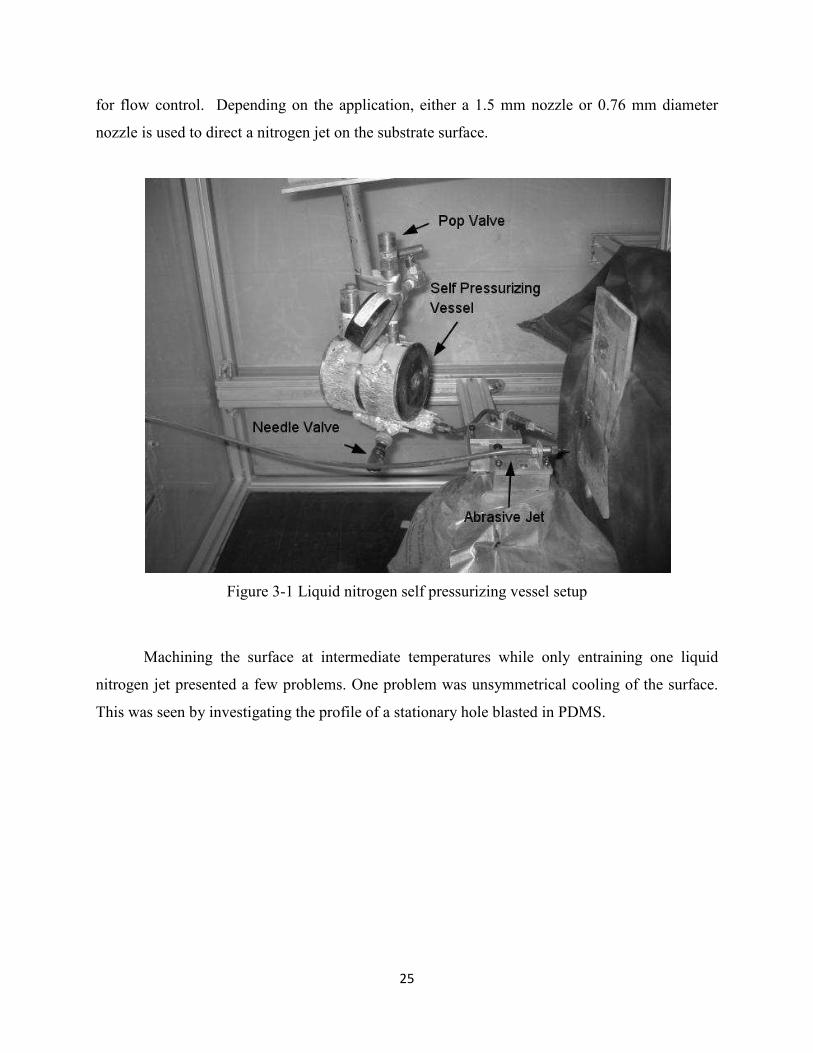
25
for flow control. Depending on the application, either a 1.5 mm nozzle or 0.76 mm diameter
nozzle is used to direct a nitrogen jet on the substrate surface.
Figure 3-1 Liquid nitrogen self pressurizing vessel setup
Machining the surface at intermediate temperatures while only entraining one liquid
nitrogen jet presented a few problems. One problem was unsymmetrical cooling of the surface.
This was seen by investigating the profile of a stationary hole blasted in PDMS.
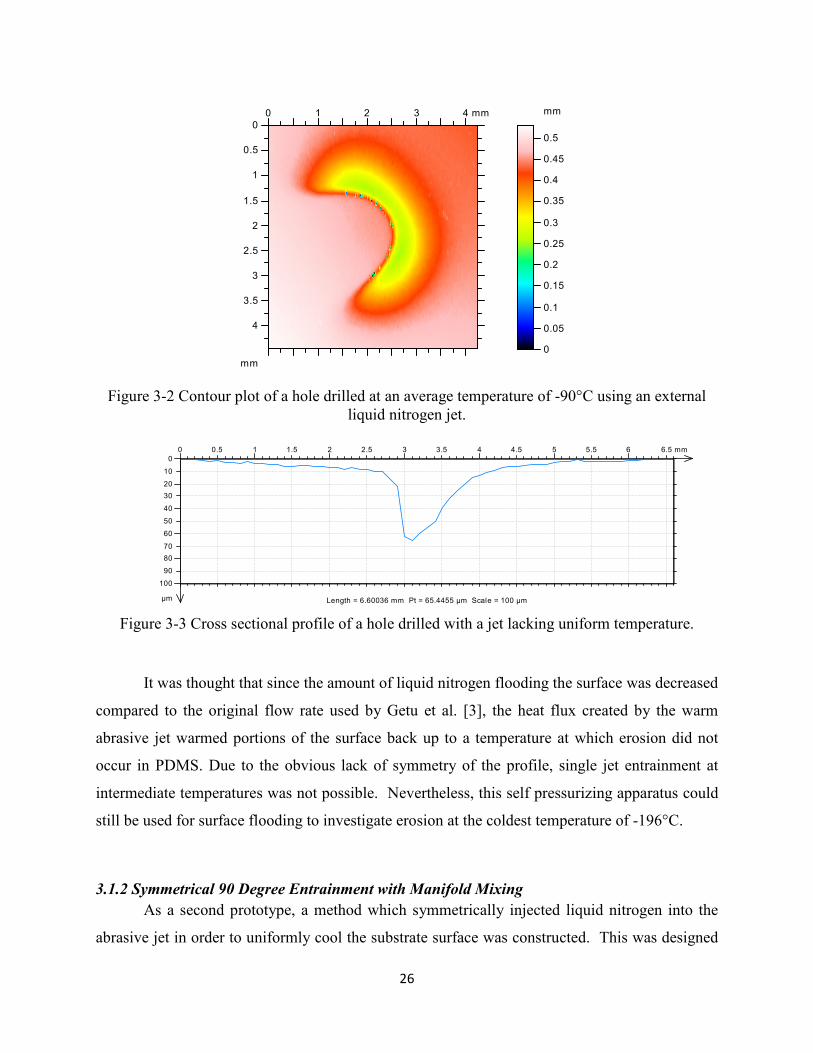
26
Figure 3-2 Contour plot of a hole drilled at an average temperature of -90°C using an external
liquid nitrogen jet.
Figure 3-3 Cross sectional profile of a hole drilled with a jet lacking uniform temperature.
It was thought that since the amount of liquid nitrogen flooding the surface was decreased
compared to the original flow rate used by Getu et al. [3], the heat flux created by the warm
abrasive jet warmed portions of the surface back up to a temperature at which erosion did not
occur in PDMS. Due to the obvious lack of symmetry of the profile, single jet entrainment at
intermediate temperatures was not possible. Nevertheless, this self pressurizing apparatus could
still be used for surface flooding to investigate erosion at the coldest temperature of -196°C.
3.1.2 Symmetrical 90 Degree Entrainment with Manifold Mixing
As a second prototype, a method which symmetrically injected liquid nitrogen into the
abrasive jet in order to uniformly cool the substrate surface was constructed. This was designed
mm
0
0.05
0.1
0.15
0.2
0.25
0.3
0.35
0.4
0.45
0.5
0 1 2 3 4 mm
mm
0
0.5
1
1.5
2
2.5
3
3.5
4
0 0.5 1 1.5 2 2.5 3 3.5 4 4.5 5 5.5 6 6.5 mm
µm
0
10
20
30
40
50
60
70
80
90
100
Length = 6.60036 mm Pt = 65.4455 µm Scale = 100 µm
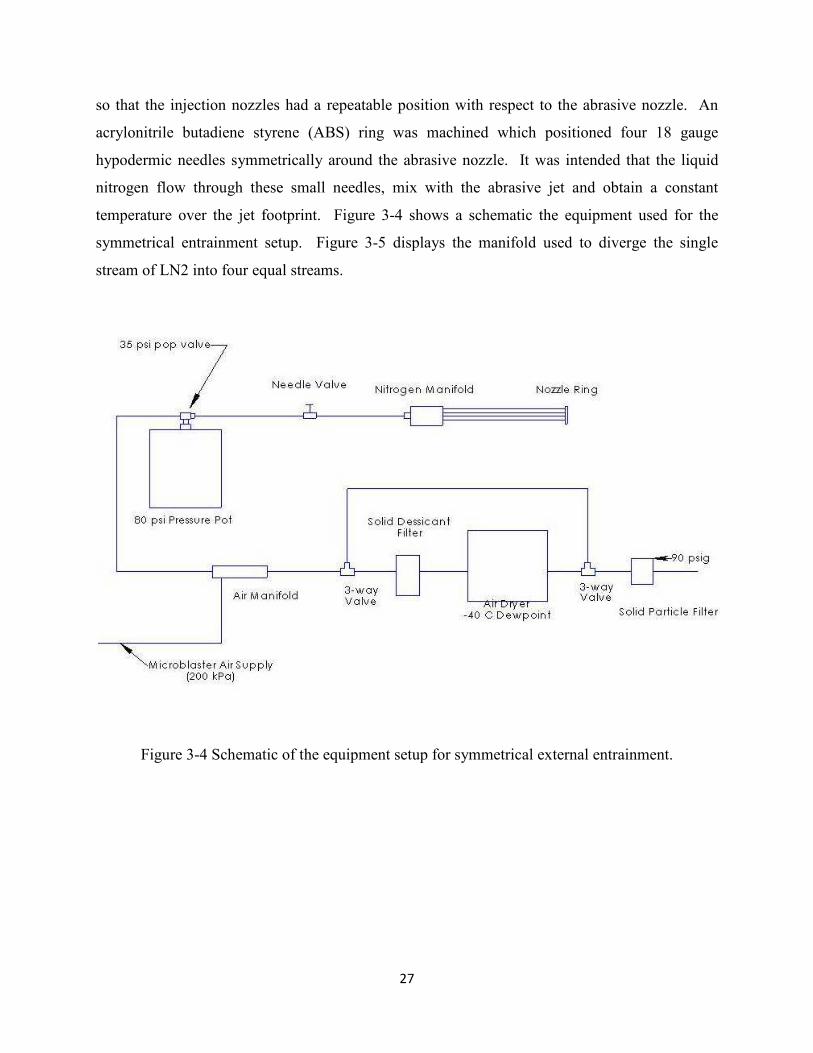
27
so that the injection nozzles had a repeatable position with respect to the abrasive nozzle. An
acrylonitrile butadiene styrene (ABS) ring was machined which positioned four 18 gauge
hypodermic needles symmetrically around the abrasive nozzle. It was intended that the liquid
nitrogen flow through these small needles, mix with the abrasive jet and obtain a constant
temperature over the jet footprint. Figure 3-4 shows a schematic the equipment used for the
symmetrical entrainment setup. Figure 3-5 displays the manifold used to diverge the single
stream of LN2 into four equal streams.
Figure 3-4 Schematic of the equipment setup for symmetrical external entrainment.
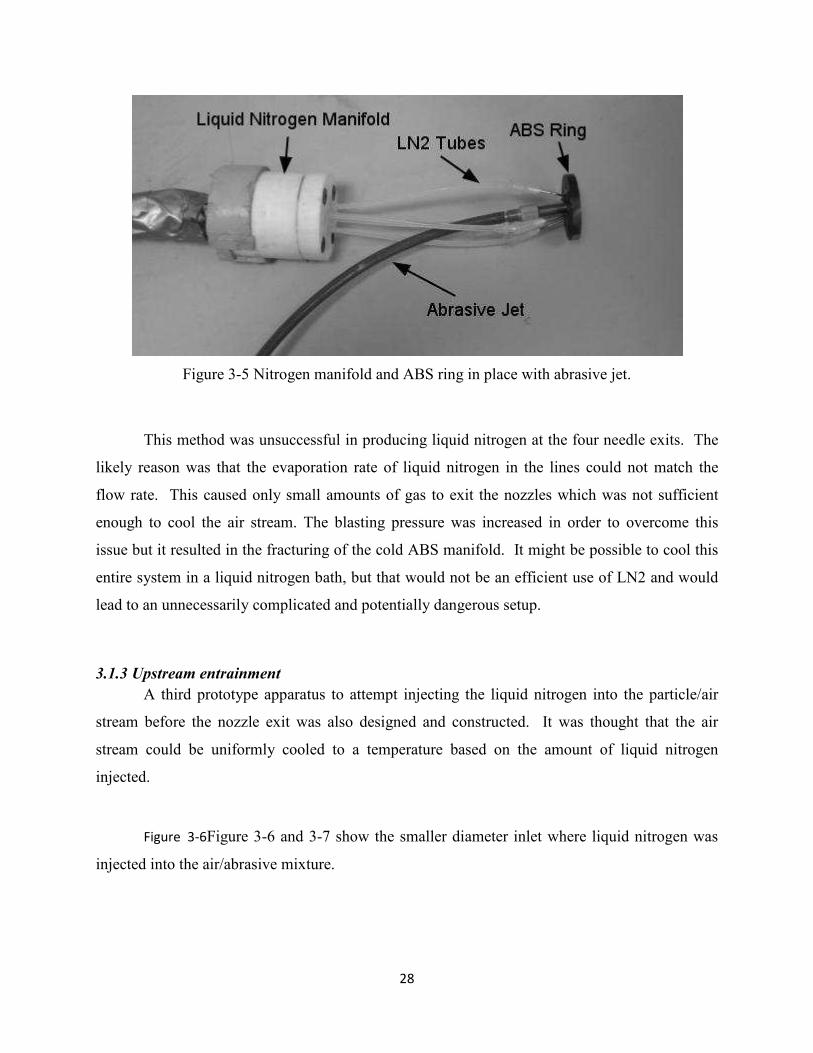
28
Figure 3-5 Nitrogen manifold and ABS ring in place with abrasive jet.
This method was unsuccessful in producing liquid nitrogen at the four needle exits. The
likely reason was that the evaporation rate of liquid nitrogen in the lines could not match the
flow rate. This caused only small amounts of gas to exit the nozzles which was not sufficient
enough to cool the air stream. The blasting pressure was increased in order to overcome this
issue but it resulted in the fracturing of the cold ABS manifold. It might be possible to cool this
entire system in a liquid nitrogen bath, but that would not be an efficient use of LN2 and would
lead to an unnecessarily complicated and potentially dangerous setup.
3.1.3 Upstream entrainment
A third prototype apparatus to attempt injecting the liquid nitrogen into the particle/air
stream before the nozzle exit was also designed and constructed. It was thought that the air
stream could be uniformly cooled to a temperature based on the amount of liquid nitrogen
injected.
Figure 3-6Figure 3-6 and 3-7 show the smaller diameter inlet where liquid nitrogen was
injected into the air/abrasive mixture.

29
Figure 3-6 Schematic of the apparatus machined to allow upstream injection of LN2.
Figure 3-7 Upstream injection equipment in place.
This method of mixing the liquid nitrogen with the particle laden air stream resulted in an
oscillatory flow due to the phase change of liquid nitrogen when it was initially introduced into
the warm air stream. Therefore it was impossible to keep the jet at a consistent temperature over
a period of time.
Tungsten Carbide
1.5 mm Nozzle
LN2 pressurized
injection
Air/particle mixture
from Accuflo
Cooled abrasive
jet

30
3.1.4 Indirect Heat Exchanger/Cryogenic Abrasive Jet Machining Setup
The final apparatus which solved all of the aforementioned problems involved the use of
an indirect heat exchanger to cool the air and abrasive upstream of the nozzle exit. This final
experimental setup was used in almost all of the experiments in this thesis to study the
temperature dependence of erosion in PDMS, PTFE and high carbon steel. The CAJM apparatus
consisted of an AF10 AccuFlo Micro-Abrasive Blaster (Comco Inc., Burbank, CA) that fed a
mixture of abrasive media and pressurized air through an indirect heat exchanger of various
lengths; i.e. 50, 64 and 80 cm long 6.4 mm outer diameter copper tubing immersed in liquid
nitrogen (Figure 3-8). The resulting abrasive jet temperature was a function of the tubing length
and the air pressure which affected the flow rate. This apparatus was similar to the low
temperature gas blast setup of Urbanovich et al. [31], except that air was used as the carrier gas
rather than nitrogen.
The target sample was clamped to the computer-controlled motorized stage to minimize
deformation due to thermal shrinkage. A holding device was specially designed and fabricated
(Figure 3-9) in order to consistently clamp the samples to the computer controlled stage at
various angles of attack. The nozzle was a round high efficiency tungsten carbide nozzle
(Comco Inc., Burbank, CA) with an inner diameter of 1.5 mm that could be rotated to produce
various angles of attack.
Figure 3-8 Schematic of final CAJM setup.
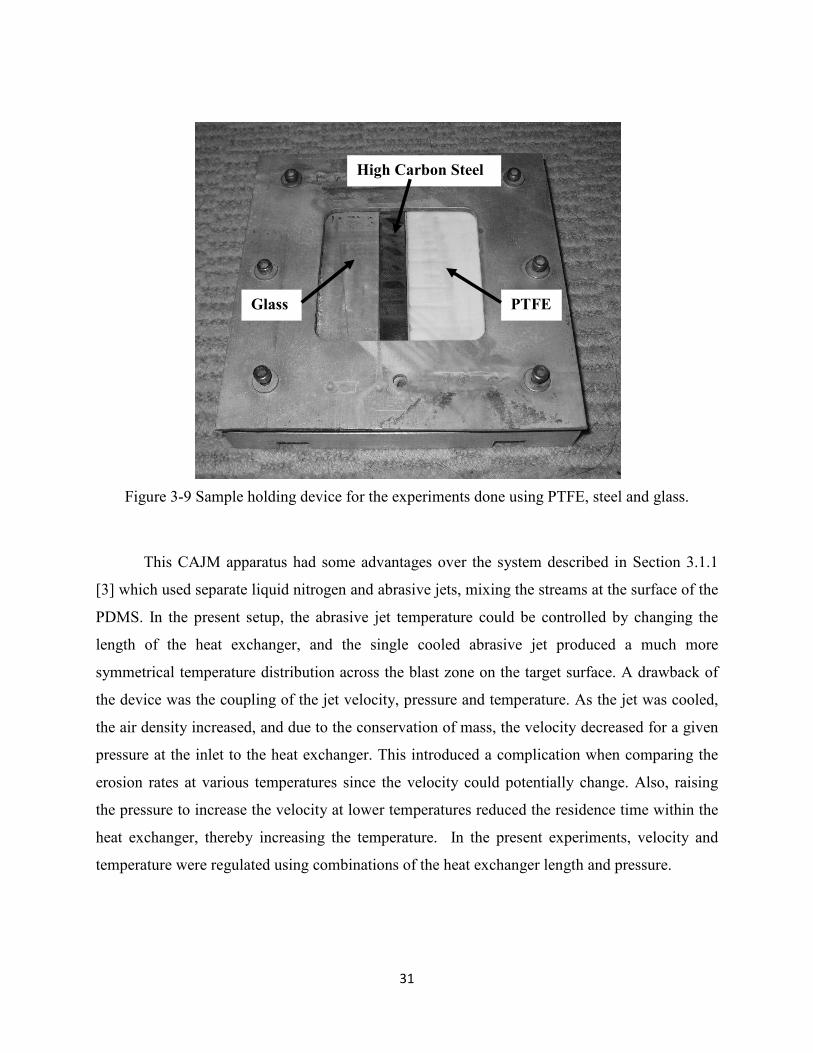
31
Figure 3-9 Sample holding device for the experiments done using PTFE, steel and glass.
This CAJM apparatus had some advantages over the system described in Section 3.1.1
[3] which used separate liquid nitrogen and abrasive jets, mixing the streams at the surface of the
PDMS. In the present setup, the abrasive jet temperature could be controlled by changing the
length of the heat exchanger, and the single cooled abrasive jet produced a much more
symmetrical temperature distribution across the blast zone on the target surface. A drawback of
the device was the coupling of the jet velocity, pressure and temperature. As the jet was cooled,
the air density increased, and due to the conservation of mass, the velocity decreased for a given
pressure at the inlet to the heat exchanger. This introduced a complication when comparing the
erosion rates at various temperatures since the velocity could potentially change. Also, raising
the pressure to increase the velocity at lower temperatures reduced the residence time within the
heat exchanger, thereby increasing the temperature. In the present experiments, velocity and
temperature were regulated using combinations of the heat exchanger length and pressure.
PTFE
High Carbon Steel
Glass

32
4 Cryogenic Abrasive Jet Machining of Polydimethylsiloxane at Different
Temperatures
The elastomer polydimethylsiloxane (PDMS) is of particular interest in microfluidics
because it is chemically resistant, biocompatible, and relatively easy to mold and seal [5]. It has
been used for many novel components in a microfluidic chip such as valves [45], mixers and
pumps. Previous research found that it was impossible to machine cured PDMS using AJM at
room temperature with 25 µm aluminum oxide particles impacting at approximately 140 m/s due
to its ability to absorb the energy of the impacting particles [3]. Getu et al. demonstrated that the
polymer could be machined if cooled to approximately -150°C.
This chapter investigates how the angle dependency, magnitude and mechanisms of
erosion change with temperature in the range of 17 to -178°C. An existing surface evolution
model was used to predict masked and unmasked channels in the PDMS.
4.0.1 Preliminary Evidence for the Ability to Machine Polymers at Temperatures Above Glass
Transition
The glass transition of PDMS is quoted in the literature as being -120 ºC[3]. It had been
previously suspected that PDMS could only be machined below the glass transition. Using the
self pressurizing setup of Section 3.1.1, a channel was machined under variable temperature. One
of the unwanted characteristics of this apparatus was that at intermediate valve positions, it was
possible for foreign particles to partially clog the needle valve and slow down the flow of liquid
nitrogen. This phenomena was used to machine a channel at varying temperatures along its
length. A T-type thermocouple was used to confirm the temperature at the beginning and the end
of the channel by placing it in the two jets for approximately 15 seconds.
Figure 4-1 Lengthwise profile of the variable temperature channel.
0 2.5 5 7.5 10 12.5 15 17.5 20 22.5 25 mm
µm
0
25
50
75
100
125
150
175
200
Length = 26.0457 mm Pt = 129.745 µm Scale = 200 µm
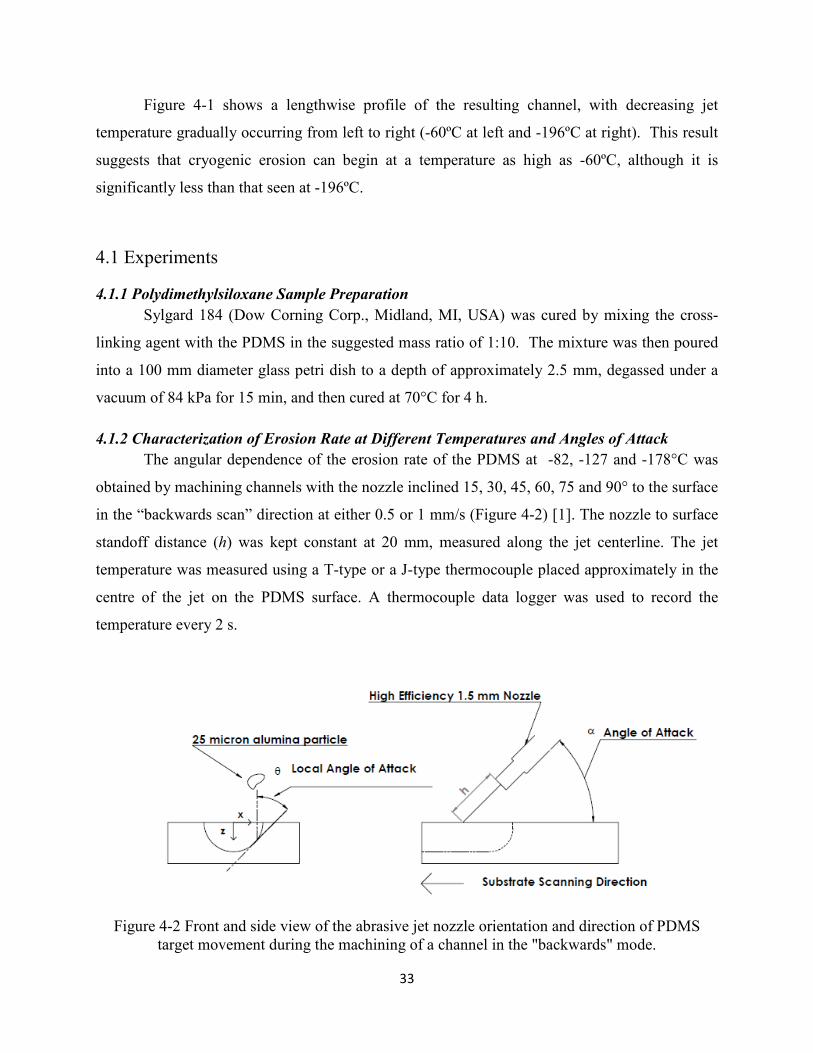
33
Figure 4-1 shows a lengthwise profile of the resulting channel, with decreasing jet
temperature gradually occurring from left to right (-60ºC at left and -196ºC at right). This result
suggests that cryogenic erosion can begin at a temperature as high as -60ºC, although it is
significantly less than that seen at -196ºC.
4.1 Experiments
4.1.1 Polydimethylsiloxane Sample Preparation
Sylgard 184 (Dow Corning Corp., Midland, MI, USA) was cured by mixing the cross-
linking agent with the PDMS in the suggested mass ratio of 1:10. The mixture was then poured
into a 100 mm diameter glass petri dish to a depth of approximately 2.5 mm, degassed under a
vacuum of 84 kPa for 15 min, and then cured at 70°C for 4 h.
4.1.2 Characterization of Erosion Rate at Different Temperatures and Angles of Attack
The angular dependence of the erosion rate of the PDMS at -82, -127 and -178°C was
obtained by machining channels with the nozzle inclined 15, 30, 45, 60, 75 and 90° to the surface
in the “backwards scan” direction at either 0.5 or 1 mm/s (Figure 4-2) [1]. The nozzle to surface
standoff distance (h) was kept constant at 20 mm, measured along the jet centerline. The jet
temperature was measured using a T-type or a J-type thermocouple placed approximately in the
centre of the jet on the PDMS surface. A thermocouple data logger was used to record the
temperature every 2 s.
Figure 4-2 Front and side view of the abrasive jet nozzle orientation and direction of PDMS
target movement during the machining of a channel in the "backwards" mode.
34
The microblaster was operated continuously, for reasons explained below, at each of the
three temperatures while 25 mm long channels were machined in the PDMS and glass at each of
the six angles of attack using 25 µm nominal diameter aluminum oxide particles. This increased
the consistency of the blasting conditions amongst the channels at the different angles.
Furthermore, each of these experiments was repeated three times. Blasting pressures were
between 260 kPa and 400 kPa, depending on the desired jet temperature and heat exchanger
length. Measuring the erosion rate using channels offered an advantage over the more traditional
approach of drilling a hole in a stationary target. The uniformity of the channel cross-section
along its length provided a good means of verifying the constancy of the abrasive media mass
flow rate and velocity during the experiment.
The normalized erosion rate G(α), is the ratio of the volumetric erosion rate (volume of
material removed per mass of launched particles), at a given angle of attack, E(α) to its value at
normal incidence, E(90°), i.e.
B�_ � `�∝`���° (4-1)
The particle velocity depended only on the jet temperature and pressure, and was
therefore constant for the duration of each experiment. For experiments performed at a given
angle of attack, the scan speed and mass flow rate could be assumed to be the same for both the
channels in the PDMS and the glass, since they were machined one directly after the other.
However, as mentioned previously, the mass flow rate, m& , fluctuated up to 20% between
experiments at the different angles. Under these conditions, the erosion rate of a material at any
α is directly proportional to the centerline depth of the channel z(α), multiplied by the mass flow
rate, i.e. ( ) ( )E mzα α∝ & . In other words, since the present erosion rate experiments at a given
angle of attack were performed at different mass flow rates mα& ,than that at normal incidence,
90m& , then
35
Gb�α � mO ezb�αmO �� mO emO �� zb�90° andGm�α � mO ezm�αmO �� mO emO �� zm�90°
(4-2)
where the subscripts ‘p’ and ‘g’ refer to PDMS and glass target specimens, respectively.
Combining these two equations yields,
Gb�α � zb�αzb�90° zm�90°zm�∝ Gm�α (4-3)
It has also been established that the erosion rate in glass, Eg, is proportional to the component of
velocity, v, perpendicular to the surface raised to a velocity exponent (e.g., [46]), i.e.
Em � C�vsin ∝0 (4-4)
where C is an empirically determined erosion constant that depends on the erodent particle size
and shape, and on the target material. Therefore, for the present case of constant particle
velocity, Gg(α) can be expressed as
Gm�∝ � C�vsin ∝0Cv0 � �sin ∝0 (4-5)
Combining Eqs (4-3) and (4-5) yields an expression for Gp(α), based on measurements of
channel depths in glass and PDMS machined at a constant particle velocity, provided that the
same mass flow rate and nozzle scan speed are used to machine the glass and PDMS at a given
angle of attack:
Gb�α �zb�α zm�αo
zb�90° zm�90°o �sin ∝0
(4-6)

36
A key point is that the depth ratios are only a function of temperature; i.e. they are
independent of the jet velocity and mass flux. Therefore, the ratio of PDMS and glass channel
depths at 90° measured in one experiment can be used to calculate G(α) at the other angles,
where the term sin(α)k accounts for the angle dependency of erosion in borosilicate glass [25].
For the same particles and glass substrates used in the present study, k=1.43 [46]. This method is
also useful because mass flow rates do not necessarily have to be the same at the six angles of
attack studied.
An optical profilometer (ST400, Nanovea, Irvine, CA) was used to measure the size and
shape of the channel cross-sections. Channel depths were kept below 250 µm to ensure that the
local slope of the substrate remained sufficiently small to not affect the erosion rate. The angular
spread of the particle velocities within the jet were also considered to produce a negligible
variation in the local impact angle. The channel depths were measured for the various angles of
attack, collected from four locations every 5 mm along the channel length. The average of these
four depths was used to calculate G(α) in Eq. 4-6.
The standard deviation of channel depths was calculated for one channel at each angle
and temperature as a separate study. The channels had a relatively uniform depth, with a standard
deviation less than 10% of the mean depth. As will be discussed in Section 4.3.2, the dependence
of the channel depth on the impact angle varied with the temperature, displaying a more brittle
characteristic (maximum material removal at 30-60°) at -178°C.
The mass flow rate could vary by as much as 20% between experiments due to
uncontrollable variations in the powder flow within the pressurized reservoir [47]. Since the
dependence of the erosion rate in borosilicate glass on the velocity and angle of attack was
known from previous work [25], glass channels machined directly after each PDMS channel (i.e.
at the same mass flow rate) were used in order to account for potential mass flow fluctuations.
As will be discussed in Section 4.3.1, the glass channel depths at 90° could also be used to
calculate the particle velocity at the jet centre for each temperature. The validity of this
technique, however, relied on establishing that the erosion rate for the borosilicate glass samples
was only a very weak function of the temperature. This was investigated by machining a
channel while flooding the glass with a separate liquid nitrogen jet at approximately -196°C and
then continuing to machine at room temperature with the cooling jet turned off (scan speed 1.5
mm/s, particle mass flow rate 140 mg/s). Although it has been claimed that cryogenic

37
temperatures increase erosion in glass [33], the present results suggest only a negligible decrease
in the erosion rate at cryogenic temperatures. The average of three repetitions of the room
temperature channel depth was 84 µm with a standard deviation of 3.9 µm (9 measurements, 3
from each of 3 channels). The average depth of the corresponding cryogenic channels was 77 µm
with a standard deviation of 4.5 µm (9 measurements). This 8% difference, although statistically
significant (t-test, 95% confidence), was relatively small, and was therefore assumed negligible
for the purposes of inferring particle velocity at the different temperatures.
4.1.3 Measurement of Mass Flow Rate
As mentioned in Section 4.1.2, fluctuations in the mass flow rate are taken into account in
the calculation of G(α) by simultaneous machining of shallow channels in both glass and PDMS
under the same conditions. Therefore, Eq. (4-6) does not require knowledge of the particle mass
flow rate. However, measures of mass flow rate were required in order to determine the
volumetric erosion rate in PDMS at 90°, E(90°), the volumetric erosion per unit kinetic energy
(Section 4.3.8), and to extract the particle velocity from the glass channel machined at 90° at the
three temperatures (Section 4.3.2). The particle mass flow rates were measured by catching the
particles exiting the nozzle in a 38 cm long 2.54 cm diameter clear plastic tube, over a one
minute period. The measurement was complicated by the tendency for moisture in the room
temperature air in the tube to condense, thus introducing errors in the gravimetric measurements.
To avoid this, a diverging section of pipe, 18 cm long and approximately 100 mm in diameter,
with filter paper at the end was attached to the tube to slow the air and particles, and water was
used to wash the particles from the tube and pipe. The water was then boiled off and the
aluminum oxide particles were weighed using a digital mass balance (±0.05 mg).
4.2 Surface Evolution Modelling
As defined in Section 2.2, the equation describing the depth, z, of feature shapes
machined in ductile materials using AJM, as a function of time, t, can be expressed as [4]:
1�∗∗ � ?�∗�@∗3�1 4 15∗∗�AB�; (4-7)

38
G(θ) expresses the dependence of the erosion rate on the local impact angle, θ, as defined in Fig.
2. It can be interpreted as the ratio of the erosion rate at the impact angle θ divided by the
erosion rate at 90°. For erosion testing using gas blast type erosion rigs, Oka suggested [20] the
following relation
B�_ � ��� _�! "#� $ �� _#� $ 1 &�' (4-8)
where α is the global impact angle between the incident jet and an initially flat substrate, and n1,
n2 and k2 are curve fitting variables [20]. Equation (4-8) accounts for both the cutting action of
erosion and material removal by repeated deformation. As has been previously done [4, 1], Eq.
(4-8) was used to describe the dependence of the local erosion rate on the local angle of attack in
the plane of the channel cross section, θ. For a brittle material such as glass, G(α)=(sin(α))k,
where k is the velocity exponent of Eq. (2-11). It should be noted that Eq. (4-8) is used for curve
fitting purposes only, and that the physical significance of the constants n1 and k2 cannot be
interpreted as described by Oka et al. for a variety of metallic materials [20].
Equation (4-7) was solved to predict the shapes and depths of the channels machined in
PDMS at the various temperatures. To assess the accuracy of the surface evolution model,
unmasked channels were machined at 90° using 1, 3, 5 and 7 nozzle passes at mass flow rates
ranging from 85 to 220 mg/s and scan speeds of either 1 or 0.5 mm/s. As was done in the erosion
rate experiments of Section 4.3.2, the entire area of each channel was scanned using the optical
profilometer to determine the uniformity of the channel cross-section. As a separate study, three
profiles were then taken, approximately 2 mm apart, for each set of nozzle passes. The average
channel depth was quite uniform with an average coefficient of variation of 0.05 (standard
deviation/average). Masked channels were also machined in the PDMS. Instead of using the
nozzle standoff distance to normalize the profile dimensions, the spacing between the mask
edges was used.
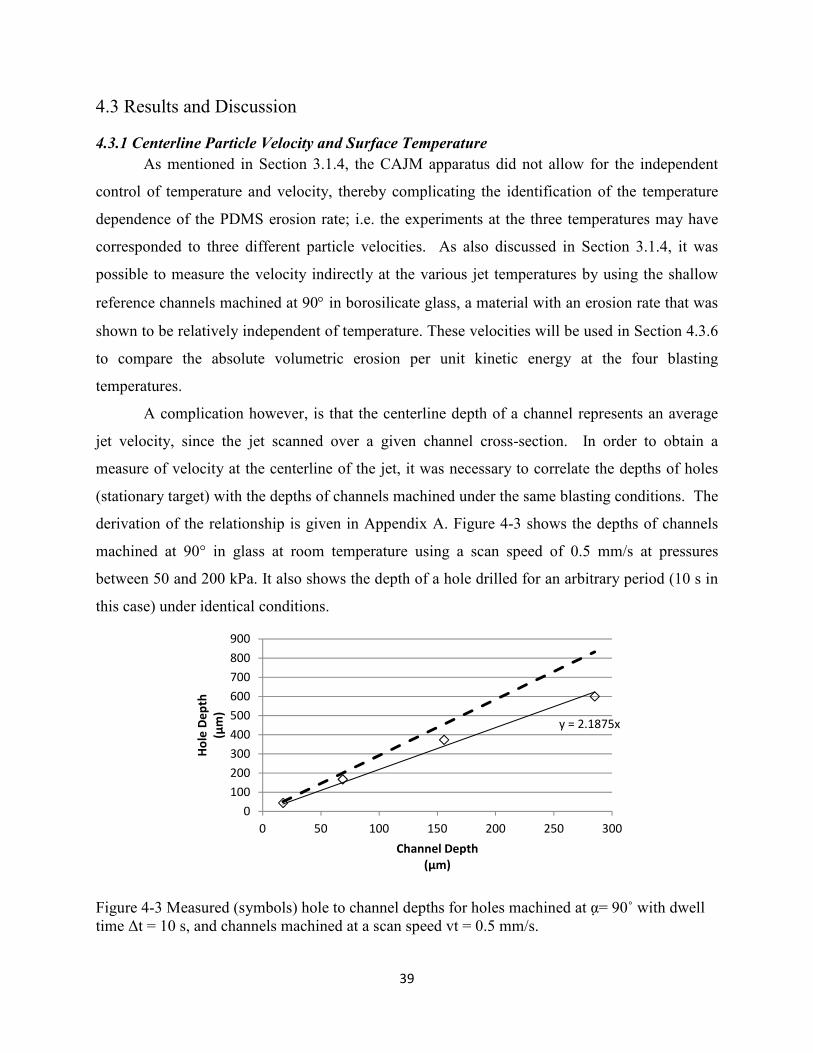
39
4.3 Results and Discussion
4.3.1 Centerline Particle Velocity and Surface Temperature
As mentioned in Section 3.1.4, the CAJM apparatus did not allow for the independent
control of temperature and velocity, thereby complicating the identification of the temperature
dependence of the PDMS erosion rate; i.e. the experiments at the three temperatures may have
corresponded to three different particle velocities. As also discussed in Section 3.1.4, it was
possible to measure the velocity indirectly at the various jet temperatures by using the shallow
reference channels machined at 90° in borosilicate glass, a material with an erosion rate that was
shown to be relatively independent of temperature. These velocities will be used in Section 4.3.6
to compare the absolute volumetric erosion per unit kinetic energy at the four blasting
temperatures.
A complication however, is that the centerline depth of a channel represents an average
jet velocity, since the jet scanned over a given channel cross-section. In order to obtain a
measure of velocity at the centerline of the jet, it was necessary to correlate the depths of holes
(stationary target) with the depths of channels machined under the same blasting conditions. The
derivation of the relationship is given in Appendix A. Figure 4-3 shows the depths of channels
machined at 90° in glass at room temperature using a scan speed of 0.5 mm/s at pressures
between 50 and 200 kPa. It also shows the depth of a hole drilled for an arbitrary period (10 s in
this case) under identical conditions.
Figure 4-3 Measured (symbols) hole to channel depths for holes machined at α= 90˚ with dwell
time ∆t = 10 s, and channels machined at a scan speed vt = 0.5 mm/s.
y = 2.1875x
0
100
200
300
400
500
600
700
800
900
0 50 100 150 200 250 300
Ho
le D
ep
th
(µm
)
Channel Depth
(µm)

40
The results indicated that a 10 s hole was consistently 2.2 times deeper than the channel
(Appendix A). This relationship is only valid for holes and channels created at 90°.
For a jet at 90° having a distribution of particle flux, φ, the center depth of a shallow hole
in glass, z, as a function of blasting time, t, can be expressed as [26]
p1pq � <�8 ��9�F (4-9)
where r is the radial coordinate within the jet, C is the erosion coefficient, ρs is the density of
borosilicate glass (2,200 kg/m3), v is the jet centre velocity (m/s) and k is the velocity exponent.
Ghobeity et al. found the abrasive jet had a particle flux at the jet centre described by the
function [46]:
9�F � 0 � NOP QRST U� (4-10)
where, NO is the mass flow rate of aluminum oxide particles (kg/s), βw is the nozzle focus
coefficient and h is the standoff distance (0.02 m). For the erosion of borosilicate glass at room
temperature using the same nozzle (Comco Inc, Burbank CA) and erodent as in the present
experiments, it was found that C=8x10⁻⁶
(m/s)-k
[48], βw=18 [9], and k=1.43 [46].
In summary, for each heat exchanger length in Table 4-5, the three channels that were
machined in glass at 90° were used in the calculation of the jet centerline velocity which was
assumed to be constant while machining continuously over all six angles of attack since
temperature fluctuations were minimal and pressure remained constant. The averages of these
three depths were converted into hole depths using Fig. 4-3. Equations (4-9) and (4-10) were
then used to infer the jet centerline particle velocities, v, as shown in Table 4-5 for each of the
three temperature ranges. The velocities varied because the blasting pressure was adjusted in
each experiment to obtain the desired temperature.
The jet temperature at the surface of the PDMS (Table 4-5) was recorded before each
channel was machined by positioning the jet over the thermocouple for 20 s. A large part of the
variability was due to differences in the alignment of the jet and the thermocouple; e.g. a 1 mm

41
shift in the jet centerline produced a temperature difference of up to 10°C. When the nozzle
remained stationary over the thermocouple, a maximum standard deviation in temperature of
approximately 7°C was produced for the -178°C case. Other authors have reported temperature
fluctuations in cryogenic jets of up to 5°C due to droplet impingement on the thermocouple [49].
Table 4-5 Jet centerline velocities and target temperatures measured during erosion rate
experiments. The temperatures are the averages of the values measured before machining each
of the 3 repeat channels at each angle for a given heat exchanger length.
Angle of
Attack
(Degrees)
Heat Exchanger Lengths
80 cm 64 cm 50 cm
Temperature
(°C)
15 -182 -123 -91
30 -180 -123 -81
45 -180 -126 -85
60 -174 -133 -74
75 -176 -137 -79
90 -175 -125 -81
Ave(SD) -178 (6) -127 (7) -82 (6)
Velocity
(m/s)
(Trial – 1,2,3) 47, 46, 46 30, 50, 45 39,59,50
The grand average and standard deviation (SD) correspond to all 18 temperature measurements
(1 measurement for each of 3 repeats at each of the 6 angles). Velocities inferred from depths of
glass channels machined at 90°.
Shipway [28] found that temperatures at the particle impact sites can increase if the
thermal conductivity of the target material is relatively low. Since PDMS has a relatively low
thermal conductivity of 0.16 W/m·K [Dow Corning Product Information], it was a concern that
large local temperatures at the impact sites could play a role in erosion. It was also suspected that

42
particle collisions on the thermocouple embedded in the PDMS might result in false temperature
readings. An experiment was performed which compared the temperature of a T-type
thermocouple placed on the surface of the PDMS with that of a thermocouple embedded
approximately 330 µm under the PDMS surface. In each case, the jet was positioned directly
over the thermocouple for approximately 20 s. There was no statistically significant difference
between these two temperatures (t-test, 95% confidence), indicating that heating due to direct
impact against the thermocouple was negligible, and that temperature gradients within the PDMS
surface region were small. It is thought that the extremely high convective heat transfer
coefficient of the cold jet removes the heat generated by particle impact on both the
thermocouple and the PDMS.
4.3.2 Dependence of Erosion Rate on Angle of Attack in PDMS
Figure 4-4 shows the dependence of the normalized erosion rate on the angle of attack,
G(α) for the three temperatures investigated. As explained in Section 4.1.2 , the variability in
PDMS erosion due to mass flow fluctuations and small differences in nozzle standoff distance
from one experiment to the next was eliminated by referring to the depths of the glass reference
channels machined immediately after each channel in PDMS (Eq. (4-6)).
(a)
0
2
4
6
8
10
12
14
0 20 40 60 80 100
G(α
)
Angle of attack, (α)
Degrees
Trial 1 - 39 m/s,
260 kPa
Trial 2 - 59 m/s,
320 kPa
Trial 3 - 50 m/s,
320 kPa
-82oC-82

43
(b)
(c)
Figure 4-4 Normalized erosion rate as a function of angle of attack at: (a) -82°C, (b) -127°C, (c) -
178 °C. Data points are the measurements and the solid line is the best-fit curve to G(α).
Each curve contains data points from the three repeat experiments. Jet centerline
velocities varied between 30 and 59 m/s as can be seen in and Table 4-5. Since no trend is seen
between the experimental scatter and particle velocity, it is concluded that G(α) was not affected
by velocity within the range used. This is similar to the observations of Oka for the ductile
0
2
4
6
8
10
12
14
16
0 20 40 60 80 100
G(α
)
Angle of Attack, (α)
Degrees
Trial 1 - 30 m/s,
260 kPa
Trial 2 - 50 m/s,
300 kPa
Trial 3 - 45 m/s,
300 kPa
-127oC
0
0.2
0.4
0.6
0.8
1
1.2
1.4
1.6
1.8
0 20 40 60 80 100
G(α
)
Angle of Attack, (α)
Degrees
Trial 1 - 47
m/s, 400 kPa
Trial 2 - 46
m/s, 400 kPa
Trial 3 - 46
m/s, 400 kPa
-178oC

44
erosion of metallic materials [20]. Figure 4-5 plots the same G(α) results from Fig. 4-4 with
temperature as the independent variable.
Figure 4-5 Normalized erosion rate as a function of temperature at all oblique angles of attack in
PDMS.
Figure 4-5 clearly shows the magnitude of G(α) decreasing as the temperature is lowered.
0
2
4
6
8
10
12
14
16
-200 -150 -100 -50 0
G(α
)
Temperature
(˚C)
15˚ Angle of Attack
0
1
2
3
4
5
6
-200 -150 -100 -50 0
G(α
)
Temperature
(˚C)
30˚ Angle of Attack
0
1
2
3
4
5
-200 -150 -100 -50 0
G(α
)
Temperature
(˚C)
45˚ Angle of Attack
0
0.5
1
1.5
2
2.5
3
3.5
-200 -150 -100 -50 0
G(α
)
Temperature
(˚C)
60˚ Angle of Attack
0
0.5
1
1.5
2
-200 -150 -100 -50 0
G(α
)
Temperature
(˚C)
75˚ Angle of Attack

45
Table 4-6 shows the measured PDMS volumetric erosion rates at an angle of attack of
90° for the three average temperatures shown in Table 4-5. The 90° erosion rate at -178°C was
approximately 15 times larger than that at the two lower temperatures. The low erosion rates in
Table 4-6 for Trial 1 (56 and 63) were due to the lower pressures and hence particle velocities in
these two experiments (Table 4-5).
Table 4-6 Volumetric erosion rate of PDMS at normal incidence as a function of temperature.
Trial
Erosion rate at 90°
(mm3/kg)
-178°C -127 °C -82°C
1 1065 56 63
2 995 74 81
3 907 80 83
As has been previously done [4, 1], Eq. (4-8) was used to describe the dependence of the local
erosion rate on the local angle of attack in the plane of the channel cross section, α. For a brittle
material such as glass, G(α)=(sin(α))k, where k is the velocity exponent of Eq. (2-11).
The curve fits in Figure 4-4 were obtained by fitting Eq. (4-8) to the data points using the
curve fitting tool, which uses a generalized least squares fitting method, in Matlab (MathWorks,
Natick MA), to obtain k2, n1 and n2. The variable n1 was constrained to be between 1 and 2 since
it represents the vertical component of erosion [20]. Table 4-7 gives the curve fit variables for
each of the three temperatures.
Table 4-7 Best-fit variables of Eq. (4-8) for the curves of Figure 4-4.
Variables
Temperature
-82°C -127°C -178°C
n1 1 1 1.26
k2 1205 1828 1.42
n2 6034 9361 1.58
R2 0.97 0.98 0.90
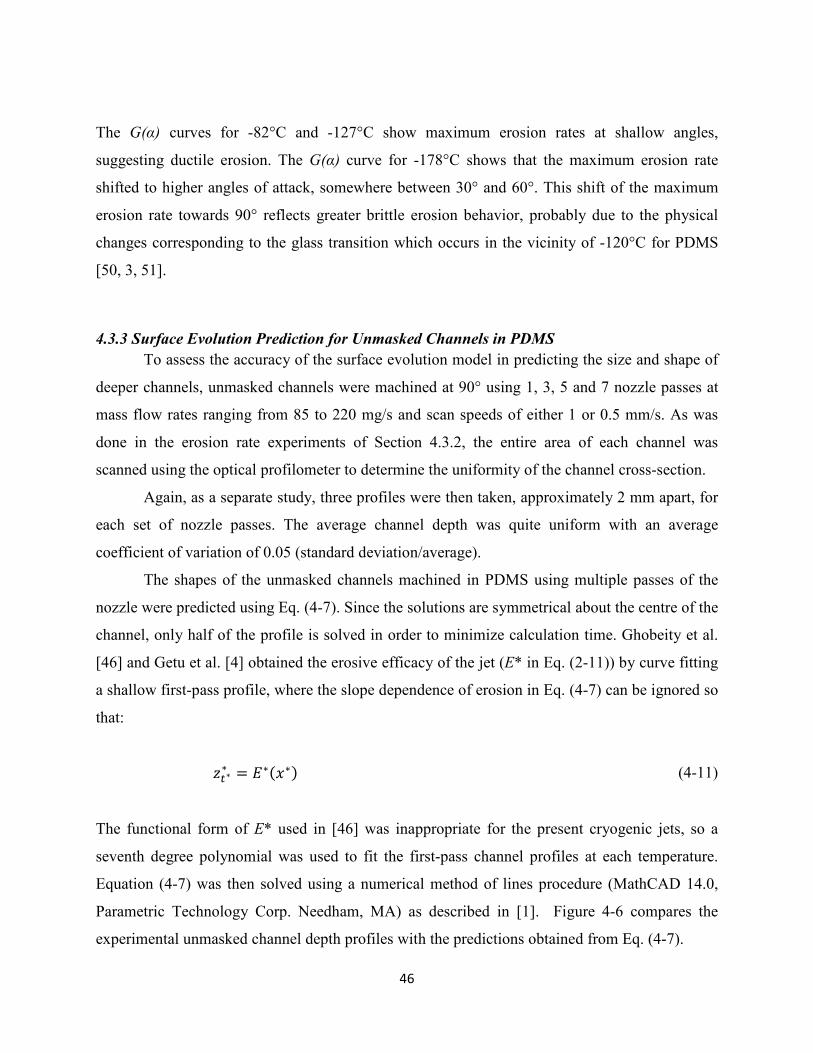
46
The G(α) curves for -82°C and -127°C show maximum erosion rates at shallow angles,
suggesting ductile erosion. The G(α) curve for -178°C shows that the maximum erosion rate
shifted to higher angles of attack, somewhere between 30° and 60°. This shift of the maximum
erosion rate towards 90° reflects greater brittle erosion behavior, probably due to the physical
changes corresponding to the glass transition which occurs in the vicinity of -120°C for PDMS
[50, 3, 51].
4.3.3 Surface Evolution Prediction for Unmasked Channels in PDMS
To assess the accuracy of the surface evolution model in predicting the size and shape of
deeper channels, unmasked channels were machined at 90° using 1, 3, 5 and 7 nozzle passes at
mass flow rates ranging from 85 to 220 mg/s and scan speeds of either 1 or 0.5 mm/s. As was
done in the erosion rate experiments of Section 4.3.2, the entire area of each channel was
scanned using the optical profilometer to determine the uniformity of the channel cross-section.
Again, as a separate study, three profiles were then taken, approximately 2 mm apart, for
each set of nozzle passes. The average channel depth was quite uniform with an average
coefficient of variation of 0.05 (standard deviation/average).
The shapes of the unmasked channels machined in PDMS using multiple passes of the
nozzle were predicted using Eq. (4-7). Since the solutions are symmetrical about the centre of the
channel, only half of the profile is solved in order to minimize calculation time. Ghobeity et al.
[46] and Getu et al. [4] obtained the erosive efficacy of the jet (E* in Eq. (2-11)) by curve fitting
a shallow first-pass profile, where the slope dependence of erosion in Eq. (4-7) can be ignored so
that:
1�∗∗ � �∗�@∗ (4-11)
The functional form of E* used in [46] was inappropriate for the present cryogenic jets, so a
seventh degree polynomial was used to fit the first-pass channel profiles at each temperature.
Equation (4-7) was then solved using a numerical method of lines procedure (MathCAD 14.0,
Parametric Technology Corp. Needham, MA) as described in [1]. Figure 4-6 compares the
experimental unmasked channel depth profiles with the predictions obtained from Eq. (4-7).

(a)
(b)
-7.00E-03
-6.00E-03
-5.00E-03
-4.00E-03
-3.00E-03
-2.00E-03
-1.00E-03
0.00E+00
0.00 0.02
z*
1.0x10-3
0
2.0x10⁻³
3.0x10⁻³
4.0x10⁻³
5.0x10⁻³
6.0x10⁻³
7.0x10⁻³
-4.00E-03
-3.50E-03
-3.00E-03
-2.50E-03
-2.00E-03
-1.50E-03
-1.00E-03
-5.00E-04
0.00E+00
0.00 0.02
z*
5.0x10-4
0
1.0x10⁻³
1.5x10⁻³
2.0x10⁻³
2.5x10⁻³
3.0x10⁻³
3.5x10⁻³
4.0x10⁻³
47
0.04 0.06 0.08 0.10 0.12x*
-82oC
0.04 0.06 0.08 0.10 0.12x*
-127oC
0.12
First Pass
Three
Pass
Five Pass
Seven
Pass
First
Pass
Three
Pass
Five
Pass
Seven
Pass
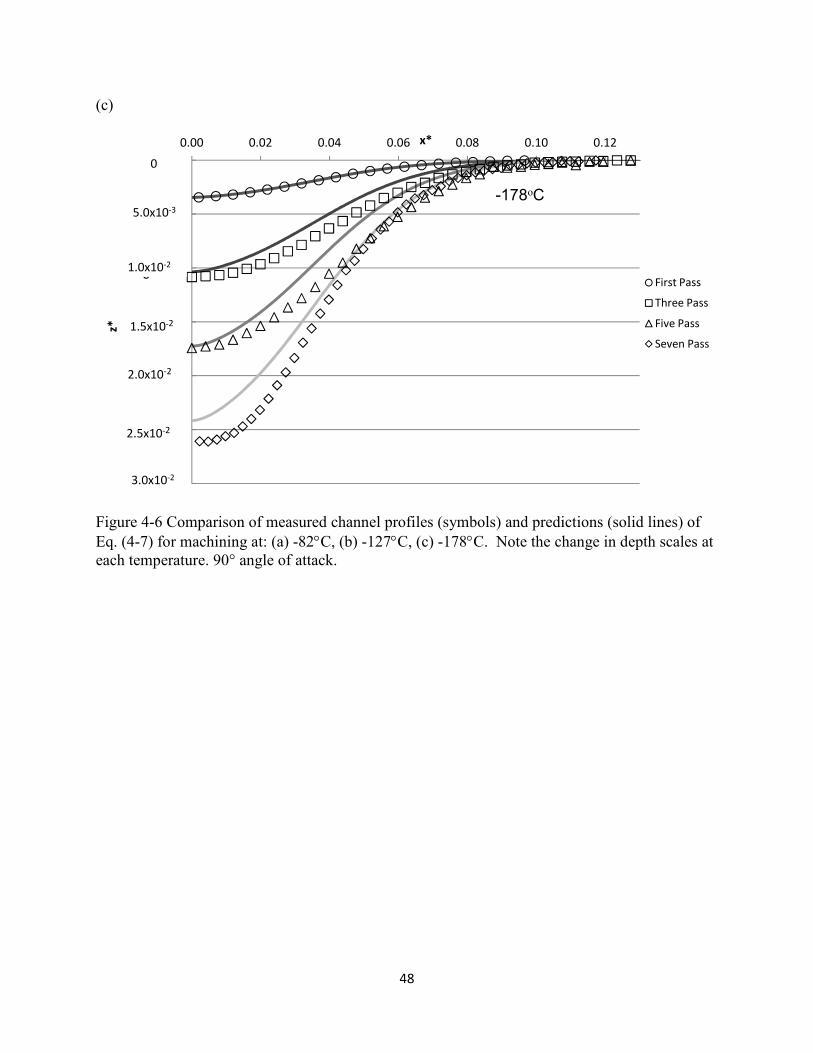
48
(c)
Figure 4-6 Comparison of measured channel profiles (symbols) and predictions (solid lines) of
Eq. (4-7) for machining at: (a) -82°C, (b) -127°C, (c) -178°C. Note the change in depth scales at
each temperature. 90° angle of attack.
-3.00E-02
-2.50E-02
-2.00E-02
-1.50E-02
-1.00E-02
-5.00E-03
0.00E+00
0.00 0.02 0.04 0.06 0.08 0.10 0.12
z*
x*
First Pass
Three Pass
Five Pass
Seven Pass
5.0x10⁻³
0
0
0
0
1.0x10⁻²
1.5x10⁻²
2.0x10⁻²
2.5x10⁻²
3.0x10⁻²
-178oC
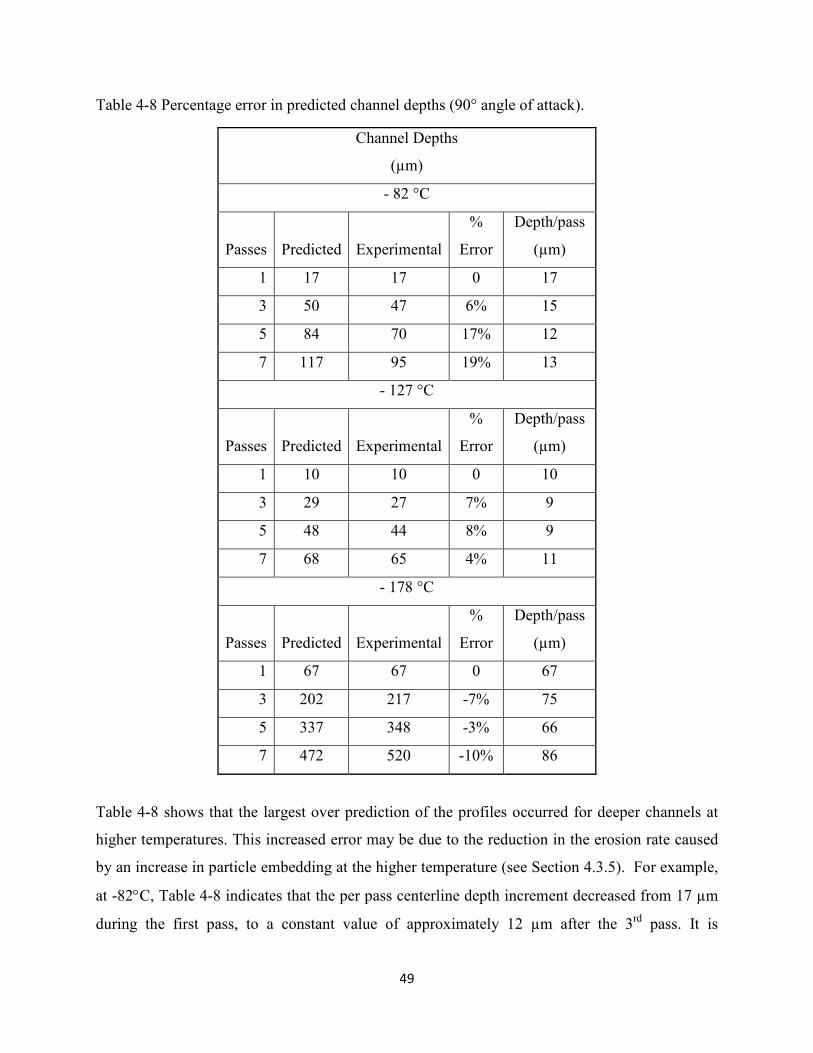
49
Table 4-8 Percentage error in predicted channel depths (90° angle of attack).
Channel Depths
(µm)
- 82 °C
Passes Predicted Experimental
%
Error
Depth/pass
(µm)
1 17 17 0 17
3 50 47 6% 15
5 84 70 17% 12
7 117 95 19% 13
- 127 °C
Passes Predicted Experimental
%
Error
Depth/pass
(µm)
1 10 10 0 10
3 29 27 7% 9
5 48 44 8% 9
7 68 65 4% 11
- 178 °C
Passes Predicted Experimental
%
Error
Depth/pass
(µm)
1 67 67 0 67
3 202 217 -7% 75
5 337 348 -3% 66
7 472 520 -10% 86
Table 4-8 shows that the largest over prediction of the profiles occurred for deeper channels at
higher temperatures. This increased error may be due to the reduction in the erosion rate caused
by an increase in particle embedding at the higher temperature (see Section 4.3.5). For example,
at -82°C, Table 4-8 indicates that the per pass centerline depth increment decreased from 17 µm
during the first pass, to a constant value of approximately 12 µm after the 3rd
pass. It is

50
hypothesized that this was due to the effect of an increasing number of embedded particles,
reaching steady state after the 3rd
pass. In contrast, Table 4-8 shows that the per pass centerline
depth increment was relatively constant at -127°C, indicating that the amount of embedding
reached a steady state for all passes. At -178°C, the model under predicted the eroded profiles,
indicating that reduced erosion due to particle embedding was not a concern.
Ductile materials, especially polymers, can exhibit an incubation period [15] during
which the erosion rate increases with particle dose until a steady-state constant erosion rate is
reached. Hutchings et al. [13] observed such an incubation period in the room temperature
erosion of rubber, and attributed it to the initial growth of a fatigue crack network that evolved to
a steady-state with a constant erosion rate. In contrast, the present experiments displayed an
incubation period at -82°C where the erosion rate decreased to a constant value. As discussed in
more detail in Section 4.3.6, this was thought to be caused by an increase in particle embedding
to a steady-state embedded particle coverage and a constant level of surface shielding. Therefore,
the G(α) measurements at -82°C represent an average erosion from a virgin surface to some level
of particle embedding in a shallow channel that may not yet correspond to a steady-state level of
embedding.
The G(α) curve at -82°C corresponding to steady-state erosion (constant embedded
particle coverage) can be estimated by assuming that the magnitude of particle embedding is
proportional to the velocity component normal to the surface [1], and that the erosion rate at
steady state at 90° impact angle is 70% smaller than that measured in the first pass; i.e. Table 4-4
gives 17 µm/pass for the first pass and an average of 12 µm/pass thereafter. Therefore, the
estimated G(α) for steady-state erosion at -82°C is approximated as
B�∝r � s1 $ 0.3sin�_uB�∝B�90′ (4-12)
Figure 4-7 shows the new G(α)´ points plotted with the original best-fit curve of Figure 4-4a. The
shift in the data points is relatively small, except at 15° where the corrected values of G(α) are
shifted significantly upward. This is simply a result of the reduced level of embedding and hence
surface shielding predicted by Eq. (4-12) for this small normal component of the impact velocity.

51
Figure 4-7 G(α) altered (data points) to account for the incubation period seen at -82°C. Original
fit (solid line) from Figure 4-4 Normalized erosion rate as a function of angle of attack at: (a) -
82°C, (b) -127°C, (c) -178 °C. Data points are the measurements and the solid line is the best-fit
curve to G(α).
Similarly, the surface evolution predictions of Fig. 4a could be improved by calculating
the erosive efficacy of the jet (E* in Eq. (2-11)) using a fit to a channel profile corresponding to
steady-state embedding rather than the first-pass profile. This would reduce the effective erosion
rate and decrease the over-prediction of depth seen in the predictions of the fifth and seventh
passes in Figure 4a (these cases had the greatest errors as seen in Table 4-4). For example, when
the profile of 3 nozzle passes is used for E*, errors reduce to 8% for the fifth and seventh pass
predicted depths.
4.3.4 Surface Evolution Prediction for PDMS Masked Channels
Masked channels were machined in PDMS at -181°C at 90° and -65°C at 15°. High
carbon steel feeler gauge with a thickness of 1 mm was used as the mask material. Such thick
masks were used in order to avoid buckling caused by particles impacting the mask creating a
gap between the mask and substrate as described by Wensink et al. [52]. The edge of the feeler
gauge was machined square to ensure a 90° edge with respect to the substrate. The masks were
clamped to the surface using a special clamping device which used two plates to sandwich the
substrate and mask together. A slot of approximately 5 mm in width and 60 mm in length was
0
2
4
6
8
10
12
14
16
18
0 20 40 60 80 100
G(α
)'
Angle of attack, (α)
Degrees
Trial 1' - 39
m/s, 260 kPa
Trial 2' - 59
m/s, 320 kPa
Trial 3' - 50
m/s, 320 kPa
-82oC
52
machined in one of the plates so the substrate material and part of the masks could be exposed to
the jet.
Figure 4-8 Mask holding device.
Once the masks were clamped in place, this spacing was confirmed using an optical
profilometer by taking profiles every 5 mm along the 40 mm long channel. While blasting, the
target oscillated rapidly in a direction perpendicular to the traverse direction at a frequency of 4
Hz and magnitude of either 6 mm or 10mm in order to provide a uniform particle flux across the
mask opening as was done in [29].
Figure 4-9 shows the measured and predicted (Eq. (4-7)) masked channel profiles for
various numbers of nozzle passes in PDMS at -180°C. Since the channels were symmetrical, the
surface evolution equation for only half of the profile was solved to minimize calculation time.
The average mask opening width was 350 µm with a standard deviation of 9.5 µm. The erosive
efficacy was fitted to the first pass using an 11th
order polynomial.
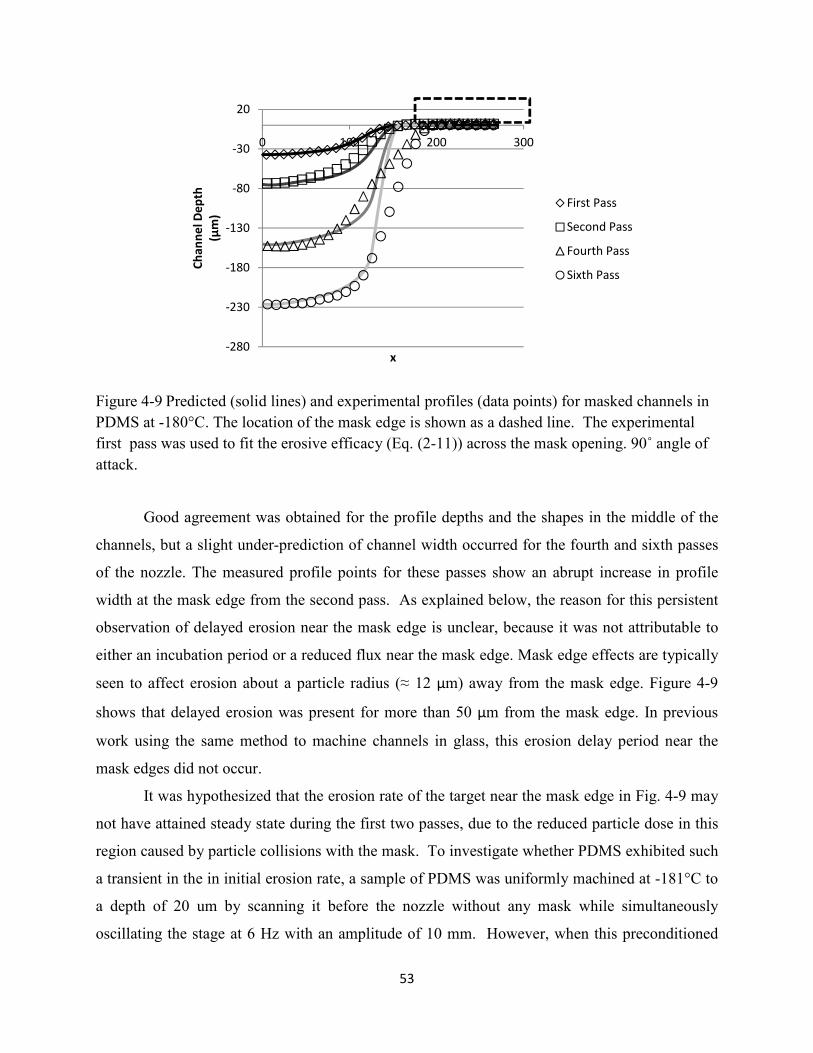
53
Figure 4-9 Predicted (solid lines) and experimental profiles (data points) for masked channels in
PDMS at -180°C. The location of the mask edge is shown as a dashed line. The experimental
first pass was used to fit the erosive efficacy (Eq. (2-11)) across the mask opening. 90˚ angle of
attack.
Good agreement was obtained for the profile depths and the shapes in the middle of the
channels, but a slight under-prediction of channel width occurred for the fourth and sixth passes
of the nozzle. The measured profile points for these passes show an abrupt increase in profile
width at the mask edge from the second pass. As explained below, the reason for this persistent
observation of delayed erosion near the mask edge is unclear, because it was not attributable to
either an incubation period or a reduced flux near the mask edge. Mask edge effects are typically
seen to affect erosion about a particle radius (≈ 12 µm) away from the mask edge. Figure 4-9
shows that delayed erosion was present for more than 50 µm from the mask edge. In previous
work using the same method to machine channels in glass, this erosion delay period near the
mask edges did not occur.
It was hypothesized that the erosion rate of the target near the mask edge in Fig. 4-9 may
not have attained steady state during the first two passes, due to the reduced particle dose in this
region caused by particle collisions with the mask. To investigate whether PDMS exhibited such
a transient in the in initial erosion rate, a sample of PDMS was uniformly machined at -181°C to
a depth of 20 um by scanning it before the nozzle without any mask while simultaneously
oscillating the stage at 6 Hz with an amplitude of 10 mm. However, when this preconditioned
-280
-230
-180
-130
-80
-30
20
0 100 200 300
Ch
an
ne
l D
ep
th
(µm
)
x
First Pass
Second Pass
Fourth Pass
Sixth Pass

54
PDMS surface was subsequently masked and machined as before, there was once again a
pronounced delay in the erosion near the mask edge as in Fig. 4-9. Therefore, an incubation
period was not the mechanism responsible for the erosion delay.
Figure 4-9 shows that using the first-pass channel profile to represent the erosive efficacy
through the mask opening (Eq. (2-11)) is inadequate since it is initially too narrow and does not
reflect the erosive flux across the entire mask opening. Ghobeity et al. [26] developed a
procedure to infer an effective first-pass profile from the shape of a later, much deeper profile in
which the local erosion rate depends on the slope. This method was implemented using the
fourth pass of Fig. 4-8 to infer the erosive efficacy in Eq. (4-7), since at this point, the channel
width had reached the mask edges. The following expressions were substituted into Eq. (4-7) in
order to solve for E*(x*).
�1∗�∗w � 1∗�@w, q∗ $ 1∗�@w, 0q∗ (4-13)
�1∗5∗w � J∗�5∗yz!,�∗J∗�5∗y,�∗5∗yz!5∗y (4-14)
Figure 4-10 Predicted (solid lines) and experimental profiles (data points) for masked channels in
PDMS at -180°C. The location of the mask edge is shown as a dashed line. The experimental
fourth pass was used to infer the erosive efficacy (Eq. (2-11)) across the mask opening using the
method of [26].
-250
-200
-150
-100
-50
0
50
0 50 100 150 200 250 300
First Pass
Second Pass
Fourth Pass
Sixth Pass

55
Figure 4-10 shows that this procedure resulted in better agreement near the mask edge, but the
predicted fourth and sixth-pass profiles remained slightly too narrow, although the depth and the
central portion of the channel profile were accurately modeled..
Figure 4-11 shows channel depths for 1, 3 and 5 passes of the nozzle in PDMS which was
machined at -65°C at an angle of attack of 15° and a nozzle standoff distance of 43 mm. Previous
work [53] showed that erosion rates were maximum at shallow angles at this temperature,
suggesting that the erosion mechanism was predominantly ductile.
Figure 4-11 Predicted (solid lines) and experimental profiles (data points) for masked channels in
PDMS at -65°C. The location of the mask edge is shown as a dashed line. The experimental
first pass was used to fit the erosive efficacy (Eq. 2-11)) across the mask opening. 15° Angle of
attack.
There was a good agreement between the experimental and predicted profiles. In contrast to the
masked channels machined at -180°C (Fig. 4-9), there was no apparent delay in erosion near the
mask edge, and the first-pass profile accurately reflected the distribution of the erosive efficacy
(Eq. (6)).
-50
-40
-30
-20
-10
0
10
0 100 200 300 400 500
z
(µm
)
x
(µm)
First Pass
Third Pass
Fifth Pass

56
Table 4-5 Percentage error in predicted masked channel depths in PDMS at two different
temperatures.
Channel Depths
PDMS
- 65 °C, 15° Angle of Attack
525 µm Mask Spacing
Dosage Method: Nozzle Passes
Passes Predicted Experimental
%
Error
Depth/pass
(µm)
1 8 8 0% 8
3 27 29 7% 11
5 45 46 1% 9
- 180 °C, 90° Angle of Attack
350 µm Mask Spacing
Dosage Method: Scan Speed
Passes Predicted Experimental
%
Error
Depth/pass
(µm)
1 37 37 0% 37
2 75 73 -3% 36
4 150 152 1% 40
6 225 226 0% 37
4.3.5 Surface morphology and particle embedding in PDMS
Figure 4-12 indicates that there was much more particle embedding in the surface of the
PDMS at -82 than at -178°C.
(a) (b)
Figure 4-12 Scanning electron micrographs of PDMS blasted at 90° in a single pass at (a) -82°C
and (b) -178°C.
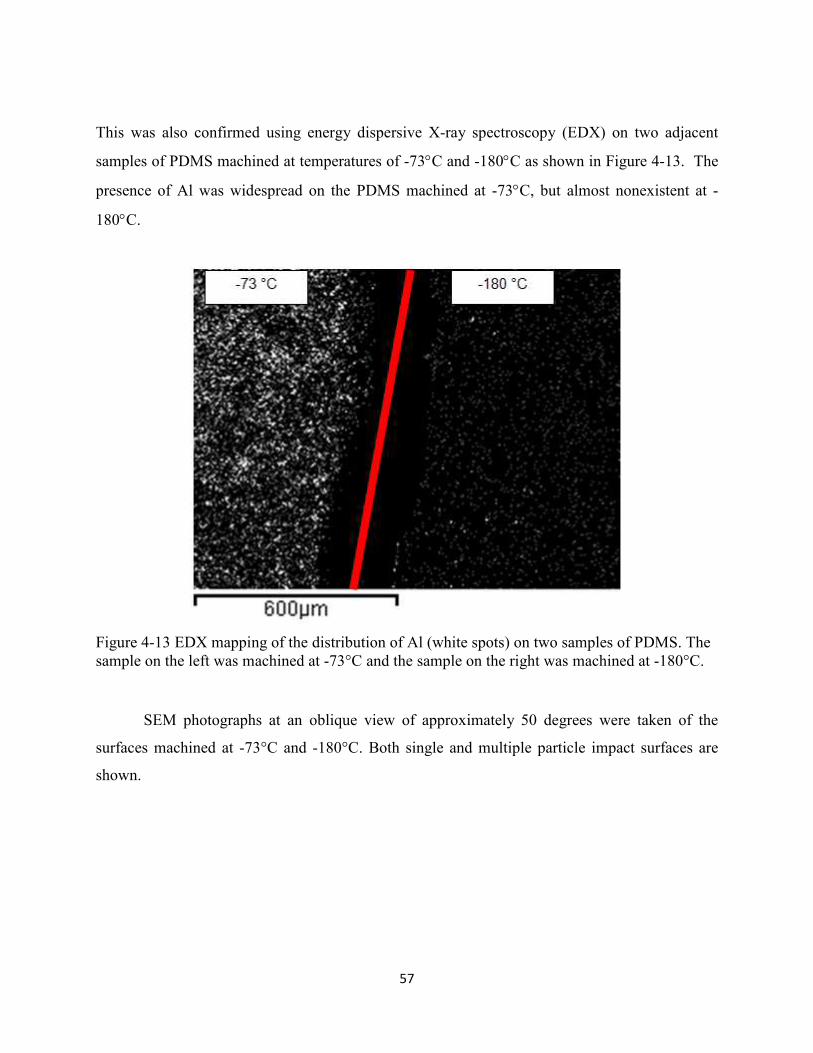
57
This was also confirmed using energy dispersive X-ray spectroscopy (EDX) on two adjacent
samples of PDMS machined at temperatures of -73°C and -180°C as shown in Figure 4-13. The
presence of Al was widespread on the PDMS machined at -73°C, but almost nonexistent at -
180°C.
Figure 4-13 EDX mapping of the distribution of Al (white spots) on two samples of PDMS. The
sample on the left was machined at -73°C and the sample on the right was machined at -180°C.
SEM photographs at an oblique view of approximately 50 degrees were taken of the
surfaces machined at -73°C and -180°C. Both single and multiple particle impact surfaces are
shown.
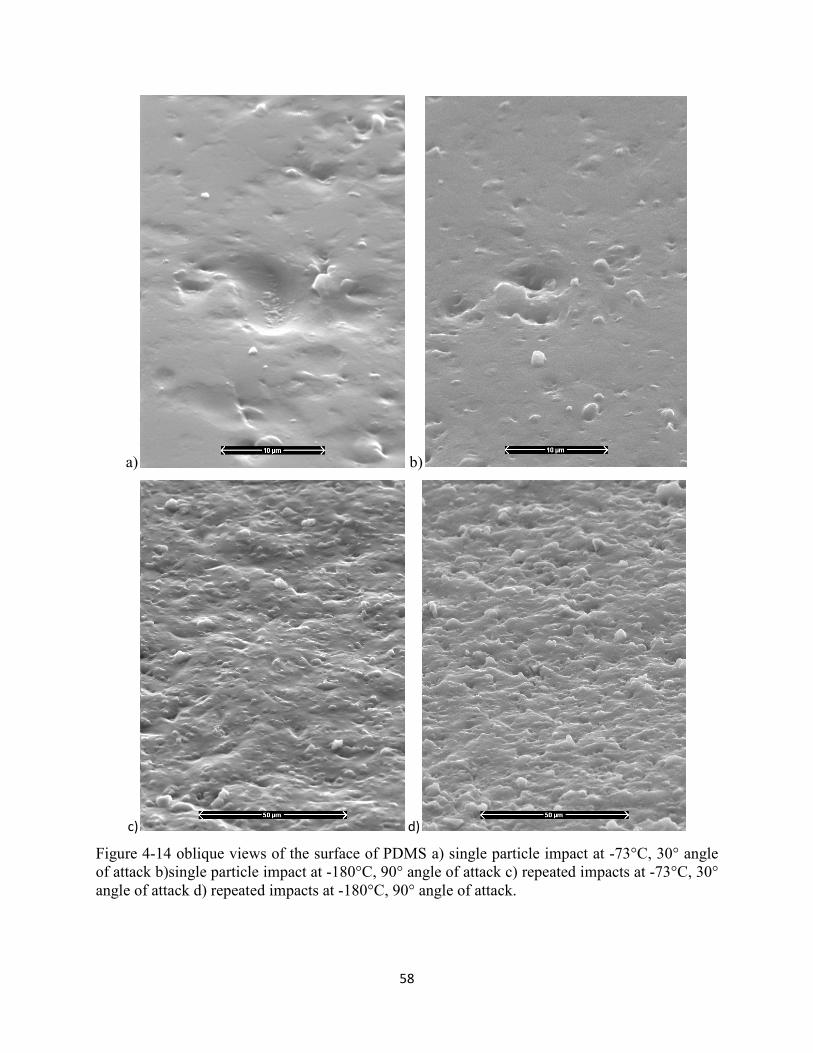
58
a) b)
c) d)
Figure 4-14 oblique views of the surface of PDMS a) single particle impact at -73°C, 30° angle
of attack b)single particle impact at -180°C, 90° angle of attack c) repeated impacts at -73°C, 30°
angle of attack d) repeated impacts at -180°C, 90° angle of attack.

59
The single impact site at the warmer temperature shows a smooth crater which is suggestive of
micro-cutting whereas the impact site at the cooler temperature shows sharp ridges suggestive of
material removal through crack propagation.
The -73°C surface, machined at a 30° angle of attack, appears to be slightly smoother
than the surface machined at -180°C with gradual mounds. It is interesting to note that the
surface does not show the typical transverse ridges synonymous with ductile erosion at oblique
angles in most polymers. Barkoula and Karger reported that most elastomers tended to show
more brittle features when examined under microscope [19]. The sharp ridges again appeared
over the entire surface of the PDMS sample machined at -180°C.
Figures 4-15(a-e) are backscatter electron images obtained for the machined and
untouched portions of the samples machined at -73 and -180°C.
a) b)
c) d)

60
e)
Figure 4-15 Scanning electron micrographs of PDMS: a) virgin surface that had been cooled to -
73°C, b) machined surface at -73°C. c) virgin surface that had been cooled to -180°C, d)
machined surface at -180°C, e) magnified view of dashed area shown in d.
Micro-cracks can clearly be seen for both surfaces at -180°C and are absent from either
surface at -73°C. The microcracks in Figure 4-15c indicate that thermal strain caused cracking in
the PDMS when it had been cooled to -180°C. Additional cracking due to particle impact is
evident in Figure 4-15 d and e. These cracks originate from the impact sites and are therefore
much more numerous and irregular than the thermal strain cracks of Figure 4-15c. Therefore,
machining at -180°C introduces two effects that can influence the erosion rate: thermal strains
generate cracks that might weaken the surface, and particle impacts generate cracks that are
consistent with a brittle erosion mechanism. It should be noted that cracks were not apparent in
Figure 4-12b since secondary electron detection does not reveal microcracks of this size.
4.3.6 Volumetric Erosion per Unit Kinetic Energy in PDMS
In order to separate the effects of velocity and temperature, the volume of material
removed per unit kinetic energy of the erodent was calculated, as shown in Figure 4-16 using the
maximum centerline velocities in the jet (Table 4-1 and Fig. 4-4).

61
Figure 4-16 Volume of eroded PDMS per unit kinetic energy of incident particles as a function
of impact angle for four temperatures.
It is interesting to note that curves at -82 and -127°C are very similar, suggesting that the erosion
mechanism was the same. In contrast, between -127°C and -178°C the erosion mechanism
changes markedly, producing greater erosion efficiency with a maximum in the vicinity of 45°.
This is consistent with Fig. 4-4 where the G(α) curve at -178°C displayed a maximum erosion
rate near 45°.
Although Fig. 4-16 provides an indication of machining efficiency, it neglects the energy
cost of cooling which will increase approximately linearly with decreasing temperature.
Therefore, machining at -178°C will require twice the LN2 as at -82°C.
4.4 Summary of Findings and Results
The dominant erosion mechanism in PDMS at temperatures of -82°C and -127°C appears
to be ductile, because the normalized erosion rate, G(α), shows maximum erosion at angles of
attack below 20°. The G(α) curve for -178°C shows a maximum erosion rate in the range of 30-
60°, indicating a more brittle erosion mechanism below the glass transition temperature which is
0
0.05
0.1
0.15
0.2
0.25
0.3
0.35
0.4
0.45
0.5
0 20 40 60 80 100
Vo
lum
e/K
ine
tic
En
erg
y
(mm
3/J
)
Angle of Attack, α
(Degrees)
-178°C
-127°C
-82°C
Room Temperature

62
in the vicinity of -120°C. The presence of micro-cracks in Fig 4-15e also suggest a brittle erosion
mechanism at the coldest temperature of -178°C.
Glass channel depths at 90° were an effective way of inferring the velocity at the
centreline of the jet at various temperatures. Glass reference channels machined at other impact
angles during each PDMS erosion rate measurement, provided an accurate way of obtaining the
G(α) curves that was independent of fluctuations in the mass flow rate.
The first pass profile fit to the erosive efficacy of the jet using a seventh order polynomial
resulted in good unmasked surface evolution predictions. The largest error in channel depth
prediction occurred at the warmest jet temperature, because of increased particle embedding.
The efficiency of PDMS machining, expressed as volume removal per unit kinetic
energy, increased markedly below the glass transition of PDMS, being maximum between 30°
and 60° angle of attack at approximately -178°C.
Masked channel profiles in PDMS were predicted very well with a maximum error of
only 7%. The profile shape of a masked channel in PDMS at -180°C show there is a decrease in
erosion near the mask edge. This causes initially narrower channels at small particle dosages (i.e.
first and second pass) which render the first pass fit method inadequate for the deeper channels.
Fitting the erosive efficacy using a pass which is beyond this small particle dosage resulted in
better predictions of the deeper profile shapes. Preconditioning the surface by removing 20 µm
appeared to have no effect on decreasing this effect. The channels machined in PDMS at -65°C
showed good agreement with the predictions of Eq.(4-7). This indicated that no incubation
period or effect of particle shielding or embedding occurred at these conditions.

63
5 Cryogenic Abrasive Jet Machining of Polytetrafluoroethylene at Different
Temperatures
Inorganic materials such as glass and silicon were initially adapted from the integrated
circuits industry as substrate materials for microfluidic chips. It is of interest to investigate the
AJM of polytetrafluoroethylene (PTFE) in view of its superior inertness, high melting point of
(340°C), and retention of ductility over a wide range of temperatures [6, 8], making it suitable
for microfluidics applications.
This chapter investigates the dependence of erosion rate on temperature and angle of
attack in PTFE and high carbon steel, often used as a mask material in AJM. The results are used
to suggest an optimal machining condition which minimized mask wear while maximizing
erosion in PTFE. Previously developed surface evolution models were used to predict the profile
depths and shapes of micro-machined channels in PTFE.
5.1 Experiments
5.1.1 Cryogenic Abrasive Jet Machining Setup
The cryogenic machining setup is described in detail in Section 3.1.4. The abrasive jet
air-particle mixture from a microblaster (Accuflo, Comco Inc., Burbank, CA) passed through a
heat exchanger made of copper tubing immersed in liquid nitrogen [53]. Heat exchanger lengths
of 50, 61 and 98 cm were used to produce jet temperatures of -76, -107 and -182°C respectively.
A 1.5 mm high efficiency tungsten carbide nozzle (Comco Inc., Burbank, CA) was used to
accelerate the particles toward the computer controlled stage where the samples were mounted.
The nozzle was placed on a rotating mount which was used to change the angle of attack
between the nozzle and the substrate materials.
5.1.2 Target Materials
Solid particle erosion experiments using 25 µm aluminum oxide particles were performed
on 1.5 mm thick PTFE and 1 mm thick high-carbon steel (Rockwell C hardness of 48.5). As
described in Section 4.1.2, in order to compensate for potential mass flow fluctuations and to
determine the particle velocity in the centre of the jet, the depth of channels machined at normal
incidence in 2.5 mm thick borosilicate glass (Borofloat, Schott North America, Elmsford, NY)
were also measured immediately after each erosion test (Section 5.2.2).

64
5.1.3 Characterization of Erosion Rate at Different Temperatures and Angles of Attack
The dependence of the erosion rate on the nozzle angle of attack was measured at four
temperatures (17, -76, -107, -182°C) for the PTFE, and at 17, -81 and -182°C for the steel.
Channels were machined at 15, 30, 45, 60, 75 and 90° to the surface in the at a scan speed of 0.5
mm/s for the PTFE and glass, and 0.2 mm/s for the high carbon steel. Scanning at inclined
angles was done in the “backwards” orientation, where the target motion (away from the fixed
nozzle) was in the same direction as the jet flow along the channel [3]. The PTFE, steel and
glass specimens were clamped adjacent to each other on the computer controlled stage. The
nozzle to surface standoff distance (h) was kept constant at 23 mm, measured along the jet
centerline. The central jet temperature was measured for 15 s at the beginning of each
experiment using either a K-type or a J-type thermocouple with a 1-2 mm bead fixed to the
PTFE surface. At each combination of angle and temperature, the microblaster was operated
continuously while 25 mm, 12 mm and 20 mm long channels were machined in the PTFE, steel
and glass, respectively, using 25 µm nominal diameter aluminum oxide particles. This ensured
constant blasting conditions within a single experiment. Each of these experiments was repeated
twice, with the exception of the results at 17°C, which were obtained from a single experiment.
Blasting pressures at the colder temperatures were between 300 kPa and 400 kPa resulting in a
range of jet centerline particle velocities between 23 and 49 m/s, depending on the desired jet
temperature and heat exchanger length. As was done in Section 4.3.2, the glass channels were
used to infer the erosion rate using Eq. (4-6). Since mass flow fluctuations of up to 20% between
experiments have been reported previously with similar equipment [46], it was important to
account for this variability by normalizing the erosion rate of the PTFE and steel by the erosion
in the glass machined directly at the same mass flow rate. Borosilicate glass was a useful
reference material because its erosion characteristics are well known [26], and are only a weak
function of temperature [53]. Knowing the depth of the reference channels in glass, the
dependence of the erosion rate of PTFE and steel on the angle of attack, α, can be expressed as
was done in Section 4.1.2 [53]. As has been described previously, the glass channel depths at 90°
could also be used to calculate the particle velocity at the jet centre for each temperature and the
dependence of the erosion rate of PTFE and steel.
An optical profilometer (ST400, Nanovea, Irvine, CA) was used to measure the size and
shape of the channel cross-sections. The angular spread of the particle velocities within the jet
65
were considered to produce a negligible variation in the local impact angle. The channel depths
were measured at four locations along the channel length for the various angles of attack. The
average of these four depths was used to calculate G(α) in Eq. 4-6.
5.1.4 Micro-machining of Masked Channels in PTFE
At -65°C, masked channels were machined in PTFE at 400 kPa and α=30°. The
experiments were then performed at -180°C at 400 kPa and α= 90° in PTFE. The mask consisted
of two 1 mm thick steel strips (same steel as used in the erosion rate experiments), which was
thick enough to remain flat in spite of the plastic deformation generated by particle impacts. The
edges of the two steel masking strips were machined square, and they were tightly clamped to
the target surface with gaps between 566 and 592 µm as shown in Table 5-4. Once the masks
were clamped in place, this spacing was confirmed using an optical profilometer by taking cross-
sectional profiles every 5 mm along the 50 mm long channel. While blasting, the masked target
was oscillated rapidly in a direction perpendicular to the scan direction at a frequency of 4 Hz
with an amplitude of at least 6 mm to create a uniform particle flux across the mask opening, as
was done previously in [29]. The particle dose (g/mm2), was controlled by either the number of
nozzle passes or the scan speed (Table 5-4). Experiments showed that both of these methods
produced identical results for the same particle dose (See Appendix B). Following the approach
of [1, 3], the first-pass profile was used to determine the erosive efficacy of the portion of the jet
within the mask opening, a method which is explained in Section 4.3.3. The first pass was fitted
with a polynomial for each case except for the profile in PTFE at -180°C which was fitted with
an exponential equation suggested by Ghobeity et al. [26] since a polynomial fit resulted in an
unrealistic slope at the center of the channel.
5.1.5Particle Velocity
The erosion rates at the different temperatures could not be directly compared since the
particle velocity changed with the jet temperature [53]. To overcome this problem, erosion in
PTFE was reported per unit kinetic energy of the particles in the centre of the abrasive jet. As
was done in Section 4.3.2, the depths of the glass calibration channels were used to infer the jet
centerline particle velocities, v (m/s), using the known mass flux and velocity distribution of the
jet as follows:

66
� � ? 1�8T�∆q<RS�NO AH �=
(5-1)
where ρs is the density of the glass (2,200 kg/m3), C is the erosion coefficient of glass (C=8x10
-6
(m/s)-k
) [9], k is the velocity exponent for glass eroded with alumina particles (1.43), NO is the
particle mass flow rate in kg/s, βw is the nozzle flow focus coefficient (18) [9], and h is the
nozzle standoff distance (0.023 m).
5.2 Results and Discussion
5.2.1 Dependence of Erosion Rate on Angle of Attack in PTFE
Figure 5-1 shows the normalized volumetric erosion rate as a function of the impact
angle, α, for PTFE at 17°C and the three cryogenic temperatures investigated. The normalized
value, G(α), was obtained by dividing by the erosion rate at 90°. At room temperature, the
erosion rate was nearly zero at 90°, and therefore the actual, rather than normalized, values were
plotted in Fig. 5-1a. As described in Section 3.1.4, the velocity of the particles depended on both
the blasting pressure and the degree of cooling of the air in the heat exchangers. Therefore, as
described in Section 4.3.1, the particle velocities were calculated using the depth of the glass
channel at 90° as indicated in each graph for the experiments at different pressures.
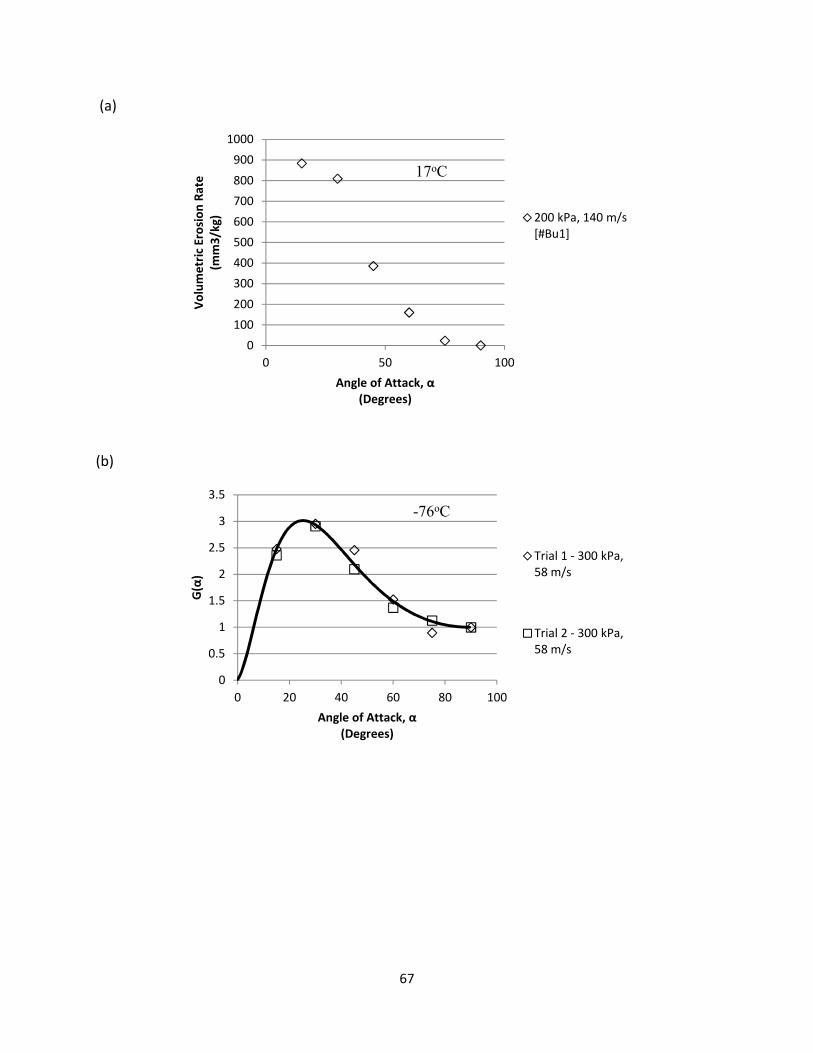
67
(a)
(b)
0
100
200
300
400
500
600
700
800
900
1000
0 50 100
Vo
lum
etr
ic E
rosi
on
Ra
te
(mm
3/k
g)
Angle of Attack, α
(Degrees)
200 kPa, 140 m/s
[#Bu1]
17oC
0
0.5
1
1.5
2
2.5
3
3.5
0 20 40 60 80 100
G(α
)
Angle of Attack, α
(Degrees)
Trial 1 - 300 kPa,
58 m/s
Trial 2 - 300 kPa,
58 m/s
-76oC

68
(c)
(d)
Figure 5-1 Normalized erosion rate in PTFE as a function of angle of attack at: (a) 17°C (b) -
76°C, (c) -107°C, (d) -182 °C. Data points are the measurements and the solid line is the best-fit
curve to G(α) Eq.(4-8).
As the jet temperature decreased, the peak in erosion began to flatten and shift towards
90°. At the coldest jet temperature of -182°C, the erosion rate in PTFE is almost independent of
the incoming angle of the particles. This result indicates that a combination of brittle and ductile
0
0.2
0.4
0.6
0.8
1
1.2
1.4
1.6
0 20 40 60 80 100
G(α
)
Angle of Attack, α
(Degrees)
Trial 1 - 200 kPa,
23 m/s
Trial 2 - 300 kPa,
36 m/s
-107oC
0
0.2
0.4
0.6
0.8
1
1.2
1.4
0 20 40 60 80 100
G(α
)
Angle of Attack, α
(Degrees)
Trial 1 - 400 kPa,
49 m/s
Trial 2 - 400 kPa,
49 m/s
-182oC

69
erosion mechanisms exist at the lower temperatures. As was done in Section 4.3.2, the G(α)
results are expressed with temperature as the independent variable in Figure 5-2.
Figure 5-2 Normalized erosion rate as a function of temperature at all oblique angles of attack in
PTFE.
Figure 5-2 again shows G(α) slowly decreasing in magnitude as the machining temperature is
lowered.
0
0.5
1
1.5
2
2.5
3
-200 -150 -100 -50 0
G(α
)
Temperature
(˚C)
15˚ Angle of Attack
0
1
2
3
4
-200 -150 -100 -50 0
G(α
)
Temperature
(˚C)
30˚ Angle of Attack
0
0.5
1
1.5
2
2.5
3
-200 -150 -100 -50 0
G(α
)
Temperature
(˚C)
45˚ Angle of Attack
0
0.5
1
1.5
2
-200 -150 -100 -50 0
G(α
)
Temperature
(˚C)
60˚ Angle of Attack
0
0.5
1
1.5
-200 -150 -100 -50 0
G(α
)
Temperature
(˚C)
75˚ Angle of Attack

70
Table 5-1 shows the measured PTFE volumetric erosion rates at an angle of attack of 90°
for the three average temperatures. The low erosion rate in Table 5-1 for Trial 1 (269) was due to
the lower pressure and hence particle velocity in this experiment.
Table 5-1 Volumetric erosion rate of PTFE at normal incidence as a function of temperature.
These values were used to calculate the normalized erosion rate, G(α), in Fig. 5-1.
Trial
Erosion rate at 90°
(mm3/kg)
-182°C -107°C -82°C
1 904 269 525
2 790 630 467
As in Chapter 4, curve fits in Figure 5-1 were again obtained by fitting Oka’s equation (Eq. 4-8 )
using a generalized least squares fitting method, in Matlab (MathWorks, Natick MA). The
variable n1 was constrained to be between 1 and 2 since it represents the vertical component of
erosion [20]. Table 5-2 shows the curve fitting variables used to obtain the fitted lines of Figure
5-1 for each of the three temperatures.
Table 5-2 Best-fit variables of Eq. 4-8 for the curves of Figure 5-1
Temperature
°C
Variables
n1 k2 n2
-182 1.271 291.5 483.1
-107 1.242 1.24 1
-76 1.775 3.237 11.46
The shape of the G(α) function in Fig. 5-1 changed most between -76 and -107°C, which
corresponds to the γ-relaxation found at approximately -100°C by Blumm et al. and attributed to
rotation around the carbon-carbon bond [54]. This and other PTFE transition temperatures
associated with crystal reordering and relaxation are listed in Table 5-3 [55]. The amorphous
second order glass transition at -30°C could have influenced the increase in erosion measured
from room temperature to -76°C. It is noted that the transitions of Table 5-3 typically occur over

71
a range of approximately 10-15°C, so correlating a single temperature to a certain transition is
misleading.
Table 5-3 Transition temperatures of PTFE [55]
Transition °C
α (Glass I) 126
β 19
β2 30
Amorphous
2nd Order -30
γ (Glass II) -80
Since PTFE (0.259 W/mK) [55] has a higher thermal conductivity than PDMS (0.15
W/mK) [55], heat generated from particle impact was ignored for the cryogenic blasting
temperatures of -76, -107 and -182°C.
5.2.2Dependence of Erosion Rate on Angle of Attack in High Carbon Steel
Figure 5-3 shows that G(α) for the high carbon steel was largely independent of
temperature, although there was a weak dependency at the two smallest angles where erosion
increased slightly with temperature.

72
Figure 5-3 Angle dependency of erosion in high carbon steel as a function of temperature.
Oka et al. [11] found similar behavior for the room temperature erosion of aluminum (G ≈ 2 at
20°). When the temperature decreased from 20 to -125°C, Urbanovich [31] reported a shift in
the maximum erosion rate towards higher angles of attack in the low temperature solid particle
erosion of a very hard bearing steel (ShKh15; 64 HRC [56]) at average particle (dry quartz sand,
200 – 315 µm) velocities of approximately 50 m/s. In contrast, Figure 5-3 indicates an erosion
mechanism which does not depend on temperature for the range investigated.
5.2.3 Masked Channels in PTFE
As shown in Fig. 5-4 and Table 5-4, the surface evolution model predicted the masked
micro-channel profile shapes at -180°C in PTFE more accurately than in PDMS (Fig. 4-9). As
was done with the PDMS sample, the mask position was measured after it was clamped to the
PTFE and found to be 566 µm (standard deviation 22 µm). The mask opening was not measured
to be significantly narrower at the position of the first or second pass. This confirms that a
narrow mask width is not responsible for the slightly smaller width of the first and second pass
profiles. It is thought that a small amount of under-etching is responsible for the slightly wider
profiles of the fourth and sixth pass.
0
0.5
1
1.5
2
2.5
0 20 40 60 80 100
G(α
)
Angle of Attack, α
(Degrees)
-76°C
17°C
-177°C

73
Figure 5-4 Predicted (solid lines) and experimental profiles (data points) for masked channels in
PTFE at -180°C. The mask edge is shown as a dashed line. The experimental first pass was used
to fit the erosive efficacy to Eq. (5-2), suggested by [26], across the mask opening.
The erosive efficacy of the jet was fit directly to the first pass in Fig. 5-4 using the function
suggested by Ghobeity et al.[26] since the polynomial fit produced an unrealistic sharp point at
the center of the channel,
�∗�@∗ � V|�5∗I�.� $ 1 (5-2)
where B is the curve fitting parameter which was determined to be -8.369 using a generalized
least squares fitting method, in Matlab (MathWorks, Natick MA). The exponential term
represents the effect of the mask edge impeding erosion. The -1 value represents the uniform
flux, which as previously mentioned, was obtained by oscillating the nozzle over the mask
opening. This function was used in order to force the slope of the profile to 0 at x = 0.
Figure 5-5 shows the surface evolution predictions in PTFE at a machining temperature
of -65°C, at a nozzle angle of attack of 30° and a standoff distance of 23 mm. Although there
was a small amount of mask under-etching, the first-pass profile provided an erosive efficacy
distribution that accurately predicted the shapes of all the channel profiles.
-120
-100
-80
-60
-40
-20
0
20
0 50 100 150 200 250 300z
(µm
)
x
(µm)
First Pass
Second Pass
Fourth Pass
Sixth Pass

74
Figure 5-5 Predicted (solid lines) and experimental profiles (data points) for masked channels in
PTFE at -65°C. The mask edge is shown as a dashed line. The experimental first pass was used
to fit the erosive efficacy (Eq. (2-11)) across the mask opening.
The steep sidewalls shown in Fig. 5-5 are expected, as a result of the dominant ductile erosion
mechanism in PTFE when blasting at -65°C. Table 5-4 summarizes the measured and predicted
channel depths and the average erosion rates for the two masked channel surface evolution
experiments in PTFE.
-250
-200
-150
-100
-50
0
50
0 100 200 300 400 500z
(µm
)
x
(µm)
First Pass
Third Pass
Fifth Pass

75
Table 5-4 Percentage error in predicted channel depths in PTFE at two different temperatures.
PTFE
- 65 °C, 30° Angle of Attack
592 µm Mask Spacing
Dosage Method: Nozzle Passes
Passes Predicted Experimental
%
Error
Depth/pass
(µm)
1 45 45 0% 45
3 135 158 15% 57
5 225 230 2% 36
-180°C, 90° Angle of Attack
566 µm Mask Spacing
Dosage Method: Scan Speed
Passes Predicted Experimental
%
Error
Depth/pass
(µm)
1 16 16 0% 16
2 32 36 11% 20
4 64 69 7% 17
6 96 90 -7% 11
Table 5-4 shows that the material removed per scanning pass was relatively constant within a
given experiment, indicating that there was no incubation period in any of the four cases.
5.2.4 Profile Shapes
Channel profile shapes play a major role in the flow characteristics of microfluidic
channels [7]. Micro-channels fabricated using AJM tend to show steep sidewalls in ductile
materials and more V-shaped profiles in brittle materials. This is due to the different angle
dependency of erosion in brittle and ductile materials. Since ductile materials show maximum
erosion at shallow angles, the sidewalls tend to rapidly become steep, while for brittle materials,
erosion is typically maximum at high angles of attack so that sloped surfaces erode more slowly
compared to flat bottoms. Figure 5-6 shows a comparison of the channel profiles resulting from
AJM of the various tested materials. To allow a direct comparison of profile shapes, they have
been normalized to their maximum depth and mask opening width (i.e. z*=z/zmax, x*=x/w). The
glass channel was blasted at 200 kPa and room temperature whereas the more ductile PDMS and
PTFE channels were both blasted at 400 kPa and -180°C and 320 kPa and -65°C. Even at such

76
low temperatures, the steeper sidewalls in both the PDMS and PTFE samples, when compared to
the profile in glass, indicate there was still a significant amount of ductile erosion in these cases.
This is consistent with the shapes of the G(α) curves for each polymer [53] that indicate that
erosion mechanisms are still not fully brittle at the lowest cryogenic temperature of -180°C.
Figure 5-6 Normalized profile shapes in glass (room temperature), PDMS and PTFE (-180°C
and -65°C). Actual channel depths in brackets. PDMS profiles are the deepest ones from Figs 4-9
and 4-10. PTFE profile at -180°C from a single channel blasted at 400 kPa with a scan speed of 1
mm/s. PTFE profile at -65°C from Fig. 5-5.
5.2.5 Surface Morphology and Particle Embedding in PTFE
The initially white PTFE became dark grey after blasting with the light grey 25 µm
aluminum oxide particles at room temperature. Some authors have suggested that this
discoloration is due to particle embedding [4], while other authors have suggested that the
discoloration is caused by heat generation due to particle impact [57]. Below shows three
channels blasted at room temperature at a 60, 75 and 90° angle of attack (the darkest channel
being at 90°).
-1.2
-1
-0.8
-0.6
-0.4
-0.2
0
0 0.2 0.4 0.6
ZN
orm
x*
Glass 17°C(254 µm)
PDMS -180°C (226 µm)
PTFE -180°C (170 µm)
PTFE -65°C (230 µm)
PDMS - 65°C (46 µm)

77
Figure 5-7 Particle embedding in PTFE at 17°C and 60, 75 and 90° nozzle angle of
attack.
Figure 5-8 shows a backscatter image of the four PTFE samples used to obtain the results
of Fig 5-1. Only the channels which were blasted at a 90° angle of attack were used.

78
a) b)
c) d)
Figure 5-8 Backscatter image of aluminum oxide (white dots) embedded in Teflon at a)17°C
(140 m/s), b)-182°C (49 m/s), c) -107°C (36 m/s), d) -76°C (58 m/s).
More particles were embedded at room temperature, but no significant difference in particle
embedding was seen at the cryogenic blasting temperatures. This suggests that the progressive
erosion increase in PTFE at the three lower temperatures was not caused by a decrease in particle
embedding. The relatively large amount of embedding at room temperature is consistent with [4]
which found that PTFE cannot be machined at room temperature due to particle embedding.
17°C
-182°C -107°C
-76°C
100 µm 100 µm
100 µm 100 µm

79
Further investigation is necessary to determine the erosion mechanisms present at the different
temperatures and whether or not melting plays a role in impeding erosion at room temperature.
5.2.6 Volume of PTFE Removed Per Unit Kinetic Energy of Erodent
In order to compare the material removal at different particle velocities and mass flow
rates, the volumetric erosion rate of PTFE was normalized by the kinetic energy of the abrasive
particles, as was done in Section 4.3.6. Figure 5-9 shows how material removal in PTFE
depended on the angle of attack and temperature.
Figure 5-9 Volumetric erosion per unit kinetic energy of erodent in PTFE as a function of
temperature and angle of attack.
The erosion of PTFE increased significantly with decreasing temperature (over five times
greater at -182°C), and became much less sensitive to the impact angle.
5.2.7 Temperature Dependence of Erosion in High Carbon Steel
The temperature dependence of erosion in high carbon steel was investigated since it is
arguably the most common mask material used in AJM. Since the dependence of erosion in glass
has previously been shown to be a weak function of temperature, the ratio of the channel depths
0
0.1
0.2
0.3
0.4
0.5
0.6
0 20 40 60 80 100
Vo
lum
e/K
ine
tic
En
erg
y
(mm
3/J
)
Angle of Attack, α
(Degrees)
-71°C
-107°C
-177°C
17°C
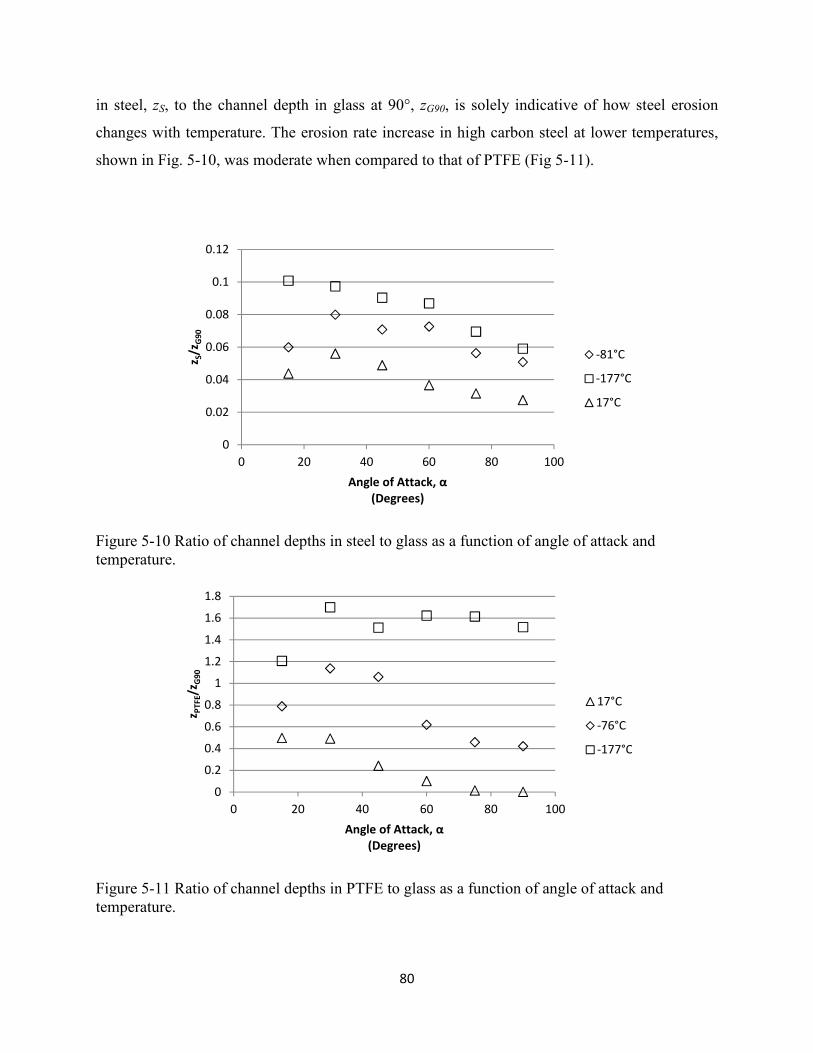
80
in steel, zS, to the channel depth in glass at 90°, zG90, is solely indicative of how steel erosion
changes with temperature. The erosion rate increase in high carbon steel at lower temperatures,
shown in Fig. 5-10, was moderate when compared to that of PTFE (Fig 5-11).
Figure 5-10 Ratio of channel depths in steel to glass as a function of angle of attack and
temperature.
Figure 5-11 Ratio of channel depths in PTFE to glass as a function of angle of attack and
temperature.
0
0.02
0.04
0.06
0.08
0.1
0.12
0 20 40 60 80 100
z S/z
G9
0
Angle of Attack, α
(Degrees)
-81°C
-177°C
17°C
0
0.2
0.4
0.6
0.8
1
1.2
1.4
1.6
1.8
0 20 40 60 80 100
z PT
FE/z
G9
0
Angle of Attack, α
(Degrees)
17°C
-76°C
-177°C

81
At 90° angle of attack, the erosion rate increased by a factor of two. This is similar to the
increase of 1.7 reported in [31] for the erosion increase in steel (ShKh15) when the blasting
temperature was decreased from 20°C to -150°C.
The erosion rate of the high carbon steel samples reached a minimum at α= 90°, and only
moderately increased with a decrease in temperature while the erosion in PTFE was maximum at
α= 90° and -177°C (Fig. 10). Thus, in order to obtain a maximum erosion rate while
performing masked CAJM in PTFE while also limiting the mask erosion, the CAJM should be
performed at α= 90° at T=-177°C.
5.3 Summary of Findings and Results
The maximum erosion rates occurred in PTFE at the lowest blasting temperature of -
182°C between the angles of 30° and 90°. Since the G(α) of high carbon steel showed a weak
dependency on temperature and erosion only increased by a factor of approximately 2 when the
steel mask material was exposed to the -182°C jet, this is also the scenario which maximizes
mask life while keeping high erosion rates in the PTFE.
The shapes of the G(α) curves for PTFE suggest that erosion is still a mixture of brittle
and ductile mechanisms even at the coldest jet temperatures. Figure 5-4 confirms this by
showing the still relatively steep sidewalls in the masked channels of PTFE when compared to
the sidewall slopes of glass.
Surface evolution predictions of machining at -65 and -181°C showed good agreement
with experimental results which suggests that no incubation period or significant amount of
particle occurs at these scenarios.
After post machining analysis of the PTFE samples, it was concluded that a decrease in
particle embedding is not responsible for the increase in erosion seen at the cryogenic jet
temperatures. As was seen in a previous study [4], particle embedding is proposed to be the
mechanism which reduces erosion at room temperature. Further study is required to determine if
melting occurs in PTFE during erosion at room temperature. Also, the erosion mechanisms
which exist at the various machining temperatures remain unknown.

82
6 Conclusions
The dominant erosion mechanism in PDMS at temperatures of -82°C and -127°C appears
to be ductile, because the normalized erosion rate, G(α), shows maximum erosion at angles of
attack below 20°. The G(α) curve for -178°C shows a maximum erosion rate in the range of 30-
60°, indicating a more brittle erosion mechanism below the glass transition temperature which is
in the vicinity of -120°C. The presence of microcracks in Fig 4-15e also suggested a brittle
erosion mechanism at the coldest temperature of -178°C.
Glass channel depths at 90° were an effective way of inferring the velocity at the
centreline of the jet at various temperatures. Glass reference channels machined at other impact
angles during each PDMS, PTFE and steel erosion rate measurement, provided an accurate way
of obtaining the G(α) curves that was independent of fluctuations in the mass flow rate.
The first pass profile fit to the erosive efficacy of the jet using a seventh order polynomial
resulted in good surface evolution predictions in PDMS. The largest error in channel depth
prediction for PDMS occurred at the warmest jet temperature, because of increased particle
embedding.
The efficiency of PDMS machining, expressed as volume removal per unit kinetic
energy, increased markedly below the glass transition of PDMS, being maximum between 30°
and 60° angle of attack at approximately -178°C.
The profile shape of a masked channel in PDMS at -180°C shows there is a decrease in
erosion near the mask edge. This causes initially narrower channels at small particle dosages (i.e.
first and second pass) which render the first pass fit method inadequate for the deeper channels.
Fitting the erosive efficacy using a pass which is beyond this particle dosage results in better
predictions of the deeper profile shapes. Preconditioning the surface by removing 20 µm
appeared to have no effect on decreasing this effect. The remaining channels machined in PDMS
(-65°C at 15°) and PTFE (-180°C at 90° and -65°C at 30°) showed good agreement with the
predictions of Eq.(4-7). This indicated that no incubation period or effect of particle shielding or
embedding occurred at these conditions.
The shapes of the G(α) curves for PTFE and PDMS both suggest that erosion is still a
mixture of brittle and ductile mechanisms even at the coldest jet temperatures. Figure 5-6
confirms this by showing the still relatively steep sidewalls in the masked channels of both
polymers when compared to the sidewall slopes of glass.

83
Maximum erosion rates occur in PTFE at the lowest blasting temperature of -182°C
between the angles of 30° and 90°. Since G(α) of high carbon steel shows a weak dependency on
temperature and erosion only increases by a factor of about 2 when the steel mask material is
exposed to the -182°C jet, this is also the scenario which maximizes mask life while keeping
high erosion rates in the PTFE.
After post machining analysis of the PTFE samples, it was concluded that a decrease in
particle embedding is not responsible for the increase in erosion seen at the cryogenic jet
temperatures, but rather a change in the material properties of the polymer caused by the
transition temperatures shown in Table 5-3. As was seen in a previous study [4], particle
embedding is proposed to be the mechanism which deters erosion at room temperature.
6.2 Recommendations for Future Work
Erosion as a function of temperature has been investigated for two materials which have
potential in microfluidics. Many aspects of this research can be investigated further:
• The mechanisms of erosion in PTFE at the various machining temperatures remain
unknown. It is also suspected that melting is responsible for impeding erosion at room
temperature in PTFE. Strong evidence for melting still has not been found.
• Microfluidic chips require smooth channels for predictable flow. Further investigation is
warranted for determining how temperature and angle of attack can be used to minimize
surface roughness.
• The effect of temperature on the erodent particles themselves should be quantified. If
particles fracture upon hitting the substrate surface, energy is wasted which could
otherwise contribute to erosion. It would be of interest to determine what type of erodent
material is most effective at such low temperatures.
• Confirming the actual heat transfer coefficient of the jet at the various temperatures
would be beneficial so that a finite element analysis could be performed to determine the
temperature field within the polymer. Either a bank of tightly spaced micro
thermocouples with a high acquisition rate or a thermal imaging camera could be used to
confirm the results.

84
• The behavior of polymeric mask material at the colder jet temperatures could also be
investigated since lithographic patterning is a much more efficient mask patterning
method as opposed to machining metal masks. In particular, it would be useful to study
whether a polymeric mask material can be easily patterned and still erosion resistant at
even the coldest jet temperature of -196°C.
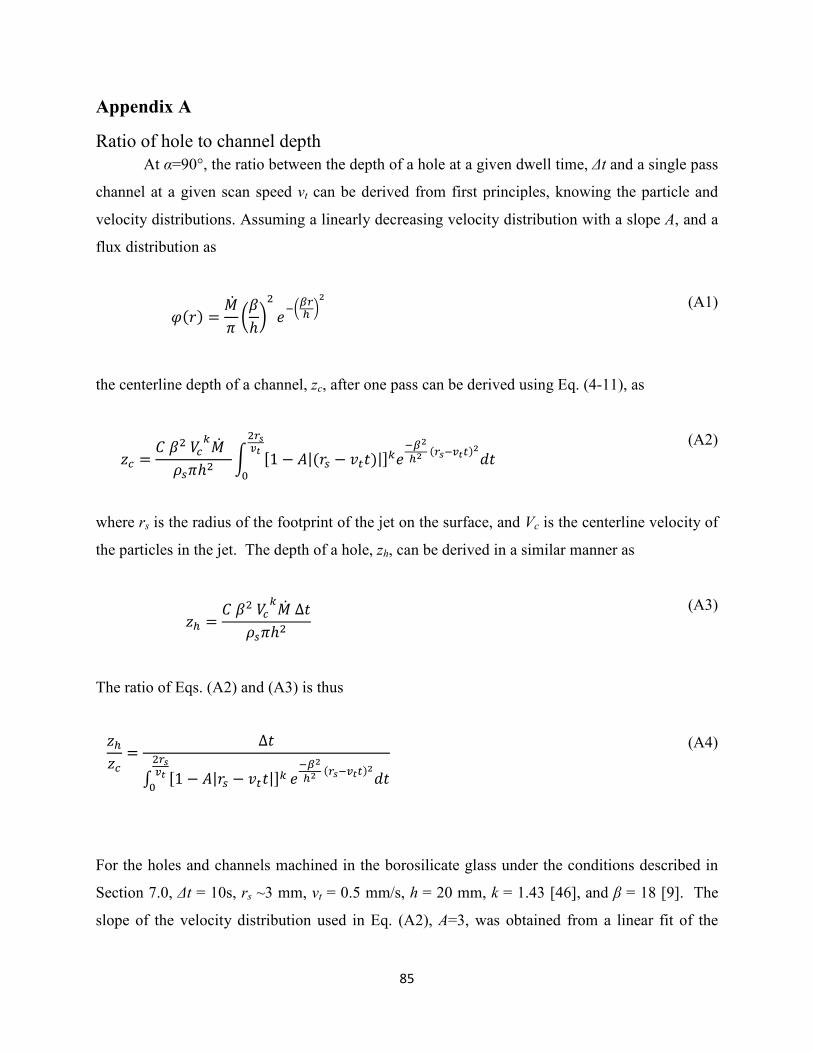
85
Appendix A
Ratio of hole to channel depth
At α=90°, the ratio between the depth of a hole at a given dwell time, ∆t and a single pass
channel at a given scan speed vt can be derived from first principles, knowing the particle and
velocity distributions. Assuming a linearly decreasing velocity distribution with a slope A, and a
flux distribution as
9�F � NOP QRTU� VQWYZ U'
(A1)
the centerline depth of a channel, zc, after one pass can be derived using Eq. (4-11), as
1] � <R��]�NO �8PT� } s1 $ ~|�F8 $ ��q|u�VW'Z' �Y����'pq�Y����
(A2)
where rs is the radius of the footprint of the jet on the surface, and Vc is the centerline velocity of
the particles in the jet. The depth of a hole, zh, can be derived in a similar manner as
1Z � <R��]�NO ∆q�8PT� (A3)
The ratio of Eqs. (A2) and (A3) is thus
1Z1] � ∆q� s1 $ ~|F8 $ ��q|u�VW'Z' �Y����'pq�Y����
(A4)
For the holes and channels machined in the borosilicate glass under the conditions described in
Section 7.0, ∆t = 10s, rs ~3 mm, vt = 0.5 mm/s, h = 20 mm, k = 1.43 [46], and β = 18 [9]. The
slope of the velocity distribution used in Eq. (A2), A=3, was obtained from a linear fit of the

86
Particle tracking velocimetry (PTV) results of [9]. From Eq. (30), zh/zc = 2.92 and is compared to
the measured hole depth versus channel depth relationship in Fig 4-3.
Each data point in Fig. 4-3 was obtained by changing the velocity of the particles, by adjusting
the blasting pressure. The solid line with slope of 2.19 represents the least squares best fit of the
measured data, and the dashed line with slope of 2.92 is from Eq. (A2).
The slightly poorer agreement at the higher channel depths may be due to a nozzle focus
coefficient that does not remain constant over the range of velocities considered.
It is noted that knowing the maximum velocity, the average velocity in the jet, Vave can be
obtained as
���� � � �� �1 $ ~ YZ� 2 �WZ�� FV���� �'pFY�� (A5)
Appendix B
Dependence of Erosion on the Slope of the Surface at the Leading Edge of the
Abrasive Jet
Surface topography in AJM is dictated by controlling the amount of particle impacts, aka
particle dosage, the feature is exposed to. Particle dosage can be controlled by scanning the
nozzle over the surface multiple times or by changing the scan speed of the nozzle. Changing the
nozzle scan speed is a much more versatile method since consecutive dosages do not have to be a
multiple of the initial single pass dose. As Eq. (4-6) indicates, the erosion rate depends on the
angle of particle impact, α. Since the slope of the material along the scanning direction at the
leading edge of the channel varies with the depth of the channel, z, machined in a single pass, the
apparent measured erosion rate may be affected by the method used to control dose. Since both
methods were used in the following experiments, it must be confirmed that both will give the
same amount of erosion for a specific particle dosage. Figure B-1 shows an example of the slope
at the leading edge for a shallow and a deep channel made using a single pass at different scan
speeds, vt (1 mm/s and 0.2 mm/s). The slope of the leading edge for the deep channel would be
similar to the slope of the leading edge for the method of altering dosage by the nozzle scan
speed. The shallow channel would have a slope similar to the channel which used nozzle passes
to control the dose of particles.
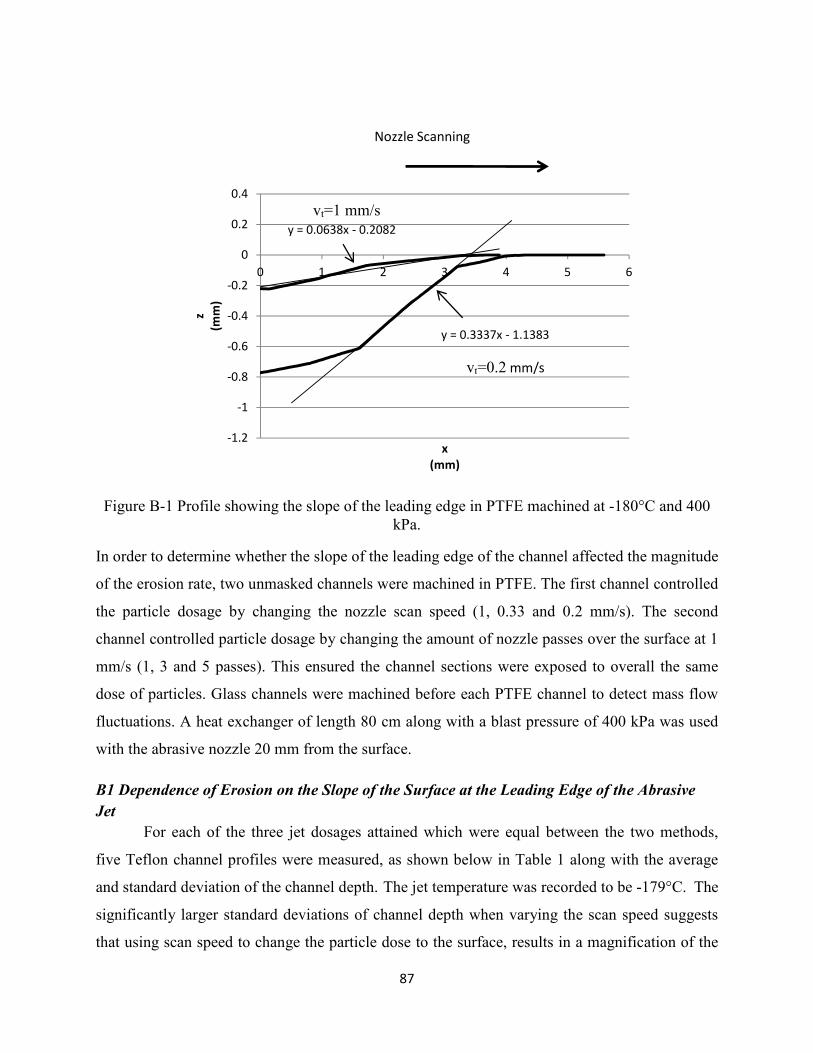
87
Figure B-1 Profile showing the slope of the leading edge in PTFE machined at -180°C and 400
kPa.
In order to determine whether the slope of the leading edge of the channel affected the magnitude
of the erosion rate, two unmasked channels were machined in PTFE. The first channel controlled
the particle dosage by changing the nozzle scan speed (1, 0.33 and 0.2 mm/s). The second
channel controlled particle dosage by changing the amount of nozzle passes over the surface at 1
mm/s (1, 3 and 5 passes). This ensured the channel sections were exposed to overall the same
dose of particles. Glass channels were machined before each PTFE channel to detect mass flow
fluctuations. A heat exchanger of length 80 cm along with a blast pressure of 400 kPa was used
with the abrasive nozzle 20 mm from the surface.
B1 Dependence of Erosion on the Slope of the Surface at the Leading Edge of the Abrasive
Jet
For each of the three jet dosages attained which were equal between the two methods,
five Teflon channel profiles were measured, as shown below in Table 1 along with the average
and standard deviation of the channel depth. The jet temperature was recorded to be -179°C. The
significantly larger standard deviations of channel depth when varying the scan speed suggests
that using scan speed to change the particle dose to the surface, results in a magnification of the
y = 0.0638x - 0.2082
y = 0.3337x - 1.1383
-1.2
-1
-0.8
-0.6
-0.4
-0.2
0
0.2
0.4
0 1 2 3 4 5 6
z
(mm
)
x
(mm)
Nozzle Scanning
vt=0.2 mm/s
vt=1 mm/s

88
mass flow fluctuations. Table B1 shows that altering the dose by changing the number of passes
averages out the mass flow fluctuations and provides much more consistent channel depths than
changing the scan speed
Table B1 – Channel depths for two different dosage methods.
Varying Scan Speed
Scan Speed (mm/s)
1 0.33 0.2
Dose
(kg/m2) 90.2 273 451.2
Channel
Depth
(µm)
137 376 584
146 295 538
102 412 533
161 260 568
139 421 451
Avg 137 352.8 534.8
SD 21.71405 71.84497 51.37801
Varying Number of Channel
Passes
1 3 5
Dose
(kg/m2) 90.2 273 451.2
Channel
Depth
(µm)
138 372 496
139 354 529
109 335 509
144 309 467
116 333 499
Avg 129.2 340.6 500
SD 15.61089 23.73394 22.51666
The particle dose for each method, as shown in Table B1, can be confirmed to be equal by using
the particle mass flux distribution found by Ghobeity et al.
�:�V � �OD �WXZ �� � VW'�������� �'����� (B1)
89
where NO is the mass flow rate (kg/s), βw is the flow focus coefficient (9), h is the nozzle standoff
distance (0.023 m), rs is the scar radius of the jet (0.002 m) and vt is the scan speed of the
substrate. Using a scan speed of 1 mm/s results in a dose of 90.2 kg/m2 whereas a scan speed of
0.33 mm/s gives a dose of 273.4 kg/m2. This clearly shows that three nozzle passes at 1 mm/s
will therefore be given the same dose as a single pass at 0.33 mm/s. The dose at 0.2 mm/s was
calculated to be 451.2 kg/m2.
A glass channel was machined before each of the Teflon channels in order to reveal the
magnitude of the mass flow fluctuations. Four profiles were taken every 10 mm along both 50
mm glass channels. The average channel depth was 121.12 µm with a standard deviation of 16.1
µm.
Although the standard deviations of channel depth for each dosage method are clearly
different, performing a t-test at a 95% confidence interval on the data from Table B1 shows there
is no statistically significant difference between the average depths of the two dosage methods.
Getu et al. attributed a difference of erosion for the forward and backwards scanning orientation
to particle embedding. It was suspected that the leading edge profile shape affected the amount
of particle embedding. Shipway et al. [27] have suggested that the level of particle embedding is
a function of the particle impulse which is related to the normal component of velocity with
respect to the surface. Since minimal particle embedding is seen in PTFE at the low temperature
of -180°C (Fig 5-6), it is suspected that the profile of the leading edge of the channel has a
minimal effect on erosion.

90
8.0 References
[1] Getu H., Ghobeity A., Spelt J.K., Papini M., “Abrasive Jet Micromachining of Acrylic and
Polycarbonate at Oblique Angles of Attack”, Wear, 265 (2008), 888-901.
[2] Iliescu C., Tay F.E.H., “Wet Etching of Glass”, Semiconductor Conference, 1 (2005) 35-44.
[3] Getu H., Spelt J.K., Papini M., “Cryogenically assisted abrasive jet micromachining of
polymers”, Journal of Micromechanics and Microengineering, 18 (2008) 115010.
[4] Getu H., Ghobeity A., Spelt J.K., Papini M., “Abrasive jet micromachining of
polymethylmethacrylate”, Wear, 263 (2007) 1008-1015.
[5] Natarajan S., Chan-Yen D.A., Gale B.K., “Large-area, high-aspect-ratio SU-8 molds for the
fabrication of PDMS microfluidic devices”, Journal of Micromechanics and Microengineering,
18 (2008) 045021.
[6] Ren K., Dai W., Zhou J., Su J., Wu H., Whole-Teflon microfluidic chips, Proceedings of the
National Academy of Sciences. http://www.physorg.com/news/2011-05-smooth-teflon-
microfluidic-chips.html
[7] Starkweather, H.W., “Melting and Crystalline Transitions in Normal Perfluoroalkanes and
Poly(tetrafluoroethylene), Macromolecules, 19(1986), 1131-1134.
[8] Dyment J., Ziebland H., “The tensile properties of some plastics at low temperature”, Journal
of Applied Chemistry, 8(1958), 203-206)
[9] Burzynski T., Papini M., “Measurement of the particle spatial and velocity distributions in
micro-abrasive jets”, Measurement Science and Technology, 22 (2011), 025104.
[10] Z. Feng, A. Ball. “The Erosion of Four Materials Using Seven Erodents – Towards an
Understanding” Wear,Vol 233-235, pp 674-684, 1999.
[11] Y.I. Oka, M. Matsumara, T. Kawabata. “Relationship Between Surface Hardness and
Erosion Damage Caused by Solid Particle Impact” Wear, Vol 162-164, pp 688-695, 1993.
[12] Walley S.M., Field J.E., “The Erosion and Deformation of Polyethylene by Solid-Particle
Impact”, Phil. Trans. R. Lond., 321 (1987), 277-303.
[13] Arnold J.C., Hutchings I.M., “A model for the erosive wear of rubber at oblique impact
angles”, Applied Physics Conference Paper, 25 (1991) A222 – A229.
[14] Arnold J.C., Hutchings I.M., “Erosive wear of rubber by solid particles at normal
incidence”, Wear, 161(1993) 213-221.
[15] Hutchings I.M., Deuchar D.W.T., “Erosion of unfilled elastomers by solid particle impact”,
Journal of Materials Science, 22 (1987) 4071-4076.

91
[16] Besztercey, G., Karger-Kocsis J., Szaplonczay P., “Solid particle erosion of electrically
insulating silicon and EPDM rubber compounds”, Polymer Bulletin, 42 (1999) 717-724.
[17] Harsha A.P., Thakre A.A., “Investigation on solid particle erosion behavior of
polyetherimide and its composites”, Wear, 262 (2007) 807-818.
[18] Zahavi J., Schmitt G.F., “Solid particle erosion of polymeric coatings”, Wear, 71 (1981)
191-210.
[19] Barkoula N.-M., Karger-Kocsis J., “Review Processes and influencing parameters of the
solid particle erosion of polymers and their composites”, Journal of Material Science, 37 (2002),
3807-3820.
[20] Oka Y.I., Ohnogi H., Hosokawa T., Matsumura M., “The impact angle dependence of
erosion damage caused by solid particle impact.”, Wear, 203-204 (1997), 573-579.
[21] W.D. Callister. “Materials Sceince and Engineering An Introduction” John Wiley and Sons,
2003.
[22] R.F. Boyer “Dependence of mechanical properties on molecular motion in polymers”
Polymer Engineering and Science, Vol 8, pp 161-186, 1968.
[23] E. Sanchez-Gonzalez, P. Miranda, J.J.M Martinez, F. Guiberteau, A. Pajares “Temperature
dependence of mechanical properties of alumina up to the onset of creep” Journal of the
European Ceramic Society, Vol 27, pp 345-349, 2007.
[24] R. Khanna, B. Basu “Low friction and severe wear of alumina in cryogenic environment: A
first report” Journal of Materials Research, Vol 21, pp 832-844, 2006.
[25] Boonkkamp J.H.M.T.T., Jansen J.K.M., “An analytical solution for mechanical etching of
glass by powder blasting”, Journal of Engineering Mathematics, 43 (2002) 385-399.
[26] Ghobeity A., Getu H., Papini M., Spelt J.K., “Surface evolution models for abrasive jet
micromachining of holes in glass and polymethylmethacrylate (PMMA)”, Journal of
Micromechanics and Microengineering, 17 (2007) 2175 – 2185.
[27] Shipway P.H., Fowler G., Pashby I.R., “Characteristics of the surface of a titanium alloy
following milling with abrasive waterjets”. Wear, 258 (2005), 123-132.
[28] Shipway, P.H., Weston D.P., “Thermal effects in blasting and erosion of polymeric
materials” Journal of Materials Processing Technology, 209 (2009) 6161-6167.
[29] Ghobeity A., Ciampini D., Papini M., “An analytical model of the effect of particle size
distribution on the surface profile evolution in abrasive jet machining”, Journal of Materials
Processing Technology, 209 (2009), 6067-6077.

92
[30] Getu H., Spelt J.K., Papini M., “Thermal analysis of cryogenically assisted abrasive jet
micromachining of PDMS”, International Journal of Machine Tools and Manufacture,
51(2011), 721-730.
[31] Urbanovich L.I., Kramchenkov E.M., Chunosov Y.N., “Investigation of Low-Temperature
Gas-Abrasive Erosion”, Soviet Journal of Friction and Wear, 13 (1992), 80-83.
[32] Urbanovich L.I., Kramchenkov E.M., “Erosion of Steels and Alloys in Their Collision with
a Flux of Abrasive Particles”, Journal of Engineering Physics, 72 (1999), 519-525.
[33] Muju M.K., Pathak A.K., “Abrasive Jet Machining of Glass at Low Temperature”, Journal
of Mechanical Working Technology, 17 (1988) 325-332.
[34] F.P. Incropera, D.P. Dewitt. “ Fundamentals of Heat and Mass Transfer” John Wiley and
Sons, 2002.
[35] D.T. Vader, G. Chrysler, R. Chu, R.E. Simons “Experimental Investigation of Subcooled
Liquid Nitrogen Impingement Cooling of a Silicon Chip” Transactions on components,
packaging, and manufacturing technology, Vol 18, pp 788-795, 1995.
[36] V. Drach, J. Fricke. “Transient Heat Transfer from Smooth Surfaces into Liquid Nitrogen”
Cryogenics, Vol 36, pp 263-269, 1996.
[37] M. Kida, Y. Kikuchi, O. Takahashi, I. Michiyoshi. “Pool Boiling Heat Transfer in Liquid
Nitrogen” Journal of Nuclear Science and Technology, Vol 18. pp 501-513, 1981.
[38] H. Zhang, S. Wong, J. Wang “Experimental study on boiling flow in liquid nitrogen in
inclined tubes – Velocities and length distribution of Taylor bubbles” Journal of the Taiwan
Institute of Chemical Engineers, Vol 40, pp 431-438, 2009.
[39] G. Hetsroni, A. Mosyak, Z. Segal, G. Ziskind. “Uniform Temperature Heat Sink for Cooling
of Electronic Devices” International Journal of Heat and Mass Transfer, Vol 45, pp 3275-3286,
2002.
[40] H.Y. Wu, P. Cheng, H. Wang. “Pressure Drop and Flow Boiling Instabilities in Silicon
Microchannel Heat Sinks” Journal of Micromechanics and Microengineering, Vol 16, pp 2138-
2146, 2006.
[41] S.L. Qi, P. Zhang, R.Z. Wang, L.X. Xu, “Flow boiling of liquid nitrogen in microtubes: Part
I – The onset of nucleate boiling, two phase flow instability and two phase pressure drop”
International Journal of Heat and Mass Transfer, Vol 50. 2007.
93
[42] R. Chu, “A review of IBM sponsored research and development projects for computer
cooling”. IEEE SEMI-THERM Symposium. 1999
[43] L. Huang, M.S. El-Genk “Heat transfer of an impinging jet on a flat surface” International
Journal of Heat and Mass Transfer, Vol 37, pp 1915-1923, 1994.
[44] H. Martin, “Heat and Mass Transfer Between Impinging Gas Jets and Solid Surfaces”
Advances in Heat Transfer, Vol 13, pp 1-59, 1977.
[45] Whitesides G.M., “The origins and future of microfluidics”, Nature, 442 (2006) 368-373.
[46] Ghobeity A., Krajac T., Burzynski T., Papini M., Spelt J.K., “Surface evolution models in
abrasive jet machining”, Wear, 264 (2008), 185-198.
[47] Ghobeity A., Getu H., Krajac T., Spelt J.K., Papini M., “Process repeatability in abrasive jet
micro-machining”, Journal of Materials Processing Technology, 190 (2007), 51-60.
[48] Ciampini D., Papini M., “A cellular automata and particle-tracking simulation of abrasive
jet micromachining that accounts for particle spatial hindering and second strikes”, Journal of
Micromechanics and Microengineering, 20 (2010) 045025.
[49] Aguilar G., Majaron B., Verkruysse W., Zhou Y., Nelson J.S., Lavernia E.J., “Theoretical
and experimental analysis of droplet diameter, temperature, and evaporation rate evolution in
cryogenic sprays”, International Journal of Heat and Mass Transfer, 44 (2001), 3201-3211.
[50] Bar G., Brandsch R., “Effect of Viscoelastic Properties of Polymers on the Phase Shift in
Tapping Mode Atomic Force Microscopy”, American Chemical Society, 14 (1998) 7343-7347.
[51] Clarson S.J., Dodgson K., Semlyen J.A., “Studies of cyclic and linear
poly(dimethylsilxones): 19. Glass transition temperatures and crystallization behaviour”,
Polymer, 26 (1986) 244-245.
[52] Wensink H., Jansen H.V., Berenschot J.W., Elwenspoek M.C., “Mask materials for powder
blasting”, J. Micromech. Microeng., 10 (2000), 175-180.
[53] Gradeen A.G., Spelt J.K., Papini M., “Cryogenic abrasive jet machining of
Polydimethylsiloxane at different temperatures”, Wear, Accepted.
[54] Blumm J., Lindemann A., Meyer M., Strasser C., Characterization of PTFE using advanced
thermal analysis techniques.
[55] Mark, J. “Polymer Data Handbook”, Oxford Press, New York (1999).
[56] Antipov V.I., Vinogradov L.U., Lazarev E.M., Mukhina Y.E., Antoshchenkov A.E.,
Doronin D.I., Lukina Y.A., Kochetova I.V., “Increasing the Hardness of ShKh15 Steel in Its
Products”, Russian Metallurgy, 4(2009), 334-337.

94
[57] Rao P.V., Young S.G., Buckley D.H., “Solid spherical glass particle impingement studies of
plastic materials” 1983 NASA Tech. Paper 2161 (National Aeronautics and Space
Administration)
[58] P.J. Slikkerveer, F.H. in’t Veld. “Model for Patterned Erosion” Wear, Vol 233-235, pp 377-
386, 1999.