crystallin distribution patterns in concentric layers from toad eye lenses
TRANSCRIPT
RESEARCH ARTICLE
Crystallin distribution patterns in concentric layers from
toad eye lenses
Jonathan Keenan1, Giuliano Elia2, Michael J. Dunn3, David F. Orr1
and Barbara K. Pierscionek1
1 School of Biomedical Sciences, University of Ulster, Coleraine, UK2 Mass Spectrometry Resource, UCD Conway Institute of Biomolecular and Biomedical Research,
University College Dublin, Dublin, Ireland3 Proteome Research Centre, UCD Conway Institute of Biomolecular and Biomedical Research,
School of Medicine and Medical Sciences, University College Dublin, Dublin, Ireland
Received: December 29, 2008
Revised: August 26, 2009
Accepted: September 1, 2009
Protein distribution patterns across eye lenses from the Asiatic toad Bufo gargarizans were
investigated and individual crystallin classes characterised. Special fractionation that follows
the growth mode of the lens was used to yield nine fractions corresponding to layers laid
down at different chronological (developmental) stages. Proportions of soluble and insoluble
crystallins within each fraction were measured by Bradford assay. Water-soluble proteins in
all fractions were separated by size-exclusion HPLC and constituents of each class further
characterised by electrophoresis, RP-HPLC and MS analysis. In outer lens layers, a-crystallin
is the most abundant soluble protein but is not found in soluble proteins in the lens centre.
Water-soluble b-crystallins also decrease from their highest level in the outer lens to negli-
gible mounts in the central lens. The proportion of soluble g-crystallin increases significantly
towards the lens centre where this is the only soluble protein present. Insoluble protein levels
increase significantly towards the lens centre. In B. gargarizans lenses, as with other anurans,
the predominant water-soluble protein class is g-crystallin. No taxon-specific crystallins were
found. The relationship between the protein distribution patterns and the functional prop-
erties of the lens this species is discussed.
Keywords:
Animal proteomics / Bufo gargarizans / Electrophoresis / Eye lens / LC / MS /
Protein distribution patterns.
1 Introduction
The vertebrate eye lens carries out a similar function in all
species but remains a structure of intense interest from an
evolutionary perspective [1, 2]. The lens remains transparent
because of the organization of major structural proteins, the
lens crystallins, which play a crucial role in maintaining the
refractive properties of the lens [1, 3–6]. Active metabolic
pathways in the lens are important in protecting against
post-translational modifications [7].
Although the common crystallins (a, b and g) are present
in all vertebrate lenses, taxon-specific crystallins, of which
d-crystallin is the most extensively studied, exist only in
particular species [2, 8–11]. These crystallins have also been
termed enzyme-crystallins because of their sequence simi-
larity to metabolic enzymes [10].
In amphibian lenses,g-crystallin is the main protein class
[12–14]. Amphibian lens crystallins have been studied to a
much lesser extent than mammalian crystallins. Taxon-
specific crystallins are present in lenses of particular species.
In frog lenses of genera Rana, the taxon-specific protein
r-crystallin has been isolated. This protein is a monomeric
crystallin with a molecular weight around 37 kDa [15–19].
z-crystallin, originally detected in guinea pig eye lenses hasAbbreviations: HMW, high molecular weight; LMW, low mole-
cular weight; MMW, middle molecular weight
Correspondence: Professor Barbara K. Pierscionek, School of
Biomedical Sciences, University of Ulster, Cromore Road,
Coleraine, BT52 1SA, UK
E-mail: [email protected]
Fax: 144-2870-324965
& 2009 WILEY-VCH Verlag GmbH & Co. KGaA, Weinheim www.proteomics-journal.com
5340 Proteomics 2009, 9, 5340–5349DOI 10.1002/pmic.200800986

also been found to be present in Japanese tree-frog (Hylajaponica) lenses [20, 21].
Fewer studies have focused on toad eye lenses. Early studies
using Bufo bufo lenses concentrated for the most part on the
soluble lens protein [14]. de Jorge et al. (1970) found an
accumulation of sodium, magnesium and phosphorus in
cataractous lenses of Bufo marinus icterius toads [22]. More
recently, Roll compared lenses from different amphibian
species including Bufo bufo and several reptilian lenses, find-
ing taxon-specific proteins in only Rana temporaria and
Triturus vulgaris lenses [19]. A study into the major corneal
proteins of the Indian toad (Bufo melanostictus) found taxon-
specific a-enolase/t-crystallin in the lens; this had previously
been seen in turtle, duck, lamprey and crocodile lenses [23–27].
Differing results therefore exist regarding the presence of
taxon-specific crystallins in toad lenses of genera Bufo.
Unlike other ocular tissues, the lens continues to grow
throughout life accumulating fibres with little or no protein
turnover. As a result, the lens retains a chronological record
of changes and this renders the lens an ideal tissue for
studying changes that have occurred with development and
ageing. The fractionation technique used in this paper was
originally developed by Pierscionek and Augusteyn to study
chronological changes across human lenses [28]. It has since
been used in studies involving bovine, human, fish and
porcine lenses to examine changes in the protein distribu-
tion patterns with growth and ageing [28–32].
This paper presents an investigation of protein distribu-
tion patterns across the lens of the toad Bufo gargarizans.The crystallin classes have been identified and characterised.
2 Materials and methods
Two lenses were obtained from a 3-year-old Asiatic toad
(B. gargarizans) that had been sacrificed, at the University of
Ulster, for purposes not involved with these investigations.
The lenses were weighed and used immediately after
enucleation. All investigations were carried out at room
temperature unless otherwise stated.
2.1 Lens protein fractionation
The capsule, which envelops the lens, was removed; this
semi-elastic membrane peels off the lens material easily
without any tissue adhesion or loss. Successive concentric
fractions of each lens were isolated through step-wise disso-
lution by gentle agitation in 1 mL of 0.1 M phosphate buffer
(pH 7.3). Using this method, nine extracts were obtained for
each lens in a manner previously described [28–32].
Each extract was then centrifuged at 11 000 g for 20 min
at 41C to separate water-soluble from water-insoluble
protein. The water-insoluble proteins were dissolved in 8 M
urea (which acts to solubilise the water-insoluble fraction)
and protein contents (soluble and insoluble fractions) were
determined by the Bradford assay [33] using BSA as stan-
dard. Measurements of each sample were made in triplicate
and water-soluble and water-insoluble protein contents
expressed as a proportion of total protein in each lens layer.
2.2 Size-exclusion chromatography
Soluble proteins from each lens were separated into high
(HMW), medium (MMW) and low molecular weight (LMW)
fractions by size-exclusion chromatography using a Waters
Biosuite 250 5 mm HR SEC column (7.8� 300 mm) attached
to a Waters HPLC system at a flow rate of 1 mL/min and
detection at 280 nm. 0.1 M phosphate was used as the gel
filtration buffer. All solvents were of HPLC grade. The
column was calibrated using gel filtration standards. At least
two separations were performed on each sample and frac-
tions were collected from each peak. Areas under each peak
were calculated using Waters EmPower software.
2.3 SDS gel electrophoresis
Samples from each chromatographic peak were dried at
room temperature using a Concentrator 5301 (Eppendorf,
Hamburg, Germany). Each preparation was then subjected
to SDS gel electrophoresis by the Laemmli [34] method
using 4–12% NuPAGE Novex Bis-Tris Pre-cast Gels
(10� 10 cm) following the NuPAGE electrophoresis system
protocol (NuPAGE, Invitrogen, Carlsbad, CA, USA). Inso-
luble protein fractions, dissolved in 8 M urea, were also
analysed electrophoretically. Gels were stained with
Coomassie blue (SimplyBlue Safestain; Invitrogen, Carls-
bad, CA, USA).
2.4 2-DE
Soluble protein samples from the outermost lens layer were
also separated by 2-DE. To ensure that sample extracts
contained no contaminants that would interfere with subse-
quent 2-DE, each sample was precipitated in four volumes of
acetone, overnight at –201C and subsequently spun at
14 000 g for 10 min. The resulting pellet was resuspended in a
2-DE compatible lysis buffer (9.5 M Urea; 2% w/v CHAPS;
0.8% v/v Pharmalyte pH 3–10; 1% w/v DTT).
Isoelectric focusing of the sample was carried out on the
IPGphor 3 system (GE Healthcare, Little Chalfont, Bucks,
UK) using IPG strips (24 cm, pH 3–10 NL, Immobiline
Drystrip, GE Healthcare, Little Chalfont, Bucks, UK).
Approximately 100mg of sample was added to the rehydra-
tion buffer (8 M Urea, 0.5% w/v CHAPS, Bromophenol blue
(trace), 0.5% w/v DTT, 0.2% v/v pharmalyte) to give a final
volume of 450 mL. The sample was loaded by passive in-gel
rehydration overnight at room temperature [35]. The
proteins were separated by isoelectric focusing at 0.05 mA/
IPG strip for 75 000 Vh at 201C. Prior to separation by SDS-
PAGE the IPG strips were equilibrated for 15 min in equi-
libration buffer (6 M Urea; 50 mM Tris-HCl, pH 8.8 30% v/v
Proteomics 2009, 9, 5340–5349 5341
& 2009 WILEY-VCH Verlag GmbH & Co. KGaA, Weinheim www.proteomics-journal.com
glycerol; 2% w/v SDS), which contained 10% w/v DTT. This
was followed by equilibration for 15 min in equilibration
buffer containing 25% w/v iodoacetamide. The strips were
loaded onto 15% polyacrylamide gels (1 mm� 24 cm� 22
cm) and the second dimension SDS-PAGE was carried out
overnight using a Protean plus Dodeca system (Bio-Rad,
Hemel Hempstead, Herts, UK) at 151C and 1 W/gel. Spots
were visualised using a silver stain (PlusOne Silver stain, GE
Healthcare, Little Chalfont, Bucks, UK).
2.5 MS analysis
Selected spots revealed by 2-DE were excised for tryptic
digestion, according to the protocol described by Shevchenko
et al. [36]. The resulting tryptic peptides were desalted and
concentrated using ZipTips (Eppendorf) according to the
manufacturer’s instructions. The lyophilized peptides were
dissolved in matrix buffer (70% ACN, 0.1% TFA in MilliQ
water), mixed with 3 mg/mL CHCA and spotted onto a 384-
well MALDI target plate (Applied Biosystems, Foster City,
CA). MALDI-TOF/TOF analysis was carried out with a 4800
MALDI-TOF/TOF Analyzer (Applied Biosystems). MS spec-
tra were acquired by 2000 laser shots from an Nd:YAG laser
operating at 355 nm and 200 Hz. After measuring all samples
in the MS mode, a maximum of 15 precursors per spot were
selected for subsequent fragmentation by CID. The resulting
spectra were processed and analysed using the Global Protein
Server (GPS Explorer) workstation (Applied Biosystems),
which uses internal MASCOT (Matrix Sciences) software for
matching MS and MS/MS data against databases of in silicodigested proteins. The data obtained were screened against a
non-redundant database of all known proteins downloaded
from the Expasy homepage (http://www.expasy.org). The
following analysis settings were used for the identification of
peptides and proteins: (i) precursor tolerance: 30 ppm, (ii)
MS/MS fragment tolerance: 0.2 Da, (iii) maximum missed
cleavages: 2 and (iv) variable modifications: oxidation of
methionine. Protein identifications were considered correct
calls when the confidence interval (CI) was greater than 95%.
2.6 Reverse-phase HPLC
Selected pooled samples of each size-exclusion peak (HMW,
MMW and LMW peaks) were subjected to RP-HPLC frac-
tionation using a 4.6� 150 mm, 5mm analytical Phenomenex
C-8(2) column (Hichrom, Reading, Berks, UK) eluted at a
flow rate of 2 mL/min with a gradient of TFA/water (0.1:99.9,
v/v) to TFA/water/ACN (0.1:19.9:80.0, v/v/v) over 80 min
using a Waters separation system. The column eluent was
monitored simultaneously at 214 and 280 nm and fractions
(1 mL) were collected and numbered at 1 min intervals.
2.7 Molecular mass determination
MALDI TOF-MS was performed on all peaks using an
Applied Biosystems Voyager instrument with delayed
extraction and autosampler (Applied Biosystems, CA, USA).
Samples were prepared by mixing a 1mL aliquot with 1mL of
matrix solution. The matrix solution was made by saturating
a water–ACN (50:50), 0.05% TFA solution with sinapinic
acid. Samples of 1 mL were spotted into wells of the MALDI
sample plate and allowed to air-dry before being placed in
the mass spectrometer. All peptides were analysed in the
linear, positive ion mode by delayed extraction using an
accelerating voltage of 20 kV, unless otherwise noted, giving
0.05% mass accuracy. The limit for detection using this
system was 10 fmol. External calibration was achieved using
a standard ‘‘calibration 2’’ mixture from PE Biosystems.
Mass spectra were obtained on a PerSeptive Voyager-DE
STR MALDI-TOF (Applied Biosystems).
3 Results
Lens wet weights were 0.1334 and 0.1402 g with total protein
contents representing approximately 30 and 32% of the wet
AU
0.00
0.20
0.40
0.60
Minutes
2.00 4.00 6.00 8.00 10.00 12.00 14.00 16.00 18.00 20.0
AU
0.00
0.05
0.10
Minutes
2.00 4.00 6.00 8.00 10.00 12.00 14.00 16.00 18.00 20.0
Minutes
2.00 4.00 6.00 8.00 10.00 12.00 14.00 16.00 18.00 20.0
Minutes
2.00 4.00 6.00 8.00 10.00 12.00 14.00 16.00 18.00 20.0
AU
0.00
0.02
0.04
0.06
AU
0.00
0.02
0.04
0.06
0.08
0.10
669 136 12kDa36 16
Layer 1
HMW MMW LMW
Layer 3
Layer 6
Layer 9
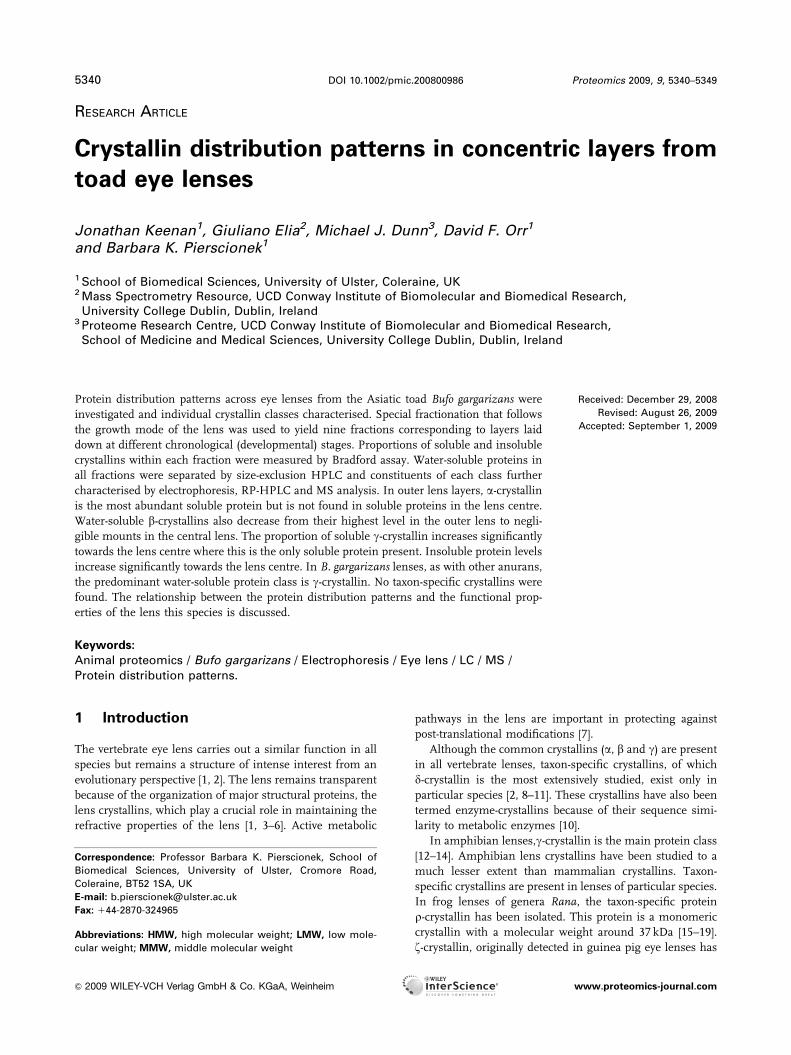
Figure 1. Typical size-exclusion HPLC elution profiles of the
water-soluble proteins from selected layers of B. gargarizans
lens. The layers are numbered consecutively from the lens
periphery inwards. Numbers above the chromatograms indicate
positions at which various molecular weight standards eluted.
From lens periphery to centre, HPLC profiles show a decrease in
HMW and MMW proteins and an increase in the proportions of
LMW proteins.
5342 J. Keenan et al. Proteomics 2009, 9, 5340–5349
& 2009 WILEY-VCH Verlag GmbH & Co. KGaA, Weinheim www.proteomics-journal.com
weights. HPLC elution profiles obtained from selected toad
lens layers are shown in Fig. 1. In outer lens layers the
chromatographs demonstrated a high proportion of HMW
proteins and a low proportion of LMW proteins. The HMW,
MMW and LMW proteins eluted as sets of multiple rather
than single peaks. With progression into the central layers
of the lens, the peaks coalesced to single peaks and there
was a decrease in the proportion of the HMW and MMW
protein and a concomitant increase in the proportion of
LMW proteins. In the innermost lens layers, there was a
single LMW protein peak.
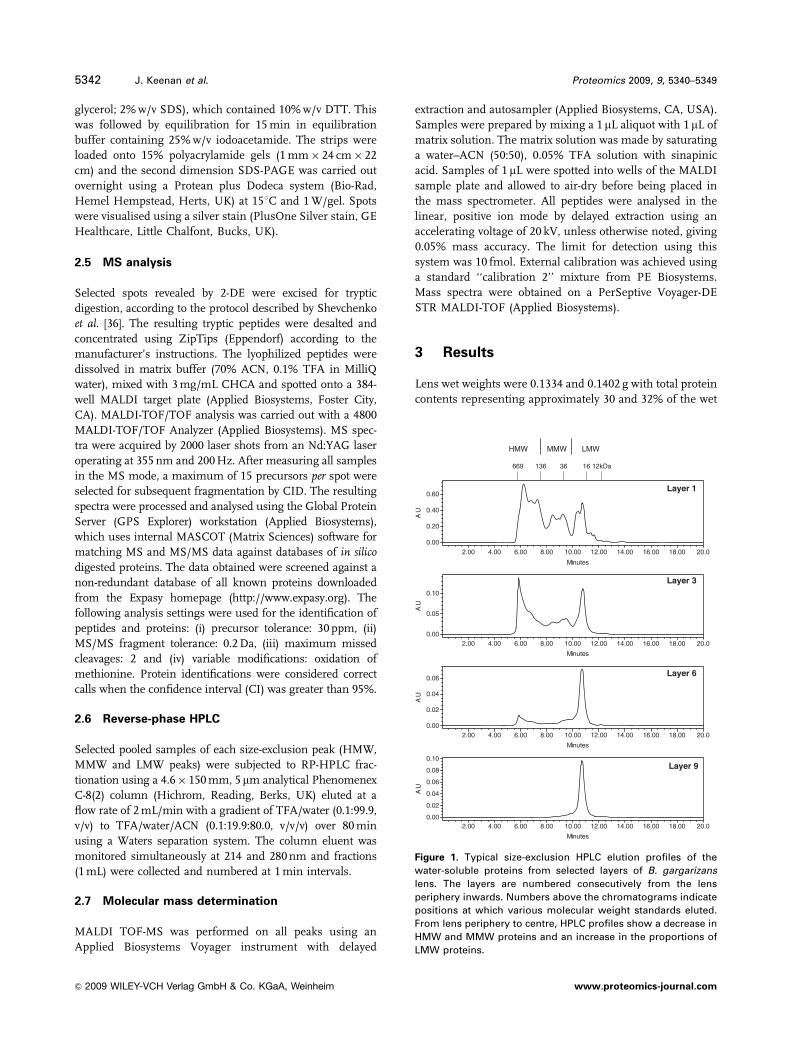
The proportions of each class of proteins (HMW, MMW
and LMW), obtained by calculating the area under each
peak, are plotted in Fig. 2 against the cumulative weight of
total soluble protein from lens periphery to centre. The
HMW proteins represented around 52% of the total soluble
protein in outer lens layers decreasing to less than 1% in the
central layers (Fig. 2A). The total MMW protein also
decreased towards the lens centre from around 24% of the
total soluble protein in the outer layers to less than 1% in
the central layers (Fig. 2B). The LMW proteins increased
considerably from around 22% of the total soluble protein in
the outer layers to around 98% in the central region
(Fig. 2C). There was an increase in insoluble proteins from
around 2% of the total protein in the outer layers to around
63% in the inner layers (Fig. 2D).
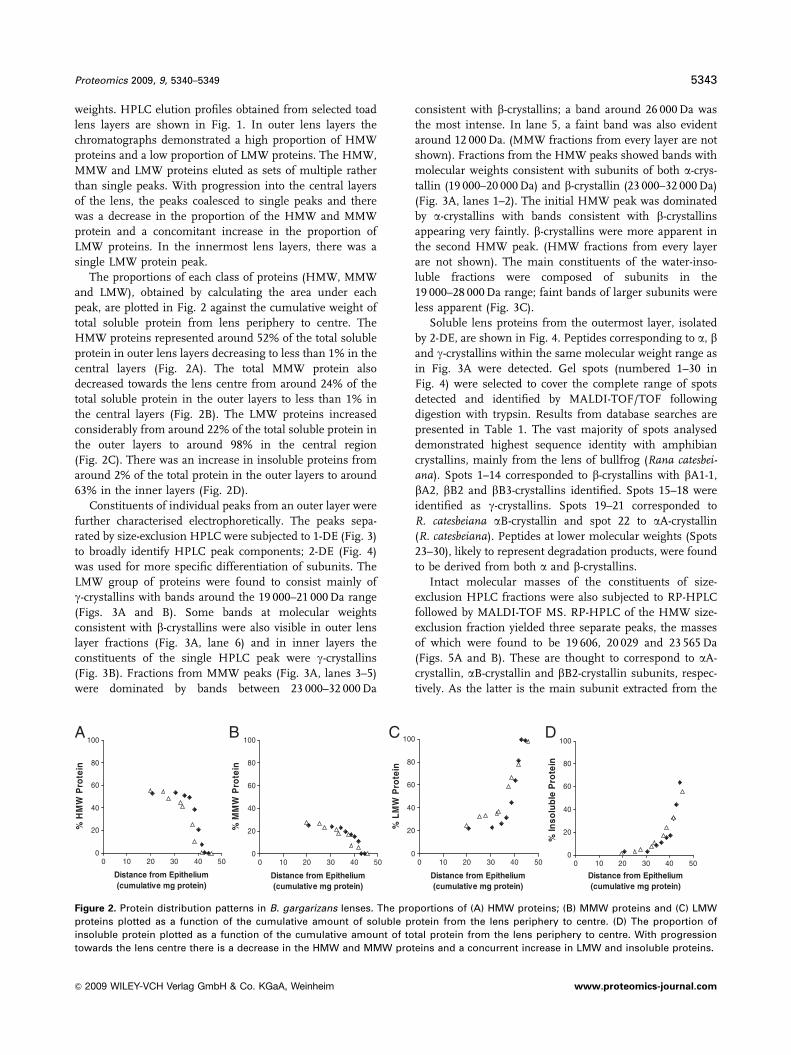
Constituents of individual peaks from an outer layer were
further characterised electrophoretically. The peaks sepa-
rated by size-exclusion HPLC were subjected to 1-DE (Fig. 3)
to broadly identify HPLC peak components; 2-DE (Fig. 4)
was used for more specific differentiation of subunits. The
LMW group of proteins were found to consist mainly of
g-crystallins with bands around the 19 000–21 000 Da range
(Figs. 3A and B). Some bands at molecular weights
consistent with b-crystallins were also visible in outer lens
layer fractions (Fig. 3A, lane 6) and in inner layers the
constituents of the single HPLC peak were g-crystallins
(Fig. 3B). Fractions from MMW peaks (Fig. 3A, lanes 3–5)
were dominated by bands between 23 000–32 000 Da
consistent with b-crystallins; a band around 26 000 Da was
the most intense. In lane 5, a faint band was also evident
around 12 000 Da. (MMW fractions from every layer are not
shown). Fractions from the HMW peaks showed bands with
molecular weights consistent with subunits of both a-crys-
tallin (19 000–20 000 Da) and b-crystallin (23 000–32 000 Da)
(Fig. 3A, lanes 1–2). The initial HMW peak was dominated
by a-crystallins with bands consistent with b-crystallins
appearing very faintly. b-crystallins were more apparent in
the second HMW peak. (HMW fractions from every layer
are not shown). The main constituents of the water-inso-
luble fractions were composed of subunits in the
19 000–28 000 Da range; faint bands of larger subunits were
less apparent (Fig. 3C).
Soluble lens proteins from the outermost layer, isolated
by 2-DE, are shown in Fig. 4. Peptides corresponding to a, band g-crystallins within the same molecular weight range as
in Fig. 3A were detected. Gel spots (numbered 1–30 in
Fig. 4) were selected to cover the complete range of spots
detected and identified by MALDI-TOF/TOF following
digestion with trypsin. Results from database searches are
presented in Table 1. The vast majority of spots analysed
demonstrated highest sequence identity with amphibian
crystallins, mainly from the lens of bullfrog (Rana catesbei-ana). Spots 1–14 corresponded to b-crystallins with bA1-1,
bA2, bB2 and bB3-crystallins identified. Spots 15–18 were
identified as g-crystallins. Spots 19–21 corresponded to
R. catesbeiana aB-crystallin and spot 22 to aA-crystallin
(R. catesbeiana). Peptides at lower molecular weights (Spots
23–30), likely to represent degradation products, were found
to be derived from both a and b-crystallins.
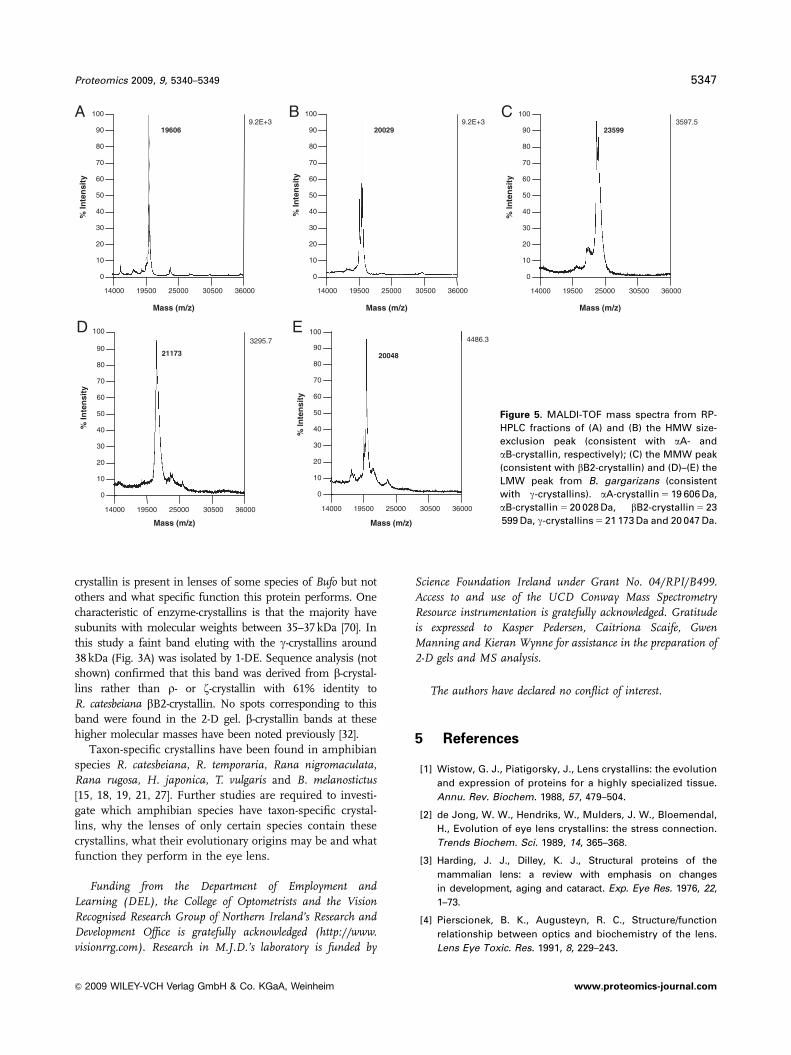
Intact molecular masses of the constituents of size-
exclusion HPLC fractions were also subjected to RP-HPLC
followed by MALDI-TOF MS. RP-HPLC of the HMW size-
exclusion fraction yielded three separate peaks, the masses
of which were found to be 19 606, 20 029 and 23 565 Da
(Figs. 5A and B). These are thought to correspond to aA-
crystallin, aB-crystallin and bB2-crystallin subunits, respec-
tively. As the latter is the main subunit extracted from the
0
20
40
60
80
100
0 10 20 30 40 50
Distance from Epithelium (cumulative mg protein)
% H
MW
Pro
tein
0
20
40
60
80
100
0 10 20 30 40 50
Distance from Epithelium (cumulative mg protein)
% M
MW
Pro
tein
0
20
40
60
80
100
0 10 20 30 40 50
Distance from Epithelium (cumulative mg protein)
% L
MW
Pro
tein
0
20
40
60
80
100
0 10 20 30 40 50
Distance from Epithelium (cumulative mg protein)
% In
solu
ble
Pro
tein
A B C D
Figure 2. Protein distribution patterns in B. gargarizans lenses. The proportions of (A) HMW proteins; (B) MMW proteins and (C) LMW
proteins plotted as a function of the cumulative amount of soluble protein from the lens periphery to centre. (D) The proportion of
insoluble protein plotted as a function of the cumulative amount of total protein from the lens periphery to centre. With progression
towards the lens centre there is a decrease in the HMW and MMW proteins and a concurrent increase in LMW and insoluble proteins.
Proteomics 2009, 9, 5340–5349 5343
& 2009 WILEY-VCH Verlag GmbH & Co. KGaA, Weinheim www.proteomics-journal.com
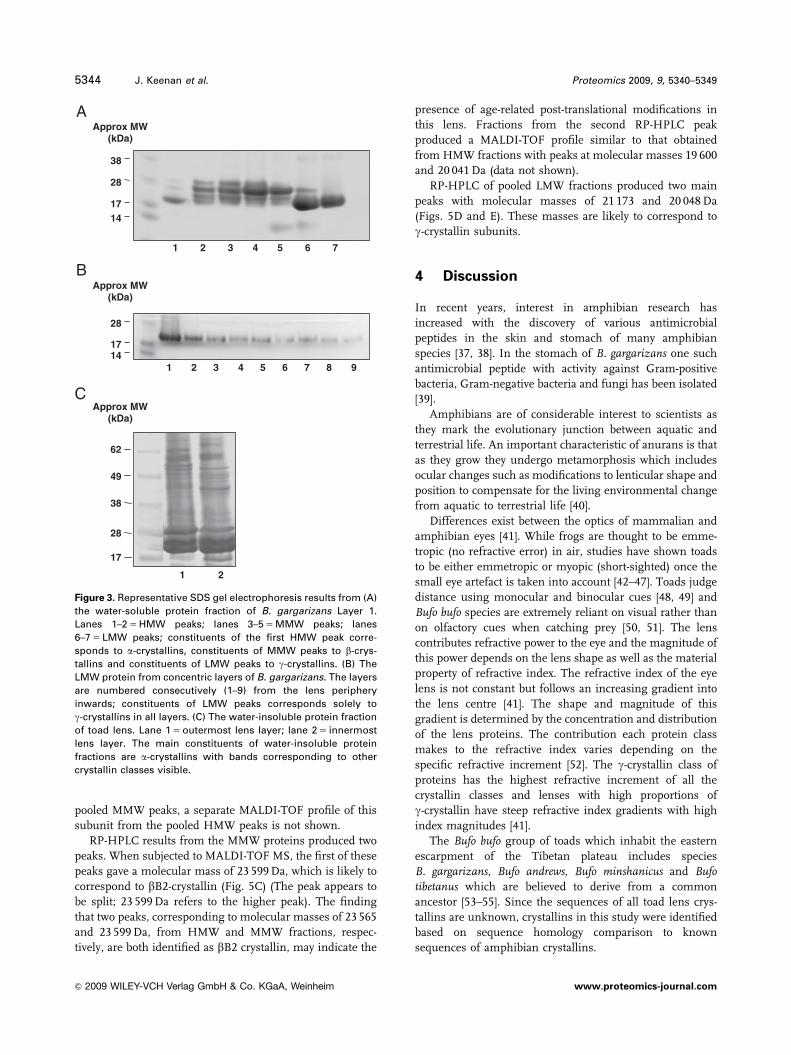
pooled MMW peaks, a separate MALDI-TOF profile of this
subunit from the pooled HMW peaks is not shown.
RP-HPLC results from the MMW proteins produced two
peaks. When subjected to MALDI-TOF MS, the first of these
peaks gave a molecular mass of 23 599 Da, which is likely to
correspond to bB2-crystallin (Fig. 5C) (The peak appears to
be split; 23 599 Da refers to the higher peak). The finding
that two peaks, corresponding to molecular masses of 23 565
and 23 599 Da, from HMW and MMW fractions, respec-
tively, are both identified as bB2 crystallin, may indicate the
presence of age-related post-translational modifications in
this lens. Fractions from the second RP-HPLC peak
produced a MALDI-TOF profile similar to that obtained
from HMW fractions with peaks at molecular masses 19 600
and 20 041 Da (data not shown).
RP-HPLC of pooled LMW fractions produced two main
peaks with molecular masses of 21 173 and 20 048 Da
(Figs. 5D and E). These masses are likely to correspond to
g-crystallin subunits.
4 Discussion
In recent years, interest in amphibian research has
increased with the discovery of various antimicrobial
peptides in the skin and stomach of many amphibian
species [37, 38]. In the stomach of B. gargarizans one such
antimicrobial peptide with activity against Gram-positive
bacteria, Gram-negative bacteria and fungi has been isolated
[39].
Amphibians are of considerable interest to scientists as
they mark the evolutionary junction between aquatic and
terrestrial life. An important characteristic of anurans is that
as they grow they undergo metamorphosis which includes
ocular changes such as modifications to lenticular shape and
position to compensate for the living environmental change
from aquatic to terrestrial life [40].
Differences exist between the optics of mammalian and
amphibian eyes [41]. While frogs are thought to be emme-
tropic (no refractive error) in air, studies have shown toads
to be either emmetropic or myopic (short-sighted) once the
small eye artefact is taken into account [42–47]. Toads judge
distance using monocular and binocular cues [48, 49] and
Bufo bufo species are extremely reliant on visual rather than
on olfactory cues when catching prey [50, 51]. The lens
contributes refractive power to the eye and the magnitude of
this power depends on the lens shape as well as the material
property of refractive index. The refractive index of the eye
lens is not constant but follows an increasing gradient into
the lens centre [41]. The shape and magnitude of this
gradient is determined by the concentration and distribution
of the lens proteins. The contribution each protein class
makes to the refractive index varies depending on the
specific refractive increment [52]. The g-crystallin class of
proteins has the highest refractive increment of all the
crystallin classes and lenses with high proportions of
g-crystallin have steep refractive index gradients with high
index magnitudes [41].
The Bufo bufo group of toads which inhabit the eastern
escarpment of the Tibetan plateau includes species
B. gargarizans, Bufo andrews, Bufo minshanicus and Bufotibetanus which are believed to derive from a common
ancestor [53–55]. Since the sequences of all toad lens crys-
tallins are unknown, crystallins in this study were identified
based on sequence homology comparison to known
sequences of amphibian crystallins.
1 2 3 4 5 6 7 8 91417
28
Approx MW (kDa)
1 2 3 4 5 6 7
1417
28
38
Approx MW (kDa)
Approx MW (kDa)
1 2
62
49
38
28
17
A
B
C
Figure 3. Representative SDS gel electrophoresis results from (A)
the water-soluble protein fraction of B. gargarizans Layer 1.
Lanes 1–2 5 HMW peaks; lanes 3–5 5 MMW peaks; lanes
6–7 5 LMW peaks; constituents of the first HMW peak corre-
sponds to a-crystallins, constituents of MMW peaks to b-crys-
tallins and constituents of LMW peaks to g-crystallins. (B) The
LMW protein from concentric layers of B. gargarizans. The layers
are numbered consecutively (1–9) from the lens periphery
inwards; constituents of LMW peaks corresponds solely to
g-crystallins in all layers. (C) The water-insoluble protein fraction
of toad lens. Lane 1 5 outermost lens layer; lane 2 5 innermost
lens layer. The main constituents of water-insoluble protein
fractions are a-crystallins with bands corresponding to other
crystallin classes visible.
5344 J. Keenan et al. Proteomics 2009, 9, 5340–5349
& 2009 WILEY-VCH Verlag GmbH & Co. KGaA, Weinheim www.proteomics-journal.com

There are differences between mammalian and amphi-
bian lens crystallin patterns with g-crystallins representing
the major soluble protein in amphibian lenses [12–14,
56–59]. As seen with other anurans, this study has shown
that when the soluble lens proteins from the adult toad,
B. gargarizans, are separated, the common vertebrate lens
crystallins a, b and g-crystallins are present. It is possible
that the chromatograph integration method used may have
overestimated the proportion of a-crystallins present and
underestimated that of b-crystallins since the areas classified
as HMW proteins included some b-crystallins; MMW and
LMW proteins appeared to be more homogeneous. This
study concurs with previous work, that the major crystallin
class in the amphibian lens is g-crystallin. This study
is the first to show the distribution of this protein across
the lens and to demonstrate that this is the only crystallin
class present in the B. gargarizans lens centre, at a level of
98% of total soluble protein. This has significant implica-
tions for the optics of the toad lens and the function
of its eye as g-crystallin is associated with a high refractive
power [41].
The fractionation procedure in this paper followed the
growth mode of the lens, and hence, unlike previous work,
was able to show the protein patterns in layers laid down at
different life stages rather than averaged out across the
whole lens. The presence of high MW proteins in outer lens
layers has been reported in other species [4, 32]. This form
of fractionation has not been used for amphibian lenses;
cortical and nuclear separations have been made and the
presence of higher MW species was reported only in the
cortical regions that correspond to outer layers in this work.
Polansky and Bennett (1970) reported that adult bullfrog
lens nuclear crystallins were similar to those of a whole
tadpole lens [60]. The fractionation technique used in this
study enables lens fibres from concentric layers to be
examined more quantitatively and indicates which proteins
are preferentially synthesized at different times in the life of
the lens. Inner lens fractions contain proteins laid down in
embryonic life and these are chiefly g-crystallins. This
agrees with previous anuran work that has found g-crystallin
to be the earliest detectable protein in embryonic amphibian
lenses [56, 57, 59]. McDevitt et al. (1969) suggested that
g-crystallins were indicative of lens fibre differentiation in
the normal developing anuran lens [57].
Previous findings of high proportions of g-crystallin in
embryonic and adult fish lenses coupled with findings of
low levels of g-crystallin in bird lenses, have led to sugges-
tions that amphibian lenses occupy a phylogenetic niche
between fish and avian lenses and that g-crystallin was the
‘‘primitive’’ vertebrate crystallin [12, 61–64].
The study of Roll et al. [19] on whole Bufo bufo lenses
found electrophoresis bands within a similar molecular
weight range as this study. Additional peptides, such as a
12 kDa band, that were seen in this study, may have formed
as a result of post-translational modifications, causing
protein species to aggregate [65–68]. The lenses used in this
study were from an older toad than those in the study of Roll
et al. [19].
The constituents of the HMW proteins from size-exclu-
sion HPLC were found to be mainly a-crystallin with the
presence of some b-crystallins. This is consistent with
observations from previous studies which found that it was
more difficult to separate the a-crystallin from the b-crys-
tallin fraction in amphibian lenses compared to other
mammals or reptiles [32, 69].
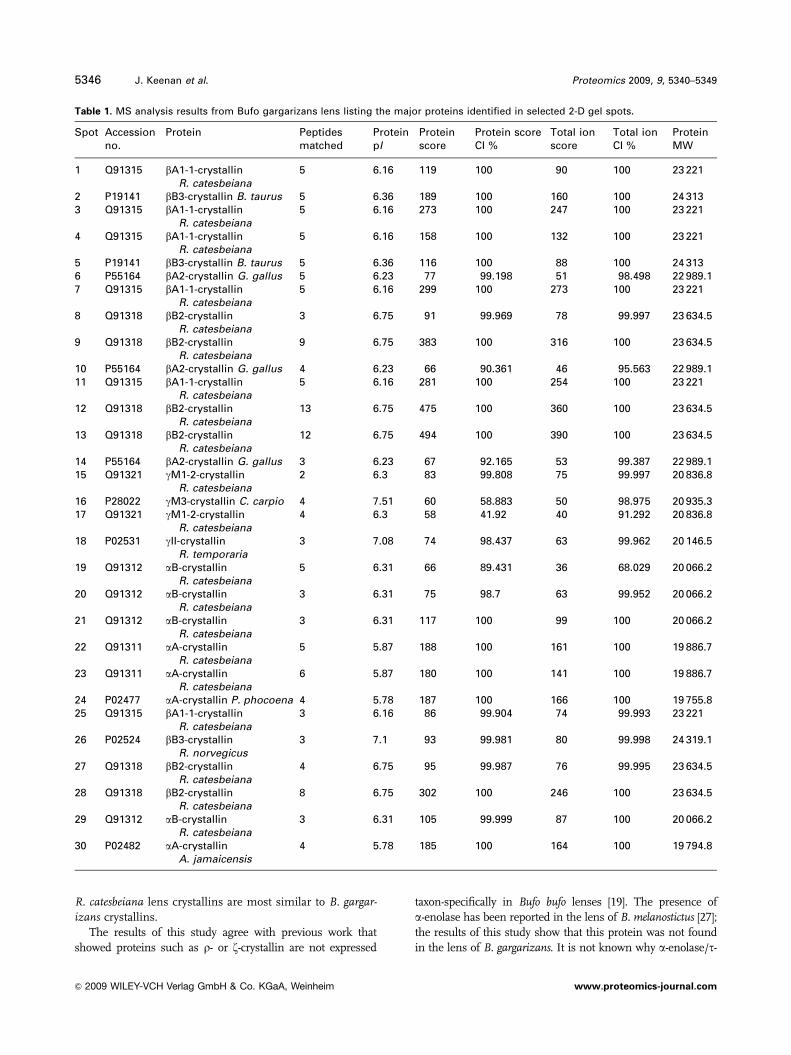
MS analysis of the 2-D gel showed spots corresponding to
aA, aB, bA1-1, bA2, bB1, bB2, bB3, gII, gM1-2 and gM3-
crystallin (Table 1); several spots were matched to more than
one protein species. This is likely to be a consequence of
internal sequence homology and conservation across species
for each of the main crystallin classes. This is particularly
evident for the b-crystallins such as bA1-1 and bB2-crystallin
which were each detected in six spots (Fig. 4; Table 1). For
the majority of peptides analysed, the highest amino acid
coverage was seen with bullfrog lenses (R. catesbeiana).
Further work is needed to examine the extent of sequence
similarity between crystallins from R. catesbeiana and
B. gargarizans and to determine whether phylogenetically
55
29
2420
14.2
6.5
45
kDa
pH 3 pH 10
24
5
6
7
8
9
10 11
12
13
14 16
17
18 19 21
22
23
26
28 29 30
1
315
20
24
25 27
Figure 4. 2-DE results from the water-
soluble protein fraction of B. gargar-
izans Layer 1. Spots selected for MS
analysis by MALDI-TOF/TOF after
in-gel digestion with trypsin are
numbered 1–30. Spots were found to
correspond to a, b and g-crystallins as
detailed in Table 1.
Proteomics 2009, 9, 5340–5349 5345
& 2009 WILEY-VCH Verlag GmbH & Co. KGaA, Weinheim www.proteomics-journal.com
R. catesbeiana lens crystallins are most similar to B. gargar-izans crystallins.
The results of this study agree with previous work that
showed proteins such as r- or z-crystallin are not expressed
taxon-specifically in Bufo bufo lenses [19]. The presence of
a-enolase has been reported in the lens of B. melanostictus [27];
the results of this study show that this protein was not found
in the lens of B. gargarizans. It is not known why a-enolase/t-
Table 1. MS analysis results from Bufo gargarizans lens listing the major proteins identified in selected 2-D gel spots.
Spot Accessionno.
Protein Peptidesmatched
ProteinpI
Proteinscore
Protein scoreCI %
Total ionscore
Total ionCI %
ProteinMW
1 Q91315 bA1-1-crystallinR. catesbeiana
5 6.16 119 100 90 100 23 221
2 P19141 bB3-crystallin B. taurus 5 6.36 189 100 160 100 24 3133 Q91315 bA1-1-crystallin
R. catesbeiana5 6.16 273 100 247 100 23 221
4 Q91315 bA1-1-crystallinR. catesbeiana
5 6.16 158 100 132 100 23 221
5 P19141 bB3-crystallin B. taurus 5 6.36 116 100 88 100 24 3136 P55164 bA2-crystallin G. gallus 5 6.23 77 99.198 51 98.498 22 989.17 Q91315 bA1-1-crystallin
R. catesbeiana5 6.16 299 100 273 100 23 221
8 Q91318 bB2-crystallinR. catesbeiana
3 6.75 91 99.969 78 99.997 23 634.5
9 Q91318 bB2-crystallinR. catesbeiana
9 6.75 383 100 316 100 23 634.5
10 P55164 bA2-crystallin G. gallus 4 6.23 66 90.361 46 95.563 22 989.111 Q91315 bA1-1-crystallin
R. catesbeiana5 6.16 281 100 254 100 23 221
12 Q91318 bB2-crystallinR. catesbeiana
13 6.75 475 100 360 100 23 634.5
13 Q91318 bB2-crystallinR. catesbeiana
12 6.75 494 100 390 100 23 634.5
14 P55164 bA2-crystallin G. gallus 3 6.23 67 92.165 53 99.387 22 989.115 Q91321 gM1-2-crystallin
R. catesbeiana2 6.3 83 99.808 75 99.997 20 836.8
16 P28022 gM3-crystallin C. carpio 4 7.51 60 58.883 50 98.975 20 935.317 Q91321 gM1-2-crystallin
R. catesbeiana4 6.3 58 41.92 40 91.292 20 836.8
18 P02531 gII-crystallinR. temporaria
3 7.08 74 98.437 63 99.962 20 146.5
19 Q91312 aB-crystallinR. catesbeiana
5 6.31 66 89.431 36 68.029 20 066.2
20 Q91312 aB-crystallinR. catesbeiana
3 6.31 75 98.7 63 99.952 20 066.2
21 Q91312 aB-crystallinR. catesbeiana
3 6.31 117 100 99 100 20 066.2
22 Q91311 aA-crystallinR. catesbeiana
5 5.87 188 100 161 100 19 886.7
23 Q91311 aA-crystallinR. catesbeiana
6 5.87 180 100 141 100 19 886.7
24 P02477 aA-crystallin P. phocoena 4 5.78 187 100 166 100 19 755.825 Q91315 bA1-1-crystallin
R. catesbeiana3 6.16 86 99.904 74 99.993 23 221
26 P02524 bB3-crystallinR. norvegicus
3 7.1 93 99.981 80 99.998 24 319.1
27 Q91318 bB2-crystallinR. catesbeiana
4 6.75 95 99.987 76 99.995 23 634.5
28 Q91318 bB2-crystallinR. catesbeiana
8 6.75 302 100 246 100 23 634.5
29 Q91312 aB-crystallinR. catesbeiana
3 6.31 105 99.999 87 100 20 066.2
30 P02482 aA-crystallinA. jamaicensis
4 5.78 185 100 164 100 19 794.8
5346 J. Keenan et al. Proteomics 2009, 9, 5340–5349
& 2009 WILEY-VCH Verlag GmbH & Co. KGaA, Weinheim www.proteomics-journal.com
crystallin is present in lenses of some species of Bufo but not
others and what specific function this protein performs. One
characteristic of enzyme-crystallins is that the majority have
subunits with molecular weights between 35–37 kDa [70]. In
this study a faint band eluting with the g-crystallins around
38 kDa (Fig. 3A) was isolated by 1-DE. Sequence analysis (not
shown) confirmed that this band was derived from b-crystal-
lins rather than r- or z-crystallin with 61% identity to
R. catesbeiana bB2-crystallin. No spots corresponding to this
band were found in the 2-D gel. b-crystallin bands at these
higher molecular masses have been noted previously [32].
Taxon-specific crystallins have been found in amphibian
species R. catesbeiana, R. temporaria, Rana nigromaculata,
Rana rugosa, H. japonica, T. vulgaris and B. melanostictus[15, 18, 19, 21, 27]. Further studies are required to investi-
gate which amphibian species have taxon-specific crystal-
lins, why the lenses of only certain species contain these
crystallins, what their evolutionary origins may be and what
function they perform in the eye lens.
Funding from the Department of Employment andLearning (DEL), the College of Optometrists and the VisionRecognised Research Group of Northern Ireland’s Research andDevelopment Office is gratefully acknowledged (http://www.visionrrg.com). Research in M.J.D.’s laboratory is funded by
Science Foundation Ireland under Grant No. 04/RPI/B499.Access to and use of the UCD Conway Mass SpectrometryResource instrumentation is gratefully acknowledged. Gratitudeis expressed to Kasper Pedersen, Caitriona Scaife, GwenManning and Kieran Wynne for assistance in the preparation of2-D gels and MS analysis.
The authors have declared no conflict of interest.
5 References
[1] Wistow, G. J., Piatigorsky, J., Lens crystallins: the evolution
and expression of proteins for a highly specialized tissue.
Annu. Rev. Biochem. 1988, 57, 479–504.
[2] de Jong, W. W., Hendriks, W., Mulders, J. W., Bloemendal,
H., Evolution of eye lens crystallins: the stress connection.
Trends Biochem. Sci. 1989, 14, 365–368.
[3] Harding, J. J., Dilley, K. J., Structural proteins of the
mammalian lens: a review with emphasis on changes
in development, aging and cataract. Exp. Eye Res. 1976, 22,
1–73.
[4] Pierscionek, B. K., Augusteyn, R. C., Structure/function
relationship between optics and biochemistry of the lens.
Lens Eye Toxic. Res. 1991, 8, 229–243.
14000 19500 25000 30500 36000
% In
ten
sity
10
20
30
40
0
50
60
70
80
90
100
20048
% In
ten
sity
14000 19500 25000 30500 36000
Mass (m/z)
10
20
30
40
0
50
60
70
80
90
100
23599
Mass (m/z)
% In
ten
sity
14000 19500 25000 30500 36000
Mass (m/z)
10
20
30
40
0
50
60
70
80
90
100
21173
% In
ten
sity
14000 19500 25000 30500 36000
Mass (m/z)
10
20
30
40
0
50
60
70
80
90
100
% In
ten
sity
14000 19500 25000 30500 36000
Mass (m/z)
10
20
30
40
0
50
60
70
80
100
9200260691 90 3+E2.93+E2.9
7.5923
5.7953
4486.3
A B C
ED
Figure 5. MALDI-TOF mass spectra from RP-
HPLC fractions of (A) and (B) the HMW size-
exclusion peak (consistent with aA- and
aB-crystallin, respectively); (C) the MMW peak
(consistent with bB2-crystallin) and (D)–(E) the
LMW peak from B. gargarizans (consistent
with g-crystallins). aA-crystallin 5 19 606 Da,
aB-crystallin 5 20 028 Da, bB2-crystallin 5 23
599 Da, g-crystallins 5 21 173 Da and 20 047 Da.
Proteomics 2009, 9, 5340–5349 5347
& 2009 WILEY-VCH Verlag GmbH & Co. KGaA, Weinheim www.proteomics-journal.com
[5] Pierscionek, B. K., Augusteyn, R. C., Growth related changes
to functional parameters in the bovine lens. Biochim.
Biophys. Acta 1992, 1116, 283–290.
[6] Bloemendal, H., de Jong, W., Jaenicke, R., Lubsen, N. H.
et al., Ageing and vision: structure, stability and function of
lens crystallins. Prog. Biophys. Mol. Biol. 2004, 86, 407–485.
[7] Augusteyn, R. C., Murnane, L., Nicola, A., Stevens, A.,
Chaperone activity in the lens. Clin. Exp. Optom. 2002, 85,
83–90.
[8] Williams, L. A., Piatigorsky, J., Comparative and evolu-
tionary aspects of delta-crystallin in the vertebrate lens. Eur.
J. Biochem. 1979, 100, 349–357.
[9] Piatigorsky, J., Lens crystallins and their genes: diversity
and tissue-specific expression. FASEB J. 1989, 3, 1933–1940.
[10] Piatigorsky, J., Wistow, G., The recruitment of crystallins:
new functions precede gene duplication. Science 1991, 252,
1078–1079.
[11] Wistow, G., Peptide sequences for beta-crystallins of a
teleost fish. Mol. Vis. 1995, 1, 1.
[12] McDevitt, D. S., Separation and characterization of the lens
proteins of the amphibian, Rana pipiens. J. Exp. Zool. 1967,
164, 21–29.
[13] Cobb, B. F., 3rd, Carter, L., Koenig, V. L., The distribution of
the soluble protein components in the crystalline lenses of
specimens of amphibians, reptiles and birds. Comp.
Biochem. Physiol. 1968, 26, 519–528.
[14] Brahma, S. K., van Doorenmaalen, W. J., Study of the
soluble lens proteins from different amphibian species.
Exp. Eye Res. 1969, 8, 168–171.
[15] Tomarev, S. I., Zinovieva, R. D., Dolgilevich, S. M., Luchin,
S. V. et al., A novel type of crystallin in the frog eye lens. 35-
kDa polypeptide is not homologous to any of the major
classes of lens crystallins. FEBS Lett. 1984, 171, 297–302.
[16] Watanabe, K., Fujii, Y., Nakayama, K., Ohkubo, H. et al.,
Structural similarity of bovine lung prostaglandin F
synthase to lens epsilon-crystallin of the European common
frog. Proc. Natl. Acad. Sci. USA 1988, 85, 11–15.
[17] Chiou, S. H., Chang, W. C., Kuo, J., Pan, F. M., Lo, T. B.,
Biochemical comparison of gamma-crystallins from duck
and frog eye lenses. FEBS Lett. 1986, 196, 219–222.
[18] Fujii, Y., Watanabe, K., Hayashi, H., Urade, Y. et al., Purifi-
cation and characterization of rho-crystallin from Japanese
common bullfrog lens. J. Biol. Chem. 1990, 265, 9914–9923.
[19] Roll, B., van Boekel, M. A., Amons, R., de Jong, W. W., Rho
B-crystallin, an aldose reductase-like lens protein in the
gecko Lepidodactylus lugubris. Biochem. Biophys. Res.
Commun. 1995, 217, 452–458.
[20] Huang, Q. L., Russell, P., Stone, S. H., Zigler, J. S., Jr., Zeta-
crystallin, a novel lens protein from the guinea pig. Curr.
Eye Res. 1987, 6, 725–732.
[21] Fujii, Y., Kimoto, H., Ishikawa, K., Watanabe, K. et al., Taxon-
specific zeta-crystallin in Japanese tree frog (Hyla japonica)
lens. J. Biol. Chem. 2001, 276, 28134–28139.
[22] de Jorge, F. B., Ynsfran, N. S., Biochemical studies on the
eyes of the toad Bufo marinus Ictericus. Comp. Biochem.
Physiol. 1970, 35, 125–143.
[23] Williams, L. A., Ding, L., Horwitz, J., Piatigorsky, J., tau-
Crystallin from the turtle lens: purification and partial
characterization. Exp. Eye Res. 1985, 40, 741–749.
[24] Wistow, G. J., Lietman, T., Williams, L. A., Stapel, S. O.
et al., Tau-crystallin/alpha-enolase: one gene encodes both
an enzyme and a lens structural protein. J. Cell Biol. 1988,
107, 2729–2736.
[25] Kim, R. Y., Lietman, T., Piatigorsky, J., Wistow, G. J.,
Structure and expression of the duck alpha-enolase/tau-
crystallin-encoding gene. Gene 1991, 103, 193–200.
[26] Agrawal, R., Chandrashekhar, R., Mishra, A. K., Ramadevi,
J. et al., Cloning and sequencing of complete tau-crystallin
cDNA from embryonic lens of Crocodylus palustris.
J. Biosci. 2002, 27, 251–259.
[27] Krishnan, K., Kathiresan, T., Raman, R., Rajini, B. et al.,
Ubiquitous lens alpha, beta, and gamma-crystallins accu-
mulate in anuran cornea as corneal crystallins. J. Biol.
Chem. 2007, 282, 18953–18959.
[28] Pierscionek-Balcerzak, B., Augusteyn, R. C., A new method for
studying protein changes in the human lens during ageing
and cataract formation. Aust. J. Optom. 1985, 68, 49–53.
[29] Augusteyn, R. C., Boyd, A., Pierscionek-Balcerzak, B.,
Thomson, J., Ageing studied in single lenses. Atti della
fondazione Giorgio Ronchi 1985, 495–502.
[30] Pierscionek, B. K., Augusteyn, R. C., The refractive index
and protein distribution in the blue eye trevally lens. J. Am.
Optom. Assoc. 1995, 66, 739–743.
[31] Jobling, A., Stevens, A., Augusteyn, R. C., Distribution of
proteins across the porcine lens. Clin. Exp. Optom. 1995, 78,
87–92.
[32] Keenan, J., Orr, D. F., Pierscionek, B. K., Patterns of crys-
tallin distribution in porcine eye lenses. Mol. Vis. 2008, 14,
1245–1253.
[33] Bradford, M. M., A rapid and sensitive method for the
quantitation of microgram quantities of protein utilizing the
principle of protein-dye binding. Anal. Biochem. 1976, 72,
248–254.
[34] Laemmli, U. K., Cleavage of structural proteins during the
assembly of the head of bacteriophage T4. Nature 1970,
227, 680–685.
[35] Rabilloud, T., Valette, C., Lawrence, J. J., Sample applica-
tion by in-gel rehydration improves the resolution of two-
dimensional electrophoresis with immobilized pH gradients
in the first dimension. Electrophoresis 1994, 15, 1552–1558.
[36] Shevchenko, A., Wilm, M., Vorm, O., Mann, M., Mass
spectrometric sequencing of proteins silver-stained poly-
acrylamide gels. Anal. Chem. 1996, 68, 850–858.
[37] Marion, D., Zasloff, M., Bax, A., A two-dimensional NMR
study of the antimicrobial peptide magainin 2. FEBS Lett.
1988, 227, 21–26.
[38] Park, J. M., Jung, J. E., Lee, B. J., Antimicrobial peptides
from the skin of a Korean frog, Rana rugosa. Biochem.
Biophys. Res. Commun. 1994, 205, 948–954.
[39] Park, C. B., Kim, M. S., Kim, S. C., A novel antimicrobial
peptide from Bufo bufo gargarizans. Biochem. Biophys.
Res. Commun. 1996, 218, 408–413.
& 2009 WILEY-VCH Verlag GmbH & Co. KGaA, Weinheim www.proteomics-journal.com
5348 J. Keenan et al. Proteomics 2009, 9, 5340–5349
[40] Duke-Elder, S., in: Duke-Elder, S. (Ed.), System of Ophthal-
mology, Vol. 1, The Eye of Amphibians, Henry Kimpton,
London 1958, pp. 333–351
[41] Pierscionek, B. K., Gradient index of refraction profiling of
the eye lens, in: Bass, M., Enoch, J., Lakshminarayanan, V.
(Eds.), Handbook of Optics, McGraw-Hill, New York 2009.
[42] Walls, G. L., The Vertebrate Eye and Its Adaptive Mechan-
ism, Hafner, New York 1967.
[43] Glickstein, M., Millodot, M., Retinoscopy and eye size.
Science 1970, 168, 605–606.
[44] Krueger, H., Moser, E. A., Refraction and image quality of
the frog’s eye. Pflugers Arch. 1971, 326, 334–340.
[45] Millodot, M., Measurement of the refractive state of the eye
in frogs (Rana pipiens). Rev. Can. Biol. 1971, 30, 249–252.
[46] Moser, E. A., Krueger, H., Retinoscopic and neurophysio-
logical refractometry in Rana temporaria. Pflugers Arch.
1972, 335, 235–242.
[47] Mathis, U., Schaeffel, F., Howland, H. C., Visual optics in
toads (Bufo americanus). J. Comp. Physiol. A 1988, 163,
201–213.
[48] Ingle, D. J., Depth vision in monocular toads. Psychon. Sci.
1972, 29, 37–38.
[49] Collett, T., Stereopsis in toads. Nature 1977, 267, 349–351.
[50] Von Heusser, H., Zum geruchlichen Beutefinden und
Gahnen der Kreuzkrote (Bufo calamita Laur.). Z Tierpsychol.
1956, 15, 94–98.
[51] Eibl-Eibesfeldt, I., Nahrungserwerb und Beuteschema der
Erdkrote. Behaviour 1967, 4, 1–35.
[52] Barer, R., Joseph, S., Refractometry of living cells. Part 1.
Basic Principles. Quart. J. Micrscop. Sci. 1954, 95, 399–423.
[53] Inger, R. F., in: Blair, W. F. (Ed.), Evolution of the Genus
Bufo, University of Texas, Austin, Texas 1972, pp. 102–118.
[54] Nishioka, M., Sumida, M., Ueda, H., Wu, Z., Genetic rela-
tionships among 13 Bufo species and subspecies elucidated
by the method of electrophoretic analyses. Sci. Rep. Lab
Amphibian Biol. 1990, 10, 53–91.
[55] Macey, J. R., Schulte, J. A., 2nd, Larson, A., Fang, Z. et al.,
Phylogenetic relationships of toads in the Bufo bufo species
group from the eastern escarpment of the Tibetan Plateau:
a case of vicariance and dispersal. Mol. Phylogenet. Evol.
1998, 9, 80–87.
[56] Takata, C., Albright, J. F., Yamada, T., Study of lens anti-
gens in the developing newt Lens with immuno-
fluorescence. Exp. Cell Res. 1964, 34, 207–210.
[57] McDevitt, D. S., Meza, I., Yamada, T., Immunofluorescence
localization of the crystallins in amphibian lens develop-
ment, with special reference to the gamma-crystallins. Dev.
Biol. 1969, 19, 581–607.
[58] McDevitt, D. S., Sequential appearance of alpha, beta, and
gamma-crystallins in embryonic and metamorphic Rana
pipiens. Experientia 1972, 28, 1215–1217.
[59] McDevitt, D. S., Brahma, S. K., Ontogeny and localization of
the crystallins during embryonic lens development in
Xenopus laevis. J. Exp. Zool. 1973, 186, 127–140.
[60] Polansky, J. R., Bennett, T. P., Differences in the soluble lens
proteins from tadpole and adult bullfrogs. Biochem.
Biophys. Res. Commun. 1970, 38, 450–457.
[61] Rabaey, M., Electrophoretic and immunoelectrophoretic
studies on the soluble proteins in the developing lens of
birds. Exp. Eye Res. 1962, 1, 310–316.
[62] Rabaey, M., Lens proteins during embryonic development of
different vertebrates. Invest. Ophthalmol. 1965, 4, 560–578.
[63] Lerman, S., Zigman, S., Tuttle, J., Forbes, W., A study of
gamma-crystallin in the dogfish lens. Biol. Bull. 1965, 129,
412.
[64] Maisel, H., Goodman, M., Comparative electrophoretic
study of vertebrate lens proteins. Am. J. Ophthalmol. 1965,
59, 697–704.
[65] Manski, W., Martinez, C., Immunochemical studies on
albuminoid. II. Changes associated with age. Exp. Eye Res.
1971, 12, 206–211.
[66] Miesbauer, L. R., Zhou, X., Yang, Z., Yang, Z. et al., Post-
translational modifications of water-soluble human lens
crystallins from young adults. J. Biol. Chem. 1994, 269,
12494–12502.
[67] Ma, Z., Hanson, S. R., Lampi, K. J., David, L. L. et al., Age-
related changes in human lens crystallins identified by HPLC
and mass spectrometry. Exp. Eye Res. 1998, 67, 21–30.
[68] Lampi, K. J., Ma, Z., Hanson, S. R., Azuma, M. et al., Age-
related changes in human lens crystallins identified by two-
dimensional electrophoresis and mass spectrometry. Exp.
Eye Res. 1998, 67, 31–43.
[69] Chiou, S. H., Chang, W. C., Pan, F. M., Chang, T., Lo, T. B.,
Physicochemical characterization of lens crystallins from
the carp and biochemical comparison with other vertebrate
and invertebrate crystallins. J. Biochem. (Tokyo) 1987, 101,
751–759.
[70] Kozlov, K. A., Vertebrate crystallins - from proteins to genes.
Russian J. Dev. Biol. 2001, 32, 265–282.
Proteomics 2009, 9, 5340–5349 5349
& 2009 WILEY-VCH Verlag GmbH & Co. KGaA, Weinheim www.proteomics-journal.com