crystallization controlled by layered ... - toyota-ti.ac.jp · e-mail address:...
TRANSCRIPT

lable at ScienceDirect
Polymer 50 (2009) 4718–4726
Contents lists avai
Polymer
journal homepage: www.elsevier .com/locate/polymer
Crystallization controlled by layered silicates in nylon 6–clay nano-composite
Yoshihiro Katoh, Masami Okamoto*
Advanced Polymeric Nanostructured Materials Engineering, Graduate School of Engineering, Toyota Technological Institute, 2-12-1 Hisakata, Tempaku, Nagoya 468 8511, Japan
a r t i c l e i n f o
Article history:Received 18 March 2009Accepted 10 July 2009Available online 16 July 2009
Keywords:Nano-compositesCrystallizationChain mobility
* Corresponding author. Tel.: þ81 052 809 1861; faE-mail address: [email protected] (M. Okam
0032-3861/$ – see front matter � 2009 Elsevier Ltd.doi:10.1016/j.polymer.2009.07.019
a b s t r a c t
To understand the effect of the montmorillonite (MMT) particles on the crystallization kinetics andcrystalline morphology of nylon 6 upon nano-composite formation, we have characterized the crystal-lization behaviors by using light scattering, wide-angle X-ray diffraction (WAXD), transmission electronmicroscope (TEM) and rheological measurement. The correlation between the nucleating effect and thegrowth mechanism of the different polymorphism (g-phase) of nylon 6 in the nano-composite (N6C3.7)was probed. N6C3.7 exhibited g-phase crystal due to the nucleating effect of the dispersed MMT particlesinto the nylon 6 matrix throughout the whole Tc range (¼150–215 �C). The lamellar growth of theg-phase crystal took place on both sides of the dispersed MMT particles. In comparison between thetemperature dependence of the characteristic relaxation time and the crystallization time, the lamellargrowth of the g-phase crystal has been discussed. The stable growth of the g-phase was stronglydisturbed at low Tc range (¼160–190 �C) due to the lack of time for crystallization.
� 2009 Elsevier Ltd. All rights reserved.
1. Introduction
Over the last few years, the utility of inorganic nanoscaleparticles as filler to enhance the polymer performance has beenestablished. Of particular interest is recently developed nano-composite technology consisting of a polymer and organicallymodified layered filler (organo-clay) because they often exhibitremarkably improved mechanical and various other materialsproperties as compared with those of virgin polymer or conven-tional composite (micro/macro-composites) [1–5]. These concur-rent property improvements are well beyond what can be generallyachieved through the micro/macro-composites preparation.
Toyota group first explored the synthetic strategy and moleculardesign in nylon 6-based nano-composites (N6NCs) [6–8]. Thedispersed montmorillonite (MMT) particles in the N6NCs havesome contribution to enhance the nucleation (i.e. nucleatingagents) [9,10]. Nylon 6 was crystallized extensively in the g-form inthe nano-composite because of the epitaxial crystallization, whichwas also revealed from the transmission electron microscopicimages [10]. In the pseudo-hexagonal g-form crystals, the molec-ular chains have to twist away from the zigzag planes to formhydrogen bonds among the parallel chains in the crystals givingrise to lesser inter-chain interactions compared with the
x: þ81 052 809 1864.oto).
All rights reserved.
monoclinic a-form, which are all-trans and packed in more stableantiparallel-chain arrangement of hydrogen bonds [11].
Mathias et al. [12] have investigated N6NC using 15N nuclearmagnetic resonance and concluded that the MMT particles stabilizethe g-phase of nylon 6. Thus, the formation of the g-form in thepresence of MMT particles is well known [9,10,12–18] and some ofthe property enhancements of N6NCs [6–8] are reported in theliterature.
Besides the nucleating effect, the MMT surfaces (silicate layers)can also clearly retard the crystal growth process [14,19]. The MMT-induced reduction of the overall crystallization rate is due to thedisruption of lamella growth by the well dispersed MMT particles[14]. Homminga et al. [20] suggested that the silicate layers hinderthe diffusion of polymer chains to the crystal growth front andimpurity migration away from the growth front takes place. Miltneret al. [21] reported that the interaction between nylon 6 and MMTreduce the mobility of the polymer chain which benefits to form theg-phase, depending on the nature of the organo-clay (MMT-inter-calant). Furthermore, once a percolated network of the dispersedMMT particles is formed, the networks retard crystalline capabilityas reported by Wang et al. [22].
Despite extensive studies of the polymer crystallization in N6NCsystems, the correlation between the nucleating effect and thegrowth mechanism of the different polymorphism (g-phase)underlying these observation is not very well explored in theliterature.
In this regard, to prove the effect of the dispersed MMT particleson the crystallization kinetics and crystalline morphology of nylon
Y. Katoh, M. Okamoto / Polymer 50 (2009) 4718–4726 4719
6 upon nano-composite formation, we have characterized in thiswork by using light scattering, wide-angle X-ray diffraction(WAXD), transmission electron microscope (TEM) and rheologicalmeasurement.
2. Experimental section
2.1. Materials
The N6NC were kindly supplied by Dr. A. Usuki of Toyota CentralR&D Labs. Inc. It was synthesized by in-situ polymerization of3-caprolactam in lauryl ammonium intercalated montmorillonite inthe presence of small amount of 6-aminocaproic acid (the number-average molecular weight Mn of 19.7�103 g/mol) for N6C3.7 [10].The amount of inorganic montmorillonite (MMT) part, obtainedfrom the burning out of organic part, was 3.7% and is designated asN6C3.7. The Mn of pure nylon 6 polymerized in bulk is 21.7�103 g/mol.
2.2. Crystallization
The dried N6C3.7 pellets were converted into sheets witha thickness of 0.8–1.1 mm by pressing with z1 MPa at 250 �C for2 min using a hot press. The molded sheets were again annealed at250 �C for 2 min, and then they were quickly transferred into a hotstage set at the desired crystallization temperature (Tc) (¼150–215 �C) and crystallized until full solidification (confirmed from thekinetics of crystallization using a polarizing optical microscope(POM)). The crystallized specimens were characterized by usingdifferential scanning calorimeter (DSC), wide-angle X-ray diffrac-tion (WAXD) and transmission electron microscope (TEM).
2.3. Differential scanning calorimetry (DSC)
The crystallized specimens were characterized by usingtemperature-modulated DSC (TMDSC) (TA 2920; TA Instruments)at the heating/cooling rate of 5 �C/min with a heating/cooling cycleof the modulation period of 60 s and an amplitude of þ/�0.769 �C,to determine the crystallization temperature with cooling frommelt (Tcc), the melting temperature (Tm) and heat of fusion (DH), theDSC was calibrated with Indium before experiments. For themeasurement of degree of crystallinity (cc) prior to TMDSC analysis,the extra heat absorbed by the crystallites formed during heatinghad to be subtracted from the total endothermic heat flow due tothe melting of the whole crystallites. This can be done according tothe principles and procedures described in our previous paper [23].By considering the melting enthalpy of 100% crystalline nylon 6(a-phase as 241 J/g and g-phase as 239 J/g, respectively [24]), wehave estimated the value of the cc of neat nylon 6 and N6C3.7, andthese values are also presented in Table 1.
2.4. Wide-angle X-ray diffraction (WAXD)
WAXD analyses were performed for neat nylon 6 and nano-composite using an Mxlabo X-ray diffractometer (MAC Science Co.;3 kW, graphite monochromator, CuKa radiation (lx¼ 0.154 nm),operated at 40 kV and 20 mA). Samples were scanned in fixed time
Table 1TMDSC properties of neat nylon6 and its nano-composite.
Samples Tcc/�C Tm/�C DHrev/J/g DHnonrev/J/g DHdiff/J/g cc/%
Nylon 6 176.2 221.5 80.0 15.0 65.0 27.0N6C3.7 186.0 215.4 57.1 2.9 54.2 22.7
mode with counting time of 2 s at room temperature underdiffraction angle (2Q) in the range of 1�–55�.
2.5. Transmission electron microscopy (TEM)
Nanoscale structure of N6C3.7 was investigated by means ofTEM (H-7100, Hitachi Co.), operating at an accelerating voltage of100 kV. The ultra thin sections (the edge of the sample sheetperpendicular to the compression mold) with a thickness of 80 nmwere microtomed at �80 �C using a Reichert Ultra cut cryo-ultra-microtome after suitably staining the sample with 12 Tung-stophosphoric acid at 80 �C for 2 h.
2.6. Rayleigh scattering photometry and polarized opticalmicroscope
We have employed time-resolved light scattering (LS)photometry to estimate the overall crystallization rate and itskinetics in the supercooled state of neat nylon 6 and N6C3.7. Thethin sample of about 40 mm thickness was quickly transferred fromthe melt state (w250 �C for 2 min in order to remove the thermalhistory) to the Linkam hot stage (Linkam RTVMS, Linkam ScientificInstruments, Ltd.), placed in the LS apparatus, set at the pre-determined temperature, and immediately after attaining the Tc,a time-resolved LS measurement was carried out in the tempera-ture range of 150–215 �C in the supercooled state under thequiescent state. It should be mentioned here that there was sometime lag between putting the sample on hot stage and to switch onthe computer to collect the data which is w1 s, sufficient for theequilibration of temperature. The one-dimensional photometerwas equipped with a 38-channel photodiode (PDA: HamamastuPhotonics Co.) array, which facilitated the angular dependence ofscattering angle (qLS) was covered between 1.4� and 30�. Theradiation of polarized He–Ne laser of 632.8 nm wavelengths wasused vertically to the sample, and the scattering profile wasobserved at an azimuthal angle of 45� under HV (cross-polarized)alignment. We also used a conventional Polaroid camera (cameralength¼ 100–400 mm, which gave a scattering vector range of0.37–4.15 mm�1) to recover the scattering patterns on a photo-graphic film (Fuji FP-100B; ISO¼ 100) with an exposure time of1/250 s [25]. The photographs were taken after full solidification ofthe sample.
We also measured the spherulite growth of neat nylon 6 andN6C3.7 in the temperature range of 150–215 �C. The thin sampleswere crystallized on the Linkam hot stage mounted on a polarizedoptical microscope (POM) (Nikon OPTI-PHOTO2-POL), and thedeveloped spherulite was measured with time using a videorecording system (Linkam RTVMS, Linkam Scientific Instruments,Ltd.). After complete crystallization, the samples were observedusing POM and fitted with a color-sensitive plate to determine thesign of birefringence, and then photographs were taken. Thedetails regarding POM observation can be found in our previouspaper [25].
2.7. Melt rheology
Melt rheological measurements were conducted on a RDAIIinstrument with a torque transducer capable of measurements inthe range of 0.2–200 g cm. Dynamic oscillatory shear measure-ments were performed by applying a time dependent strain ofg(t)¼ gosin(ut) and the resultant shear stress is s(t)¼ go
[G0sin(ut)þG00cos(ut)], with G0 and G00 being the storage and lossmodulus, respectively. Measurements were conducted by usinga set of 25 mm diameter parallel plates with a sample thickness ofw0.8 mm and in the temperature range of 225–255 �C. The strain

Y. Katoh, M. Okamoto / Polymer 50 (2009) 4718–47264720
amplitude was fixed to 15% for nylon 6 and 10% for N6C3.7,respectively, to obtain reasonable signal intensities even at elevatedtemperature or low frequency (u) to avoid the nonlinear response.For each sample investigated, the limits of linear viscoelasticitywere determined by performing strain sweeps at a series of fixedu0s. The master curves were generated using the principle of time–temperature superposition and shifted to a common referencetemperature (Tr) of 225 �C, which was chosen as the most repre-sentative of a typical processing temperature of nylon 6.
Fig. 2. Polarized optical micrographs with time variation for neat nylon 6 ((a)–(c)) andits nano-composite (N6C3.7) ((a0)–(c0)) isothermally crystallized at 190 �C.
3. Results and discussion
3.1. Crystallization behavior
Fig. 1 shows the TMDSC thermograms of neat nylon 6 andN6C3.7 during cooling from melt state (w260 �C) and 2nd heatingwith a rate of 5 �C/min. For N6C3.7, the evolution of the crystalli-zation peak is sharp and its maximum is at 186 �C. For the neatnylon 6, this peak is much broader and it appears at 176 �C. Thedispersed MMT particles in N6C3.7 promote the crystallizationpossibly due to the nucleation effect. In the TMDSC experiments,the endothermic heat flow (DHdifference) of the initially existingcrystallites can be easily calculated as DHdifference¼DHrev�DHnonrev, where DHrev is the endothermic melting(reversible) enthalpy from the reversing heat flow profile andDHnonrev is the exothermic ordering/crystallization (nonreversible)enthalpy from the nonreversing heat flow profile appearing in thetemperature range of 150–230 �C. The estimate values of cc areshown in Table 1. The presence of MMT particles cause a slight shiftin the melting peak to slightly lower temperature (215.4 �C) andlower total crystallinity. In our previous observation [10], the lowerTm has been attributed to an increased fraction of g-phase crys-tallites present in N6C3.7.
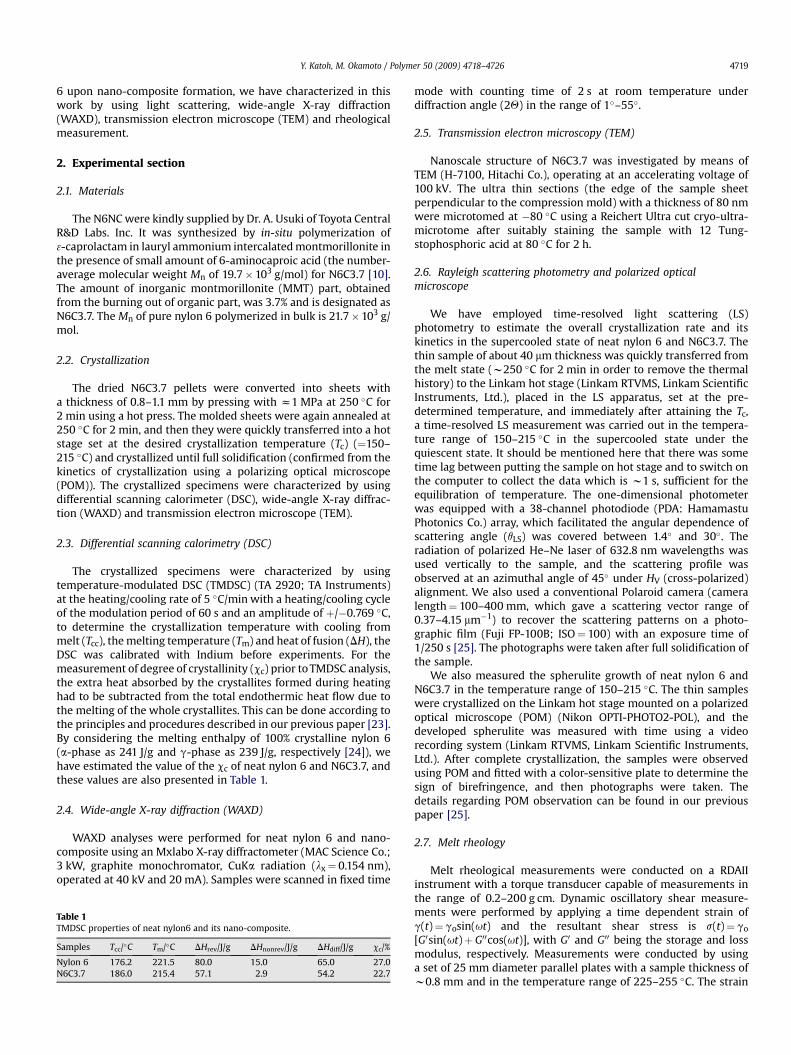
Figs. 2 and 3 represent the typical example of POM micrographs(with time variation at 190 �C) and the corresponding LS patterns(with a range of isothermal Tc) under Hv optical alignment for neatnylon 6 and N6C3.7, respectively. The crystallization had beencompleted for 60 s. The clear spherulites with positive birefrin-gence appeared and the four-leaf-clover patterns of Hv-LS pattern
-1
-0.5
0
0.5
1
Cooling rate5.0 oC / min
Nylon 6*
176.2 oC
*221.5 oC
2nd-heating
N6C3.7186.0 oC
Temperature / ºC
*215.4 oC
2nd-heating
*
-1
-0.5
0
0.5
1
-100 -50 0 50 100 150 200 250 300
Hea
t fl
ow /
W/g
Fig. 1. TMDSC scans for neat nylon 6 and its nano-composite (N6C3.7).
were seen for the crystallized neat nylon 6. It is well known that atcrystallization temperature (150–215 �C), neat nylon 6 crystallizesto form positive spherulites [26]. The clear four-leaf-clover patternsare due to the high ordering in both tangential and radial directionin the spherulite [26].
In contrast, for N6C3.7, the diffuse maltese cross patterns withvery weak positive birefringence as seen in Fig. 2(a0)–(c0) and therod-like pattern is observed clearly in Fig. 3(c0)–(f0) rather thanfour-leaf-clover pattern. The rod-like scattering pattern is ascribedto the parallel arrangement of radiation primary lamellae and thedisordered arrangement of lamellae and the weak positive bire-fringence to the low density of the lamellae. The formation of thelamellae may be restricted due to small space (yxMMT) surroundedby the dispersed MMT particles in the nylon 6 matrix. Theseinteresting features may be related with the formation of g-phasecrystallite of the crystallized N6C3.7.
3.2. g-phase crystallite
The typical WAXD patterns of nylon 6 and N6C3.7 are shown inFig. 4 to explain the formation of g-phase crystallite. The assign-ment of the reflections associated with both a- and g-phases ofnylon 6 are based on the unit cell and chain configurations reportedin the literature [27]. In Fig. 4(a), the diffraction peaks at 2Q¼ 20.3�
and 23.3� correspond to the planes (200) and (002)þ (202) ofa-phase crystallite (monoclinic unit cell), which will be hereafterdefined as a1 and a2, respectively. The diffraction peaks (020) and(011) planes of g-phase crystallite (pseudo-hexagonal unit cell)appear at 2Q¼ 10.7� and 21.3�, which will be hereafter defined asg1 and g2, respectively. At lower Tc (¼150 �C), the neat nylon 6exhibits both the extended all-trans a-form and the pleated shee-ted g-form crystalline structure. With increasing Tc, the g-formgradually decreases and vanishes at Tc¼ 215 �C or higher
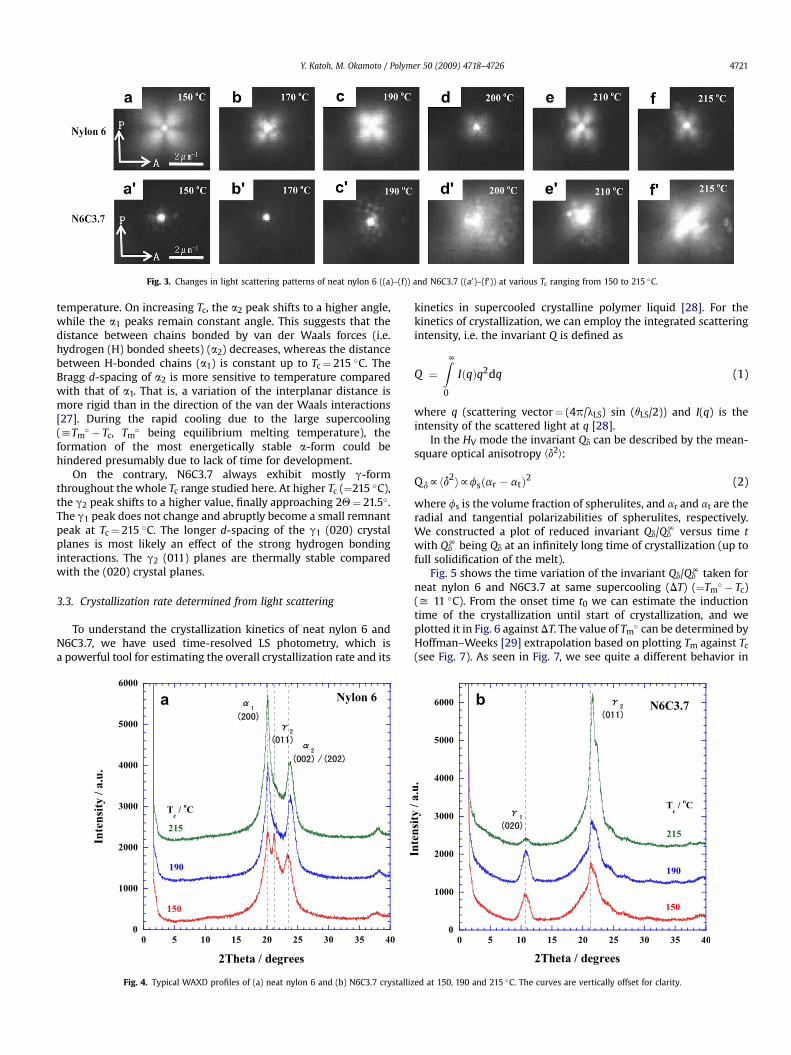
Fig. 3. Changes in light scattering patterns of neat nylon 6 ((a)–(f)) and N6C3.7 ((a0)–(f0)) at various Tc ranging from 150 to 215 �C.
Y. Katoh, M. Okamoto / Polymer 50 (2009) 4718–4726 4721
temperature. On increasing Tc, the a2 peak shifts to a higher angle,while the a1 peaks remain constant angle. This suggests that thedistance between chains bonded by van der Waals forces (i.e.hydrogen (H) bonded sheets) (a2) decreases, whereas the distancebetween H-bonded chains (a1) is constant up to Tc¼ 215 �C. TheBragg d-spacing of a2 is more sensitive to temperature comparedwith that of a1. That is, a variation of the interplanar distance ismore rigid than in the direction of the van der Waals interactions[27]. During the rapid cooling due to the large supercooling(hTm
� � Tc, Tm� being equilibrium melting temperature), the
formation of the most energetically stable a-form could behindered presumably due to lack of time for development.
On the contrary, N6C3.7 always exhibit mostly g-formthroughout the whole Tc range studied here. At higher Tc (¼215 �C),the g2 peak shifts to a higher value, finally approaching 2Q¼ 21.5�.The g1 peak does not change and abruptly become a small remnantpeak at Tc¼ 215 �C. The longer d-spacing of the g1 (020) crystalplanes is most likely an effect of the strong hydrogen bondinginteractions. The g2 (011) planes are thermally stable comparedwith the (020) crystal planes.
3.3. Crystallization rate determined from light scattering
To understand the crystallization kinetics of neat nylon 6 andN6C3.7, we have used time-resolved LS photometry, which isa powerful tool for estimating the overall crystallization rate and its
a
Fig. 4. Typical WAXD profiles of (a) neat nylon 6 and (b) N6C3.7 crystalliz
kinetics in supercooled crystalline polymer liquid [28]. For thekinetics of crystallization, we can employ the integrated scatteringintensity, i.e. the invariant Q is defined as
Q ¼ZN0
IðqÞq2dq (1)
where q (scattering vector¼ (4p/lLS) sin (qLS/2)) and I(q) is theintensity of the scattered light at q [28].
In the HV mode the invariant Qd can be described by the mean-square optical anisotropy Cd2
D:
Qdfhd2iffsðar � atÞ2 (2)
where fs is the volume fraction of spherulites, and ar and at are theradial and tangential polarizabilities of spherulites, respectively.We constructed a plot of reduced invariant Qd/Qd
N versus time twith Qd
N being Qd at an infinitely long time of crystallization (up tofull solidification of the melt).
Fig. 5 shows the time variation of the invariant Qd/QdN taken for
neat nylon 6 and N6C3.7 at same supercooling (DT) (¼Tm� � Tc)
(y 11 �C). From the onset time t0 we can estimate the inductiontime of the crystallization until start of crystallization, and weplotted it in Fig. 6 against DT. The value of Tm
� can be determined byHoffman–Weeks [29] extrapolation based on plotting Tm against Tc
(see Fig. 7). As seen in Fig. 7, we see quite a different behavior in
b
ed at 150, 190 and 215 �C. The curves are vertically offset for clarity.
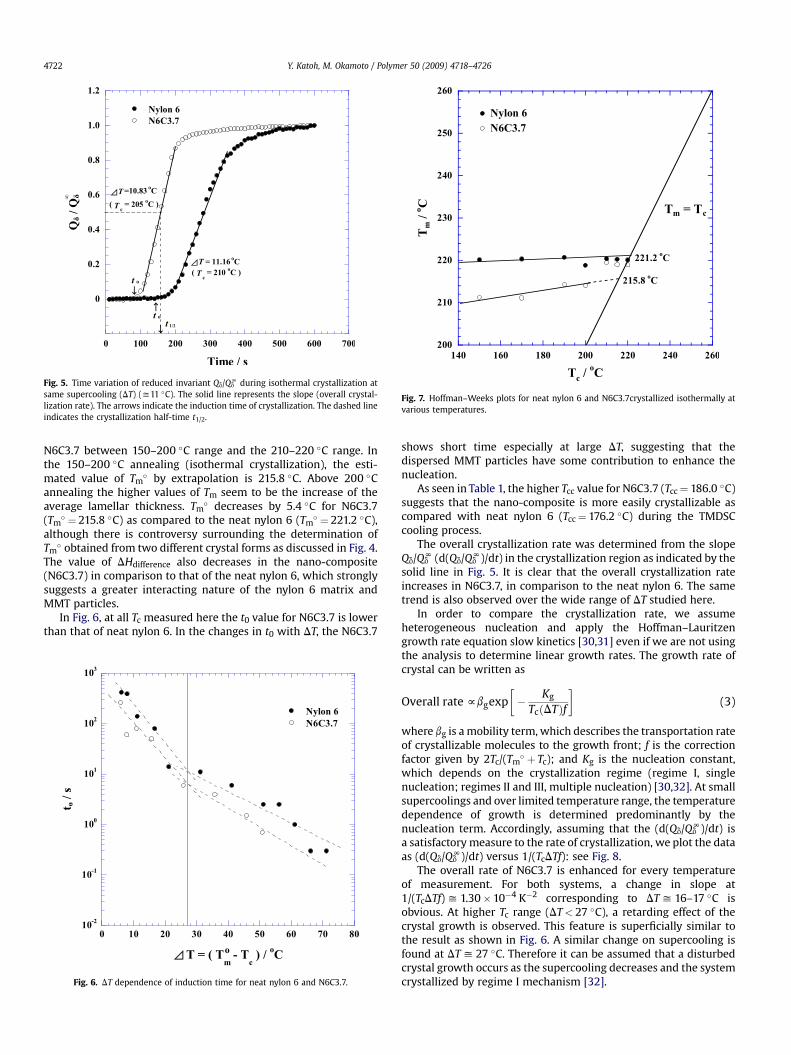
Fig. 5. Time variation of reduced invariant Qd/QdN during isothermal crystallization at
same supercooling (DT) (y11 �C). The solid line represents the slope (overall crystal-lization rate). The arrows indicate the induction time of crystallization. The dashed lineindicates the crystallization half-time t1/2.
Fig. 7. Hoffman–Weeks plots for neat nylon 6 and N6C3.7crystallized isothermally atvarious temperatures.
Y. Katoh, M. Okamoto / Polymer 50 (2009) 4718–47264722
N6C3.7 between 150–200 �C range and the 210–220 �C range. Inthe 150–200 �C annealing (isothermal crystallization), the esti-mated value of Tm
� by extrapolation is 215.8 �C. Above 200 �Cannealing the higher values of Tm seem to be the increase of theaverage lamellar thickness. Tm
� decreases by 5.4 �C for N6C3.7(Tm
� ¼ 215.8 �C) as compared to the neat nylon 6 (Tm� ¼ 221.2 �C),
although there is controversy surrounding the determination ofTm� obtained from two different crystal forms as discussed in Fig. 4.
The value of DHdifference also decreases in the nano-composite(N6C3.7) in comparison to that of the neat nylon 6, which stronglysuggests a greater interacting nature of the nylon 6 matrix andMMT particles.
In Fig. 6, at all Tc measured here the t0 value for N6C3.7 is lowerthan that of neat nylon 6. In the changes in t0 with DT, the N6C3.7
Fig. 6. DT dependence of induction time for neat nylon 6 and N6C3.7.
shows short time especially at large DT, suggesting that thedispersed MMT particles have some contribution to enhance thenucleation.
As seen in Table 1, the higher Tcc value for N6C3.7 (Tcc¼ 186.0 �C)suggests that the nano-composite is more easily crystallizable ascompared with neat nylon 6 (Tcc¼ 176.2 �C) during the TMDSCcooling process.
The overall crystallization rate was determined from the slopeQd/Qd
N (d(Qd/QdN)/dt) in the crystallization region as indicated by the
solid line in Fig. 5. It is clear that the overall crystallization rateincreases in N6C3.7, in comparison to the neat nylon 6. The sametrend is also observed over the wide range of DT studied here.
In order to compare the crystallization rate, we assumeheterogeneous nucleation and apply the Hoffman–Lauritzengrowth rate equation slow kinetics [30,31] even if we are not usingthe analysis to determine linear growth rates. The growth rate ofcrystal can be written as
Overall rate fbgexp�� Kg
TcðDTÞf
�(3)
where bg is a mobility term, which describes the transportation rateof crystallizable molecules to the growth front; f is the correctionfactor given by 2Tc/(Tm
� þ Tc); and Kg is the nucleation constant,which depends on the crystallization regime (regime I, singlenucleation; regimes II and III, multiple nucleation) [30,32]. At smallsupercoolings and over limited temperature range, the temperaturedependence of growth is determined predominantly by thenucleation term. Accordingly, assuming that the (d(Qd/Qd
N)/dt) isa satisfactory measure to the rate of crystallization, we plot the dataas (d(Qd/Qd
N)/dt) versus 1/(TcDTf): see Fig. 8.The overall rate of N6C3.7 is enhanced for every temperature
of measurement. For both systems, a change in slope at1/(TcDTf) y 1.30�10�4 K�2 corresponding to DT y 16–17 �C isobvious. At higher Tc range (DT< 27 �C), a retarding effect of thecrystal growth is observed. This feature is superficially similar tothe result as shown in Fig. 6. A similar change on supercooling isfound at DT y 27 �C. Therefore it can be assumed that a disturbedcrystal growth occurs as the supercooling decreases and the systemcrystallized by regime I mechanism [32].
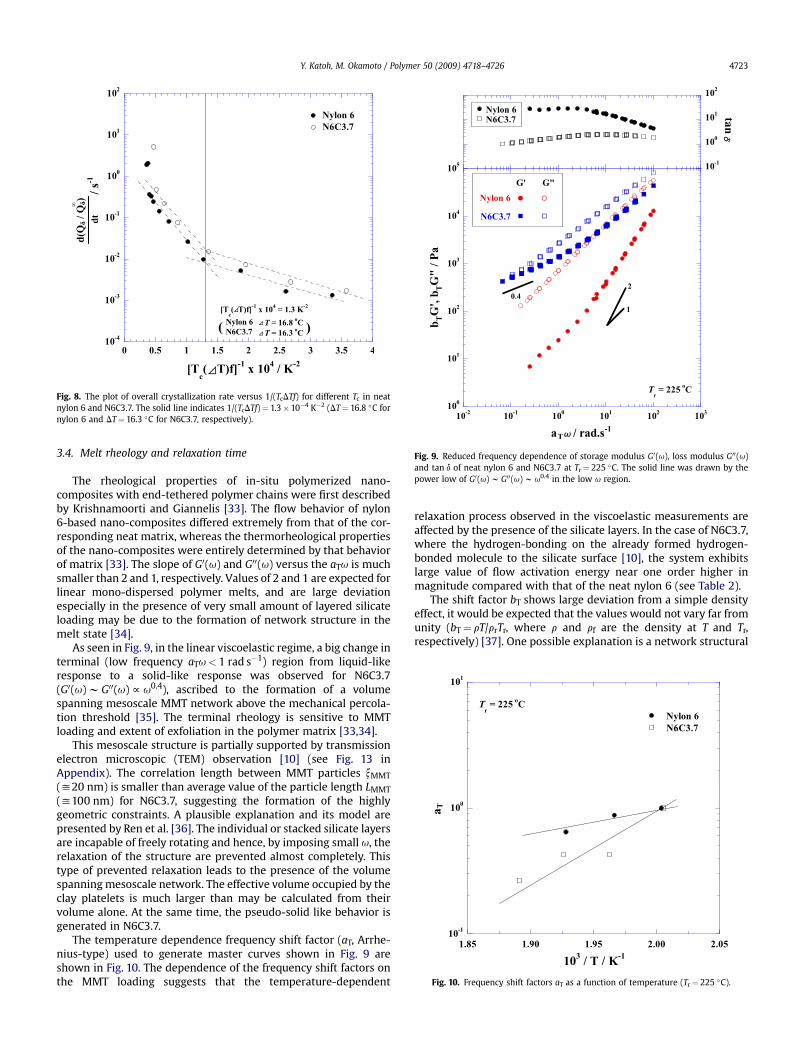
Fig. 8. The plot of overall crystallization rate versus 1/(TcDTf) for different Tc in neatnylon 6 and N6C3.7. The solid line indicates 1/(TcDTf)¼ 1.3�10�4 K�2 (DT¼ 16.8 �C fornylon 6 and DT¼ 16.3 �C for N6C3.7, respectively).
Fig. 9. Reduced frequency dependence of storage modulus G0(u), loss modulus G00(u)and tan d of neat nylon 6 and N6C3.7 at Tr¼ 225 �C. The solid line was drawn by thepower low of G0(u) w G00(u) w u0.4 in the low u region.
Fig. 10. Frequency shift factors aT as a function of temperature (Tr¼ 225 �C).
Y. Katoh, M. Okamoto / Polymer 50 (2009) 4718–4726 4723
3.4. Melt rheology and relaxation time
The rheological properties of in-situ polymerized nano-composites with end-tethered polymer chains were first describedby Krishnamoorti and Giannelis [33]. The flow behavior of nylon6-based nano-composites differed extremely from that of the cor-responding neat matrix, whereas the thermorheological propertiesof the nano-composites were entirely determined by that behaviorof matrix [33]. The slope of G0(u) and G00(u) versus the aTu is muchsmaller than 2 and 1, respectively. Values of 2 and 1 are expected forlinear mono-dispersed polymer melts, and are large deviationespecially in the presence of very small amount of layered silicateloading may be due to the formation of network structure in themelt state [34].
As seen in Fig. 9, in the linear viscoelastic regime, a big change interminal (low frequency aTu< 1 rad s�1) region from liquid-likeresponse to a solid-like response was observed for N6C3.7(G0(u) w G00(u) f u0.4), ascribed to the formation of a volumespanning mesoscale MMT network above the mechanical percola-tion threshold [35]. The terminal rheology is sensitive to MMTloading and extent of exfoliation in the polymer matrix [33,34].
This mesoscale structure is partially supported by transmissionelectron microscopic (TEM) observation [10] (see Fig. 13 inAppendix). The correlation length between MMT particles xMMT
(y20 nm) is smaller than average value of the particle length LMMT
(y100 nm) for N6C3.7, suggesting the formation of the highlygeometric constraints. A plausible explanation and its model arepresented by Ren et al. [36]. The individual or stacked silicate layersare incapable of freely rotating and hence, by imposing small u, therelaxation of the structure are prevented almost completely. Thistype of prevented relaxation leads to the presence of the volumespanning mesoscale network. The effective volume occupied by theclay platelets is much larger than may be calculated from theirvolume alone. At the same time, the pseudo-solid like behavior isgenerated in N6C3.7.
The temperature dependence frequency shift factor (aT, Arrhe-nius-type) used to generate master curves shown in Fig. 9 areshown in Fig. 10. The dependence of the frequency shift factors onthe MMT loading suggests that the temperature-dependent
relaxation process observed in the viscoelastic measurements areaffected by the presence of the silicate layers. In the case of N6C3.7,where the hydrogen-bonding on the already formed hydrogen-bonded molecule to the silicate surface [10], the system exhibitslarge value of flow activation energy near one order higher inmagnitude compared with that of the neat nylon 6 (see Table 2).
The shift factor bT shows large deviation from a simple densityeffect, it would be expected that the values would not vary far fromunity (bT¼ rT/rrTr, where r and rf are the density at T and Tr,respectively) [37]. One possible explanation is a network structural

Table 2Vertical shift factor (bT) and flow activation energy (Ea) for ionomers and nano-composites.
Samples T/�C bT Eaa/kJ/mol
Nylon 6 225 (¼Tr) 1.00 37.9235 1.0245 1.0
N6C3.7 225 (¼Tr) 1.0 111.2235 0.9245 1.7255 2.2
a We investigated the low frequency values of complex viscosity (jh*j) as a func-tion of temperature in each system. At temperature where a zero-shear value wasnot obtained experimentally, a combination of time–temperature superposition andfitting using the Ellis model was employed to obtain a zero-shear viscosity (jh*j)from a master curve. The values are calculated from Arrhenius-type equation givenas jh*jw exp (Ea/RT).
Y. Katoh, M. Okamoto / Polymer 50 (2009) 4718–47264724
change occurring in N6C3.7 during measurement (shear process).The reconstituting of the layered silicate network probablysupports for the melt under weak shear flow (terminal zone),thereby leads to the increase in the absolute values of G0(u) andG00(u).
To understand the generic dynamic rheology, the cross overfrequency urel in the master curve of the dynamic frequency sweepenables one to predict a relaxation time (¼1/urel), which is deter-mined from the measured master curve when tan d is unity. Fig. 11shows the results of the temperature dependence of relaxation rate(urel), assuming that the rate is of Arrhenius-type. In order todiscuss the correlation between the chain mobility of the nylon 6and the growth mechanism of the g-form crystals, we define 1/t1/2
as a measure of the crystallization rate, taking the crystallizationhalf-time (t1/2) at which the reduced intensity reaches 1/2 in Fig. 5,and we plotted it in Fig. 11 against 1/T. Furthermore, in Fig. 11, wepresent the temperature dependence of the rotational relaxationrate (1/td), which is given by
1=tdw
"ðp=2Þ2
Dr0
#�1
(4)
A quarter period is provided to complete rotational relaxation. Inthe equation (4), the rotary diffusivity (Dr0) of a circular disk (MMT
Fig. 11. Temperature dependence of characteristic relaxation rates (urel and 1/td) andcrystallization rate (1/t1/2) of N6C3.7.
particle) of radius (d) (¼LMMT/2 (¼50 nm)) is simply argued byBrownian motion [38,39]. The rotary diffusivity is given by
Dr0 ¼3kBT4h0d3 (5)
where h0 is the neat nylon 6 matrix viscosity ðyh*0Þ at any
temperatures, kB is the Boltzmann constant , and T is the temper-ature. This time scale (td) is useful to discuss the reconstituting ofthe network via the rotation of the MMT particles as compared withexperimental time scale.
For N6C3.7, the estimated time scale for rotational relaxationrates is about 0.02–0.04 s�1 in the range of temperature between225 and 255 �C. These values are much smaller than the relaxationtime scale (1/urel) (those are in fact 0.066–0.25 s�1), suggesting themajor driving force for the structural evolution (relaxation of themesoscale network) is not simple Brownian relaxation of the MMTparticles. The slope that reflects the activation energy of eachprocess exhibits different value. The activation energy of the crys-tallization process is also estimated in the two range of temperatureblow and above T y 199 �C. The calculated values are presented inTable 3. Interestingly, the activation energy of the crystallizationprocess exhibits large value one order higher in magnitudecompared with those of the relaxation of the network and particlerotation. Another interesting feature is that in the range oftemperature between 200 and 210 �C we could attain a highenough relaxation rate of the network by extrapolation based onplotting urel versus 1/T as compared with the crystallization rates,so that the retarding effect might be overwhelmed.
On the other hand, at Tc¼ 160–190 �C the crystallization withlarge DT provides the disturbed crystal growth and hinder thestable growth of the g-form due to the lack of time for crystallinestructure development. This is supported by the TEM observation.
3.5. g-form morphology
The lamellar morphology and distribution of MMT particles inN6C3.7, crystallized at 170 and 215 �C, have been shown in Fig. 12.The white strips represent the discrete lamellar pattern, and aftera close look, shown in the enlarged view, we clearly observe a blackMMT particle inside the lamella. In other words, the lamellargrowth occurs on both sides of the dispersed MMT particles, i.e. theMMT particle is sandwiched by the lamella formed. The thicknessof the developed lamella is around 5 nm. This is a unique obser-vation of the lamellar orientation on the silicate layers. In the semi-crystalline polymer generally we observe the stacked lamellarorientation [40]. The lamellar pattern at high Tc (¼215 �C)(Fig. 12(b)) is somehow similar but along with the sandwichedstructure, branched lamellae are formed which were originatedfrom the parent sandwiched lamella. There are no silicate particlesinside the branch lamella and the g-phase is formed as revealed byWAXD (see Fig. 4(b)). The thickness of the branch lamella is around4 nm. This value is smaller than that of the parent sandwichedlamella. The difference just corresponds to the thickness of theindividual silicate layer (w1 nm). This epitaxial growth (g-phase)on the parent lamella forms the shish–kebab type of structure,
Table 3Activation energy of each process in N6C3.7.
Process T-range/�C Ea/kJ/mol
urel 225–255 87.91/td 225–255 48.31/t1/2 160–190 195.91/t1/2 200–210 318.3
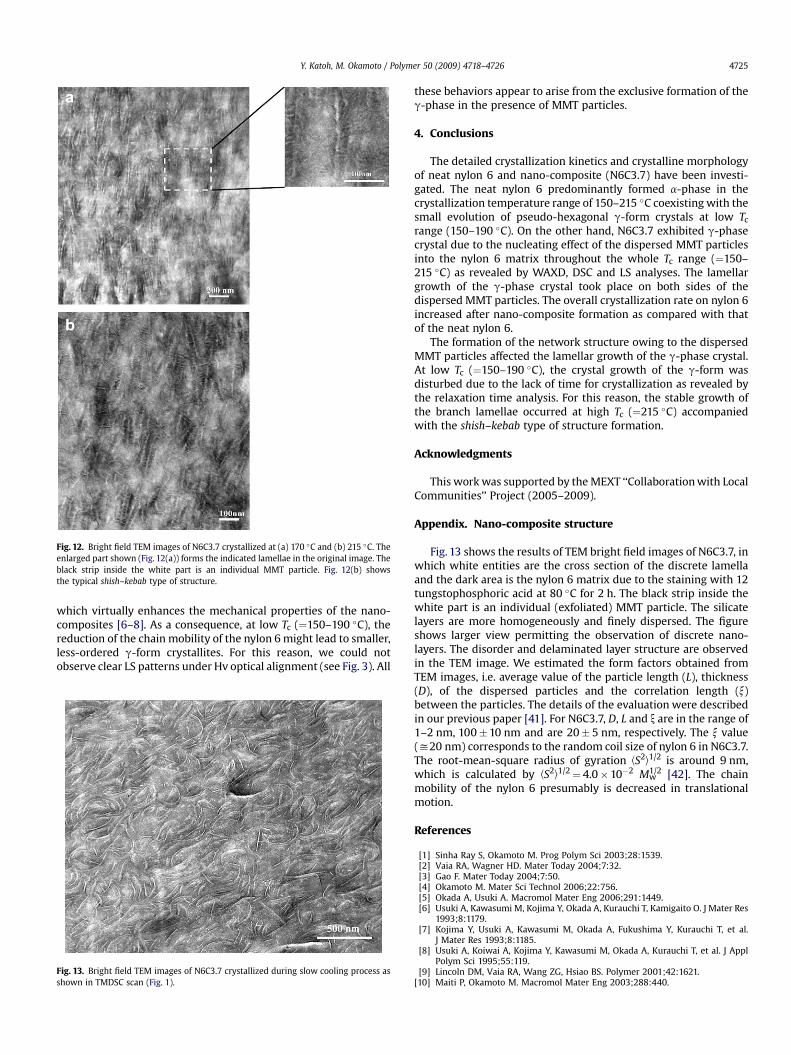
Fig. 12. Bright field TEM images of N6C3.7 crystallized at (a) 170 �C and (b) 215 �C. Theenlarged part shown (Fig. 12(a)) forms the indicated lamellae in the original image. Theblack strip inside the white part is an individual MMT particle. Fig. 12(b) showsthe typical shish–kebab type of structure.
Y. Katoh, M. Okamoto / Polymer 50 (2009) 4718–4726 4725
which virtually enhances the mechanical properties of the nano-composites [6–8]. As a consequence, at low Tc (¼150–190 �C), thereduction of the chain mobility of the nylon 6 might lead to smaller,less-ordered g-form crystallites. For this reason, we could notobserve clear LS patterns under Hv optical alignment (see Fig. 3). All
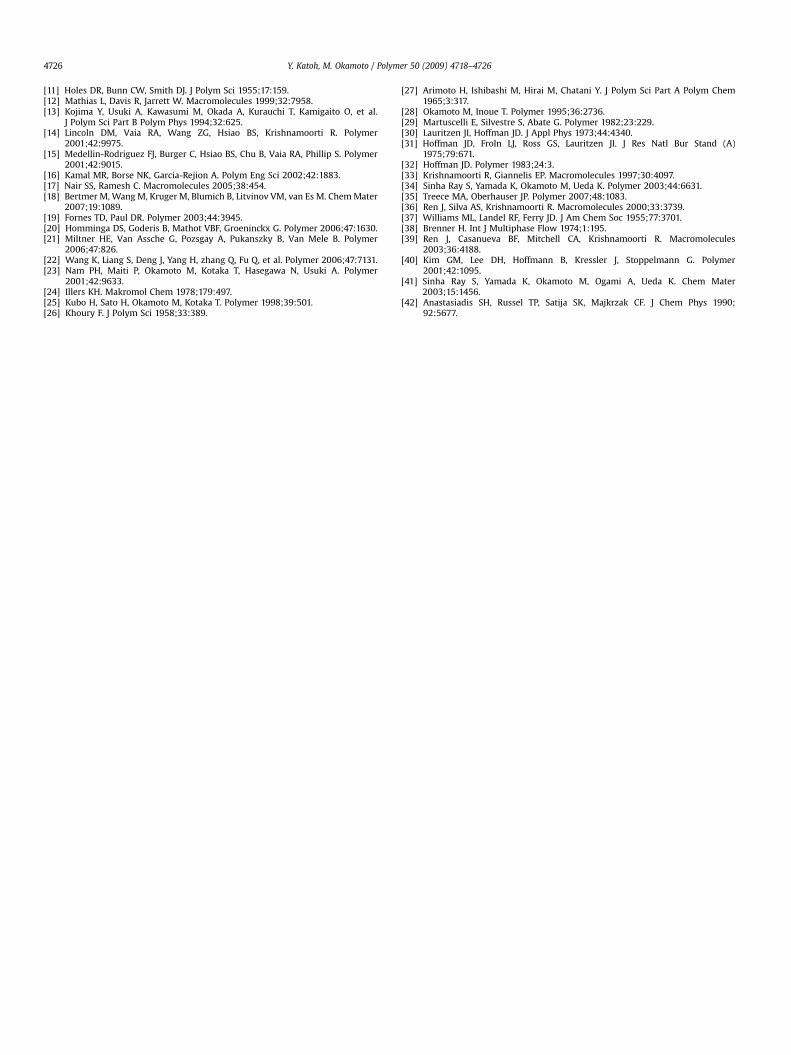
Fig. 13. Bright field TEM images of N6C3.7 crystallized during slow cooling process asshown in TMDSC scan (Fig. 1).
these behaviors appear to arise from the exclusive formation of theg-phase in the presence of MMT particles.
4. Conclusions
The detailed crystallization kinetics and crystalline morphologyof neat nylon 6 and nano-composite (N6C3.7) have been investi-gated. The neat nylon 6 predominantly formed a-phase in thecrystallization temperature range of 150–215 �C coexisting with thesmall evolution of pseudo-hexagonal g-form crystals at low Tc
range (150–190 �C). On the other hand, N6C3.7 exhibited g-phasecrystal due to the nucleating effect of the dispersed MMT particlesinto the nylon 6 matrix throughout the whole Tc range (¼150–215 �C) as revealed by WAXD, DSC and LS analyses. The lamellargrowth of the g-phase crystal took place on both sides of thedispersed MMT particles. The overall crystallization rate on nylon 6increased after nano-composite formation as compared with thatof the neat nylon 6.
The formation of the network structure owing to the dispersedMMT particles affected the lamellar growth of the g-phase crystal.At low Tc (¼150–190 �C), the crystal growth of the g-form wasdisturbed due to the lack of time for crystallization as revealed bythe relaxation time analysis. For this reason, the stable growth ofthe branch lamellae occurred at high Tc (¼215 �C) accompaniedwith the shish–kebab type of structure formation.
Acknowledgments
This work was supported by the MEXT ‘‘Collaboration with LocalCommunities’’ Project (2005–2009).
Appendix. Nano-composite structure
Fig. 13 shows the results of TEM bright field images of N6C3.7, inwhich white entities are the cross section of the discrete lamellaand the dark area is the nylon 6 matrix due to the staining with 12tungstophosphoric acid at 80 �C for 2 h. The black strip inside thewhite part is an individual (exfoliated) MMT particle. The silicatelayers are more homogeneously and finely dispersed. The figureshows larger view permitting the observation of discrete nano-layers. The disorder and delaminated layer structure are observedin the TEM image. We estimated the form factors obtained fromTEM images, i.e. average value of the particle length (L), thickness(D), of the dispersed particles and the correlation length (x)between the particles. The details of the evaluation were describedin our previous paper [41]. For N6C3.7, D, L and x are in the range of1–2 nm, 100�10 nm and are 20� 5 nm, respectively. The x value(y20 nm) corresponds to the random coil size of nylon 6 in N6C3.7.The root-mean-square radius of gyration CS2
D
1/2 is around 9 nm,which is calculated by CS2
D
1/2¼ 4.0�10�2 Mw1/2 [42]. The chain
mobility of the nylon 6 presumably is decreased in translationalmotion.
References
[1] Sinha Ray S, Okamoto M. Prog Polym Sci 2003;28:1539.[2] Vaia RA, Wagner HD. Mater Today 2004;7:32.[3] Gao F. Mater Today 2004;7:50.[4] Okamoto M. Mater Sci Technol 2006;22:756.[5] Okada A, Usuki A. Macromol Mater Eng 2006;291:1449.[6] Usuki A, Kawasumi M, Kojima Y, Okada A, Kurauchi T, Kamigaito O. J Mater Res
1993;8:1179.[7] Kojima Y, Usuki A, Kawasumi M, Okada A, Fukushima Y, Kurauchi T, et al.
J Mater Res 1993;8:1185.[8] Usuki A, Koiwai A, Kojima Y, Kawasumi M, Okada A, Kurauchi T, et al. J Appl
Polym Sci 1995;55:119.[9] Lincoln DM, Vaia RA, Wang ZG, Hsiao BS. Polymer 2001;42:1621.
[10] Maiti P, Okamoto M. Macromol Mater Eng 2003;288:440.
Y. Katoh, M. Okamoto / Polymer 50 (2009) 4718–47264726
[11] Holes DR, Bunn CW, Smith DJ. J Polym Sci 1955;17:159.[12] Mathias L, Davis R, Jarrett W. Macromolecules 1999;32:7958.[13] Kojima Y, Usuki A, Kawasumi M, Okada A, Kurauchi T, Kamigaito O, et al.
J Polym Sci Part B Polym Phys 1994;32:625.[14] Lincoln DM, Vaia RA, Wang ZG, Hsiao BS, Krishnamoorti R. Polymer
2001;42:9975.[15] Medellin-Rodriguez FJ, Burger C, Hsiao BS, Chu B, Vaia RA, Phillip S. Polymer
2001;42:9015.[16] Kamal MR, Borse NK, Garcia-Rejion A. Polym Eng Sci 2002;42:1883.[17] Nair SS, Ramesh C. Macromolecules 2005;38:454.[18] Bertmer M, Wang M, Kruger M, Blumich B, Litvinov VM, van Es M. Chem Mater
2007;19:1089.[19] Fornes TD, Paul DR. Polymer 2003;44:3945.[20] Homminga DS, Goderis B, Mathot VBF, Groeninckx G. Polymer 2006;47:1630.[21] Miltner HE, Van Assche G, Pozsgay A, Pukanszky B, Van Mele B. Polymer
2006;47:826.[22] Wang K, Liang S, Deng J, Yang H, zhang Q, Fu Q, et al. Polymer 2006;47:7131.[23] Nam PH, Maiti P, Okamoto M, Kotaka T, Hasegawa N, Usuki A. Polymer
2001;42:9633.[24] Illers KH. Makromol Chem 1978;179:497.[25] Kubo H, Sato H, Okamoto M, Kotaka T. Polymer 1998;39:501.[26] Khoury F. J Polym Sci 1958;33:389.
[27] Arimoto H, Ishibashi M, Hirai M, Chatani Y. J Polym Sci Part A Polym Chem1965;3:317.
[28] Okamoto M, Inoue T. Polymer 1995;36:2736.[29] Martuscelli E, Silvestre S, Abate G. Polymer 1982;23:229.[30] Lauritzen JI, Hoffman JD. J Appl Phys 1973;44:4340.[31] Hoffman JD, Froln LJ, Ross GS, Lauritzen JI. J Res Natl Bur Stand (A)
1975;79:671.[32] Hoffman JD. Polymer 1983;24:3.[33] Krishnamoorti R, Giannelis EP. Macromolecules 1997;30:4097.[34] Sinha Ray S, Yamada K, Okamoto M, Ueda K. Polymer 2003;44:6631.[35] Treece MA, Oberhauser JP. Polymer 2007;48:1083.[36] Ren J, Silva AS, Krishnamoorti R. Macromolecules 2000;33:3739.[37] Williams ML, Landel RF, Ferry JD. J Am Chem Soc 1955;77:3701.[38] Brenner H. Int J Multiphase Flow 1974;1:195.[39] Ren J, Casanueva BF, Mitchell CA, Krishnamoorti R. Macromolecules
2003;36:4188.[40] Kim GM, Lee DH, Hoffmann B, Kressler J, Stoppelmann G. Polymer
2001;42:1095.[41] Sinha Ray S, Yamada K, Okamoto M, Ogami A, Ueda K. Chem Mater
2003;15:1456.[42] Anastasiadis SH, Russel TP, Satija SK, Majkrzak CF. J Chem Phys 1990;
92:5677.