crystallization kinetics of poly (butylene adipate ... chemical engineering department, federal...
TRANSCRIPT

ISSN 1517-7076 artigo e-12419, 2019
Autor Responsável: Jokdérlea Correa Sousa Data de envio: 05/03/2018 Data de aceite: 29/03/2019
10.1590/S1517-707620190003.0734
Crystallization kinetics of poly (butylene adipate terephthalate) in biocomposite with coconut fiber
Cinética de cristalização do poli (butileno adipato tereftalato) em biocompósitos com fibra de côco
Jokdérlea Correa Sousa 1, Salim Abdelnor Arruda
1, Juliana Cisneiros Lima
1,
Renate Maria Ramos Wellen 2, Eduardo Luis Canedo
3,
Yêda Medeiros Bastos de Almeida 1
1 Chemical Engineering Department, Federal University of Pernambuco, 50.740-520, Recife, Pernambuco, Brazil. 2 Materials Engineering Department, Federal University of Paraíba, 58.051-900, João Pessoa, Paraíba, Brazil. 3 Materials Engineering Department, Federal University of Campina Grande, 58.429-900, Campina Grande, Paraíba,
Brazil.
e-mail: [email protected]
RESUMO
Os parâmetros da cristalização a partir do fundido de um composto de fibras lignocelulósicas de côco disper-
sas em poli (butileno adipato tereftalato) (PBAT), uma matriz de copoliéster totalmente biodegradável, foi
estudada por calorimetria exploratória diferencial (DSC). Os compostos de PBAT/fibra de côco com 10% e
20% de fibra foram preparados num misturador interno de laboratório; a reometria de torque mostrou degra-
dação insignificante durante o processamento. A cristalização não-isotérmica a partir do fundido da matriz
foi estudada por DSC em compostos com 10% de fibra com taxas de resfriamento entre 2 e 32°C/min, e in-
formações quantitativas foram fornecidas em temperaturas e taxas de cristalização, bem como a cristalinidade
desenvolvida, que apresentou valor maior do que o esperado nas altas taxas de resfriamento. Os resultados
cinéticos da cristalização foram correlacionados usando modelos clássicos macrocinéticos: Pseudo-Avrami,
Ozawa e Mo, para obter expressões analíticas quantitativas apropriadas para o processamento. Os modelos
Pseudo-Avrami e Mo representaram bem os dados experimentais. Uma análise detalhada da modelagem é
apresentada, a fim de avaliar as incertezas esperadas. Apesar de desvios observados no início e no final do
processo de cristalização, o modelo Mo é recomendado como a melhor correlação empírica geral dos dados
experimentais para o propósito pretendido.
Palavras-chave: PBAT, fibra vegetal, cristalização a partir do fundido, modelos cinéticos.
ABSTRACT
The melt crystallization characteristics of a compound of coconut lignocellulosic fibers dispersed in
poly(butylene adipate terephthalate) (PBAT), a fully biodegradable copolyester matrix, was studied by dif-
ferential scanning calorimetry (DSC). PBAT/coconut fiber compounds with 10% and 20% filler content were
prepared in a laboratory internal mixer; torque rheometry showed negligible degradation during processing.
Nonisothermal melt crystallization of the matrix was thoroughly studied by DSC in 10% compounds at cool-
ing rates between 2 and 32°C/min, and quantitative information was provided on crystallization temperatures
and rates, as well as the crystallinity developed, which turned out to be higher than expected at the high cool-
ing rates. Crystallization kinetic results were correlated using classical macrokinetic Pseudo-Avrami, Ozawa,
and Mo models, in order to obtain quantitative analytical expressions appropriate for processing applications.
Pseudo-Avrami and Mo models were found to represent well the experimental data. A detailed analysis of
the model fitting is presented, in order to assess the expected uncertainties. Despite its failings at the onset
and end of the crystallization process, Mo model is recommended as best overall empirical correlation of the
experimental data for the intended purpose.

SOUSA, J.C.; ARRUDA, S.A; LIMA, J.C. revista Matéria, v.24, n.3, 2019.
Keywords: PBAT, vegetable fiber, melt crystallization, kinetic models.
1. INTRODUCTION
Persistent polymers are an important source of environmental pollution. New materials with environmentally
friendly characteristics, included biodegradable polymers, have attracted considerable attention in last dec-
ades. Among the new polymers, poly(butylene adipate-co-butylene terephthalate) (PBAT) appears as a prom-
ising option. [1-3]
PBAT is a biodegradable, semi-crystalline, random aliphatic-aromatic copolyester based on the mon-
omers 1,4-butanediol, adipic acid and terephthalic acid. When metabolized in soil or compost under standard
conditions it biodegrades to carbon dioxide, water and biomass. [4-7]
Commercialized by BASF (Germany) under the trade name Ecoflex®, PBAT has properties similar to
low density polyethylene. Rigid aromatic units confer excellent mechanical and physical properties to ali-
phatic-aromatic copolyesters, while retaining the biodegradability promoted by aliphatic units. Particular
applications of PBAT include cling wrap for food packaging, compostable plastic bags for gardening and
agricultural use, water resistant coatings for other materials, etc. Due to its high flexibility and biodegradable
nature, PBAT is also marketed as an additive for more rigid biodegradable plastics, to impart flexibility while
still maintaining the full biodegradability of the blend. [2,8]
In the present contribution coconut fiber, also known as coir, is compounded into PBAT by melt mix-
ing, taking advantage of a readily available and inexpensive filling extracted from the outer shell of the coco-
nut. The vegetable filler has as main constitutes lignin (46%) and cellulose (44%), and has found a limited
use in the manufacture of rope, fishing nets, brushes, doormats, rugs, mattresses, and in insulation panels and
packaging. In Europe, the automobile industry upholsters cars with pads of brown coir bonded with rubber
latex. Also, it has been successfully used in polymeric and ceramic compounds. [9]
Final properties of PBAT are determined by the supramolecular structure, which depends in part on
the crystallization conditions. The addition of a natural filler, such as coconut fiber, may affect PBAT mor-
phology and crystallization behavior. Therefore, it may be interesting to characterize the crystalline devel-
opment of PBAT in natural fiber reinforced compounds. Crystallization kinetics affects optimum processing
protocols and the viability of manufacturing particular items, and allows the rational control of the compound
morphology. [10-12]
In the present work the nonisothermal crystallization of PBAT/coconut fiber was studied by differen-
tial scanning calorimetry (DSC). Classical macrokinetic models of Pseudo-Avrami, Ozawa, and Mo were
applied to the data in order to obtain quantitative correlations apt for processing applications. Activation en-
ergy was estimated using a modified Friedman isoconversional model-free kinetics approach.
2. EXPERIMENTAL
The polymer matrix is basically a random copolymer of 1,4-butanodiol adipate and 1,4-butanodiol tereph-
thalate, with a 1:1 molar ratio of comonomers, which will be identified here as PBAT. The actual material, a
commercial grade known as Ecoflex® F BX7011 supplied by BASF, contains – according to manufacturer‟s
sources [13] – small quantities of a custom polyfunctional comonomer that may allow some (unknown) de-
gree of branching in the otherwise linear structure of PBAT. Density at ambient temperature (ISO 1183) was
reported as 1,26 g/cm3 and melt flow rate (ISO 1133) as 3-8 cm
3/10 min; PBAT is a rubbery amorphous pol-
ymer at ambient temperature (Tg 30°C) [8]. Preliminary tests suggest that PBAT melts between 50°C and
150°C, with a peak at 120°C, and has a low degree of crystallinity (around 15%) [14-15].
Coconut fiber, extracted from the outer layers of the fruit (coco) of the palm Cocos nucifera L (Are-
caceae), is commonly used in gardening as a porous, highly hygroscopic substrate. The material used, sup-
plied by local vendors, was thoroughly dried and screened to select a fraction with particle size between 0.25
to 0.50 mm.
Compounds with 10% and 20% filler (by weight) were prepared in a laboratory internal mixer Haake
Rheomix 3000 fitted with high intensity (roller type) rotors, operated at a 60 rpm nominal rotor speed for15
min, with the chamber wall kept at 160°C and a 70% fill factor. The neat polymer was processed in the same
way to provide a baseline for comparison.
DSC tests were conducted with samples of the PBAT compound with 10% coconut fibers in a Metter-
Toledo DSC-1 instrument with 5 to 7 mg samples under nitrogen flow (50 mL/min). A three-stage tempera-
ture program was used: heating from 25°C to 180°C, cooling to 25°C and reheating to 180°C. Tests were
conducted at nine heating/cooling rates: 2, 3, 4, 6, 8, 12, 16, 24, and 32°C/min. DSC output during the cool-

SOUSA, J.C.; ARRUDA, S.A; LIMA, J.C. revista Matéria, v.24, n.3, 2019.
ing stage was integrated with custom software to obtain PBAT melt crystallization parameters as functions of
cooling rate.
3. RESULTS AND DISCUSSION
3.1 Torque rheometry
Torque (Z ) and temperature (T ) were recorded as functions of time (t ) during processing samples of PBAT
and PBAT/fiber compounds with 10% and 20% fiber in the laboratory internal mixer with mixer chamber
wall kept at 160°C, as shown in Figure 1.
Figure 1: Temperature (a) and torque (b) versus time for the processing of PBAT and PBAT/fiber compounds in the
internal mixer.
Material is substantially molten after 5 min processing; temperature rises and torque gently drops after
that, with values depending (increasing) as the filler content increases. Torque being proportional to melt
viscosity, its value at a given filler concentration depends on polymer molar mass and temperature. To isolate
the former effect, it is convenient to reduce the torque to a reference temperature [16]:
* exp ( *)Z Z T T (1)
where T* is an arbitrary reference temperature and is the exponential temperature coefficient of the
viscosity of the matrix, which may taken as = 0,025 °C1
for PBAT [6]. In filled melts, viscosity – thus,
torque – depends on the filler level [17]; under the terminal processing conditions tested an increase of re-
duced torque with filler content is expected (and observed). On the other hand, variation of reduced torque
with time indicates changes in the matrix molar mass, usually a decrease resulting from thermal degradation,
which may be induced or accelerated in the presence of the filler. Table 1 shows the mean values of tempera-
ture, torque and reduced torque (at T* = 160°C) for the last 5 min (10 to 15 min) processing. Figure 2 shows
the evolution of the reduced torque with time.
Table 1: Average temperature, torque and reduced torque (T* = 160°C) for 10-15 min of processing in the internal mixer.
SYSTEM T Z Z*
(°C) (Nm) (Nm)
PBAT 162.1 2.0 2.1
PBAT/10% fiber 164.5 4.9 5.6
PBAT/20% fiber 166.5 8.6 10.4

SOUSA, J.C.; ARRUDA, S.A; LIMA, J.C. revista Matéria, v.24, n.3, 2019.
Figure 2: Reduced torque versus time during the last 5 min of processing of PBAT and PBAT/fiber compounds in the
internal mixer.
The constancy or reduced torque suggests the absence of degradation for all filler content levels tested.
PBAT behaves as a stable resin under processing conditions.
3.2 Melt crystallization
Time (t ), sample temperature (T ) and heat flow (J ) registered by the instrument at 1 s intervals were inte-
grated, using a suitable virtual baseline (J0 ) and onset/end points visually determined (t1, t2), for the melt
crystallization event. Custom software was employed to obtain the relative crystallinity (x ) and rate of crys-
tallization (c ) as functions of time and temperature:
1
0
0
1( ) ( ) ( )
t
t
x t dtJ t J tE
(2)
0
0
( ) ( )( )
J t J tdxc t
dt E
(3)
where
2
1
0 0( ) ( )t
t
E dtJ t J t (4)
is the total latent heat of phase change. Time and temperature are related through the constant rate of
cooling, = |dT/dt|:
1 1( )T T t t (5)
From the functions x (T ) and c (T ) a series of characteristic crystallization parameters were estimated,
including the initial, mean, and final temperatures T0.1%, T50% and T99.9%, peak crystallization temperature Tc,
maximum crystallization rate cmax, and half-crystallization time ½. Mass crystallinity recovered during the
event was estimated as [12, 18]:
0
0 0
cc
m S P m
H EX
H m w H
(6)
where mS is the sample mass, wP is the mass fraction of the polymer (PBAT) and 0mH is the latent

SOUSA, J.C.; ARRUDA, S.A; LIMA, J.C. revista Matéria, v.24, n.3, 2019.
heat of meting of a 100% crystalline polymer, taken in the present work as 114 J/g [19].
Reproducibility tests reported elsewhere [15] suggests that uncertainties of ±0.2°C in temperatures
and 2% in crystallinity are attainable with the equipment and technique employed with PBAT/vegetable fiber
compounds.
Data were collected for neat PBAT and for 10% and 20% vegetable fiber compounds. Qualitatively
similar results were obtained for all three formulations. Results for PBAT/10% coconut fiber are presented in
detail as an example. Figures 3 and 4 show the relative crystallinity x = x(T ) and rate of crystallization c =
c(T ) for the melt crystallization of PBAT in the compound with 10% filler at all cooling rates tested. Table 2
collects some thermodynamic and kinetic parameters of the event.
Figure 3: Relative crystallinity versus temperature for the melt crystallization of PBAT in the compound with 10% coco-
nut fiber at different cooling rates (indicated).
Figure 4: Rate of crystallization versus temperature for the melt crystallization of PBAT in the compound with 10%
coconut fiber at different cooling rates (indicated).

SOUSA, J.C.; ARRUDA, S.A; LIMA, J.C. revista Matéria, v.24, n.3, 2019.
Table 2: Melt crystallization parameters.
T0,1% T50% T99,9% Tc cmax ½ Hc Xc
(°C/min) (°C) (min-1) (min) (J/g) (%)
2 115.2 98.7 82.5 97.4 0.135 8.27 16.8 11.5
3 112.7 96.1 81.7 94.8 0.219 5.54 17.4 11.9
4 110.2 93.7 79.9 92.5 0.322 4.13 18.4 12.6
6 107.6 90.6 74.6 89.3 0.483 2.85 19.9 13.6
8 105.5 88.2 73.4 86.8 0.653 2.17 19.7 13.4
12 102.3 84.5 70.8 83.1 0.958 1.49 20.9 14.3
16 96.7 81.1 67.6 79.6 1.230 1.17 21.4 14.6
24 96.9 76.6 62.2 75.2 1.681 0.85 23.6 16.1
32 97.7 72.9 49.7 71.5 1.821 0.78 33.2 22.7
Crystallization proceed around a temperature interval slightly over 30°C, at decreasing temperatures
as the cooling rate increases, 97°C at 2 °C/min to 72°C at 32°C/min. The rate of crystallization rises sharply,
keeping pace with the cooling rate (10 to 14 times increase in crystallization rate over a 16 times increase in
cooling rate); Crystallinity increases moderately with the cooling rate: from 11.5% at 2 °C/min to 22.7 at
32°C/min. These results may be attributed to the higher super-cooling (diving force) required to melt crystal-
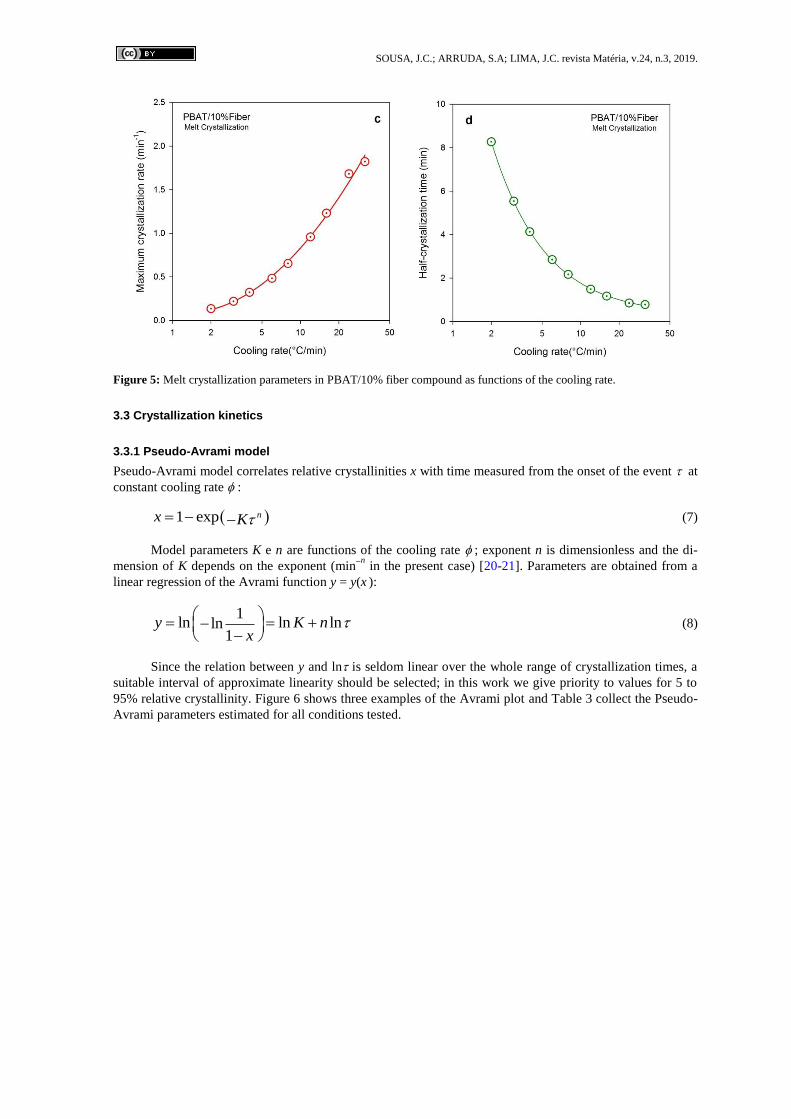
lize the PBAT at higher cooling rates. Figure 5 shows these trends graphically.
SOUSA, J.C.; ARRUDA, S.A; LIMA, J.C. revista Matéria, v.24, n.3, 2019.
Figure 5: Melt crystallization parameters in PBAT/10% fiber compound as functions of the cooling rate.
3.3 Crystallization kinetics
3.3.1 Pseudo-Avrami model
Pseudo-Avrami model correlates relative crystallinities x with time measured from the onset of the event at
constant cooling rate :
1 exp nx K (7)
Model parameters K e n are functions of the cooling rate ; exponent n is dimensionless and the di-
mension of K depends on the exponent (minn
in the present case) [20-21]. Parameters are obtained from a
linear regression of the Avrami function y = y(x ):
1ln ln lnln
1y K n
x
(8)
Since the relation between y and ln is seldom linear over the whole range of crystallization times, a
suitable interval of approximate linearity should be selected; in this work we give priority to values for 5 to
95% relative crystallinity. Figure 6 shows three examples of the Avrami plot and Table 3 collect the Pseudo-
Avrami parameters estimated for all conditions tested.

SOUSA, J.C.; ARRUDA, S.A; LIMA, J.C. revista Matéria, v.24, n.3, 2019.
Figure 6: Avrami plots for PBAT/10% fiber compounds run at three cooling rates: experimental results (symbols), Pseu-
do-Avrami correlation (lines).
Table 3: Pseudo-Avrami parameters.
(°C/min) ln K N r2
2 -7.351 0.012 3.174 0.006 0.997
3 -6.540 0.009 3.325 0.006 0.999
4 -5.924 0.014 3.552 0.012 0.998
6 -5.126 0.020 3.993 0.019 0.996
8 -3.943 0.020 4.035 0.023 0.995
12 -2.566 0.016 4.170 0.028 0.995
16 -1.569 0.013 4.223 0.032 0.995
24 -0.292 0.013 4.324 0.033 0.996
(parameter K in minn
)
It should be noted that Pseudo-Avrami model is only an empirical correlation procedure for noniso-
thermal results obtained at constant heating/cooling rate. Pseudo-Avrami parameters – unlike the formally
similar Avrami parameters for isothermal crystallization – have no physical meaning.
Pseudo-Avrami parameters for melt crystallization of PBAT/10% fiber compounds could be correlat-
ed in terms of the cooling rate:
2 2
2 2
ln 8.4506 1.2296(ln ) 0.4345(ln ) ( 0.996)
2.4237 1.0823(ln ) 0.1525(ln ) ( 0.972)
K r
n r
(9)
Figure 7 shows the results.
SOUSA, J.C.; ARRUDA, S.A; LIMA, J.C. revista Matéria, v.24, n.3, 2019.
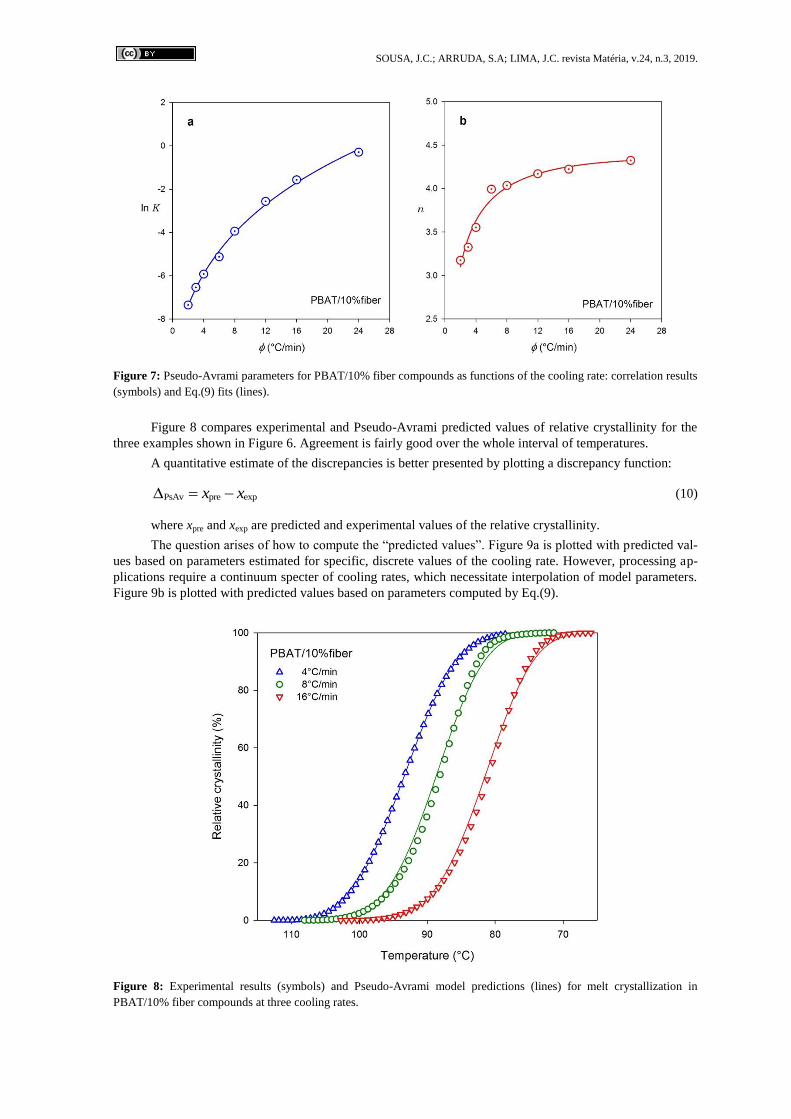
Figure 7: Pseudo-Avrami parameters for PBAT/10% fiber compounds as functions of the cooling rate: correlation results
(symbols) and Eq.(9) fits (lines).
Figure 8 compares experimental and Pseudo-Avrami predicted values of relative crystallinity for the
three examples shown in Figure 6. Agreement is fairly good over the whole interval of temperatures.
A quantitative estimate of the discrepancies is better presented by plotting a discrepancy function:
PsAv pre expx x (10)
where xpre and xexp are predicted and experimental values of the relative crystallinity.
The question arises of how to compute the “predicted values”. Figure 9a is plotted with predicted val-
ues based on parameters estimated for specific, discrete values of the cooling rate. However, processing ap-
plications require a continuum specter of cooling rates, which necessitate interpolation of model parameters.
Figure 9b is plotted with predicted values based on parameters computed by Eq.(9).
Figure 8: Experimental results (symbols) and Pseudo-Avrami model predictions (lines) for melt crystallization in
PBAT/10% fiber compounds at three cooling rates.

SOUSA, J.C.; ARRUDA, S.A; LIMA, J.C. revista Matéria, v.24, n.3, 2019.
Figure 9: Discrepancy between the experimental values of relative crystallinity and those predicted by the Pseudo-
Avrami correlation, using the parameters estimated for each cooling rate (a) and the parameters computed by Eq.(9), for
melt crystallization in PBAT/10% fiber compounds.
While estimated based on individual model parameter is very reasonable, with discrepancies between
5 to 10%, correlated parameters result in large discrepancies, between 20 to 40% in the critical region close
the peak crystallization rate, pointing to the weakness of Pseudo-Avrami model as a correlation procedure:
individual tests result in good prediction but when the issue is to quantitatively predict the crystallization be-
havior at arbitrary cooling rates, its performance is disappointing.
3.3.2 Ozawa model
Ozawa model [22] correlates relative crystallinities x with cooling rate at constant temperature T :
1 exp( )mx (11)
requiring interpolation of the experimental data, which are measured a constant cooling rate. Parame-
ters and m are functions of the temperature; exponent m is dimensionless and the dimension of depends
on the exponent, (°C/min)m in the present case. Parameters are obtained from a linear regression of the Av-
rami-Ozawa function y = y(x ):
1ln ln lnln
1y m
x
(12)
Figure 10 shows the Ozawa plot based on all conditions tested, for temperatures between 110°C and
70°C in 5°C intervals.

SOUSA, J.C.; ARRUDA, S.A; LIMA, J.C. revista Matéria, v.24, n.3, 2019.
Figure 10: Ozawa plots for PBAT/10% fiber compounds at all cooling rates tested.
The plots show clearly that the Avrami-Ozawa functions do not depend linearly on ln ; thus Ozawa
model is not applicable to the system under the conditions tested, as it does not fit the experimental data.
Sometimes a piecewise linear fitting is forced upon part of the data [17, 23], but this is not a good practice,
especially if we are seeking quantitative correlations for use in processing applications.
3.3.3 Mo model
Mo and coworkers [24-25] proposed a model that correlates the cooling rate with crystallization time at
constant relative crystallinity x:
F (13)
Application of the model requires interpolation of the experimental data measured a constant cooling
rate. Parameters Fand are functions of the relative crystallinity; exponent is dimensionless and the di-
mension of F depends on the exponent (min in the present case). Parameters are obtained from a linear re-
gression of:
ln ln lnF (14)
Figure 11 shows four examples of the Mo plot and Table 4 collects Mo parameters based on all condi-
tions tested, estimated for 0.1 x 0.9 in x = 0,1 intervals.

SOUSA, J.C.; ARRUDA, S.A; LIMA, J.C. revista Matéria, v.24, n.3, 2019.
Figure 11: Mo plots for PBAT/10% fiber compounds run at three cooling rates: experimental results (symbols), Mo cor-
relation (lines).
Mo model appears to fit well experimental data, with uncertainties of 2 to 5% in pre-exponential pa-
rameter F and exponent virtually independent of relative crystallinity.
Table 4: Mo parameters.
x (%) ln F r2
10 2.213 ± 0.021 0.841 ± 0.009 1.000
20 2.447 ± 0.028 0.853 ± 0.012 1.000
30 2.589 ± 0.033 0.862 ± 0.014 0.998
40 2.694 ± 0.037 0.870 ± 0.016 0.100
50 2.780 ± 0.041 0.876 ± 0.018 0.997
60 2.855 ± 0.044 0.882 ± 0.019 0.997
70 2.924 ± 0.048 0.886 ± 0.021 0.996
80 2.995 ± 0.052 0.890 ± 0.023 0.995
90 3.080 ± 0.059 0.893 ± 0.026 0.994
(parameter F in min)
Mo parameters for melt crystallization of PBAT/10% fiber compounds could be correlated in terms of
the relative crystallinity:
2 3 2
2 3 2
ln 1.944 3.144 3.963 2.085 ( 0.999)
0.826 0.157 0.139 0.053 ( 1.000)
F x x x r
x x x r
(15)
Figure 12 shows the results.
SOUSA, J.C.; ARRUDA, S.A; LIMA, J.C. revista Matéria, v.24, n.3, 2019.
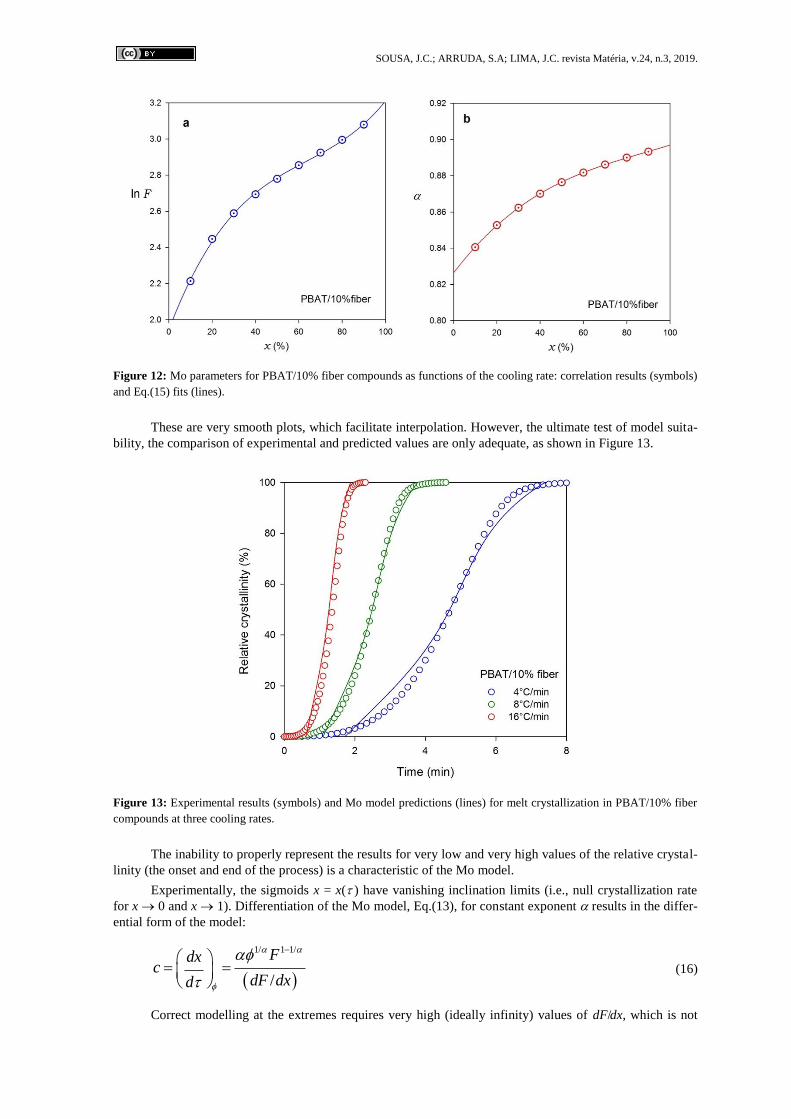
Figure 12: Mo parameters for PBAT/10% fiber compounds as functions of the cooling rate: correlation results (symbols)
and Eq.(15) fits (lines).
These are very smooth plots, which facilitate interpolation. However, the ultimate test of model suita-
bility, the comparison of experimental and predicted values are only adequate, as shown in Figure 13.
Figure 13: Experimental results (symbols) and Mo model predictions (lines) for melt crystallization in PBAT/10% fiber
compounds at three cooling rates.
The inability to properly represent the results for very low and very high values of the relative crystal-
linity (the onset and end of the process) is a characteristic of the Mo model.
Experimentally, the sigmoids x = x( ) have vanishing inclination limits (i.e., null crystallization rate
for x 0 and x 1). Differentiation of the Mo model, Eq.(13), for constant exponent results in the differ-
ential form of the model:
1/ 1 1/
/
Fdxc
dF dxd
(16)
Correct modelling at the extremes requires very high (ideally infinity) values of dF/dx, which is not
SOUSA, J.C.; ARRUDA, S.A; LIMA, J.C. revista Matéria, v.24, n.3, 2019.
the case for the dataset under consideration.
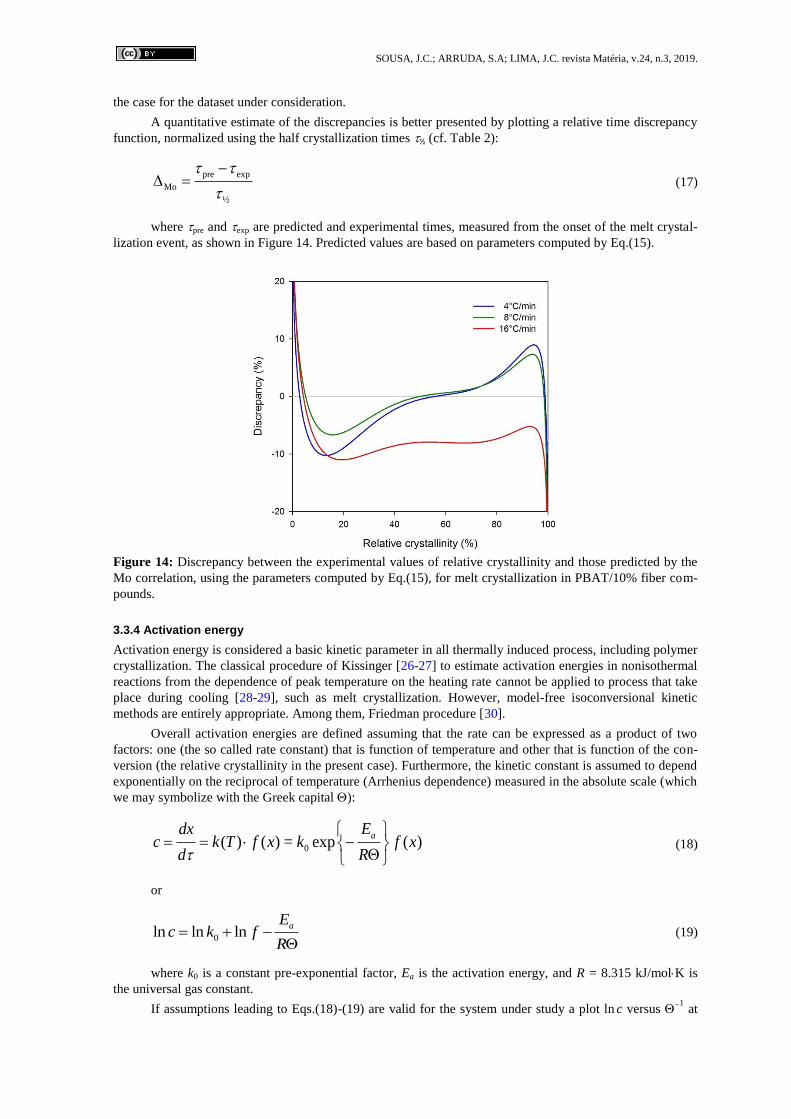
A quantitative estimate of the discrepancies is better presented by plotting a relative time discrepancy
function, normalized using the half crystallization times ½ (cf. Table 2):
pre exp
Mo
½
(17)
where pre and exp are predicted and experimental times, measured from the onset of the melt crystal-
lization event, as shown in Figure 14. Predicted values are based on parameters computed by Eq.(15).
Figure 14: Discrepancy between the experimental values of relative crystallinity and those predicted by the
Mo correlation, using the parameters computed by Eq.(15), for melt crystallization in PBAT/10% fiber com-
pounds.
3.3.4 Activation energy
Activation energy is considered a basic kinetic parameter in all thermally induced process, including polymer
crystallization. The classical procedure of Kissinger [26-27] to estimate activation energies in nonisothermal
reactions from the dependence of peak temperature on the heating rate cannot be applied to process that take
place during cooling [28-29], such as melt crystallization. However, model-free isoconversional kinetic
methods are entirely appropriate. Among them, Friedman procedure [30].
Overall activation energies are defined assuming that the rate can be expressed as a product of two
factors: one (the so called rate constant) that is function of temperature and other that is function of the con-
version (the relative crystallinity in the present case). Furthermore, the kinetic constant is assumed to depend
exponentially on the reciprocal of temperature (Arrhenius dependence) measured in the absolute scale (which
we may symbolize with the Greek capital ):
0( ) ( ) = exp ( )adx E
c k T f x k f xd R
(18)
or
0ln ln lnaE
c k fR
(19)
where k0 is a constant pre-exponential factor, Ea is the activation energy, and R = 8.315 kJ/molK is
the universal gas constant.
If assumptions leading to Eqs.(18)-(19) are valid for the system under study a plot ln c versus 1
at

SOUSA, J.C.; ARRUDA, S.A; LIMA, J.C. revista Matéria, v.24, n.3, 2019.
constant relative crystallinity results in a straight line. The activation energy Ea is then estimated by a linear
regression of the experimental data. In the present case, melt crystallization rates are computed directly from
experimental data collected at different constant cooling rates, which required interpolation to convert them
to constant relative crystallinity. The resulting activation energy is, in general, a function of the conversion.
Figure 15a shows Friedman plot for the melt crystallization of PBAT in PBAT compounds with 10%
fiber content.
Figure 15: Friedman plot to estimate the activation energy: complete dataset showing the nonlinearity (a) and reduced,
approximately linear dataset (b).
Considered over the whole relative crystallinity interval, experimental crystallization rate is not pro-
portional to the exponential of reciprocal absolute temperature, as shown in Figure 15a. However a reduced
data set, excluding low crystallinites (x 20%) and considering only temperatures above 80°C shows suffi-
cient linearity to justify the estimate of activation energies by the Friedman method. The activation energy
based on the reduced dataset, as shown in Figure 15b, is virtually independent of the conversion:
Ea = 167 ± 5 kJ/mol
It is generally agreed that negative activation energies are an indication of complex nature of the pro-
cesses involved in polymer crystallization from the melt [10, 31]. Moreover, the concept of “model free ki-
netics” in general and negative activation energies in particular has been debated in the technical literature
[32-34]. The alternative view, that the Arrhenius description of the temperature dependence of the kinetic
constant for melt crystallization process – simple or complex – is not appropriate should also be considered.
4. CONCLUSIONS
Thermally stable compounds where obtained by melt mixing under selected processing conditions, a fact
confirmed by torque rheometry. Melt crystallization temperature decreased and crystallization rate increased
with cooling rate, as expected; crystallinity increased significantly with cooling rate, a result which was not
expected. Nonisothermal melt crystallization kinetics was well correlated by Pseudo-Avrami and Mo models,
not so by Ozawa‟s. Quantitative assessment of goodness of fit of model predicted data revealed that low un-
certainty of the model parameters, as determined by the standard correlation methods, not always translates
in good prediction of experimental results by interpolating a limited set of experimental DSC data. Overall,
Mo‟s model is recommended for applications that require an analytic expression crystallinity versus time or
temperature.
5. ACKNOWLEDGEMENTS
Authors would like to thank BASF for kindly supplying PBAT. The authors also thank Conselho Nacional de

SOUSA, J.C.; ARRUDA, S.A; LIMA, J.C. revista Matéria, v.24, n.3, 2019.
Desenvolvimento Científico e Tecnológico (CNPq - Brazil 306875/2015-2), Fundação de Amparo à Ciência
e Tecnologia do Estado de Pernambuco (FACEPE - Brazil) and Programa de Recursos Humanos (PRH-
28/ANP - Brazil) for financial support.
6. BIBLIOGRAPHY
[1] NAIR, L. S., LAURENCIN, C. T., “Biodegradable polymers as biomaterials”, Prog. Polym. Sci., v. 32,
pp. 762-798, 2007.
[2] HERRERA, R., FRANCO, L., RODRIGUEZ-GALAN, A., PUIGGALI, J., “Characterization and degra-
dation behavior of poly(butylene adipate-co-terephthalate)”, J. Polym. Sci. Pol. Chem., v. 40, pp. 4141-4157,
2002.
[3] LÖRCKS, J., “Properties and applications of compostable starch-based plastic material”, Polym. Degrad.
Stabil., v. 59, pp. 245-249, 1998.
[4] MOHANTY, A. K., MISRA, M., HINRICHSEN, G., “Biofibres, biodegradable polymers and biocompo-
sites: An overview”, Macromol. Mater. Eng., v. 276-277, pp. 1–24, 2000.
[5] FENG, S., WU, D., LIU, H., et al., “Crystallization and creep of the graphite nanosheets based
poly(butylene adipate-co-terephthalate) biocomposites”, Thermochim Acta, v. 587, pp. 72-80, 2014.
[6] COSTA, A. R. M., ALMEIDA, T. G., SILVA, S. M. L., et al., “Chain extension in poly(butylene-
adipate-terephthalate).Inline testing in a laboratory internal mixer”, Polym. Test., v. 42, pp. 115-121 2015.
[7] WITT, U., MULLER, R. J., DECKWE, W. D., “Biodegradation behavior and material properties of ali-
phatic/aromatic polyesters of commercial importance”, J. Environ. Polym. Degrad., v. 5, pp. 81-89, 1997.
[8] BASF, Product Information: Ecoflex F-Blend C1200. Biodegradable polyester for compostable film,
2013.
[9] FAO, Future fibers: coir. www.fao.org/economic/futurefibres/fibres/coir. Accessed 05-10-2016.
[10] RIES, A., CANEDO, E. L., MONTEIRO, A. E. G., et al., “Model-free non-isothermal crystallization
kinetics of poly(3-hydoxybutyrate) filled with carbon black”, Polym. Test., v. 50, pp. 241–246, 2015.
[11] VITORINO, M. B. C., CIPRIANO, P. B., WELLEN, R. M. R., et al., “Nonisothermal Melt Crystalliza-
tion of PHB/Babassu Compounds. Kinetics of Crystallization”, J. Therm Anal. Calorim., v. 126, pp. 755-769,
2016.
[12] WELLEN, R. M. R., CANEDO, E. L., RABELLO, M. S., “Melting and crystallization of poly(3-
hydroxybutyrate)/carbon black compounds. Effect of heating and cooling cycles on phase transition”, J. Ma-
ter. Res., v. 30, pp. 3211-3226, 2015.
[13] YAMAMOTO, M., WITT, U., SKUPIN, G., et al., Biodegradable Aliphatic-Aromatic Polyesters: Eco-
flex®. Steinbüchel (ed.), Elsevier: New York, 2002.
[14] COSTA, A. R. M., Chain extension of poly (butylene-adipate-terephthalate) with epoxidic polyfunction-
al additive. MSc Thesis, Federal University of Campina Grande, Campina Grande PB, Brazil, 2015.
[15] SOUSA, J. C., Systhesis and crystallization kinetics of biocomposite PBAT/coconut fiber. MSc Thesis,
Federal University of Pernambuco, Recife PE, Brazil, 2015.
[16] ALVES, T. S., NETO, J. E. S., SILVA, S. M. L., et al., “Process simulation of laboratory internal mix-
ers”, Polym. Test., v. 50, pp. 94-100, 2016.
[17] SHENOY, A. V., Rheology of Filled Polymer Systems. Kluwer, Dordrecht, 1999.
[18] CANEDO, E. L., WELLEN, R. M. R., ALMEIDA, Y. M. B., Cristalização de Polímeros – Tratamento
de Dados e Modelagem Macrocinética. ANP PRH-28/DEQ/UFPE, Recife, 2016.
[19] MONDAL, D., BHOWMICK, B., MOLLICK, M., et al., “Antimicrobial activity and biodegradation
behavior of poly(butylene adipate-co-terephthalate)/clay nanocomposites”, J. Appl. Polym. Sci., v. 131, pp.
40079-40088, 2014.
[20] JEZIORNY, A., “Parameters characterizing the kinetics of the non-isothermal crystallization of
poly(ethylene terephthalate) determined by DSC”, Polymer, v. 19, pp. 1142-1144, 1978.
[21] WELLEN, R. M. R., CANEDO, E. L., “Nonisothermal melt and cold crystallization kinetics of PHB
and PHB/CB compounds. Evaluation of Pseudo-Avrami, Ozawa, and Mo models”, J. Mater. Res., v. 31, pp.
729-739, 2016.
[22] OZAWA, T., “Kinetics of non-isothermal crystallization”, Polymer, v. 12, pp. 150-158, 1971.
[23] WELLEN, R. M. R., CANEDO, E. L., RABELLO, M. S., “Nonisothermal cold crystallization of

SOUSA, J.C.; ARRUDA, S.A; LIMA, J.C. revista Matéria, v.24, n.3, 2019.
poly(ethylene terephthalate)”, J. Mater. Res., v. 26, pp. 1107-1115, 2011.
[24] LIU, T., MO, Z., WANG, S., et al., “Nonisothermal melt and cold crystallization kinetics of poly(aryl
ether ether ketone ketone)”, Polym. Eng. Sci., v. 37, pp. 568-575, 1997.
[25] AN, Y., DONG, L., MO, Z., et al., “Nonisothermal crystallization kinetics of poly(3-hydoxybutyrate)”,
J. Polym. Sci. Part B: Polym. Phys., v. 36, pp. 1305-1312, 1998.
[26] KISSINGER, H. E., “Variation of peak temperature with heating rate in differential thermal analysis”, J.
Res., v. 57, pp. 217-221, 1956.
[27] KISSINGER, H. E., “Reaction kinetics in differential thermal analysis”, Anal. Chem., v. 29, pp. 1702-
1706, 1957.
[28] VYAZOVKIN, S., “Is the Kissinger equation applicable to the processes that occur on cooling?”, Mac-
romol. Rapid Commun., v. 23, pp. 771-775, 2002.
[29] WELLEN, R. M. R., CANEDO, E. L., “On the Kissinger equation and the estimate of activation ener-
gies for non-isothermal cold crystallization of PET”, Polym. Test., v. 40, pp. 33-38, 2014.
[30] VYAZOVKIN, S., Isoconversional Kinetics of Thermally Stimulated Processes. Springer: Heidelberg,
2015.
[31] GALWEY, A. K., “Is the science of thermal analysis kinetics based on solid foundations?: A literature
appraisal”, Thermochim. Acta, v. 413, pp. 139-183, 2004.
[32] SEWRY, J. D., BROWN, J. D., “Model-free‟ kinetic analysis?”, Thermochim. Acta, v. 390, pp. 217-225,
2003.
[33] GALWEY, A. K., “What is meant by the term „variable activation energy‟ when applied in the kinetics
analyses of solid state decompositions (crystolysis reactions)?”, Thermochim. Acta, v. 397, pp. 249-268, 2003.
[34] VYAZOVKIN, S., “Reply to <What is meant by the term „variable activation energy‟ when applied in
the kinetics analyses of solid state decompositions (crystolysis reactions)?>”, Thermochim. Acta, v. 397, pp
269-271, 2003.
ORCID
Jokderléa Corrêa de Sousa https://orcid.org/0000-0002-9309-1719
Salim Abdelnor Arruda https://orcid.org/0000-0002-9586-8472
Juliana Cisneiros Lima https://orcid.org/0000-0002-8818-6131
Renate Maria Ramos Wellen https://orcid.org/0000-0002-3565-7366
Eduardo Luis Canedo https://orcid.org/0000-0003-3325-5803
Yêda Medeiros Bastos de Almeida https://orcid.org/0000-0003-1041-7144