crystengcomm - faculty of sciencemysite.science.uottawa.ca/dbryce/pubs/bryce101.pdf · crystengcomm...
TRANSCRIPT

CrystEngComm
Publ
ishe
d on
23
Apr
il 20
14. D
ownl
oade
d by
Uni
vers
ity o
f O
ttaw
a on
18/
07/2
014
19:3
0:24
.
PAPER View Article OnlineView Journal | View Issue
CrystEngCommThis journal is © The Royal Society of Chemistry 2014
Department of Chemistry and Center for Catalysis Research and Innovation,
University of Ottawa, 10 Marie Curie Private, Ottawa, Ontario K1N 6N5, Canada.
E-mail: [email protected]; Fax: +1 613 562 5170; Tel: +1 613 562 5800 ext. 2018
† Electronic supplementary information (ESI) available: Additional experimentaldetails; crystallographic information files; PXRD diffractograms; images of thepacking diagrams for the halogen-bonded compounds; additional NMR spectra;NLMO analysis. CCDC 987456–987457. For ESI and crystallographic data in CIFor other electronic format see DOI: 10.1039/c4ce00345d
Cite this: CrystEngComm, 2014, 16,
7285
Received 17th February 2014,Accepted 20th March 2014
DOI: 10.1039/c4ce00345d
www.rsc.org/crystengcomm
Probing halogen bonds with solid-state NMRspectroscopy: observation and interpretationof J(77Se,31P) coupling in halogen-bondedPSe⋯I motifs†
Jasmine Viger-Gravel, Julia E. Meyer, Ilia Korobkov and David L. Bryce*
Halogen bonds constitute an important and topical class of non-covalent interaction. We report a
combined X-ray diffraction, multinuclear (77Se, 31P, 13C) solid-state magnetic resonance, and computa-
tional study of a series of crystalline triphenylphosphine selenide–iodoperfluorobenzene complexes
which feature PSe⋯I–C halogen bonds. Selenium-77 chemical shifts increase due to halogen bonding
with iodine and correlate with the PSe distance, which in turn correlates with the strength of the
halogen bond. J(77Se,31P) coupling constants increase in magnitude as the halogen bond weakens.
This observation is understood via a natural localized molecular orbital (NLMO) DFT approach which
shows that contributions from the selenium lone pair orbital tend to dominate both the magnitude
and trends in J(77Se,31P), with the selenium–phosphorus bonding orbital being the second largest
contributor. This work suggests that J couplings measured via NMR spectroscopy may play an important
role in the characterization of halogen bonds, in clear analogy with their role in the characterization of
hydrogen bonds.
Introduction
Halogen bonds (R–X⋯Y–Z) are the result of a non-covalentinteraction between an electron donor (Y) and a region of pos-itive electrostatic potential on a halogen (X) typically bound toan electron-withdrawing group (R).1,2 Such interactions havelong been known3 but have been the focus of increased inter-est in recent years.4–11 Important fundamental studies havedescribed the nature of the interaction in terms of electro-static and charge-transfer contributions,12–15 and the σ-holeconcept has become a useful paradigm.14,16–18 The strength ofthe halogen bond ranges from about 1 to 43 kcal mol−1 andthey are strongly directional.12,16 Recent applications describethe role of halogen bonding in nucleic acid structure,19,20
anion recognition,21–23 selective binding and release of smallmolecules,24,25 gelation,26 and supramolecular chemistry.5,27,28
The similarities, differences, and interplay betweenhalogen bonds and hydrogen bonds have been discussed.29–32
In this context, we consider the impact which NMR spectros-copy has had on the characterization and understanding ofhydrogen bonds in solution and in the solid state and comparethis to the current situation for halogen bonds. Carlsson et al.have elegantly probed the symmetry of halogen bonds in solutionusing NMR chemical shifts.33 Yan et al. have recently studied thepossible application of σ-hole⋯Cl− bonds in separation scienceusing 19F NMR titration experiments in solution.34 We haverecently reported solid-state NMR (SSNMR) studies of halogen-bonded complexes and demonstrated the relationships betweenvarious NMR observables and the halogen bond geometryand environment.35–38 For instance, 13C chemical shifts of theipso C–I carbon in diiodoperfluorobenzene–halide complexesexhibiting halogen bonds were shown to be sensitive to the C–Ibond length, which in turn is a measure of the extent of halogenbonding in the C–I⋯X− motif.36 Chlorine-35/37, bromine-79/81,and iodine-127 SSNMR spectroscopies of halogen-bonded anionshave revealed the sensitivity of the nuclear quadrupolar couplingtensors to the halogen bond environment.37,38
The study of hydrogen bonds (e.g., N–H⋯OC in proteins)by NMR spectroscopy took a quantum leap forward with thesuccessful measurement and interpretation of indirect nuclearspin–spin ( J) couplings across and within such bonds, in solu-tion and in the solid state.39–42 For example, Limbach andco-workers have examined such couplings experimentally andcomputationally in small molecules.43,44 J couplings have also
, 2014, 16, 7285–7297 | 7285

CrystEngCommPaper
Publ
ishe
d on
23
Apr
il 20
14. D
ownl
oade
d by
Uni
vers
ity o
f O
ttaw
a on
18/
07/2
014
19:3
0:24
. View Article Online
been measured in van der Waals complexes45 and have beenused to characterize CH–π interactions.46
J couplings are present in principle between the variousnuclei involved in a halogen bond. To our knowledge, how-ever, J coupling constants have not been measured experi-mentally for halogen bonds. Computed J coupling constantsfor model systems in the gas phase have been reported, andthese suggest that non-negligible one-bond and two-bondcouplings are possible and that there is a dependence on thelocal geometry.47 We report here a multinuclear SSNMR studyof phosphine selenide–iodofluorobenzene complexes exhibitingPSe⋯I halogen bonds. J couplings measured between 31P and77Se (both spin-1/2 nuclides) are shown to be sensitive to thepresence and geometry of the halogen bond between the PSeand I–C moieties. 77Se and 31P chemical shift tensors are alsomeasured experimentally and interpreted in relation to halogenbonding. Related work has demonstrated the sensitivity ofJ(77Se,31P) coupling to selenium–cadmium interactions in solu-tions containing phosphine selenides and cadmium com-plexes.48,49 Our data are interpreted in the context of single-crystal and powder X-ray diffraction data and density functionaltheory (DFT) calculations. A natural localized molecular orbital(NLMO)50 DFT analysis of the J(77Se,31P) coupling constants pro-vides insight into the connection between the experimentalobservables and the electronic structure. Such analyses havebeen applied to study magnetic shielding tensors, electric fieldgradient tensors, and J couplings in a variety of systems.51–54
Results and discussionThe structures of (Ph3PSe)(o-DITFB) and (Ph3PSe)(sym-TITFB)
Co-crystallization of triphenylphosphine selenide (Ph3PSe)and iodobenzene derivatives (o- or p-C6F4I2 and sym-C6F3I3 whichare also referred to as DITFB and TITFB, respectively) yielded twonovel co-crystals exhibiting halogen bonds, (Ph3PSe)(o-DITFB) (2)and (Ph3PSe)(sym-TITFB) (3), and (Ph3PSe)(p-DITFB) (1) whichwas previously reported by Arman et al.70 The relevant halogen
7286 | CrystEngComm, 2014, 16, 7285–7297
Table 1 Selected halogen bond intermolecular contact distances and angle
Compound dI–C/Å dI⋯Se/Å RXBb
Ph3PSe — — —— — —
1 (Ph3PSe)( p-C6F4I2)c Site 1 2.092 3.4224 0.86
Site 2 2.082 3.4944 0.882.078 3.6841 0.93
2 (Ph3PSe)(o-C6F4I2) Site 1 2.0986 3.4014 0.852.1034 3.5863 0.90
3 (Ph3PSe)(sym-C6F3I3) Site 1 2.0949 3.5528 0.89Site 2 2.0901 3.5027 0.88
2.0886 3.6024 0.912.0842 3.9227 0.99
a See models in Fig. 1. Experimental values determined by single-crystalbetween the halogen (i.e., I) and the electron donor (i.e., Se) to the sum of t
d 77Se–31P dipolar coupling constant, R h rI SISDD
0
4 4 2
3
, where μ
the coupled spins I and S (i.e., 31P and 77Se) and rIS3 is the motion-avera
bond distances, dI⋯Se, angles, θC–I⋯Se, and I⋯Se⋯I angles(θI⋯Se⋯I), as well as carbon–iodine bond lengths (dI–C), phos-phorus–selenium bond lengths (dPSe), and PSe⋯I angles(θPSe⋯I) are given in Table 1. The normalized distance param-eter (RXB = dX⋯Y/
PdVdW), which is one measure of the extent of
halogen bonding, is equal to the ratio of the distance betweenthe halogen (i.e., I) and the electron donor (i.e., Se) to the sumof their van der Waals radii (1.98 Å for I and 2.00 Å for Se).55
The crystallographic data for compounds 2 and 3 are summa-rized in Table 2.
The X-ray crystal structure of 1 was verified to match thatreported previously.70 The halogen bond environments in 1may be described as follows: there are two different seleniumsites and both engage in halogen bonding with iodine. Inter-actions at one of the sites (labelled site 2 in Fig. 1) result ininfinite chains along the a axis involving one halogen bondacceptor (i.e., Se) and two halogen bond donors from differ-ent p-DITFB molecules. Selenium atoms in the other distinctsite (labelled site 1 in Fig. 1) interact with one iodine atomand the result is discrete halogen-bonded entities rather thaninfinite chains.
One polymorph of compound 2 has been previouslyreported;70 however, we report a different polymorph herewhich crystallizes in the P21/n space group (Table 2). The poly-morph synthesized in this work features discrete halogen-bonded entities; the selenium atom forms short contacts withtwo iodine atoms (RXB = 0.85 and 0.90) from different arenemolecules with a I⋯Se⋯I angle of 139.8°. The C–I⋯Se anglesare nearly linear (175.2° and 174.7°). The local structural motifis shown in Fig. 1. The extended crystal network is shown inFig. S1 (ESI†).
Compound 3 crystallizes in the P21/n space group. Thishalogen-bonded compound has two crystallographically dis-tinct PSe environments (see Fig. 1). The first selenium atominteracts with a single iodine atom (RXB = 0.89; θC–I⋯Se = 166.8°),resulting in discrete entities in the crystal lattice (see Fig. S2,ESI†). The second crystallographically distinct type of selenium
This journal is © The Royal Society of Chemistry 2014
sa
θC–I⋯Se/° dPSe/Å θPSe⋯I/° θI⋯Se⋯I/° RDDd/Hz
— 2.1080 — — 995— 2.1074 — — 996166.5 2.1070 112.6 — 997171.4 2.1270 113.0 126.0 969154.9 — 88.9 — —175.2 2.1320 104.0 139.8 962174.7 — 91.9 — —166.8 2.1190 104.6 — 980162.5 2.1252 107.3 118.6 972159.2 — 91.3 — —159.7 — 155.3 — —
X-ray crystallography. b RXB = dX⋯Y/P
dVdW, the ratio of the distanceheir van der Waals radii (1.98 Å for I and 2.00 Å for Se). c Arman et al.70
0 is the permeability constant, γI and γS are the magnetogyric ratios of
ged inverse cube of the distance between the coupled nuclei.

Table 2 Crystallographic data and selected data collection parameters
Compound 2 3
Empirical formula C24H15F4I2PSe C48H30F6I6P2Se2Formula weight/g mol−1 743.09 1701.98Crystal size/mm 0.28 × 0.19 × 0.17 0.22 × 0.14 × 0.13Crystal system Monoclinic MonoclinicSpace group P21/n P21/nZ 4 4a/Å 13.7022(3) 23.1286(7)b/Å 12.7689(3) 9.4276(3)c/Å 13.9386(3) 23.3606(7)α/° 90 90β/° 101.2140(10) 93.1692(16)γ/° 90 90Volume/Å3 2392.16(9) 5085.92(27)Calculated density/Mg m−3 2.063 2.223Absorption coefficient/mm−1 4.259 5.214F(000) 1400 3152Θ range for data collection/° 1.91 to 28.33 1.764 to 30.535Limiting indices −18 ≤ h ≤ 18, −17 ≤ k ≤ 17, −17 ≤ l ≤ 18 −29 ≤ h ≤ 32, −13 ≤ k ≤ 13, −33 ≤ l ≤ 32Reflections collected/unique 31 024/5895 77 460R(int) 0.0187 0.0297Completeness to Θ = 28.32/% 98.9 99.4Max and min transmission 0.5313 and 0.3818 0.550 and 0.393Data/restraints/parameters 5895/0/289 15 250/0/577Goodness-of-fit on F2 1.049 1.017Final R indices [I > 2α(I)] R1 = 0.0164, wR2 = 0.0416 R1 = 0.0287, wR2 = 0.0641R indices (all data) R1 = 0.0179, wR2 = 0.0424 R1 = 0.0379, wR2 = 0.0681Largest diff peak/hole/e Å−3 0.407 and −0.757 1.625 and −2.108
Fig. 1 Local halogen bonding geometries for compounds 1, 2, and 3 studied in this work, from X-ray diffraction. See angles and bond lengths inTable 1. Compounds 1 and 3 have two crystallographically distinct selenium and phosphorus sites each. Each atom is colour-coded: selenium(red), phosphorus (orange), carbon (grey), iodine (purple), fluorine (green), and hydrogen (white).
CrystEngComm Paper
Publ
ishe
d on
23
Apr
il 20
14. D
ownl
oade
d by
Uni
vers
ity o
f O
ttaw
a on
18/
07/2
014
19:3
0:24
. View Article Online
atom is surrounded by three iodine atoms from differentsym-TITFB molecules as depicted in Fig. 1. The values of RXB
for each of the three Se⋯I contacts are 0.88, 0.91, and 0.99,respectively. This indicates that the third contact hardly consti-tutes a halogen bond (i.e., an RXB value of 1 implies that theatoms in question are no closer than the sum of their van derWaals radii). The two iodine atoms involved in halogen bond-ing with Se form a I⋯Se⋯I angle of 118.6°. These interactionsat the second selenium site result in polymeric zigzag chainsalong the b axis (Fig. S2†).
Initial characterization
To verify the phase purity of 1, 2, and 3 upon grinding of thecrystals for solid-state NMR spectroscopy, we performed pow-der X-ray diffraction (PXRD) experiments which provided
This journal is © The Royal Society of Chemistry 2014
diffractograms in good agreement with those predicted fromthe single-crystal X-ray structures (see Fig. S3, ESI†). 13C cross-polarization magic-angle spinning (CP/MAS) SSNMR spectra(see Fig. S4, ESI†) also suggest the formation of halogenbonds in the structures. As expected, the chemical shifts ofthe carbon atoms covalently bonded to iodine (C–I) are quiteshielded due to the relativistic spin–orbit-induced ‘heavy-atomlight-atom’ (HALA) effect caused by the covalently bondediodine.56 The average values for 1, 2, and 3 are 73.4, 97.6, and65.3 ppm, respectively. These chemical shifts differ from thoseof the parent iodobenzenes (e.g., 76.5 ppm for solid p-DITFB36
and 64.0 ppm for sym-TITFB57 (in chloroform-d)). All threecompounds have more than one crystallographically distinctC–I site (four for 1, two for 2, and five for 3), but only one broad13C NMR peak is observed in each case. This is due to spectraloverlap and possible line broadening due to the nearby iodine
CrystEngComm, 2014, 16, 7285–7297 | 7287

CrystEngCommPaper
Publ
ishe
d on
23
Apr
il 20
14. D
ownl
oade
d by
Uni
vers
ity o
f O
ttaw
a on
18/
07/2
014
19:3
0:24
. View Article Online
and fluorine nuclei. For example, a residual 127I–13C dipolarcoupling of −2.4 kHz at 9.4 T is expected on the basis of a one-bond 127I–13C dipolar coupling constant of 657 Hz and a typicalCQ(
127I) of 1000 MHz.
31
31P and 77Se SSNMR spectroscopy of halogen-bonded compounds
The 31P and 77Se CP/MAS SSNMR spectra of triphenyl-phosphine selenide have been thoroughly investigated byDemko et al.58 as well as Grossmann et al.59 The latter studywas performed on a Ph3PSe sample which was 70% isotopi-cally enriched in 77Se, resulting in spectra with excellent sig-nal-to-noise. The 31P and 77Se data from these previousstudies are used for comparison with the data obtained forhalogen-bonded compounds 1, 2, and 3 (see Tables 3 and 4).All compounds in the present study were investigated atnatural isotopic abundance.
The 31P CP/MAS NMR spectra of compounds 1, 2, and 3obtained in an applied magnetic field of 9.4 T are presentedin Fig. 2. Analogous data obtained at 11.75 T are provided inthe ESI.† The isotropic chemical shifts, span, and skew arepresented in Table 3. The total range of chemical shiftsobserved is from 31.85 ppm in 2 to 41.90 ppm in site 2 inPh3PSe. Two crystallographically distinct phosphorus sites areexpected for 1; however, only one is resolved in the 31P SSNMRspectrum. It is noted that there is a small but consistentdecrease in the 31P chemical shifts in the halogen-bonded com-pounds relative to both sites in Ph3PSe where halogen bondingis absent. Similarly, the 31P chemical shift tensor spans aresmaller in the halogen-bonded complexes (ranging from 112 to
7288 | CrystEngComm, 2014, 16, 7285–7297
Table 3 Experimental 31P CS tensor parametersa
Compound δiso/ppmb Ω/ppmb κb
Ph3PSec Site 1 35.90 161 0.47
Site 2 41.90 144 0.391 (Ph3PSe)( p-C6F4I2) Site 1 34.25(0.10) 134(4) 0.53(0.10)
Site 2 34.25(0.10) 134(4) 0.53(0.10)2 (Ph3PSe)(o-C6F4I2) Site 1 31.85(0.13) 112(2) 1.00(0.15)3 (Ph3PSe)(sym-C6F3I3) Site 1 35.82(0.10) 133(3) 0.45(0.03)
Site 2 34.00(0.10) 112(2) 0.46(0.01)
a Error bounds are given in parentheses. b Isotropic chemical shift:δiso = (δ11 + δ22 + δ33)/3; span: Ω ≈ δ11 − δ33; skew: κ = 3(δ22 − δiso)/(δ11 − δ33),where δ11 ≥ δ22 ≥ δ33.
c Previously reported by Demko et al.58 andGrossmann et al.59
Table 4 Experimental 77Se CS tensor parameters and J(77Se,31P) valuesa
Compound δiso/ppmb
Ph3PSec Site 1 −257
Site 2 −2421 (Ph3PSe)( p-C6F4I2) Site 1 −220
Site 2 −1632 (Ph3PSe)(o-C6F4I2) Site 1 −1583 (Ph3PSe)(sym-C6F3I3) Site 1 −188
Site 2 −140a Error bounds are given in parentheses. Errors in the isotropic chemicalJ(77Se,31P) previously reported.58,59 d See main text for further explanation
Fig. 2 Experimental P CP/MAS solid-state NMR spectra (blue)acquired at 9.4 T for (b) 1 (MAS 3 kHz), (d) 2 (MAS 2.1 kHz), and (f) 3(MAS 3 kHz). Their respective simulated spectra are shown in black ((a),(c), (e)). Each inset shows the centreband and the 77Se–31P satellitesdue to J coupling (B0 = 11.75 T). The top inset for compound 3 showsevidence of J coupling for both crystallographically distinct Se–P sites.
134 ppm) relative to both sites in Ph3PSe (144 and 161 ppm).The span (Ω) is a measure of the degree of anisotropy of thechemical shift tensor and a smaller span reflects a smallchange in the electronic structure of the PSe bond in thehalogen-bonded complexes.
Expansions of the centreband where the J couplingbetween 31P and 77Se may be observed in the satellite peaks
This journal is © The Royal Society of Chemistry 2014
Ω/ppmb κb J(77Se,31P)/Hz Reff/Hzd
221 −0.58 −733 695247 −0.62 −736 696160(15) 1.0(0.2) −725(25) 697260(30) 0.2(0.2) −663(38) 669170(5) 1.0(0.2) −626(2) 729350(20) 0.25(0.20) −717(17) 680250(15) 0.35(0.20) −641(25) 672
shifts are 1 ppm or less. b See footnote b of Table 3. c CS tensors and.

CrystEngComm Paper
Publ
ishe
d on
23
Apr
il 20
14. D
ownl
oade
d by
Uni
vers
ity o
f O
ttaw
a on
18/
07/2
014
19:3
0:24
. View Article Online
(note that the natural abundance of 77Se is 7.63%) are alsoshown in Fig. 2. The values obtained from these spectraare consistent with those obtained from the corresponding77Se CP/MAS NMR spectra of the same compounds(see Table 4); however, analysis of the latter spectra (videinfra) allows for improved precision since the effects ofthe coupling are clearly seen in the main peaks rather thanin low-intensity satellites which partially overlap with themain peaks.
The 77Se CP/MAS SSNMR spectra of 1, 2, and 3 recorded at9.4 T with two different spinning frequencies are shown inFig. 3–5. Spectral fitting at two MAS frequencies, as well as atmore than one applied magnetic field strength (at least 9.4 Tand 11.75 T), allows for the measurement of the isotropicJ(77Se,31P) coupling and the 77Se chemical shift tensor magni-tude. Simulations also included the direct dipolar couplingbetween 77Se and 31P (RDD = (μ0/4π)(γ77Seγ31Pħ/2π)⟨r
−3⟩ where
This journal is © The Royal Society of Chemistry 2014
Fig. 4 Experimental 77Se CP/MAS solid-state NMR spectra acquired at 9.4 Tare shown in black ((a) and (c)). The centrebands, highlighted in blue barin the relative intensities of some of the peaks in the experimental and simref. 58). Additionally, dipolar coupling to 19F and 127I may serve to furthecrystal structure, the values of RDD(
127I, 77Se) for the two shortest contacts a
Fig. 3 Experimental 77Se CP/MAS solid-state NMR spectra acquired at 9.4tions are shown in black ((a) and (c)). The centrebands for each of the twothese is split into a doublet due to J(77Se,31P) coupling.
r is the distance between the spins), as well as contributionsfrom the anisotropic part of the J tensor (ΔJ).60–62 The 77Se CStensor parameters and J coupling values are presented inTable 4 and were obtained by simultaneously modeling theNMR spectra obtained at both MAS frequencies and in bothapplied magnetic fields. For 2, three magnetic fields wereused to model the NMR spectra (see Fig. S6† for 77Se CP/MASSSNMR spectra acquired at 11.75 and 21.1 T). Fitting wasdone in a manual iterative fashion, by cycling between thevarious spectra until a self-consistent set of parameters wasdetermined. Error estimates were obtained through this pro-cess as well. Errors in J(77Se,31P) are larger than those whichwould have been obtained from signal-to-noise or digital res-olution estimates on a single spectrum.
Such spectra were difficult to acquire due to the presenceof the nearby fluorines and protons (dipolar coupling), long1H relaxation times, as well as the halogen-bonded iodines
CrystEngComm, 2014, 16, 7285–7297 | 7289
with MAS rates of 3 kHz (b) and 5 kHz (d) for compound 2. Simulationss, are split into doublets due to J(77Se,31P) coupling. Small differencesulated spectra have been observed previously (see, e.g., Fig. 6 and 9 inr broaden and alter spectral intensities in the present work. From there 118 and 101 Hz; the largest value of RDD(
77Se,19F) is 431 Hz.
T with MAS rates of 6.5 kHz (b) and 8 kHz (d) for compound 1. Simula-crystallographically distinct sites are highlighted in blue bars. Each of

Fig. 5 Experimental 77Se CP/MAS solid-state NMR spectra acquired at 9.4 T with a MAS rate of 5.5 kHz (b) and 8 kHz (d) for compound 3. Simula-tions are shown in black ((a) and (c)). The centrebands, highlighted in blue bars, are split into doublets due to J(77Se,31P) coupling. The relativeintensities of sites 1 and 2 were adjusted to be ~1 : 1.2 for the best fit to experiment; we attribute this to differential cross-polarization efficiencies.
CrystEngCommPaper
Publ
ishe
d on
23
Apr
il 20
14. D
ownl
oade
d by
Uni
vers
ity o
f O
ttaw
a on
18/
07/2
014
19:3
0:24
. View Article Online
(residual dipolar coupling), which resulted in broad lines par-ticularly in 2. For all compounds, the J(77Se,31P) coupling isresolved and ranges between −626(2) Hz for (Ph3PSe)(o-DITFB)and −725(25) Hz for (Ph3PSe)(p-DITFB). It is important to notehere that the assignments of the two different J(77Se,31P) cou-pling values to their different crystallographic PSe sites in aparticular compound were determined independently fromthe ZORA-DFT calculations (vide infra).
RDD and ΔJ cannot be separated in an NMR experiment;an effective direct dipolar coupling describes the effects ofboth: Reff = RDD − ΔJ/3. For spectral simulation, the values usedfor RDD were calculated from the X-ray crystal structures (seeTable 1) and ΔJ values were estimated at 900 Hz, which is theapproximate value observed for various organophosphine sele-nides.58 The Reff values shown here were fixed for spectral sim-ulations rather than determined from the experimental MASspectra because simulations of the latter were not sensitiveenough to the value of ΔJ to be able to determine values withhigh precision. The 77Se–31P dipolar and 77Se chemical shifttensors were set to be coincident in all spectral simulations(δ33 aligned with the internuclear vector). The sign of J(77Se,31P)was identified as being negative through the spectral simula-tions (which depend on the relative signs of J(77Se,31P) andReff (
77Se,31P)) and was corroborated with DFT computations(vide infra) and previous literature reports.58
The isotropic selenium chemical shifts increase in thepresence of a halogen bond with iodine relative to those forpure Ph3PSe (−257 and −242 ppm for its two crystallographicsites). The δiso(
77Se) values for compounds 1, 2, and 3 rangefrom −140 ppm for site 2 in compound 3 to −220 ppm forsite 2 in compound 1. When the values of δiso(
77Se) are plottedas a function of their respective PSe distances, a linear corre-lation is observed (Fig. 6(a)). An analogous trend was observedfor the 77Se chemical shifts of selenocyanate anions halogen-bonded with p- or o-DITFB, where the value of δiso(
77Se)increases in a halogen-bonded environment.35 Furthermore,DFT calculations on a (CH3)3PSe⋯ICF3 cluster modelrevealed the same trend; the δiso(
77Se) value increases when the
7290 | CrystEngComm, 2014, 16, 7285–7297
PSe bond length increases, vide infra. The anisotropy of the77Se chemical shift tensor does not conclusively differentiatebetween Ph3PSe and the halogen-bonded compounds.
Chemical shifts: DFT computations and correlation withhalogen bond geometry
DFT calculations of 31P and 77Se magnetic shielding tensorswere performed on cluster models involving the molecules whichare halogen-bonded; the numerical results are tabulated in theESI.† The X-ray crystal structure heavy-atom atomic coordinates(all atoms except hydrogen) were used for these models, as shownin Fig. 1. Computations using either the revPBE functional andthe ZORA/TZP basis set (including scalar relativistic effects), asimplemented in the ADF software,63 or the TPSS functional andthe 6-311G** basis set, as implemented in Gaussian 09,64 wereused. Further details are given in the experimental section.
In Fig. 6(b) and (c), the calculated 77Se isotropic chemicalshift and chemical shift tensor components versus the experi-mental values are plotted. Even though the calculated valuesare larger than the experimental ones, the experimental trendis well-reproduced for δiso(
77Se) at both levels of theory; linearfits with correlation coefficients, R2, of 0.9708 and 0.9950 arenoted for the TPSS and revPBE functionals, respectively. Thetrends in the principal components of the 77Se chemical shifttensor are reasonably well-reproduced, particularly in the caseof the TPSS method and the δ33 component (see Fig. 6(c)).
Generally, there are multiple factors which could contrib-ute to the lack of a perfect correlation between the experi-mental and computed chemical shift tensor parameters.Firstly, cluster models do not allow for a full treatment of theeffect of crystal packing on the computed NMR parameters.The gauge-including projector-augmented wave (GIPAW) DFTmethod65 enables calculations using periodic boundary con-ditions; however, the volume of the unit cells (2392.2 Å3 for2 to 5085.9 Å3 for 3) of these compounds results in computa-tional demands which are beyond our current capabilities. Addi-tionally, several theoretical66–68 reports describe the challengesin establishing the best 77Se absolute shielding scale;87 the
This journal is © The Royal Society of Chemistry 2014

Fig. 6 (a) Experimental δiso(77Se) values as a function of the experimental PSe bond lengths for the compounds in Table 1 (δiso(
77Se)exp. =3924dPSe − 8505 ppm, R2 = 0.8407). In (b) and (c), plots of calculated versus experimental chemical shift tensor parameters for selenium areshown. Solid lines represent the best linear fit: (b, TPSS) δcalc.iso = 2.1919δexp.iso + 586.08 ppm, (b, revPBE) δcalc.iso = 2.3368δexp.iso + 542.34 ppm and(c, TPSS) δcalc.11 = 1.4071δexp.11 + 460.28 ppm, δcalc.22 = 2.3579δexp.22 + 555.75 ppm and δcalc.33 = 0.8816δexp.33 + 300.06 ppm. (d) Optimized dPSe distancesas a function of RXB for a cluster model composed of (CH3)3PSe⋯ICF3 (dPSe
calc. = 1.485(RXB)2 − 2.701(RXB) + 3.360 (R2 = 0.9699) or dPSe
calc. =−0.0739RXB + 2.199, R2 = 0.8642).
CrystEngComm Paper
Publ
ishe
d on
23
Apr
il 20
14. D
ownl
oade
d by
Uni
vers
ity o
f O
ttaw
a on
18/
07/2
014
19:3
0:24
. View Article Online
selenium chemical shift range is over 3000 ppm and theshielding constants are subject to relativistic effects.58,69
The PSe distance, dPSe, is different for each of thecompounds studied here (Table 1). It is well known fromthe IUPAC definition that the distance R–X of the halogenbond donor tends to increase when involved in a halogenbond;2 however, in this case the same type of change isalso noted for the halogen bond acceptor, Y–Z (i.e., SeP).As mentioned above, a plot of experimental δiso(
77Se) valuesvs. dPSe for the compounds studied herein shows a reason-able linear correlation, with increased values of dPSe corre-sponding to increased chemical shifts (Fig. 6(a)). Weakinverse correlations of δiso(
31P) with dPSe are also noted(see ESI†).
This experimental observation was corroborated usingZORA calculations on the model halogen bonded complex(CH3)3PSe⋯ICF3. The halogen bond distance (dI⋯Se) wasvaried systematically between 3.40 (RXB = 0.85) and 3.66 Å(RXB = 0.92) in 0.04 Å increments. These RXB values reflectthe range observed experimentally. As can be seen inFig. 6(d), as the halogen bonding interaction is weakened,the optimal value of dPSe decreases. When the calculatedvalues of δiso(
77Se) are plotted as a function of dPSe, a linearcorrelation (R2 = 0.9615) in accord with that observed exper-imentally is obtained (see ESI†).
This journal is © The Royal Society of Chemistry 2014
J(77Se,31P) coupling in halogen bonds: correlation withstructure and DFT NLMO analysis
A plot of the calculated J(77Se,31P) coupling constants versusthe experimentally measured values is shown in Fig. 7(a). Forthe calculations, two different cluster models were used. Thefirst model (blue squares) consists of the halogen bonddonor and acceptor molecules as depicted in Fig. 1. The sec-ond model (black circles) consists only of (arene)3PSe mole-cules, omitting the halogen bond donor(s). By comparing theresults of the two sets of revPBE calculations with the experi-mental data, one can assess the impact of the halogen bondto iodine on the values of J(77Se,31P). That is, are the valuesof J(77Se,31P) sensitive to the halogen bonding interaction?When the two linear fits are compared, it is seen that inclu-sion of the halogen bond donor(s) in the model results in aslope closer to unity (0.714 vs. 0.315) and an increased corre-lation coefficient (R2 = 0.9719 vs. 0.8761). This suggests thatindeed the halogen bond to selenium is manifested in thevalue of J(77Se,31P). Analysis of the analogous data obtainedusing the TPSS functional (data in ESI†) also shows improvedslopes (0.652 vs. 0.306) and correlation coefficients (0.9371vs. 0.8832) when the halogen bond donors are included inthe models. The root-mean-square deviation (RMSD) betweenthe experimental and calculated data when the halogen bond
CrystEngComm, 2014, 16, 7285–7297 | 7291
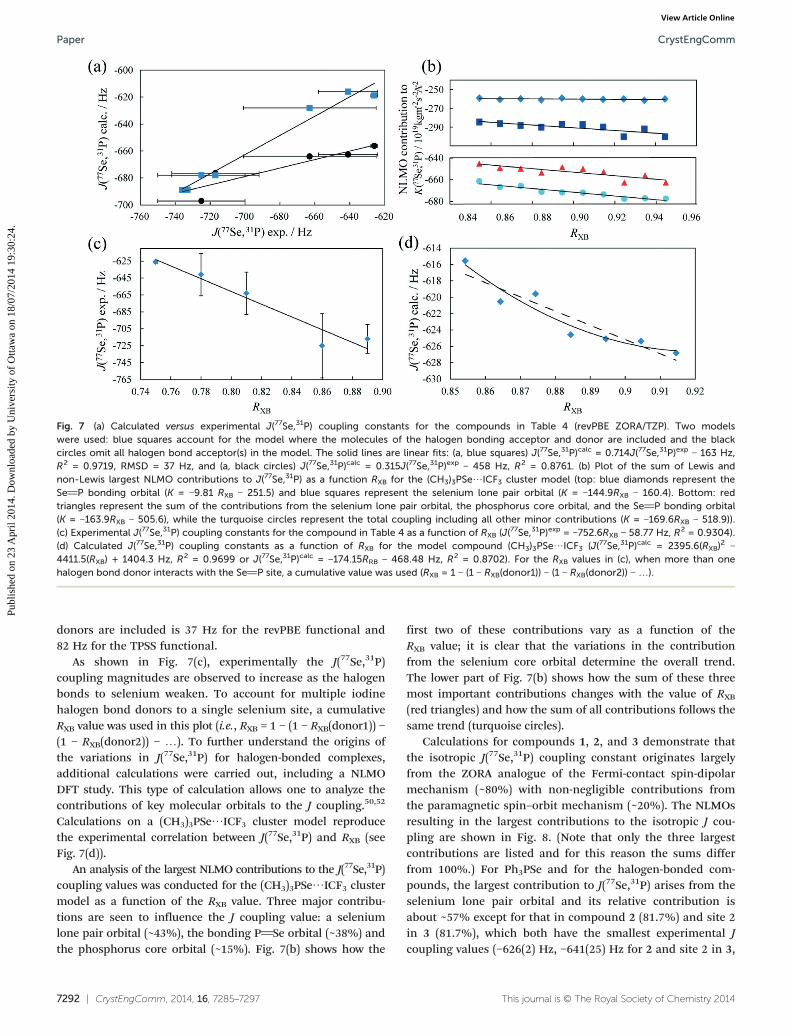
Fig. 7 (a) Calculated versus experimental J(77Se,31P) coupling constants for the compounds in Table 4 (revPBE ZORA/TZP). Two modelswere used: blue squares account for the model where the molecules of the halogen bonding acceptor and donor are included and the blackcircles omit all halogen bond acceptor(s) in the model. The solid lines are linear fits: (a, blue squares) J(77Se,31P)calc = 0.714J(77Se,31P)exp − 163 Hz,R2 = 0.9719, RMSD = 37 Hz, and (a, black circles) J(77Se,31P)calc = 0.315J(77Se,31P)exp − 458 Hz, R2 = 0.8761. (b) Plot of the sum of Lewis andnon-Lewis largest NLMO contributions to J(77Se,31P) as a function RXB for the (CH3)3PSe⋯ICF3 cluster model (top: blue diamonds represent theSeP bonding orbital (K = −9.81 RXB − 251.5) and blue squares represent the selenium lone pair orbital (K = −144.9RXB − 160.4). Bottom: redtriangles represent the sum of the contributions from the selenium lone pair orbital, the phosphorus core orbital, and the SeP bonding orbital(K = −163.9RXB − 505.6), while the turquoise circles represent the total coupling including all other minor contributions (K = −169.6RXB − 518.9)).(c) Experimental J(77Se,31P) coupling constants for the compound in Table 4 as a function of RXB (J(77Se,31P)exp = −752.6RXB − 58.77 Hz, R2 = 0.9304).(d) Calculated J(77Se,31P) coupling constants as a function of RXB for the model compound (CH3)3PSe⋯ICF3 (J(77Se,31P)calc = 2395.6(RXB)
2 −4411.5(RXB) + 1404.3 Hz, R2 = 0.9699 or J(77Se,31P)calc = −174.15RRB − 468.48 Hz, R2 = 0.8702). For the RXB values in (c), when more than onehalogen bond donor interacts with the SeP site, a cumulative value was used (RXB = 1 − (1 − RXB(donor1)) − (1 − RXB(donor2)) − …).
CrystEngCommPaper
Publ
ishe
d on
23
Apr
il 20
14. D
ownl
oade
d by
Uni
vers
ity o
f O
ttaw
a on
18/
07/2
014
19:3
0:24
. View Article Online
donors are included is 37 Hz for the revPBE functional and82 Hz for the TPSS functional.
As shown in Fig. 7(c), experimentally the J(77Se,31P)coupling magnitudes are observed to increase as the halogenbonds to selenium weaken. To account for multiple iodinehalogen bond donors to a single selenium site, a cumulativeRXB value was used in this plot (i.e., RXB = 1 − (1 − RXB(donor1)) −(1 − RXB(donor2)) − …). To further understand the origins ofthe variations in J(77Se,31P) for halogen-bonded complexes,additional calculations were carried out, including a NLMODFT study. This type of calculation allows one to analyze thecontributions of key molecular orbitals to the J coupling.50,52
Calculations on a (CH3)3PSe⋯ICF3 cluster model reproducethe experimental correlation between J(77Se,31P) and RXB (seeFig. 7(d)).
An analysis of the largest NLMO contributions to the J(77Se,31P)coupling values was conducted for the (CH3)3PSe⋯ICF3 clustermodel as a function of the RXB value. Three major contribu-tions are seen to influence the J coupling value: a seleniumlone pair orbital (~43%), the bonding PSe orbital (~38%) andthe phosphorus core orbital (~15%). Fig. 7(b) shows how the
7292 | CrystEngComm, 2014, 16, 7285–7297
first two of these contributions vary as a function of theRXB value; it is clear that the variations in the contributionfrom the selenium core orbital determine the overall trend.The lower part of Fig. 7(b) shows how the sum of these threemost important contributions changes with the value of RXB
(red triangles) and how the sum of all contributions follows thesame trend (turquoise circles).
Calculations for compounds 1, 2, and 3 demonstrate thatthe isotropic J(77Se,31P) coupling constant originates largelyfrom the ZORA analogue of the Fermi-contact spin-dipolarmechanism (~80%) with non-negligible contributions fromthe paramagnetic spin–orbit mechanism (~20%). The NLMOsresulting in the largest contributions to the isotropic J cou-pling are shown in Fig. 8. (Note that only the three largestcontributions are listed and for this reason the sums differfrom 100%.) For Ph3PSe and for the halogen-bonded com-pounds, the largest contribution to J(77Se,31P) arises from theselenium lone pair orbital and its relative contribution isabout ~57% except for that in compound 2 (81.7%) and site 2in 3 (81.7%), which both have the smallest experimental Jcoupling values (−626(2) Hz, −641(25) Hz for 2 and site 2 in 3,
This journal is © The Royal Society of Chemistry 2014

Fig. 8 Selected NLMOs having the largest contributions to the isotropic J(77Se,31P) coupling values for halogen-bonded systems (2 (b), 1 (c), 3 (d))and Ph3PSe (a). The percentages underneath the orbitals represent the contribution from the selenium lone pair (LP Se), the bonding orbitalbetween P and Se (BD P–Se) orbital and the P core orbital (CR P) or Se core orbital (CR Se) to the isotropic J-coupling constant for each distinctselenium site. Note that the total does not sum to 100% because only the largest contributions are shown.
CrystEngComm Paper
Publ
ishe
d on
23
Apr
il 20
14. D
ownl
oade
d by
Uni
vers
ity o
f O
ttaw
a on
18/
07/2
014
19:3
0:24
. View Article Online
respectively), the longest PSe bonds (2.1320 Å and 2.1252 Åfor 2 and site 2 in 3, respectively), and the strongest halogenbonding interactions. The PSe bonding orbital makes thesecond largest contribution to the J coupling. The relative con-tributions are about 30%, except again for the sites having thestrongest halogen bonds, 2 (−16.9%) and site 2 in 3 (−16.6%).Percentage contributions are negative if they are opposite insign to the sum of all other contributions and therefore serveto reduce the total value. Finally, another contribution toJ(77Se,31P) arises from the phosphorus core orbital or seleniumcore orbital. The NLMO contributions from the iodine lonepair are minor (~0.1 to 0.6%; see ESI†).
Conclusions
A series of compounds featuring PSe⋯I–C halogen bondshas been prepared and characterized by X-ray diffraction and31P, 77Se, and 13C solid-state NMR spectroscopy. Phosphorusand selenium chemical shift tensors as well as J(77Se,31P) cou-pling constants have been measured and interpreted with theaid of density functional theory computations. Informed by acomparison with pure triphenylphosphine selenide, we drawthe following conclusions:
1. 77Se isotropic chemical shifts increase due to halogenbonding with iodine and correlate with the PSe distancewhich in turn correlates inversely with the reduced halogenbond distance parameter RXB;
2. J(77Se,31P) coupling constants increase in magnitude asthe selenium–iodine halogen bonds weaken;
3. computed J(77Se,31P) coupling constants improve relativeto the experimental values when the iodinated halogen bondacceptor is included in the structural model used for the cal-culations, suggesting that J(77Se,31P) coupling constants are atleast in part diagnostic of the halogen bond;
4. a natural localized molecular orbital analysis providesinsight into the orbitals which contribute to J(77Se,31P); for
This journal is © The Royal Society of Chemistry 2014
example, contributions from the selenium lone pair orbitaltend to dominate both the magnitude and trends inJ(77Se,31P), with the selenium–phosphorus bonding orbitalbeing the second-largest contributor.
To our knowledge, this study represents the first system-atic experimental examination of J coupling constants withinthe halogen bond fragment R–X⋯Y–Z. It will be of interest infuture work to examine J couplings across the halogen bond,e.g., J(R,Y). The existence of such couplings and their valuein understanding the halogen bond have been examinedcomputationally for small model systems;47 however, experi-mental SSNMR measurements are likely to be challengingdue to the NMR properties of the nuclei involved in typicalhalogen bonds and the probable small magnitude of the cou-pling constants.
ExperimentalSynthesis
Iodobenzene derivatives (p-C6F4I2, o-C6F4I2) and triphenylphosphineselenide (Ph3PSe) were purchased from Aldrich and used with-out further purification. sym-C6F3I3 was acquired from AlfaAesar and used as received. Compounds 1 and 2 were preparedaccording to the literature.70 The syntheses of 1 and 2 werescaled to yield 150 to 200 mg of the desired product for SSNMRstudies. o- or p-DITFB (0.1295 g, 0.32 mmol) was mixed withPh3PSe (0.1100 g, 0.32 mmol) in a small vial and dissolved in aminimum amount of dichloromethane at room temperature.The mixture was left to evaporate slowly, yielding 1 and 2. Com-pound 3 was prepared by dissolving equimolar amounts of Ph3PSe(0.0787 g, 0.23 mmol) with sym-C6F3I3 (0.1175 g, 0.23 mmol) ina minimum amount of dichloromethane. A vial containing thesolution was then left at room temperature until the desiredcompound crystallized, (Ph3PSe)(sym-C6F3I3) (3). All sampleswere prepared at natural isotopic abundance.
CrystEngComm, 2014, 16, 7285–7297 | 7293

CrystEngCommPaper
Publ
ishe
d on
23
Apr
il 20
14. D
ownl
oade
d by
Uni
vers
ity o
f O
ttaw
a on
18/
07/2
014
19:3
0:24
. View Article Online
Single-crystal X-ray crystallography
Data collection results for compounds 1, 2, and 3 representthe best data sets obtained in several trials for each sample.The crystals were mounted on thin glass fibers using paraffinoil. Mounted crystals were cooled by a stream of dry air to200.15 K prior to data collection. Data were collected on aBruker AXS KAPPA single crystal diffractometer equippedwith a sealed Mo tube source (wavelength 0.71073 Å) and anAPEX II CCD detector. Raw data collection and processingwere performed with the APEX II software package fromBRUKER AXS.71 Diffraction data for 1, 2, and 3 were collectedwith a sequence of 0.5° ω scans at 0, 120, and 240° in φ. Unitcell parameters for 1 were verified to be consistent with theliterature.70 Systematic absences in the diffraction data setand unit cell parameters were consistent with the monoclinicP21/n space group for compounds 2 and 3. Solutions in cen-trosymmetric space groups for all compounds yielded chemicallyreasonable and computationally stable results of refinement.The structures were solved by direct methods, completed withdifference Fourier synthesis, and refined with full-matrix least-squares procedures based on F2. All hydrogen atoms weretreated as idealized contributions. All scattering factors arecontained in several versions of the SHELXTL program library,with the latest version used being 6.12.72 Crystallographic dataand selected data collection parameters are reported in Table 2.
Powder X-ray diffraction
Sample purity and identity were verified by X-ray powder dif-fraction analysis. All experiments were carried out using aRigaku Ultima IV instrument at room temperature (298 ± 1 K)with Cu Kα1 radiation (λ = 1.54060 Å), and with 2θ rangingbetween 5 and 50° in increments of 0.02° at a rate of 0.6° perminute. Simulations of patterns from single crystal results weregenerated using the Mercury software available from the Cam-bridge Crystallographic Data Centre and were compared tothose observed for bulk reaction products.
Solid-state NMR spectroscopy
All compounds were ground into fine powders and packed in4 mm o.d. zirconia rotors. Data were acquired at the Univer-sity of Ottawa using either a 9.4 T (νL(
13C) = 100.6 MHz,νL(
31P) = 161.976 MHz, νL(77Se) = 76.311 MHz) magnet equipped
with a Bruker Avance III 400 console and a 4 mm Bruker tripleresonance MAS probe or a 11.75 T (νL(
13C) = 125.758 MHz,νL(
31P) = 202.456 MHz, νL(77Se) = 95.382 MHz) Bruker Avance
500 wide bore spectrometer equipped with a 4 mm triple reso-nance MAS probe. Some data were also acquired at the NationalUltrahigh-Field NMR Facility for Solids in Ottawa using a 21.1 T(νL(
77Se) = 171.668 MHz) standard-bore magnet equipped witha Bruker AVANCE II 900 console and a double-resonanceMAS probe.
Spectra for 13C, 31P, and 77Se were collected under CP/MASconditions73 with proton decoupling. Experimental setup andpulse calibration were performed using solid glycine for 13C(δiso(
13CO) = 176.4 ppm with respect to TMS),74,75 solid
7294 | CrystEngComm, 2014, 16, 7285–7297
diammonium selenate ((NH4)2SeO4) for77Se (δiso = 1040.2 ppm
with respect to Se(CH3)2(l)),76 and ammonium dihydrogen
phosphate for 31P (NH4H2PO4, δiso = 0.81 ppm with respect toH3PO4 in 85% D2O).
77
13C SSNMR. Recycle delays were 35, 10, and 15 s, respectively,for 1, 2, and 3. The proton π/2 pulse and contact time wereset to 3.25 or 3.50 μs and 2 ms, respectively, in all cases. MASfrequencies varied between 8 and 10 kHz.
31P SSNMR. 31P SSNMR experiments used a recycle delayof 6 s at 9.4 T and 30 s at 11.75 T. The proton π/2 pulselength was optimized to 2.50 or 3.00 μs at 9.4 T and 4.50 μsat 11.75 T. The contact time was 5 ms and 2 ms at 9.4 and11.75 T, respectively. MAS frequencies varied between 2.1 kHzand 10 kHz.
77Se SSNMR. For 77Se NMR experiments, the recycle delayswere 34 s, 20 s, and 30 s for compounds 1, 2, 3, respectively.The 1H π/2 pulse length used for the CP experiments wastypically 3.75 μs at 9.4 T. The proton π/2 pulse lengths usedat 11.75 and 21.1 T were 2.8 and 4.0 μs, respectively. Thecontact time was typically 20 ms.
Spectra were simulated using WSOLIDS78 and SIMPSON.79
Additional experimental details may be found in the ESI.†
Computational details
Cluster models were generated using the X-ray crystal struc-tures' atomic coordinates and are depicted in Fig. 1. The struc-ture of Codding and Kerr80 was used for Ph3PSe.
31P and 77Semagnetic shielding tensors were calculated with the Amster-dam Density Functional (ADF) software63,81 or Gaussian 0964
software. The positions of the hydrogen atoms in the modelswere optimized prior to NMR calculations. For the DFT calcula-tions performed with the Gaussian 09 software, the TPSS func-tional82 and 6-311G** basis set were used.
For all calculations using ADF, scalar relativistic effectswere included via the zeroth-order regular approximation(ZORA).83 All contributions to the J coupling tensors wereincluded in the calculations. Natural localized molecular orbital(NLMO) analyses were performed with the NBO 5.0 code84 inADF50,63 and were visualized with the program adfview. Therevised PBE85 generalized gradient approximation (GGA)exchange-correlation functional was used with the ZORAtriple zeta basis set for magnetic shielding and J tensor cal-culations. Additionally, the meta-GGA TPSS functional wasused for a second set of J coupling calculations. These calcu-lations were performed using the High-Performance Comput-ing Virtual Laboratory (HPCVL).
A simplified model was prepared for the calculations onsite 2 in compound 3. In this model, the sym-C6F3I3 mole-cules were replaced by CF3I and the positions of all otheratoms were fixed, while the new fluorine positions were opti-mized before proceeding to the magnetic shielding and J cou-pling calculations. Also, a systematic study was performed ona small cluster model of (CH3)3PSe⋯ICF3 where the Se⋯Idistance was varied systematically by increments of 0.04 Åbetween 3.40 (RXB = 0.85) and 3.66 Å (RXB = 0.92). For each
This journal is © The Royal Society of Chemistry 2014

CrystEngComm Paper
Publ
ishe
d on
23
Apr
il 20
14. D
ownl
oade
d by
Uni
vers
ity o
f O
ttaw
a on
18/
07/2
014
19:3
0:24
. View Article Online
calculation, the model was geometry optimized while keepingthe Se⋯I distance fixed. With the converged geometry, the Jcoupling calculation combined with the NLMO analysis wasthen performed, as well as the magnetic shielding tensor cal-culations. Note that the halogen bond geometry itself is notoptimized computationally in any of the present calculations.
The computed magnetic shielding tensors were analyzedusing the EFGShield program.86 Magnetic shielding tensorswere converted to chemical shift tensors using the following
equation:
ijij
ref
ref1(where σref = 2069 ppm for selenium
in Se(CH3)2(l)87 and where σref = 331.51 ppm for phosphorus
in H3PO4 (85% D2O)88). The ADF output files from the J cou-
pling calculations were analyzed to select the NLMOs withlarge contributions to the isotropic J coupling constant. Thesum of the Lewis and non-Lewis terms is reported for thelargest contributions.
Acknowledgements
D.L.B. thanks the Natural Sciences and Engineering ResearchCouncil (NSERC) of Canada for funding, J.V.-G. thanks theFonds de Recherche du Québec – Nature et Technologies(FRQNT) for a scholarship, and J.E.M. thanks the Undergrad-uate Research Opportunity Program (UROP) at the Universityof Ottawa. Dr. Victor Terskikh, Dr. Eric Ye, and Dr. Glenn Faceyare thanked for technical support. Access to the 900 MHz NMRspectrometer was provided by the National Ultrahigh-FieldNMR Facility for Solids (Ottawa, Canada), a national researchfacility funded by the Canada Foundation for Innovation, theOntario Innovation Trust, Recherche Québec, the NationalResearch Council of Canada, and Bruker BioSpin and is man-aged by the University of Ottawa (www.nmr900.ca). NSERC isacknowledged for a Major Resources Support grant.
References
1 Halogen Bonding. Fundamentals and Applications, ed.
P. Metrangolo and G. Resnati, Springer, Heidelberg, serieseditor D. M. P. Mingos, 2008, Structure and Bonding, vol. 126.2 G. R. Desiraju, P. S. Ho, L. Kloo, A. C. Legon, R. Marquardt,
P. Metrangolo, P. Politzer, G. Resnati and K. Rissanen, PureAppl. Chem., 2013, 85, 1711.3 (a) F. Guthrie, J. Chem. Soc., 1863, 239; (b) O. Hassel, Science,
1970, 170, 497.4 (a) D. L. Bryce, Chem. Int., 2012, 34, 27; (b) J. Kemsley,
Chem. Eng. News, 2012, 36.5 A. Priimagi, G. Cavallo, P. Metrangolo and G. Resnati,
Acc. Chem. Res., 2013, 46, 2686.6 M. R. Scholfield, C. M. Vander Zanden, M. Carter and
P. S. Ho, Protein Sci., 2013, 22, 139.7 T. M. Beale, M. G. Chudzinski, M. G. Sarwar and
M. S. Taylor, Chem. Soc. Rev., 2013, 42, 1667.8 Y. Lu, Y. Liu, Z. Xu, H. Li, H. Liu and W. Zhu, Expert Opin.
Drug Discovery, 2012, 7, 375.This journal is © The Royal Society of Chemistry 2014
9 M. Erdélyi, Chem. Soc. Rev., 2012, 41, 3547.
10 M. Fourmigué, Curr. Opin. Solid State Mater. Sci., 2009,13, 36.11 A. C. Legon, Phys. Chem. Chem. Phys., 2010, 12, 7736.
12 P. Politzer, J. S. Murray and T. Clark, Phys. Chem. Chem. Phys.,2010, 12, 7748.13 K. E. Riley and P. Hobza, Phys. Chem. Chem. Phys., 2013,
15, 17742.14 K. E. Riley, J. S. Murray, J. Fanfrlík, J. Řezáč, R. J. Solá,
M. C. Concha, F. M. Ramos and P. Politzer, J. Mol. Model.,2013, 19, 4651.
15 K. E. Riley and P. Hobza, J. Chem. Theory Comput., 2008,
4, 232.16 T. Clark, M. Hennemann, J. S. Murray and P. Politzer, J. Mol.
Model., 2007, 13, 291.17 P. Politzer, K. E. Riley, F. A. Bulat and J. S. Murray, Comput.
Theor. Chem., 2012, 998, 2.18 P. Politzer, J. S. Murray and T. Clark, Phys. Chem. Chem.
Phys., 2013, 15, 11178.19 A. R. Voth, F. A. Hays and P. S. Ho, Proc. Natl. Acad. Sci. U. S. A.,
2007, 104, 6188.20 M. Carter, A. R. Voth, M. R. Scholfield, B. Rummel,
L. C. Sowers and P. S. Ho, Biochemistry, 2013, 52, 4891.21 G. Cavallo, P. Metrangolo, T. Pilati, G. Resnati, M. Sansotera
and G. Terraneo, Chem. Soc. Rev., 2010, 39, 3772.22 L. C. Gilday, N. G. White and P. D. Beer, Dalton Trans., 2012,
41, 7092.23 M. G. Sarwar, B. Dragisić, E. Dimitrijević and M. S. Taylor,
Chem. – Eur. J., 2013, 19, 2050.24 P. Metrangolo, Y. Carcenac, M. Lahtinen, T. Pilati, K. Rissanen,
A. Vij and G. Resnati, Science, 2009, 323, 1461.25 A. Peuronen, A. Valkonen, M. Kortelainen, K. Rissanen and
M. Lahtinen, Cryst. Growth Des., 2012, 12, 4157.26 L. Meazza, J. A. Foster, K. Fucke, P. Metrangolo, G. Resnati
and J. W. Steed, Nat. Chem., 2013, 5, 42.27 L. González, N. Gimeno, R. M. Tejedor, V. Polo, M. B. Ros,
S. Uriel and J. L. Serrano, Chem. Mater., 2013, 25, 4503.28 R. Gutzler, C. Fu, A. Dadvand, Y. Hua, J. M. MacLeod,
F. Rosei and D. F. Perepichka, Nanoscale, 2012, 4, 5965.29 P. Metrangolo, H. Neukirch, T. Pilati and G. Resnati,
Acc. Chem. Res., 2005, 38, 386.30 F. Zordan, S. L. Purver, H. Adams and L. Brammer,
CrystEngComm, 2005, 7, 350.31 C. B. Aakeröy, S. Panikkattu, P. D. Chopade and J. Desper,
CrystEngComm, 2013, 15, 3125.32 C. B. Aakeröy, M. Fasulo, N. Schultheiss, J. Desper and
C. Moore, J. Am. Chem. Soc., 2007, 129, 13772.33 A.-C. C. Carlsson, J. Gräfenstein, A. Budnjo, J. L. Laurila,
J. Bergquist, A. Karim, R. Kleinmaier, U. Brath andM. Erdélyi, J. Am. Chem. Soc., 2012, 134, 5706.34 X. Q. Yan, X. R. Zhao, H. Wang and W. J. Jin, J. Phys. Chem.
B, 2014, 118, 1080.35 J. Viger-Gravel, I. Korobkov and D. L. Bryce, Cryst. Growth
Des., 2011, 11, 4984.36 J. Viger-Gravel, S. Leclerc, I. Korobkov and D. L. Bryce,
CrystEngComm, 2013, 15, 3168.CrystEngComm, 2014, 16, 7285–7297 | 7295

CrystEngCommPaper
Publ
ishe
d on
23
Apr
il 20
14. D
ownl
oade
d by
Uni
vers
ity o
f O
ttaw
a on
18/
07/2
014
19:3
0:24
. View Article Online
37 R. J. Attrell, C. M. Widdifield, I. Korobkov and D. L. Bryce,
Cryst. Growth Des., 2012, 12, 1641.38 C. M. Widdifield, G. Cavallo, G. A. Facey, T. Pilati, J. Lin,
P. Metrangolo, G. Resnati and D. L. Bryce, Chem. – Eur. J.,2013, 19, 11949.39 S. Grzesiek, F. Cordier, V. Jaravine and M. Barfield, Prog.
Nucl. Magn. Reson. Spectrosc., 2004, 45, 275.40 A. J. Dingley and S. Grzesiek, J. Am. Chem. Soc., 1998, 120, 8293.
41 S. P. Brown, M. Pérez-Torralba, D. Sanz, R. M. Claramuntand L. Emsley, Chem. Commun., 2002, 1852.42 Y.-X. Wang, J. Jacob, F. Cordier, P. Wingfield, S. J. Stahl,
S. Lee-Huang, D. Torchia, S. Grzesiek and A. Bax, J. Biomol.NMR, 1999, 14, 181.
43 H. Benedict, I. G. Shenderovich, O. L. Malkina, V. G. Malkin,
G. S. Denisov, N. S. Golubev and H.-H. Limbach, J. Am.Chem. Soc., 2000, 122, 1979.44 N. S. Golubev, I. G. Shenderovich, S. N. Smirnov, G. S. Denisov
and H.-H. Limbach, Chem. – Eur. J., 1999, 5, 492.45 M. P. Ledbetter, G. Saielli, A. Bagno, N. Tran and M. V. Romalis,
Proc. Natl. Acad. Sci. U. S. A., 2012, 109, 12393.46 M. J. Plevin, D. L. Bryce and J. Boisbouvier, Nat. Chem., 2010,
2, 466.47 J. E. Del Bene, I. Alkorta and J. Elguero, J. Phys. Chem. A,
2008, 112, 7925.48 R. García-Rodríguez and H. Liu, J. Phys. Chem. A, 2014, DOI:
10.1021/jp411681f.49 P. A. W. Dean and M. K. Hughes, Can. J. Chem., 1980, 58, 180.
50 J. Autschbach, J. Chem. Phys., 2007, 127, 124106. 51 A. J. Rossini, R. W. Mills, G. A. Briscoe, E. L. Norton,S. J. Geier, I. Hung, S. Zheng, J. Autschbach and R. W. Schurko,J. Am. Chem. Soc., 2009, 131, 3317.
52 S. Zheng and J. Autschbach, Chem. – Eur. J., 2011, 17, 161.
53 A. Sutrisno, A. Y. H. Lo, J. A. Tang, J. L. Dutton, G. J. Farrar,P. J. Ragogna, S. Zheng, J. Autschbach and R. W. Schurko,Can. J. Chem., 2009, 87, 1546.
54 L. A. O'Dell, R. W. Schurko, K. J. Harris, J. Autschbach and
C. I. Ratcliffe, J. Am. Chem. Soc., 2011, 133, 527.55 (a) A. Bondi, J. Phys. Chem., 1964, 68, 441; (b) R. D. Shannon,
Acta Crystallogr., Sect. A: Cryst. Phys., Diffr., Theor. Gen.Crystallogr., 1976, 32, 751.56 (a) P. Pyykkö, A. Görling and N. Rösch, Mol. Phys., 1987, 61,
195; (b) M. Kaupp, O. L. Malkina and V. G. Malkin, Chem.Phys. Lett., 1997, 265, 55; (c) M. Kaupp, O. L. Malkina,V. G. Malkin and P. Pyykkö, Chem. – Eur. J., 1998, 4, 118.57 R. D. Chambers, C. J. Skinner, M. J. Atherton and J. S. Moilliet,
J. Chem. Soc., Perkin Trans. 1, 1996, 1659.58 B. A. Demko, K. Eichele and R. E. Wasylishen, J. Phys. Chem.
A, 2006, 110, 13537.59 G. Grossmann, M. J. Potrzebowski, U. Fleischer, K. Krüger,
O. L. Malkina and W. Ciesielski, Solid State Nucl. Magn.Reson., 1998, 13, 71.60 U. Haubenreisser, U. Sternberg and A.-R. Grimmer, Mol. Phys.,
1987, 60, 151.61 H. Bai and R. K. Harris, J. Magn. Reson., 1992, 96, 24.
62 D. L. Bryce, Tensor Interplay, eMagRes, 2008, 10.1002/9780470034590.emrstm1039.
7296 | CrystEngComm, 2014, 16, 7285–7297
63 (a) G. te Velde, F. M. Bickelhaupt, C. Fonseca Guerra,
S. J. A. van Gisbergen, E. J. Baerends, J. G. Snijders andT. Ziegler, J. Comput. Chem., 2001, 22, 931; (b) C. FonsecaGuerra, J. G. Snijders, G. te Velde and E. J. Baerends, Theor.Chem. Acc., 1998, 99, 391; (c) E. J. Baerends, et al., AmsterdamDensity Functional Software ADF2009.01 SCM; TheoreticalChemistry, Vrije Universiteit, Amsterdam, The Netherlands,http://www.scm.com/, 2010.64 M. J. Frisch, et al., Gaussian 09, rev. A.02, Gaussian, Inc.,
Wallingford, CT, 2009.65 (a) C. J. Pickard and F. Mauri, Phys. Rev. B: Condens. Matter
Mater. Phys., 2001, 63, 245101; (b) J. R. Yates, C. J. Pickardand F. Mauri, Phys. Rev. B: Condens. Matter Mater. Phys.,2007, 76, 024401; (c) M. Profeta, F. Mauri and C. J. Pickard,J. Am. Chem. Soc., 2003, 125, 541; (d) S. J. Clark, M. D. Segall,C. J. Pickard, P. J. Hasnip, M. I. J. Probert, K. Refson andM. C. Payne, Z. Kristallogr., 2005, 220, 567.66 J. Jokisaari, P. Lazzeretti and P. Pyykkö, Chem. Phys., 1988, 123, 339.
67 M. Bühl, W. Thiel, U. Fleischer and W. Kutzelnigg, J. Phys.Chem., 1995, 99, 4000.68 G. Schreckenbach, Y. Ruiz-Morales and T. Ziegler, J. Chem.
Phys., 1996, 104, 8605.69 W. Nakanishi, S. Hayashi, Y. Katsura and M. Hada, J. Phys.
Chem. A, 2011, 115, 8721.70 H. D. Arman, E. R. Rafferty, C. A. Bayse and W. T. Pennington,
Cryst. Growth Des., 2012, 12, 4315.71 Bruker AXS: Bruker Suite, version 2008/3, Bruker AXS Inc.,
Madison, WI, USA, 2008.72 G. M. Sheldrick, Acta Crystallogr., Sect. A: Found. Crystallogr.,
2008, 64, 112.73 J. Schaefer and E. O. Stejskal, J. Am. Chem. Soc., 1976, 98, 1031.
74 W. L. Earl and D. L. VanderHart, J. Magn. Reson., 1982, 48, 35. 75 A. K. Jameson and C. J. Jameson, Chem. Phys. Lett., 1987,134, 461.76 M. J. Collins, C. I. Ratcliffe and J. A. Ripmeester, J. Magn.
Reson., 1986, 68, 172.77 D. L. Bryce, G. M. Bernard, M. Gee, M. D. Lumsden,
K. Eichele and R. E. Wasylishen, Can. J. Anal. Sci. Spectrosc.,2001, 46, 46.
78 K. Eichele, WSolids1 ver. 1.20.21, Universität Tübingen, 2013.
79 M. Bak, J. T. Rasmussen and N. C. Nielsen, J. Magn. Reson.,2000, 147, 296.80 P. W. Codding and K. A. Kerr, Acta Crystallogr., Sect. B: Struct.
Crystallogr. Cryst. Chem., 1979, 35, 1261.81 (a) G. Schreckenbach and T. Ziegler, J. Phys. Chem., 1995, 99,
606; (b) S. K. Wolff, T. Ziegler, E. van Lenthe and E. J. Baerends,J. Chem. Phys., 1999, 110, 7689.
82 J. M. Tao, J. P. Perdew, V. N. Staroverov and G. E. Scuseria,
Phys. Rev. Lett., 2003, 91, 146401.83 J. Autschbach and T. Ziegler, J. Chem. Phys., 2000, 113, 936.
84 E. D. Glendening, J. K. Badenhoop, A. E. Reed, J. E. Carpenter,J. A. Bohmann, C. M. Morales and F. Weinhold, NBO 5.0,Theoretical Chemistry Institute, University of Wisconsin,Madison, 2001, http://www.chem.wisc.edu/~nbo5.
85 (a) J. P. Perdew, K. Burke and M. Ernzerhof, Phys. Rev. Lett.,
1996, 77, 3865; (b) J. P. Perdew, K. Burke and M. Ernzerhof,This journal is © The Royal Society of Chemistry 2014

CrystEngComm Paper
Publ
ishe
d on
23
Apr
il 20
14. D
ownl
oade
d by
Uni
vers
ity o
f O
ttaw
a on
18/
07/2
014
19:3
0:24
. View Article Online
Phys. Rev. Lett., 1997, 78, 1396; (c) Y. Zhang and W. Yang,Phys. Rev. Lett., 1998, 80, 890.
86 S. Adiga, D. Aebi and D. L. Bryce, Can. J. Chem., 2007,
85, 496.This journal is © The Royal Society of Chemistry 2014
87 C. J. Jameson and A. K. Jameson, Chem. Phys. Lett., 1987,
135, 254.88 C. J. Jameson, A. De Dios and A. K. Jameson, Chem. Phys.
Lett., 1990, 167, 575.CrystEngComm, 2014, 16, 7285–7297 | 7297