cs160 final review may 2, 2006. advertisement… looking for someone who will be around this summer...
Post on 20-Dec-2015
214 views
TRANSCRIPT

CS160 Final ReviewMay 2, 2006
Advertisement… Looking for someone who will be around
this summer and would like some occasional (contract) work.
Sign up with me if you’re interested.
Final Exam Review Exam will cover the entire semester (2/3 vs. 1/3
split), this review is over the second half
Selected slides from lecture – but not guaranteed to contain everything you need to know!
Ask questions about the things that you don’t understand.

Mobile Evaluation

Mobile Evaluation Kjeldskov and Stage evaluated a mobile
application in the lab, on a treadmill, and walking down the street
Task Load Index (TLX) increased…
Other possibilitiesExperience Sampling (ESM)
Diary Studies (Feedback and Elicitation)

Design

Design is… About function:
Good designs support user tasks
About form:
Good designs should be a pleasure to use

Design Summary One design strategy follows Bauhaus principles
Form Follows Function
Economy of Form
Integrity of Materials
General design principles
Simplicity
Grid-based Design
Inspection and critique of other sites

UI Implementation
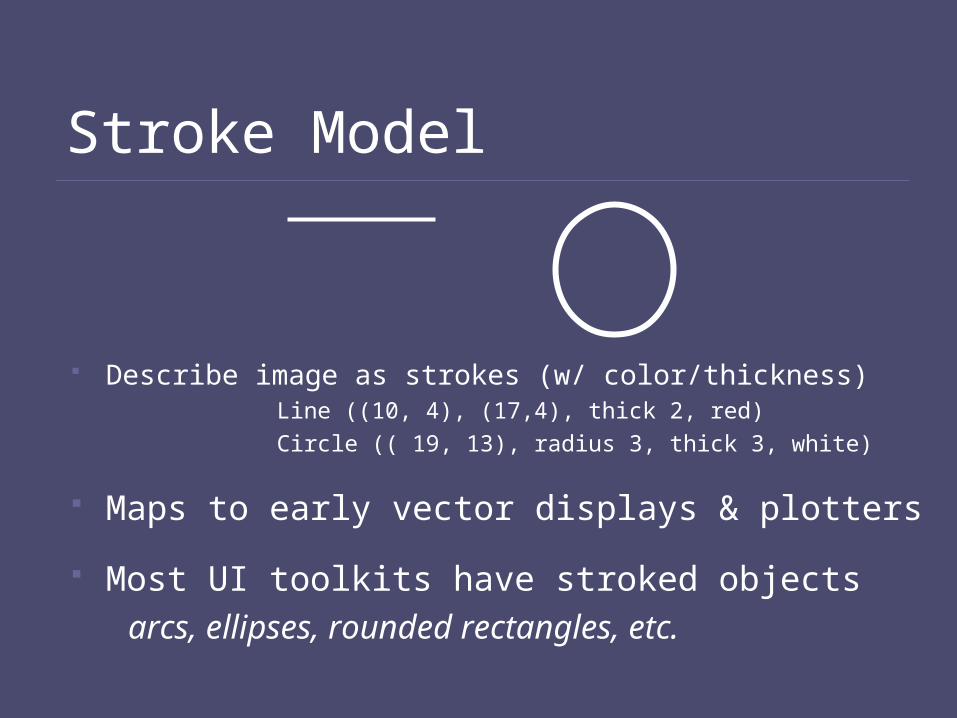
Describe image as strokes (w/ color/thickness)Line ((10, 4), (17,4), thick 2, red)
Circle (( 19, 13), radius 3, thick 3, white)
Maps to early vector displays & plotters
Most UI toolkits have stroked objects
arcs, ellipses, rounded rectangles, etc.
Stroke Model

Problems with Stroke Model?
How would you represent with strokes?
Solution?

Pixel Model Break-up complex images into discrete “pixels” &
store color for each
ResolutionSpatial: number of rows by columnse.g., 1280 x 1024 is a good monitor displayQuality laser printer: 10200 x 13200 (1200 dpi)Image depth (i.e., number of bits per pixel)Several styles... 8-bit, 24-bit, 32-bit
Canvas Abstraction for the drawing surface
Most toolkits support one
Defines methods used for drawing
Each instance has a height, width, & defines its physical units
Use the same method interface forWindowsImage in memoryPrinted output
Called Graphical Device Interface (GDI) by MS
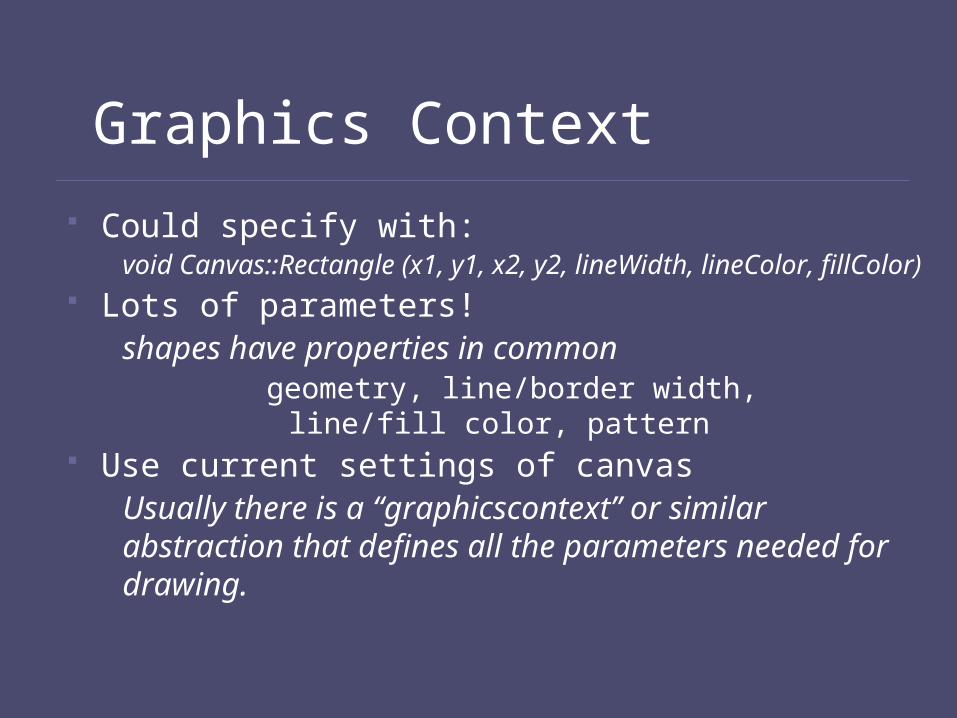
Graphics Context
Could specify with:void Canvas::Rectangle (x1, y1, x2, y2, lineWidth, lineColor, fillColor)
Lots of parameters!shapes have properties in common
geometry, line/border width, line/fill color, pattern Use current settings of canvas
Usually there is a “graphicscontext” or similar abstraction that defines all the parameters needed for drawing.
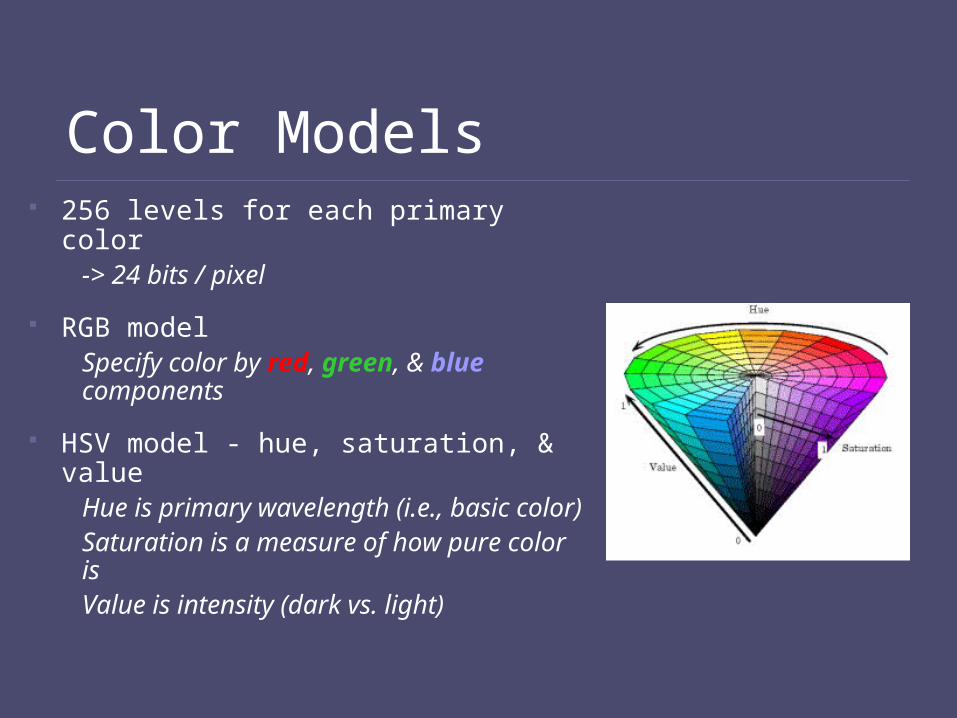
Color Models 256 levels for each primary color
-> 24 bits / pixel
RGB modelSpecify color by red, green, & blue components
HSV model - hue, saturation, & valueHue is primary wavelength (i.e., basic color)Saturation is a measure of how pure color isValue is intensity (dark vs. light)
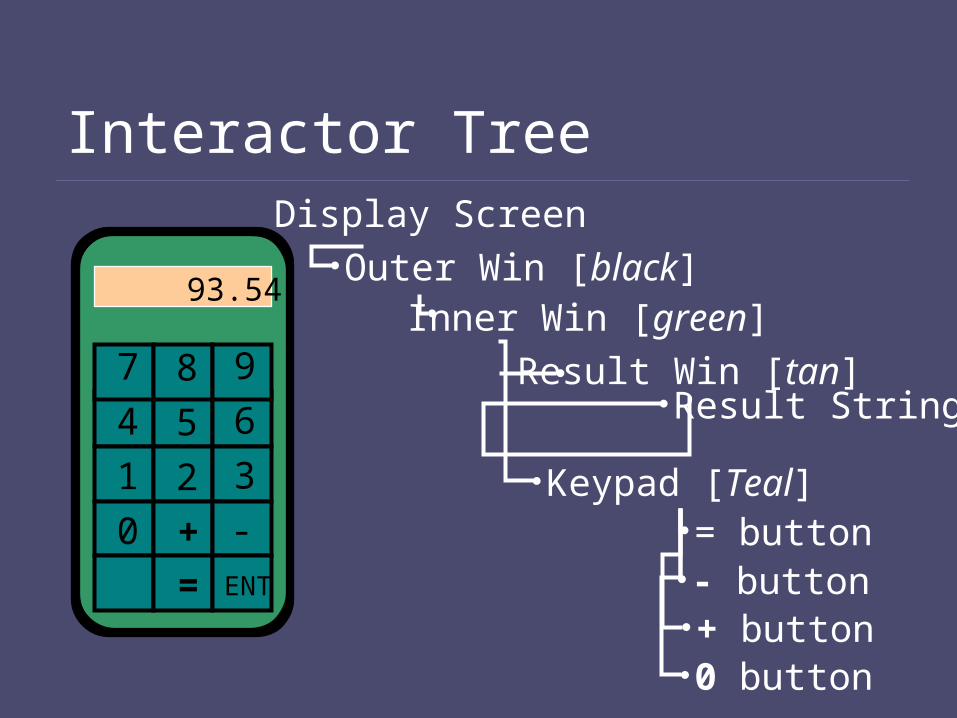
Interactor Tree
7 8 9
4 5 6
0 + -
1 2 3
=
93.54
ENT
Display Screen
Outer Win [black]
Result Win [tan]Result String
Inner Win [green]
Keypad [Teal]
- button+ button0 button
= button

//// See bottom of file for software licensepackage edu.berkeley.guir.lib.satin;import java.awt.*;import java.awt.event.*;import edu.berkeley.guir.lib.satin.objects.*;
/*** Satin constants.** <P>* This software is distributed under the * <A HREF="http://guir.cs.berkeley.edu/projects/COPYRIGHT.txt">* </PRE>** @version SATIN-v2.1-1.0.0, Aug 11 2000*/public interface SatinConstants {
//===========================================================================//=== GLOBAL SATIN PROPERTIES ===========================================
/*** The name of Satin's properties file. Assumed to be in the current* directory, from which Satin is started (via the java interpreter).*/public static final String SATIN_PROPERTIES_FILENAME = "satin.properties";
//=== GLOBAL SATIN PROPERTIES ===========================================//===========================================================================
//===========================================================================//=== STYLE PROPERTIES ==================================================
//// If you add any new Style properties, be sure to update the//// Style.java file too.
public static final String KEY_STYLE_FILLCOLOR = "FillColor";public static final String KEY_STYLE_FILLTRANSPARENCY = "FillTransparency";
public static final String KEY_STYLE_MITERLIMIT = "MiterLimit";
public static final String KEY_STYLE_DASHARRAY = "DashArray";public static final String KEY_STYLE_DASHPHASE = "DashPhase";
//=== STYLE PROPERTIES ==================================================//===========================================================================
} // of interface
//==============================================================================
/*Copyright (c) 2000 Regents of the University of California.All rights reserved.
Redistribution and use in source and binary forms, with or withoutmodification, are permitted provided that the following conditionsare met:
1. Redistributions of source code must retain the above copyrightSUCH DAMAGE.*/
Main Event Loopwhile (app is running) {
get next event
send event to right widget}
MouseSoftware Events
Sou
rce
Cod
e
KeyboardSoftware
Display Screen
Outer Win [black]
Result Win [tan]Result String
Inner Win [green]
Keypad [Teal]
- button+button0 button
= button

Platforms - PC
For regular PC development, the options are: C#/Visual Basic/C++ (Visual Studio) Java Flash Rapid prototyping: Suede, Silk, Satin
(see guir.berkeley.edu/projects)
Platforms - Web
For web development one of themain issues is portability. Before designing your app, think about browsers for your user group.
There is a lot more than IE and Netscape: Mozilla/Opera AOL: huge community, many versions with
limited browsers Old versions of IE and Netscape

There are 6.5 billion people on earth - only about 1.2 billion in “developed” countries
They will buy 800 million mobile phones this year - one person in eight on the planet
That’s 4x PC or TV unit sales
Fraction of smartphones should reach 40% by 2009 - most common “computer”
800m
200m
The Cell Phone Industry
Interactive Programming

Callbacks

Threads Use separate threads for any operations that can
occur asynchronously:Large file operations – use separate threads if you need to be updating and large files.
Network communication (sockets): use one thread for each connection.
Use a thread for each other I/O device, e.g. one each for reading from or writing to the sound card
Timers: if you schedule events to happen later, you need a thread to trigger that action

What’s in a thread A thread is a partial virtual machine (with
its own stack) that runs your program. Threads share heap storage and static variables. (processes don’t share memory)
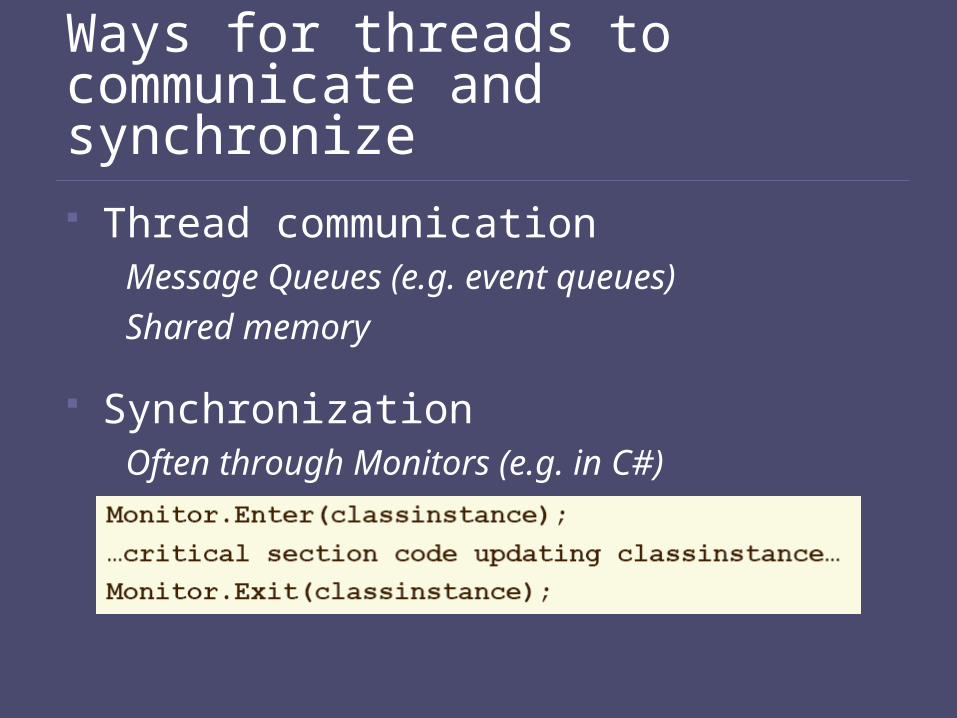
Ways for threads to communicate and synchronize
Thread communicationMessage Queues (e.g. event queues)
Shared memory
SynchronizationOften through Monitors (e.g. in C#)
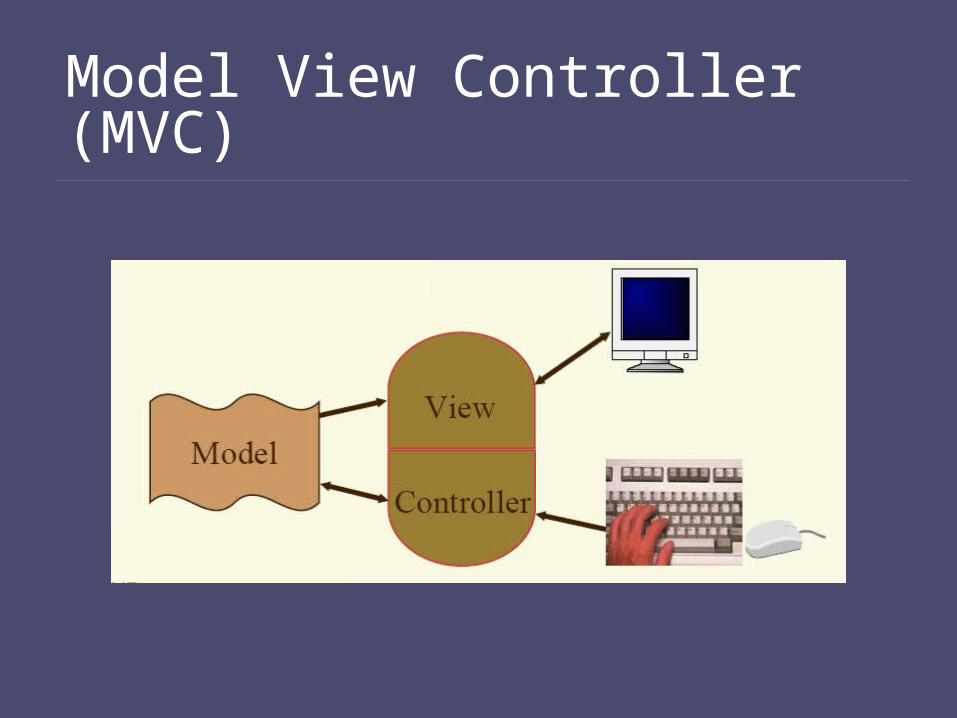
Model View Controller (MVC)

Sensori-Motor Models

Color: Retina Retina covered with light-
sensitive receptorsRods
Primarily for night vision & perceiving movement
Sensitive to broad spectrum of light
Can’t discriminate between colors
Sense intensity or shades of gray
ConesUsed to sense color

Color: Retina Center of retina has most of the cones
Allows for high acuity of objects focused at center, good color perception.
Edge of retina is dominated by rods
Allows detecting motion of threats in periphery, poor color sensitivity there.
What’s the best way to perceive something in near darkness?
Look slightly away from it.

Color Blindness
Check out other color use hints in the lecture notes.
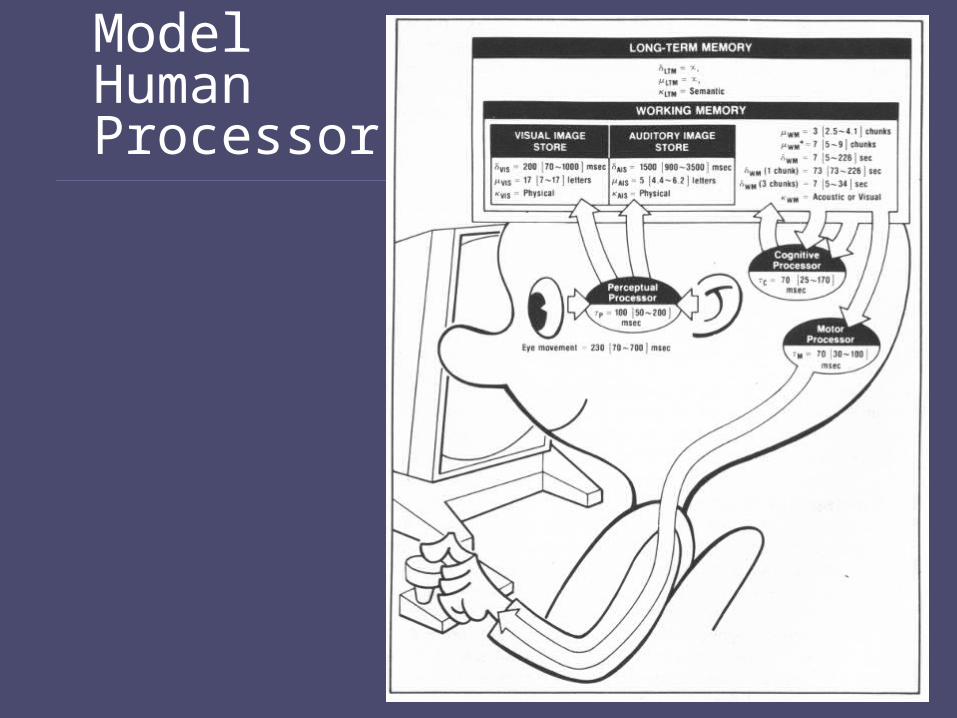
Model Human Processor
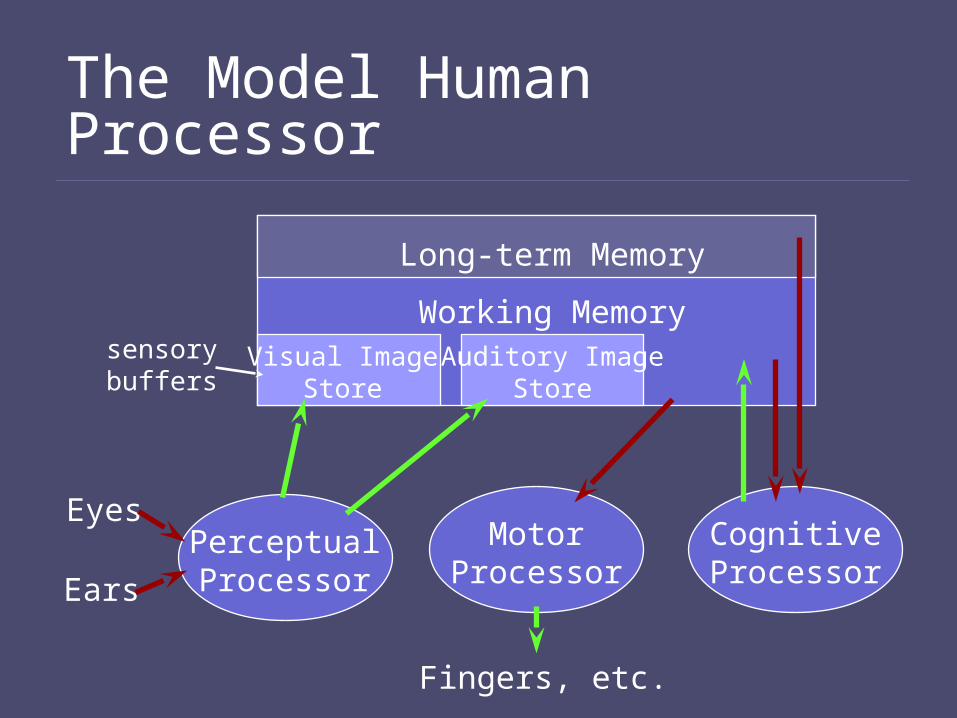
The Model Human Processor
Long-term Memory
Working MemoryVisual Image
StoreAuditory Image
Store
PerceptualProcessor
CognitiveProcessor
MotorProcessor
Eyes
Ears
Fingers, etc.
sensorybuffers
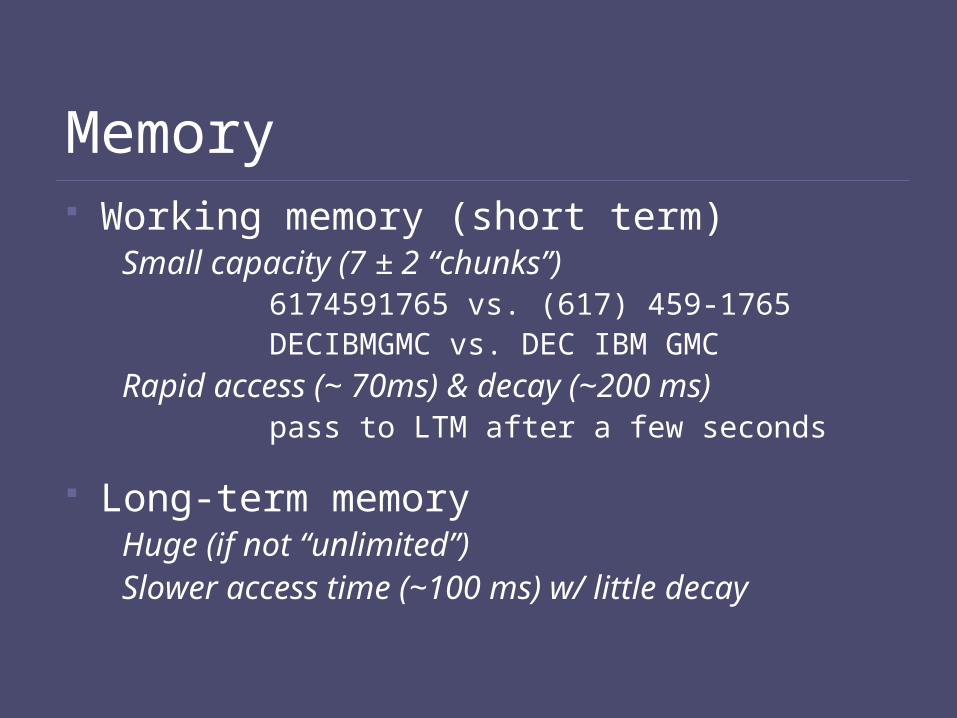
Memory Working memory (short term)
Small capacity (7 ± 2 “chunks”)6174591765 vs. (617) 459-1765DECIBMGMC vs. DEC IBM GMC
Rapid access (~ 70ms) & decay (~200 ms)pass to LTM after a few seconds
Long-term memoryHuge (if not “unlimited”)Slower access time (~100 ms) w/ little decay

MHP Basics Sometimes serial, sometimes parallel
Serial in action & parallel in recognition
Pressing key in response to light
Driving, reading signs, & hearing at once
Parameters
Processors have cycle time (T) ~ 100-200 ms
Memories have capacity, decay time, & type
Fitts’ Law
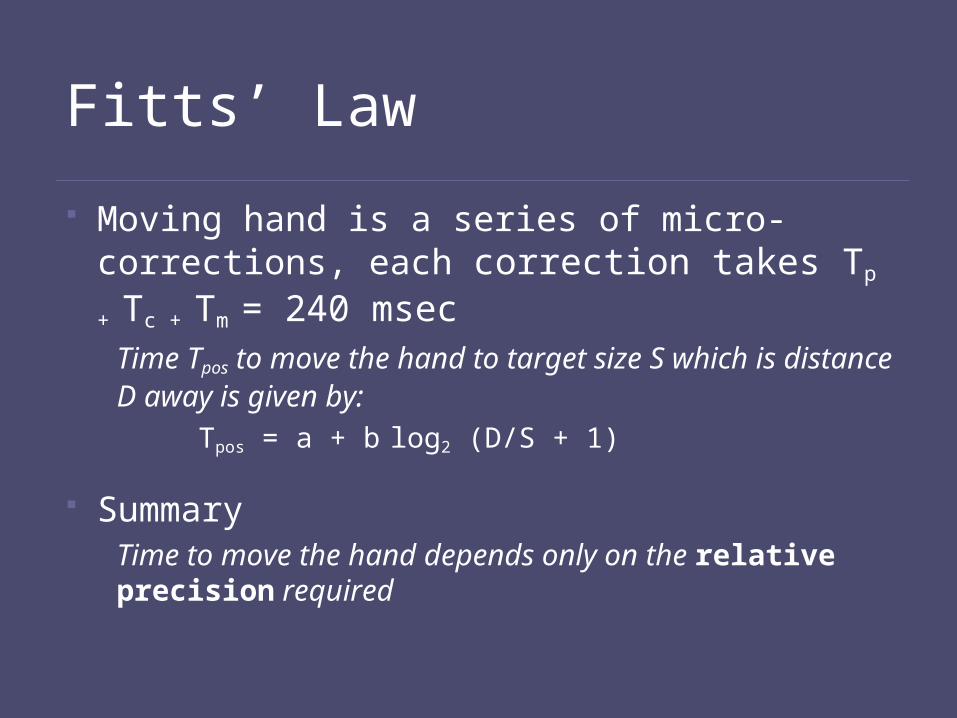
Moving hand is a series of micro-corrections, each correction takes Tp + Tc + Tm = 240 msec
Time Tpos to move the hand to target size S which is distance D away is given by:
Tpos = a + b log2 (D/S + 1)
SummaryTime to move the hand depends only on the relative precision required

Fitts’ Law Example
Which will be faster on average?
TodaySundayMondayTuesday
WednesdayThursday
FridaySaturday
Pop-up Linear Menu
Pop-up Pie Menu

Working Memory
Sensory Image Store
Long Term Memory
decay decay,displacement
chunking / elaboration
decay?interference?
maintenancerehearsal
Stage Theory

Design Patterns

Design Patterns First used in architecture [Alexander]
Communicate design problems & solutions
How big doors should be & where…
How to create a beer garden where people socialize…
How to use handles (remember Norman)…
Not too general & not too specific
Use solution “a million times over, without ever doing it the same way twice”

Home page design1. Pattern Title: Home page
2. Context: Pages that are the entry point for a web site.
3. ForcesPeople are attracted by novelty and good design, attention span is very short on the web, home pages are regularly updated.
4. Problem StatementWhat to capture and hold visitors attention, encourage return visits, and be easy to maintain
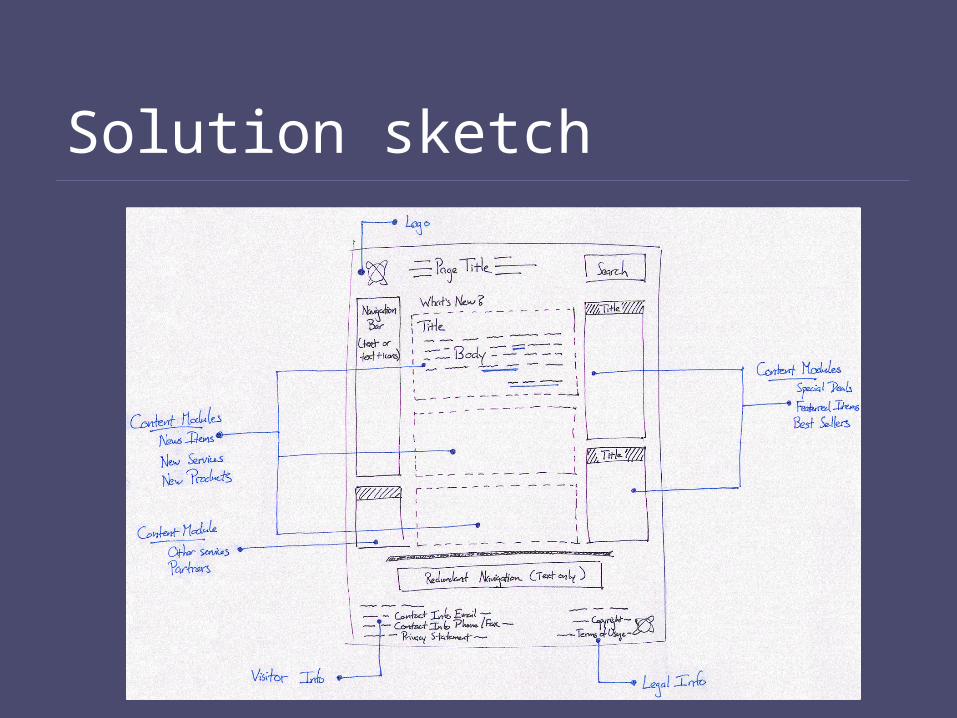
Solution sketch

Quantitative Evaluation Methods
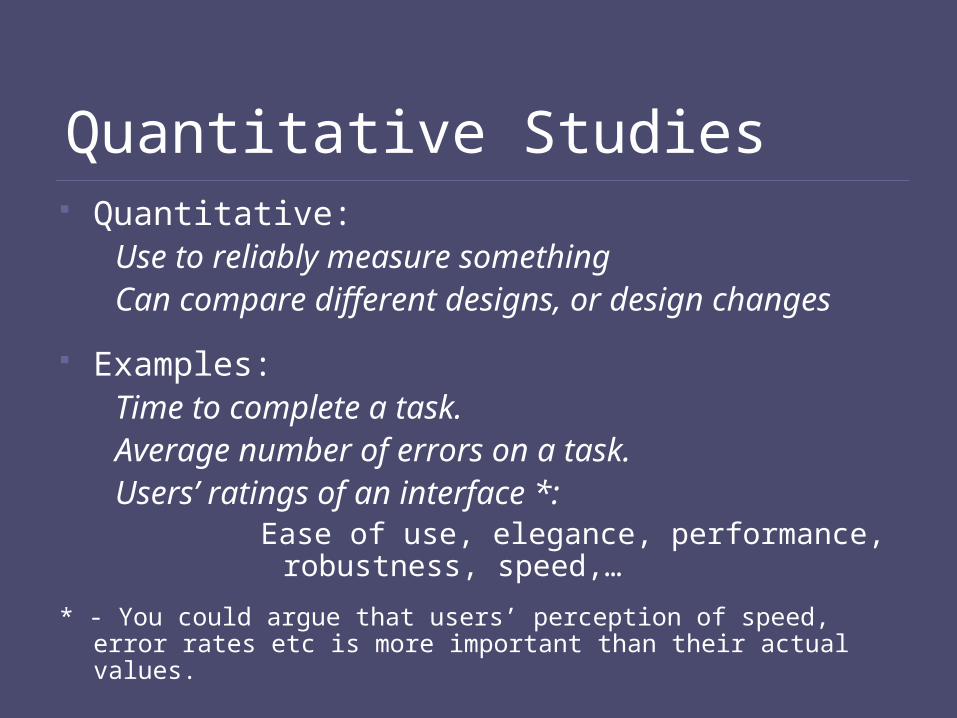
Quantitative Studies Quantitative:
Use to reliably measure somethingCan compare different designs, or design changes
Examples:Time to complete a task.Average number of errors on a task.Users’ ratings of an interface *:
Ease of use, elegance, performance, robustness, speed,…
* - You could argue that users’ perception of speed, error rates etc is more important than their actual values.

Random variables Random variables take on different values according to a
probability distribution.
E.g. X {1, 2, 3} is a discrete random variable with three possible values.
To characterize the variable, we need to define the probabilities for each value:
Pr[X=1] = Pr[X=2] = ¼, Pr[X=3] = ½
On each trial or experiment, we should see one of these three values with the given probability.

Detecting differences The more times you repeat an experiment, the narrower
the distributions of measured average values for two conditions.
So the more likely you are to detect a difference in a test variable between two cases.

Variable types Independent Variables: the ones you control
Aspects of the interface design
Characteristics of the testers
Discrete: A, B or C
Continuous: Time between clicks for double-click
Dependent variables: the ones you measure
Time to complete tasks
Number of errors

Significance
The significance or p-value of an outcome is the probability that it happens by chance if the relation does not hold.
E.g. p = 0.05 means that there is a 1/20 chance that the observation happens if the hypothesis is false.
So the smaller the p-value, the greater the significance.
T-test The T-test asks for the probability that E[X] > E[Y] is
false.
i.e. the null hypothesis for the T-test is whether E[X] = E[Y].
What is the probability of that given the observations?

Analyzing the Numbers Example: prove that task 1 is faster on design A
than design B.
Suppose the average time for design B is 20% higher than A.
Suppose subjects’ times in the study have a std. dev. which is 30% of their mean time (typical).
How many subjects are needed? Need at least 13 subjects for significance p=0.01
Need at least 22 subjects for significance p=0.001
(assumes subjects use both designs)

Statistics with care: A common mistake:
An experiment fails to find a significant difference between test and control cases (say at p = 0.05), so you conclude that there is no significant difference.
No!
A difference-of-averages test can only confirm (with high probability) that there is a difference. Failure to prove a significant difference can be because
There is no difference, OR
The number of subjects in the experiment is too small

Between subjects experiment
Two groups of test users
Each group uses only 1 of the systems
Within subjects experiment
One group of test users
Each person uses both systems
BA
Using Subjects

Between subjects Two groups of testers, each use 1 system
Advantages: Users only have to use one system (practical).
No learning effects.
Disadvantages:Per-user performance differences confounded with system differences:
Much harder to get significant results (many more subjects needed).
Harder to even predict how many subjects will be needed (depends on subjects).
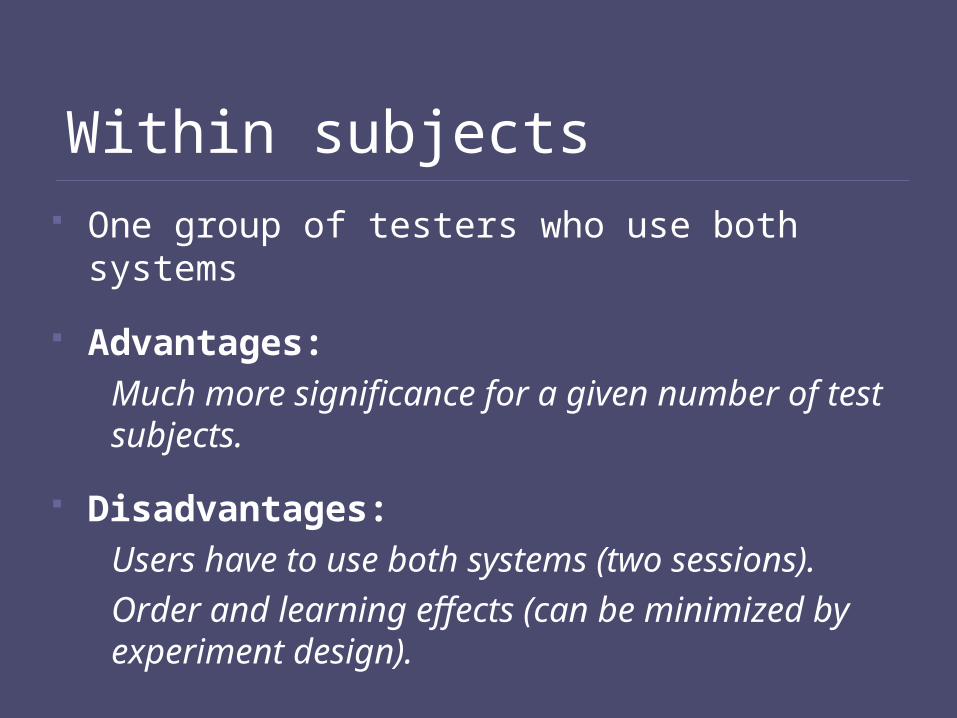
Within subjects One group of testers who use both systems
Advantages:
Much more significance for a given number of test subjects.
Disadvantages:
Users have to use both systems (two sessions).
Order and learning effects (can be minimized by experiment design).

Social Psychology and CSCW

Social Psychology Why study it?
It helps us understand human collaboration, which is one of the most difficult areas of HCI, but also the most important.
Most “knowledge work” is collaborative at some level. Organizations can be more or lessthan the sum of their parts.

Mere presence – Design Implications Increasing the level of group “awareness”
should increase mere presence effects:Heightened arousalFaster performanceIncreased learningMore errors
Examples:High awareness – video conferencing, phoneMedium – Instant messagingLow awareness – Email
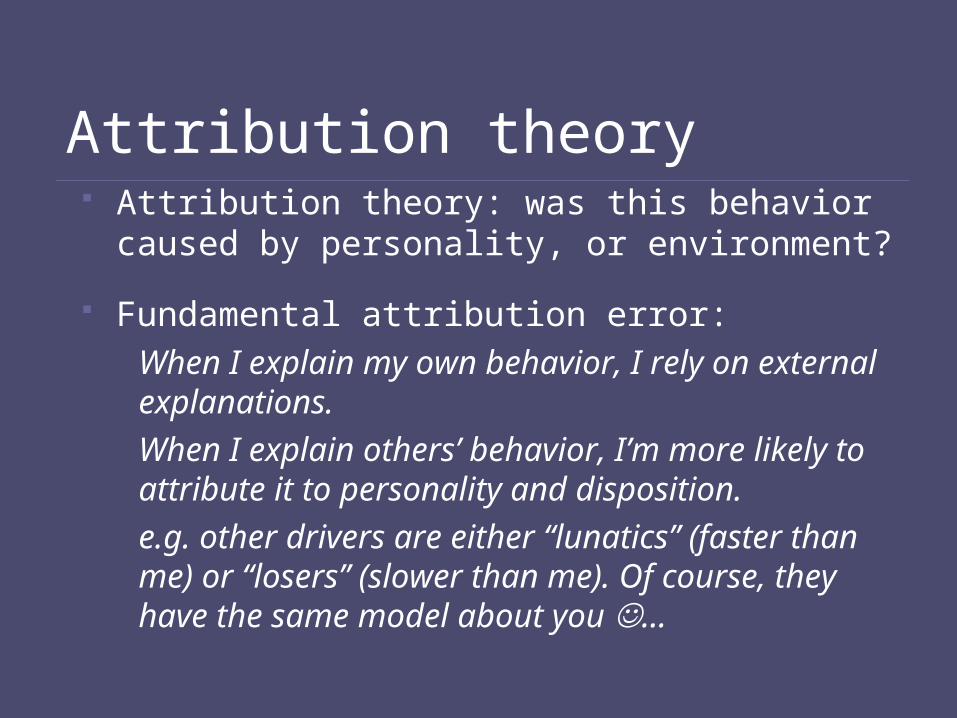
Attribution theory Attribution theory: was this behavior caused by
personality, or environment?
Fundamental attribution error:
When I explain my own behavior, I rely on external explanations.
When I explain others’ behavior, I’m more likely to attribute it to personality and disposition.
e.g. other drivers are either “lunatics” (faster than me) or “losers” (slower than me). Of course, they have the same model about you …

Attribution theory – design implications To reduce attribution errors, its important to have as much
context as possible.
E.g. room-scale video-conferencing, or ambient displays:

Non-verbal communicationQ: What is the role of these cues in normal communication?
A: It depends totally on the role of the communication, e.g.
Routine (giving information, coordinating)
Persuading and being persuaded
Trust, deception and negotiation
…

CSCW: Computer-Supported Cooperative Work
Its about tools that allow people to work together.
Most of the tools support remote work
video, email, IM, Workflow
Some tools, e.g. Livenotes, augment local communication.
Can be synchronous (live) or asynchronous
Asynchronous Groupware
Email: still a killer app
Newsgroups: topical messaging
Cooperative hypertext/hypermedia authoring: e.g. Wikis, Blogs
Structured messaging: e.g. Workflow – messages route automatically.
Knowledge repositories: Answergarden, MadSciNet, Autonomy…
Automation

Human Learning and Help

Why Study Human Learning?
Ans: People need to *learn* new applications, often using various forms of Help.
Ans: The way people learn should influence the design of help systems, and perhaps the entire system e.g.
Knowledge is “situated” in particular contexts, so help should reflect that (scenarios/common tasks)
Learning is layered on old knowledge in a roughly novice expert trajectory
Learning involves a concrete abstract progression
Fluency with abstraction varies across the population, esp. with degree of schooling
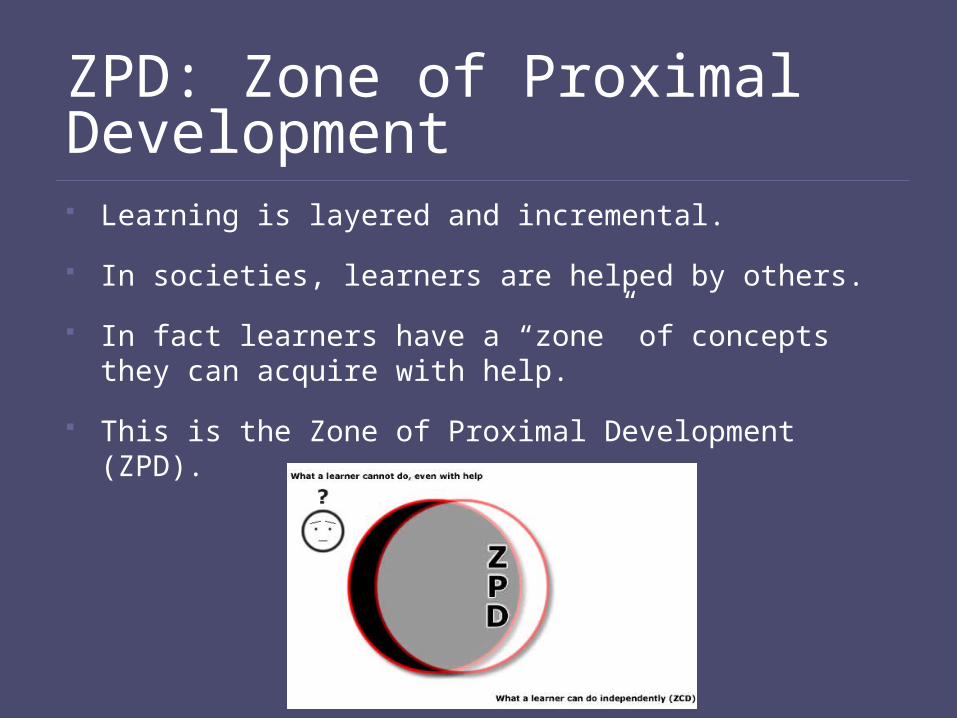
ZPD: Zone of Proximal Development Learning is layered and incremental.
In societies, learners are helped by others.
In fact learners have a “zone” of concepts they can acquire with help.
This is the Zone of Proximal Development (ZPD).

Metacognition Strong learners carefully manage their learning.
For instance, strong learners reading a textbook will pause regularly, check understanding, and go back to difficult passages.
Weak learners tend toplough through theentire text, then realize they don’tunderstand and startagain.
Have I learnedthis yet?Have I learnedthis yet?
Piaget: Stages of learning
Jean Piaget observed very systematic progression of knowledge in children through stages:
1. Sensori-motor (acting, observing, remembering) [< 2 years]
2. Semiotic or symbolic (naming things) [> 1.5 years]
3. “Concrete” operations (relationships, transformations) [2-7, 7-11 years]
4. Propositional or formal thought [> 7 years]

Types of Help Quick Reference:
Reminders of commoncommand names or options.Good to place on a card, or for small devices, on the device itself. Use a few main categoriesto avoid long search..E.g. for an editor, categorieslike “basic”, “search/replace”, “load/save”, etc.

Types of Help Task-specific help
User needs help on howto apply a command, orto complete a task.Can be part of a “how-to”system for common tasks. Should be easily accessiblefrom the command line (if text).Make “options” windows obvious and easy to find!E.g. add “advanced” button in the dialogue to apply any command.

Types of Help Full explanation
User wants complete understanding, to get bestvalue out of the application.This part explains the “why”more than the “how”. E.g. How do compiler options affect performance? What are various installation components used for? What are the uncommon commands? Probably need a chapter in the help system for this. More system-centric than task-centric.
Types of Help Tutorial
The tutorial leads the user through a task, scaffolding their actions. Should allow users to act as well as watch (sandboxing). The “best” way to teach!More work to build into the system, but you should leverage your company’s other effort:
E.g. most software houses conduct regular training sessions for customers – these are ideal tutorial content.

Speech Interfaces

Speech: the Ultimate Interface? Why speech hasn’t succeeded in the office:
Affordances of text:
Visual scanning (for email or docs)
Unambiguity of text
Editing of text
Disadvantages of speech:
Noise – call center ambience
Lack of privacy
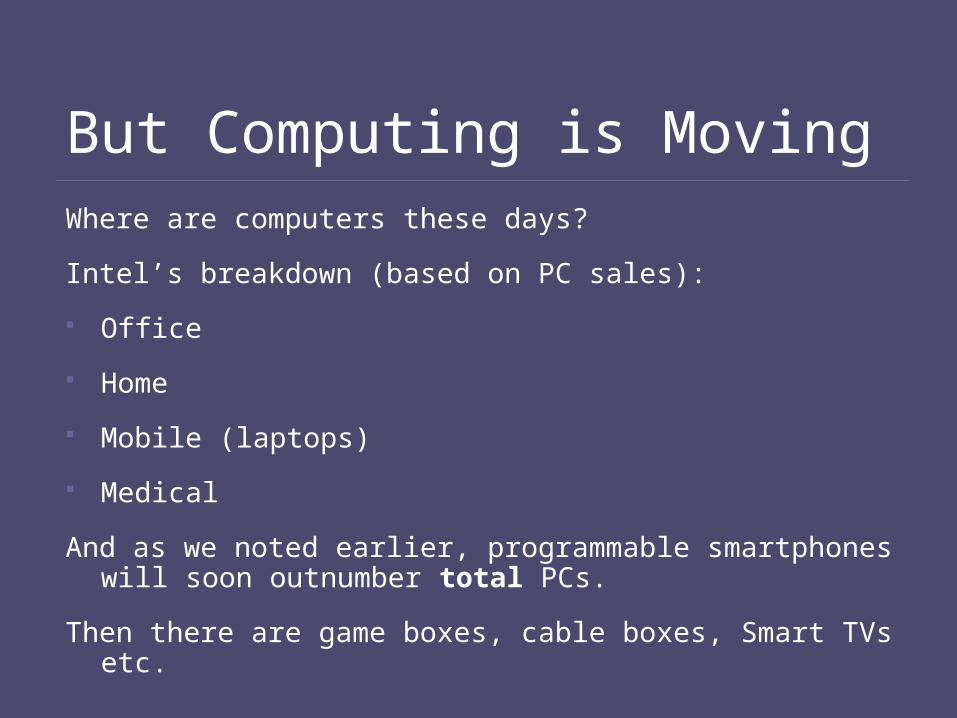
But Computing is MovingWhere are computers these days?
Intel’s breakdown (based on PC sales):
Office
Home
Mobile (laptops)
Medical
And as we noted earlier, programmable smartphones will soon outnumber total PCs.
Then there are game boxes, cable boxes, Smart TVs etc.

Speech UIs Most implement a finite-state machine.
At each state, the system can recognize various speech segments to take you to the next state(s).
A segment may be a word, through to a complete utterance.
The system can also make utterances of its own at various states.
You can specify them usingregular expressions, or using VoiceML.

Ten Guidelines for Speech Interfaces
1. You can’t design what you can’t define
2. Use user-centered design techniques
3. Use the right technology, and use technology right
4. Leverage the language instinct
5. Establish success criteria and test against them
6. Branding in VUI is more than just a pretty voice
7. How you say it is as important as what you say
8. Don’t block the exit
9. Take care with error handling
10. Establish a change process

Localization
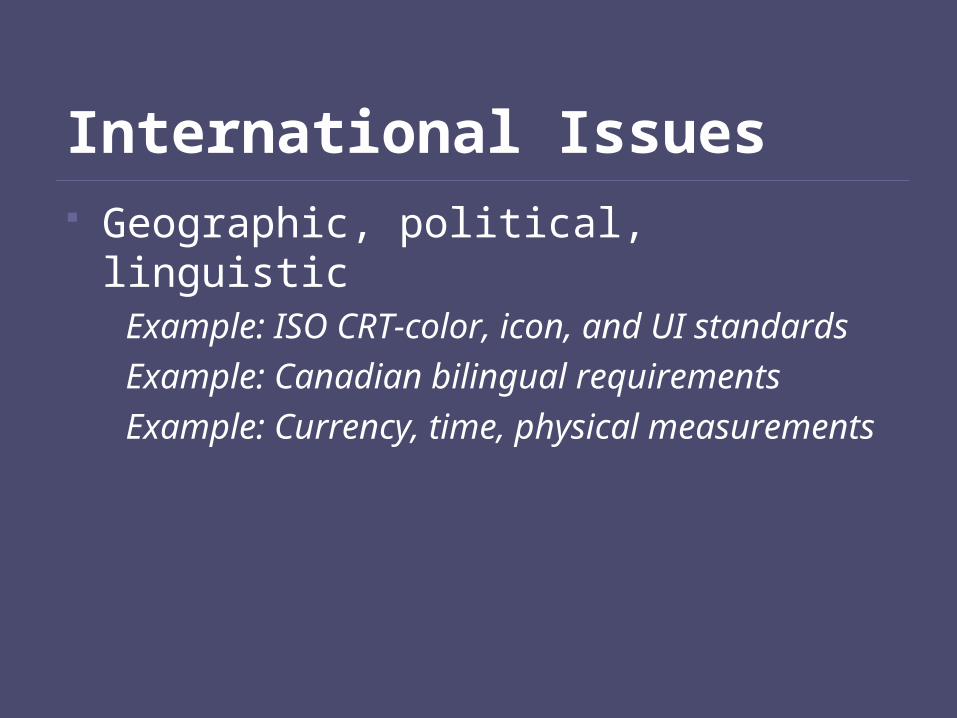
International Issues Geographic, political, linguistic
Example: ISO CRT-color, icon, and UI standards
Example: Canadian bilingual requirements
Example: Currency, time, physical measurements

Intercultural Issues Religious, historical, aesthetic:
Example: Calendars, the weekend = Thu/Fri in some Moslem states
Example: Color/type/signs/terms
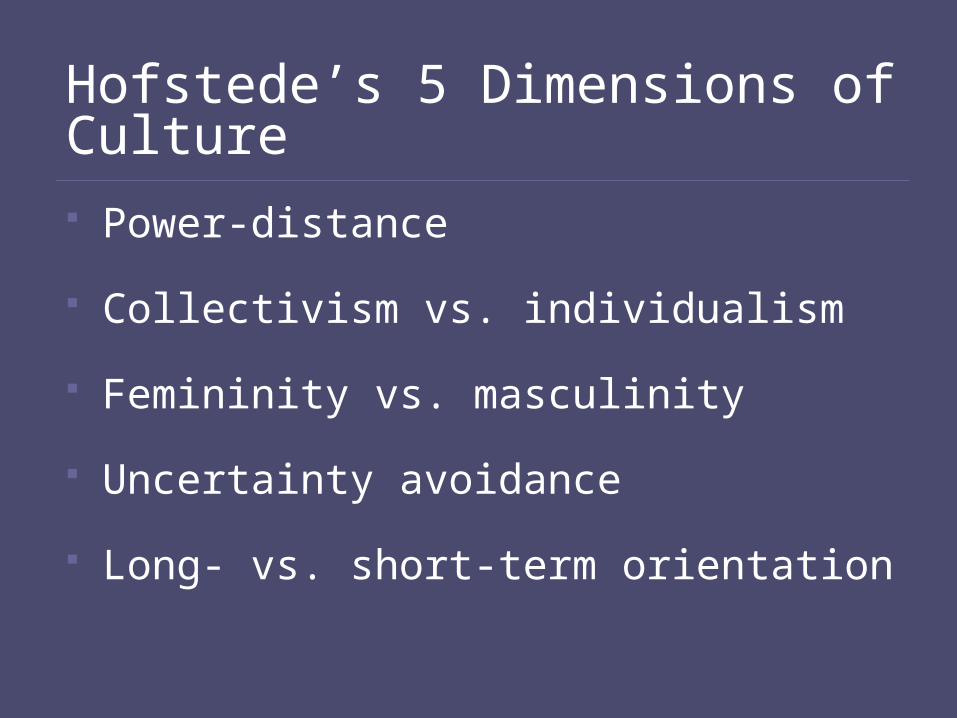
Hofstede’s 5 Dimensions of Culture
Power-distance
Collectivism vs. individualism
Femininity vs. masculinity
Uncertainty avoidance
Long- vs. short-term orientation
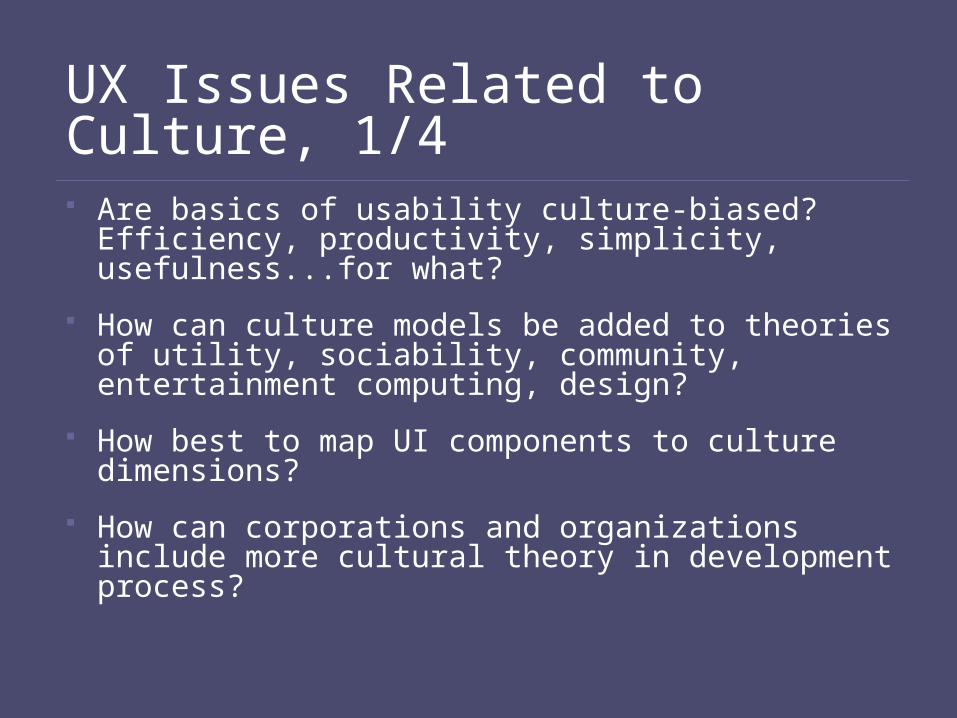
UX Issues Related to Culture, 1/4 Are basics of usability culture-biased? Efficiency,
productivity, simplicity, usefulness...for what?
How can culture models be added to theories of utility, sociability, community, entertainment computing, design?
How best to map UI components to culture dimensions?
How can corporations and organizations include more cultural theory in development process?

UX Issues Related to Culture, 2/4 Online training: Friend/guru? Tradition/skills?
Interaction styles: informal vs. formal, harmony vs. honesty, sincerity vs. scheming?
Content: challenging vs. feel-good?
Rewards: Money vs. group acclaim?
Conflict: Frequent vs. seldom? Chatroom flaming OK? Clashing opinions OK?

UX Issues Related to Culture, 3/4 Personal vs. group opinions? China:
“Personality”?
Shame vs. guilt: Personal Webcams, SMS OK?
Individual vs. collective cultures: role of community, chatroom behavior, hiring sites, coop work sites?
Management/training? Most for individual, not collective cultures, e.g., honesty and confrontation

UX Issues Related to Culture, 4/4 Work sites: Task vs. personal relation?
Different men, women sites/apps? Service orientation?
Role of advertising, hyperbole? Different in masculine vs. feminine cultures?
Gender differences for job sites: Careers? Interest in subject? Skills vs. contacts?
Culture difference: Activities outside the home?
Western vs. Eastern: Truth vs. virtue/practical?

Information Visualization
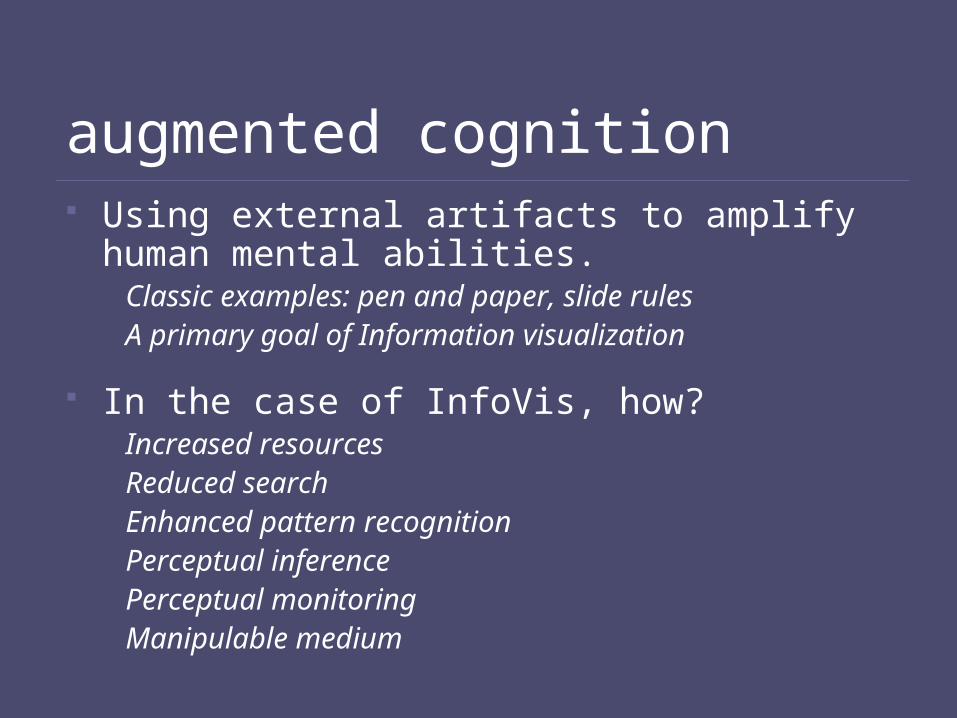
augmented cognition Using external artifacts to amplify human mental
abilities.Classic examples: pen and paper, slide rulesA primary goal of Information visualization
In the case of InfoVis, how?Increased resourcesReduced searchEnhanced pattern recognitionPerceptual inferencePerceptual monitoringManipulable medium

basic types of data elements Nominal
(no inherent order)city names, categories, ...
Ordinal(ordered, but not at measurable intervals)first, second, third, …cold, warm, hotMon, Tue, Wed, Thu …
Quantitative(ordered, with measurable distances)real numbers
Relations(relations between elements)NetworksHierarchical relationships (parent/child)

basic types of visual encodings “Retinal” properties
spatial position (e.g., x-y axes)sizeshapecolororientationtexture
“Gestalt” propertiesconnectivitygrouping (e.g., enclosure)
Animationview transitionsanimated elements

sensemaking tasks [Card et al] Information foraging
Collect information of interest
Search for schemaIdentify relevant dimensions of data
Instantiate schema (with data!)Schema == knowledge representationOrganize / codify information
Analysis (problem solving)Analyze and filter data, answer questionsRefine schema as needed
Record / communicateMake a decision, take action, or communicate results

interactive tasks [Shneiderman] Overview
Get an overview of the collection
ZoomZoom in on items of interest
FilterRemove uninteresting items
Details on demandSelect items and get details
RelateView relationships between items
HistoryKeep a history of actions for undo, replay, refinement
ExtractMake subcollections
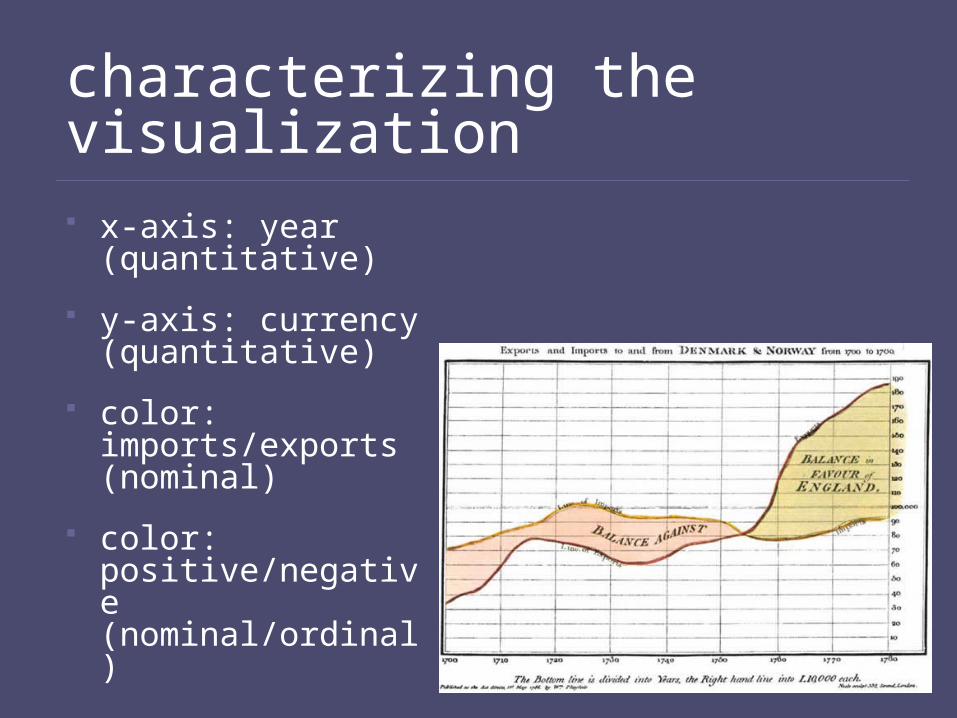
characterizing the visualization x-axis: year
(quantitative)
y-axis: currency (quantitative)
color: imports/exports (nominal)
color: positive/negative (nominal/ordinal)
infovis reference model
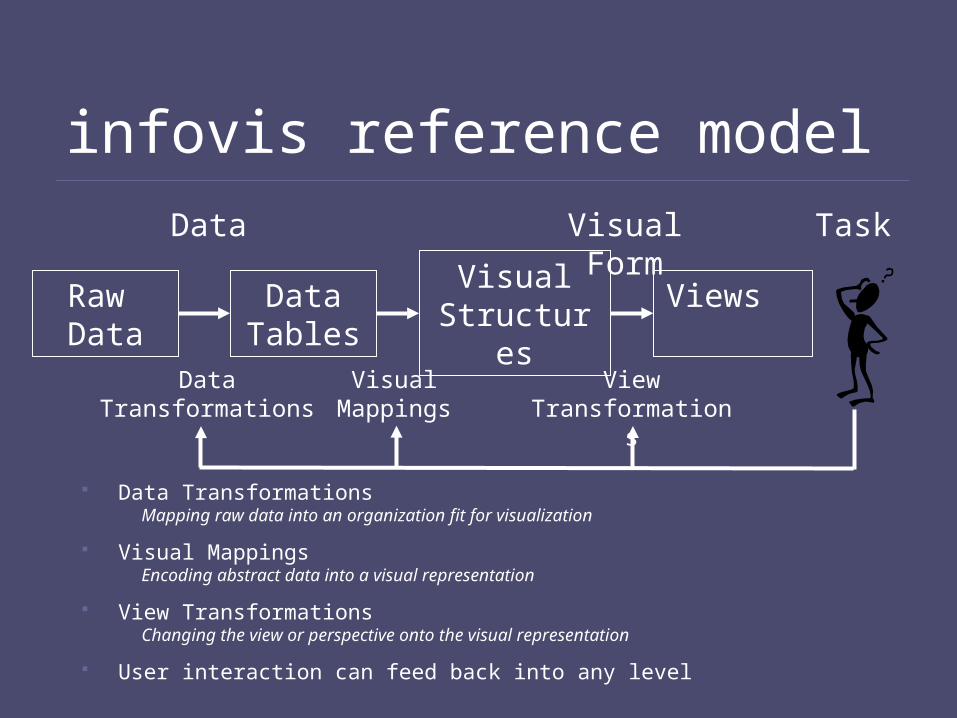
Data TransformationsMapping raw data into an organization fit for visualization
Visual MappingsEncoding abstract data into a visual representation
View TransformationsChanging the view or perspective onto the visual representation
User interaction can feed back into any level
Raw Data
Data Tables
Visual Structures
Views
Data Visual Form
Data Transformations
Visual Mappings
View Transformations
Task

Good Luck!