csfb global services conference - experian · 2 proprietary ownership of and access to vast...
TRANSCRIPT
CSFB Global Services Conference
Paul Brooks, CFO13 March 2007

1
1. Overview of Experian
2. Driving organic growth Decision AnalyticsInteractive
3. Summary and Q&A
Agenda
2
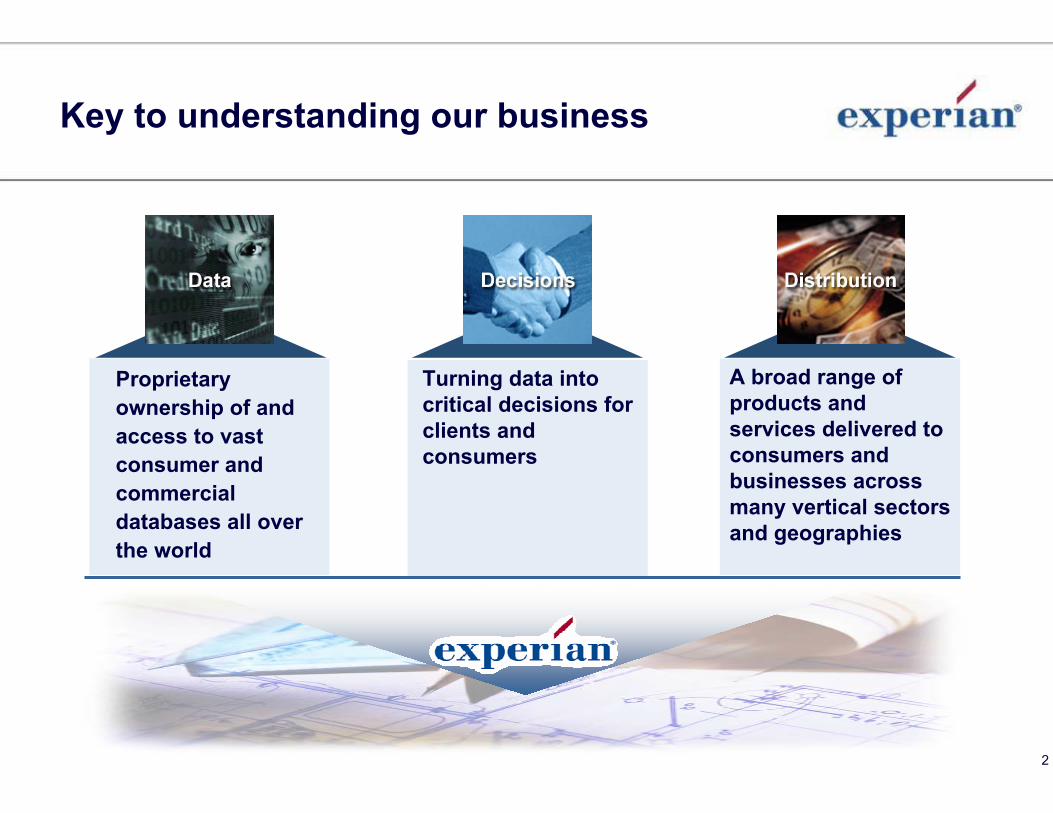
Proprietary ownership of and access to vast consumer and commercial databases all over the world
Turning data into critical decisions for clients and consumers
A broad range of products and services delivered to consumers and businesses across many vertical sectors and geographies
Key to understanding our business
3
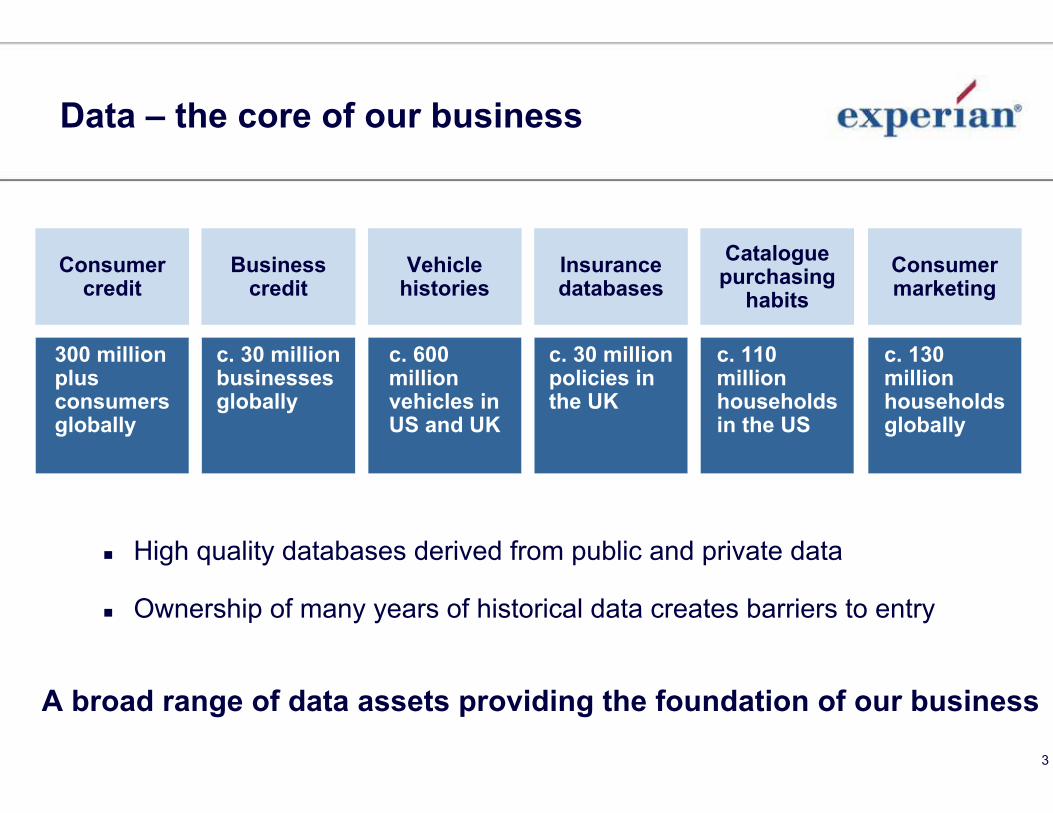
Data – the core of our business
300 million plus consumers globally
c. 30 million businesses globally
c. 600 million vehicles in US and UK
c. 30 million policies in the UK
c. 110 million households in the US
c. 130 million households globally
Consumercredit
Businesscredit
Vehiclehistories
Insurancedatabases
Cataloguepurchasing
habitsConsumermarketing
High quality databases derived from public and private data
Ownership of many years of historical data creates barriers to entry
A broad range of data assets providing the foundation of our business
4
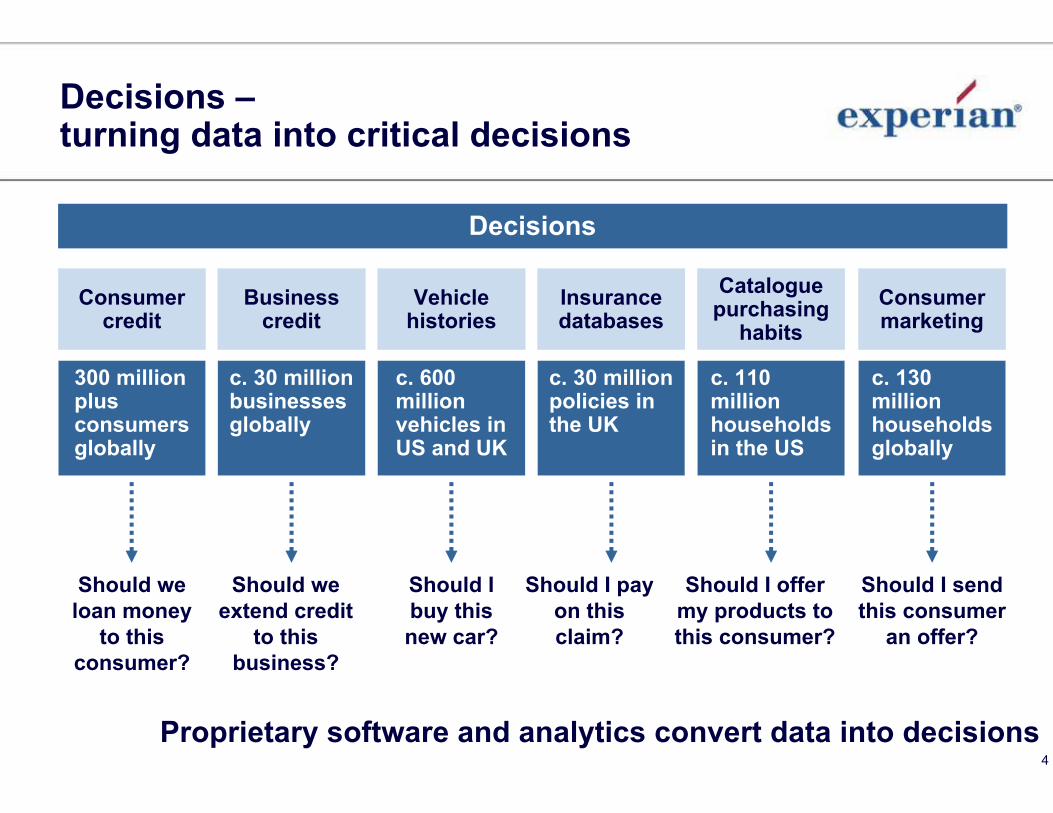
Decisions –turning data into critical decisions
Proprietary software and analytics convert data into decisions
Decisions
300 million plus consumers globally
c. 30 million businesses globally
c. 600 million vehicles in US and UK
c. 30 million policies in the UK
c. 110 million households in the US
c. 130 million households globally
Consumercredit
Businesscredit
Vehiclehistories
Insurancedatabases
Cataloguepurchasing
habitsConsumermarketing
Should weloan money
to this consumer?
Should weextend credit
to this business?
Should I send this consumer
an offer?
Should I buy this new car?
Should I pay on this claim?
Should I offer my products to this consumer?

5
Distribution – global and diversified offer
Not overly dependent on any one geography, sector or client
Consumers
Businesses
By
cust
omer FY06 revenue
88%
12%
FY06 revenue
By
clie
nt
Top 10
Next 40
Remainder
57%21%
22%B
y ge
ogra
phy FY06 revenue
Americas
UK & Ireland
EMEA / Asia-Pacific
25%58%
17%B
y se
ctor FY06 revenue
Financial services
Direct-to-consumer
Retail/home
shopping
Other
Publishing/mediaTelecom/utility/
insurance
AutomotiveGovernment
3%
55%
12%11%
7%6%3%
3%

6
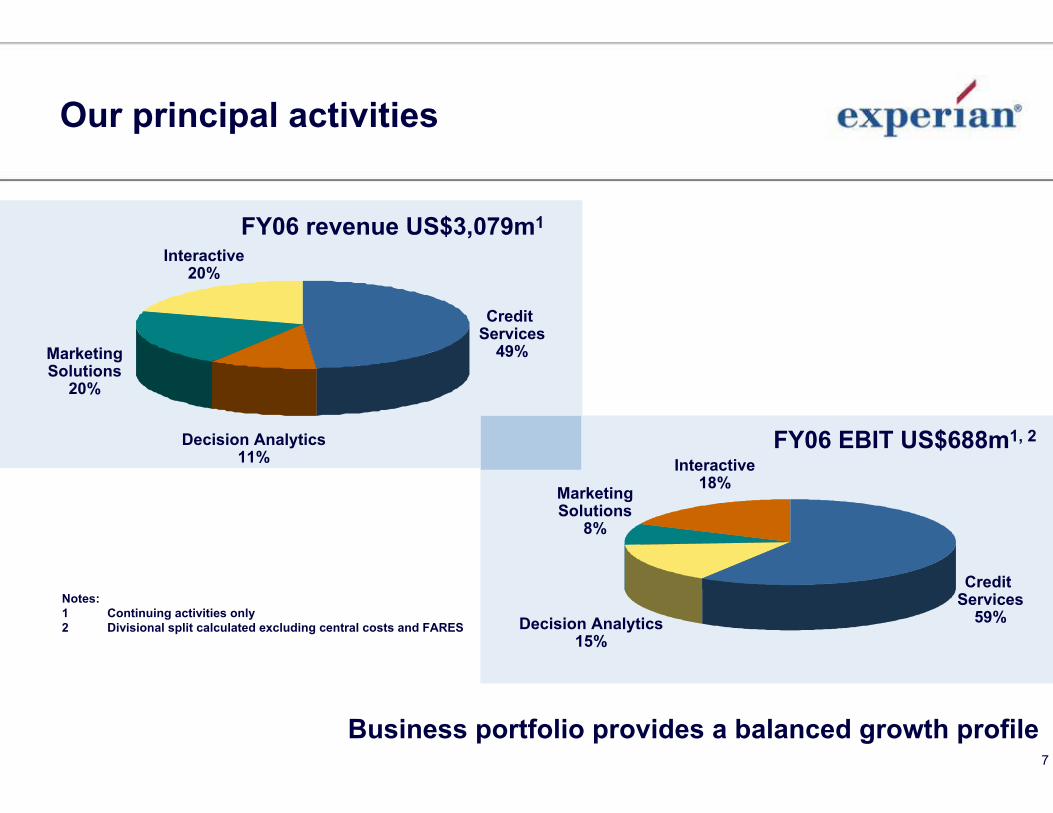
Our principal activities
Balanced growth portfolio
Experian averageorganic growth
2004-06Help clients lend profitably to businesses and consumers, maximising revenue and minimising risk
Help clients with specialist software and analytics to make business critical decisions in credit area
Help clients to acquire new customers and develop and manage relationships with existing customers
Help consumers connect with companies over the Internet to sell products from our clients or from Experian
Interactive
MarketingSolutions
DecisionAnalytics
CreditServices 7%
12%
6%
31%
7
Our principal activities
Business portfolio provides a balanced growth profile
Notes:1 Continuing activities only 2 Divisional split calculated excluding central costs and FARES
Credit Services
59%Decision Analytics15%
Interactive18%Marketing
Solutions8%
FY06 revenue US$3,079m1
Credit Services
49%
Decision Analytics11%
Interactive20%
MarketingSolutions
20%
FY06 EBIT US$688m1, 2

8
Operating in growth markets
0
50
100
150
200
1997 1998 1999 2000 2001 2002 2003 2004 2005
£bi
llion
2004–2009 CAGR 25%
0
500
1,000
1,500
2,000
2,500
3,000
3,500
2004 2005 2006E 2007E 2008E 2009E
US
$ b
illio
n
European e-commerce spending
2004–2009 CAGR 30%
0
500
1,000
1,500
2,000
2,500
3,000
3,500
2004 2005 2006E 2007E 2008E 2009E
US
$ b
illio
n
1997–2005 CAGR 11%
0
500
1,000
1,500
2,000
2,500
1997 1998 1999 2000 2001 2002 2003 2004 2005
US
$ bi
llion
Revolving Non-revolving
1997–2005 CAGR 7%
UK consumer credit outstandingUS consumer credit outstanding
US e-commerce spending
Global growth in consumer creditIncrease in Internet use by consumers and businessesIncrease in multi-channel marketingIncrease in demand from new vertical marketsIncrease in demand from new and emerging high growth geographies
9
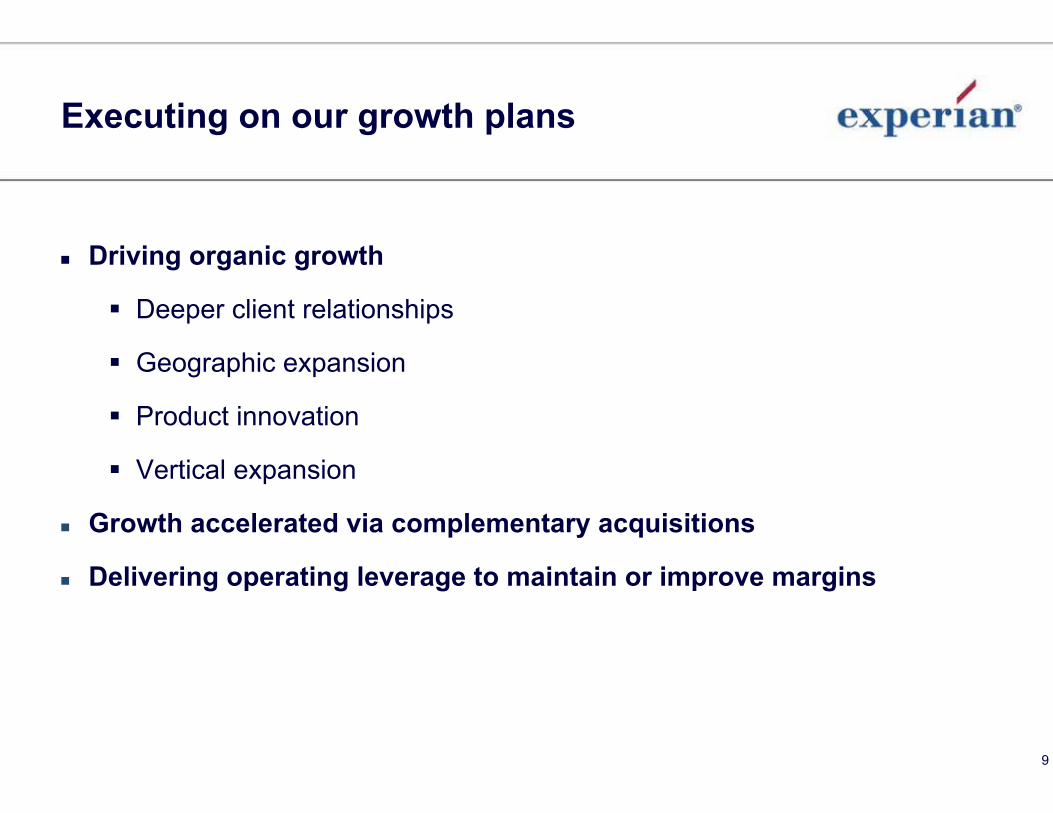
Executing on our growth plans
Driving organic growth
Deeper client relationships
Geographic expansion
Product innovation
Vertical expansion
Growth accelerated via complementary acquisitions
Delivering operating leverage to maintain or improve margins

10
Strong sales and profit growth
Notes:FY05 onwards under IFRSGlobal continuing revenue and EBIT onlyGrowth rates at constant currency and for continuing activities onlyFY07 excludes results from Metareward and UK account processing (included in all other years)
Revenue $m
2,014 2,461 3,079
+18% +27%Total growth
Organic growth
FY04 FY05 FY06
+9% +10%+17%+7%
H1 FY07
1,637
EBIT $m and margin
468 565 726
+17% +30%
21.3%19.6% 20.0%
FY04 FY05 FY06 H1 FY07
388
21.9%
+16%
11
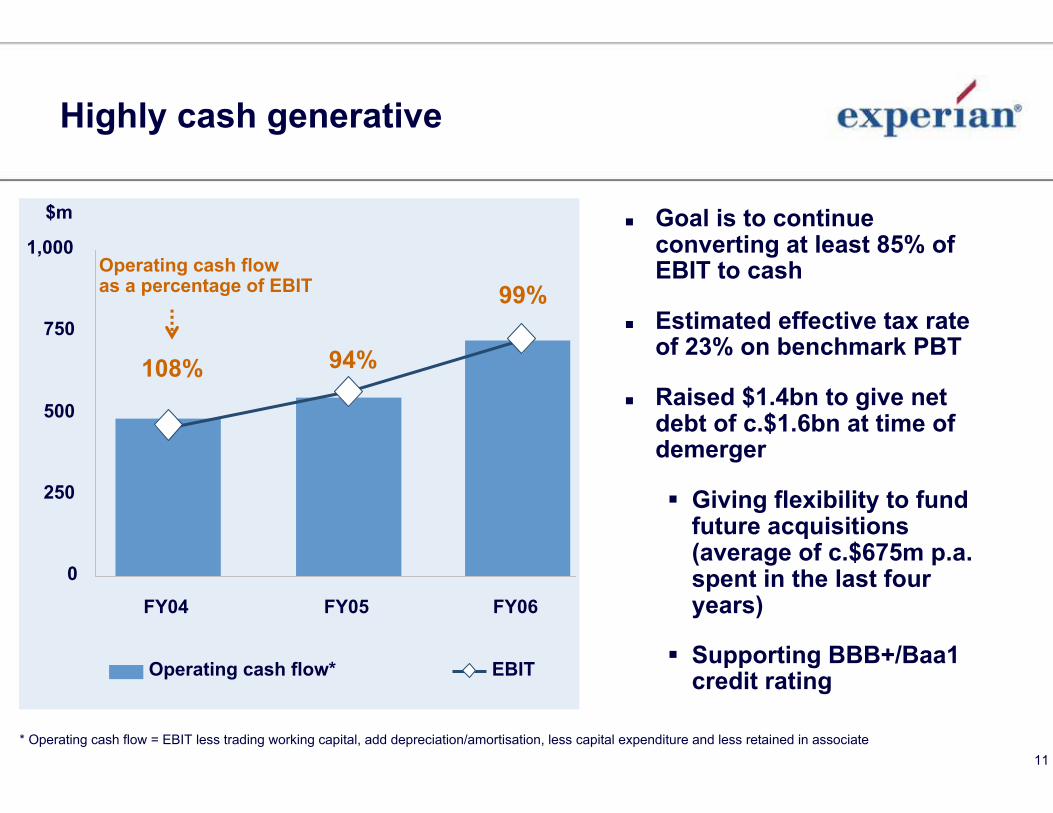
Highly cash generative
* Operating cash flow = EBIT less trading working capital, add depreciation/amortisation, less capital expenditure and less retained in associate
108% 94%
99%Operating cash flow as a percentage of EBIT
$m
0
250
500
750
1,000
FY04 FY05 FY06
Operating cash flow* EBIT
Goal is to continue converting at least 85% of EBIT to cash
Estimated effective tax rate of 23% on benchmark PBT
Raised $1.4bn to give net debt of c.$1.6bn at time of demerger
Giving flexibility to fund future acquisitions (average of c.$675m p.a. spent in the last four years)
Supporting BBB+/Baa1 credit rating
12
Driving organic growth
Decision Analytics
Interactive

13
FY06 revenue: US$325m, FY06 EBIT: US$102m
Decision Analytics
Fraud Solutions
Detection of fraud in the customer acquisition processMonitoring of account behaviour to detect fraudulent activityAnti-money laundering solutions
Decision Analytics – overview
Credit Analytics and
Decision Support Software
Strategic contribution to client’s businessAnalytics to predict customer behaviourApplication scoring, behavioural scoring and propensity modelsBespoke and customised software and hosted solutions to enable clients to implement customer strategies
Providing strategic input to our clients’ business

14
Decision Analytics – business model
BusinessoverviewBusinessoverview
Strategic contribution to client’s businessCredit risk and fraud management through predictive analytics, consultancy and software solutions
Key clients
Key clients
HSBC, ABN AMRO, Bank of America, Orange, Vodafone, Barclaycard, Kookmin, JCB, GE, Dell, Lloyds TSB, Citibank, Banco Santander
Value proposition / ROI saleMedium to long-term contractsStrong recurring revenue model
Revenuemodel
Revenuemodel
15
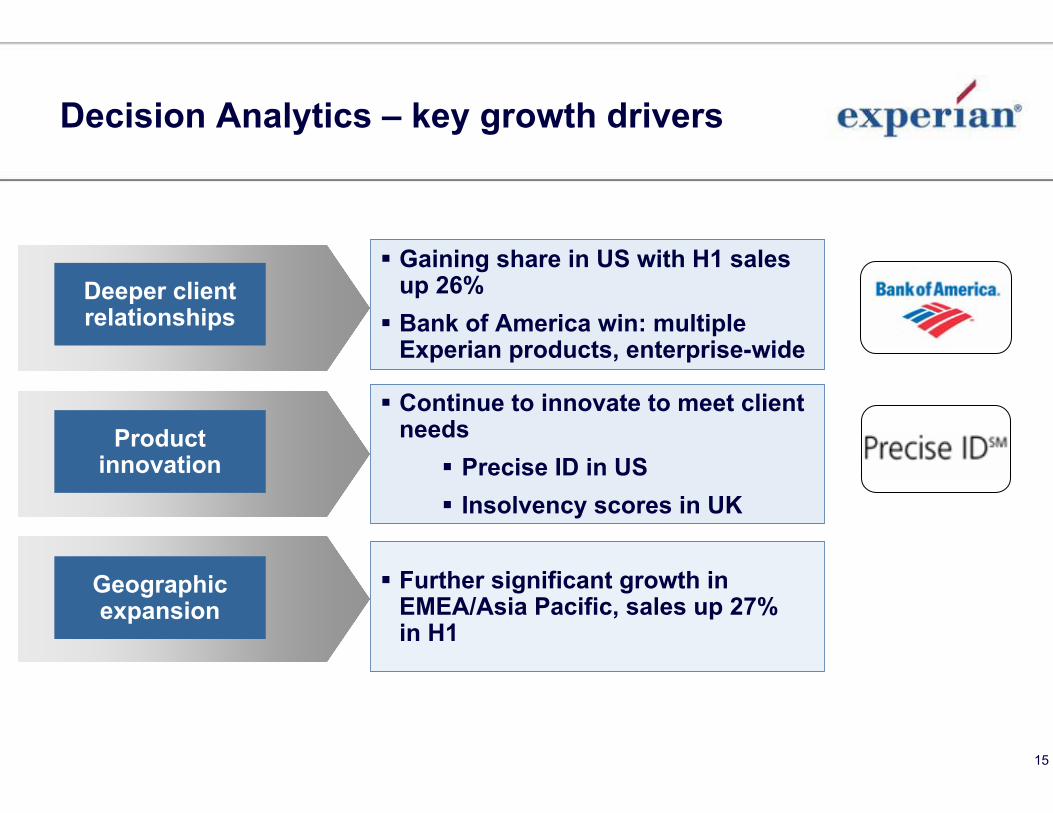
Decision Analytics – key growth drivers
Gaining share in US with H1 sales up 26%Bank of America win: multiple Experian products, enterprise-wide
Continue to innovate to meet client needs
Precise ID in USInsolvency scores in UK
Further significant growth in EMEA/Asia Pacific, sales up 27%in H1
Geographic expansion
Product innovation
Deeper client relationships
16
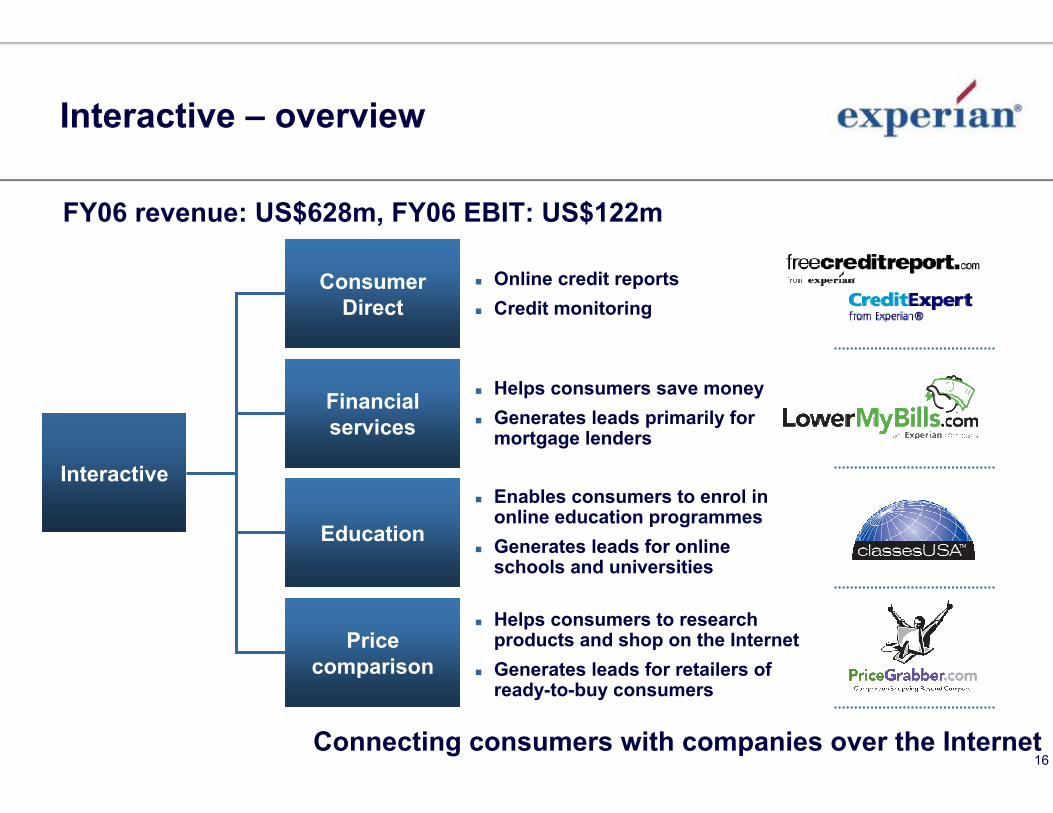
Interactive – overview
FY06 revenue: US$628m, FY06 EBIT: US$122m
Interactive
Pricecomparison
Financialservices
ConsumerDirect
Education
Online credit reportsCredit monitoring
Helps consumers save moneyGenerates leads primarily formortgage lenders
Enables consumers to enrol inonline education programmesGenerates leads for online schools and universities
Helps consumers to researchproducts and shop on the InternetGenerates leads for retailers ofready-to-buy consumers
Connecting consumers with companies over the Internet

17
Interactive business model –our competitive advantage
Connecting consumers with businesses, maximising client returns on marketing spend
Experian data assets
Experian modelling
and analytics
Customer acquisition channels
BroadcastOrganictraffic
Search listings Partners Affiliates
Consumers
Businesses
Experian products
Customer monetisation
Lead generation

18
Interactive – key growth drivers
Secular channel switch to Internet continuesImproving retention in Consumer DirectImproving conversion rates in lead generation
Driving synergies within Interactive and within Experian
Using scale and expertise to increase returns from customer acquisition spend
Success of UK CreditExpert Increasing investment in PriceGrabber UK
Geographic expansion
Operating leverage
Driving organic growth

19
Experian –the global leader in information solutions

20
Disclaimer
This presentation is being made only to, and is only directed at, persons to whom this presentation may lawfully be communicated(“relevant persons”). Any person who is not a relevant person should not act or rely on this presentation or any of its contents.
Information in this presentation relating to the price at which relevant investments have been bought or sold in the past or the yield on such investments cannot be relied upon as a guide to the future performance of such investments. This presentation does not constitute an offering of securities or otherwise constitute an invitation or inducement to any person to underwrite, subscribe for or otherwise acquire securities in any company within the Experian group (the “Group”).
The presentation contains forward-looking statements which are subject to risks and uncertainties because they relate to future events. These risks and uncertainties may cause actual results to differ from any expected future events or events referred to in the forward looking statements.
The presentation also contains certain non-GAAP financial information. The Group’s management believe these measures provide valuable additional information in understanding the performance of the Group or the Group’s businesses because they provide measures used by the Group to assess performance. Although these measures are important in the management of the business, they should not be viewed as replacements for, but rather as complementary to, the GAAP measures.