csr limited annual report 2015
TRANSCRIPT

CSR LIMITED ANNUAL REPORT 2015
CS
R LIM
ITED AN
NU
AL REPO
RT 2015

CONTENTS2 Financial Overview and Key Facts4 Chairman’s Report6 Managing Director’s Review8 Building Products Overview10 Viridian Overview11 Aluminium Overview12 Property Overview13 Community and Sustainability14 Board of Directors16 Corporate Governance23 Remuneration Report40 Directors’ Report43 Financial Report93 Directors’ Declaration94 Independent Auditor’s Report96 Shareholder Information
SMARTER, FASTER, EASIER Delivering building solutions to make it easier and faster to use our products and reduce construction complexity
STRENGTHEN AND INVESTInvesting in our people and our business by developing our brands, improving the efficiency of our operations and expanding distribution networks
CUSTOMERS Ensuring we continue to invest in our relationship with our customers and use our people and systems to enhance their experience with CSR

CSR ANNUAL REPORT 2015 1PB CSR ANNUAL REPORT 2015CSR ANNUAL REPORT 2015
1
COMFORT Improving the comfort, quality and efficiency of buildings with higher performing materials and systems
INFLUENCING DESIGN Influencing design so we adapt to the changing landscape of higher density living, changing family circumstances and flexible working arrangements
CHANGING THE WAY WE BUILD
The way we live and work is changing rapidly and this impacts the homes and buildings we build. CSR is working with people designing, constructing and occupying different types of buildings so we can develop and source solutions
to help change the way we build.

CSR ANNUAL REPORT 2015 32 CSR ANNUAL REPORT 2015
FINANCIAL OVERVIEW AND KEY FACTS
CSR has delivered a substantial lift in our full year net profit to the highest level in five years
OVERVIEW – KEY HIGHLIGHTS• Trading revenue of $2.0 billion up 16% for the year ended
31 March 2015
• EBITDA1 of $313.2 million up 55% reflecting higher earnings across all businesses
• EBIT1 of $235.4 million up 87%
– Building Products EBIT of $120.9 million up 31% with strong volume growth across all products reflecting increasing construction activity, strong performances from recent acquisitions and cost containment
– Viridian EBIT of $3.1 million, significantly up on the EBIT loss of $14.9 million last year with higher volumes and pricing improving margins across smaller operating base
– Aluminium EBIT of $104.3 million up 101% due to higher realised A$ aluminium prices and improved smelter performance
– Property EBIT of $30.2 million up from $17.3 million following settlement of three major transactions
• Net profit after tax (pre significant items)1 of $146.5 million up 82%
• Statutory net profit of $125.5 million up 43%, with the prior year benefiting from a $33.0 million (pre tax) reduction in asbestos liabilities
• Earnings per share1 29.1 cents up from 16.0 cents
• Final dividend of 11.5 cents per share bringing the full year dividend to 20.0 cents, up 100%
• Strong financial position maintained with net cash at year end of $68.4 million
1 All references are pre significant items. They are non-IFRS measures and are used internally by management to assess the performance of the business and have been extracted or derived from CSR’s financial statements for the year ended 31 March 2015 (YEM15). All comparisons are to the year ended 31 March 2014 (YEM14) unless otherwise stated.
TRADING REVENUE
$2,023.4mEBIT BEFORE SIGNIFICANT ITEMS
$235.4m16% 87 %
NET PROFIT AFTER TAX BEFORE SIGNIFICANT ITEMS
$146.5mSTATUTORY NET PROFIT AFTER TAX
$125.5m82% 43%
EARNINGS PER SHARE BEFORE SIGNIFICANT ITEMS
29.1cFULL YEAR DIVIDEND
20.0c82% 100%

CSR ANNUAL REPORT 2015 32 CSR ANNUAL REPORT 2015
2013
2014 4.5
2015 3.1
4.2
2011 5.4
2012 5.1
0.00 1.35 2.70 4.05 5.40
LOST TIME INJURY FREQUENCY RATEYEAR ENDED 31 MARCH (PER MILLION WORK HOURS)
2013
2014 17.7
2015 13.8
17.5
2011 27.4
2012 25.6
0.00 6.85 13.70 20.55 27.40
TOTAL RECORDABLE INJURY FREQUENCY RATE YEAR ENDED 31 MARCH (PER MILLION WORK HOURS)
2013
2014 92.6
77.4
2011 103.8
2012 86.9
0.000 30.225 60.450 90.675 120.900
2015 120.9
BUILDING PRODUCTS EBITYEAR ENDED 31 MARCH ($ MILLION)
2013
2014 51.9
2015 104.3
50.3
2011 111.9
2012 80.5
0.000 27.975 55.950 83.925 111.900
ALUMINIUM EBITYEAR ENDED 31 MARCH ($ MILLION)
2013
2014(14.9)
2015 3.1
(38.8)
2011 3.6
2012(19.3)
-38.800000-33.933333-29.066667-24.200000-19.333333-14.466667-9.600000-4.7333330.1333335.000000
VIRIDIAN EBITYEAR ENDED 31 MARCH ($ MILLION)
2013
2014 17.3
2015 30.2
0
2011 14.6
2012 24.4
0.00 7.55 15.10 22.65 30.20
PROPERTY EBITYEAR ENDED 31 MARCH ($ MILLION)
FIVE YEAR PERFORMANCEYEAR ENDED 31 MARCH ($ MILLION) UNLESS STATED 2015 2014a 2013a,b 2012a 2011a
Operating results Trading revenue 2,023.4 1,746.6 1,682.4 1,801.9 1,913.6
Earnings before interest and tax (EBIT)Building Products 120.9 92.6 77.4 86.9 103.8 Viridian 3.1 (14.9) (38.8) (19.3) 3.6 Aluminium 104.3 51.9 50.3 80.5 111.9 Property 30.2 17.3 – 24.4 14.6
Segment total 258.5 146.9 88.9 172.5 233.9 Corporatec (18.0) (15.7) (13.8) (15.3) (19.0)Restructuring and provisions (5.1) (5.5) (7.0) (0.5) (2.9)
CSR EBIT (before significant items) 235.4 125.7 68.1 156.7 212.0Net profit after tax (before significant items) 146.5 80.5 41.4 104.1 103.4 Net profit (loss) after tax (after significant items) 125.5 88.1 (150.0) 76.3 (78.0)
Financial position Total equity 1,206.0 1,157.2 1,086.6 1,278.7 1,281.3 Total assets 2,119.3 2,008.3 2,032.7 2,245.5 2,258.2 Net (cash) debt (68.4) 28.5 25.1 (55.7) (139.1)
Key data per share Earnings before significant items (cents) 29.1 16.0 8.2 20.6 20.4 Earnings after significant items (cents) 24.9 17.5 (29.6) 15.1 (15.4)Dividend (cents) 20.0 10.0 5.1 13.0 14.3d Payout ratio (%) 69.1 62.9 62.4 63.2 70.0
Key measures Profit margin (EBIT/trading revenue) (%) 11.6 7.2 4.0 8.7 11.1 Return on funds employed (ROFE) (%)e 18.4 9.9 5.0 10.4 13.5Gearing at 31 March (%)e (net debt/net debt plus equity) n/a 2.4 2.3 n/a n/a Employees (number of people employed) 3,134 2,985 3,218 3,582 3,925
a On 1 April 2014, CSR Limited adopted a change of accounting policy over the classification of the discount unwind for the asbestos liability, resulting in a restatement of balances for the financial year ended 31 March 2014 and the other comparative years disclosed in the table above.
b On 1 April 2013, CSR Limited adopted AASB 119 Employee Benefits (revised), resulting in a change of accounting policy and a restatement of balances for the financial year ended 31 March 2013.
c Represents unallocated overhead and other revenues.d Interim dividend restated for the 3:1 share consolidation completed on 3 March 2011 and excludes special dividend of 9.1 cents.e ROFE is calculated as EBIT before significant items for the 12 months to 31 March divided by average funds employed which excludes cash, tax balances
and certain other non-trading assets and liabilities as at 31 March.

CSR ANNUAL REPORT 2015 54 CSR ANNUAL REPORT 2015
CHAIRMAN’S REPORT
Reflecting on a successful year
BY ANY MEASURE, CSR ENJOYED A SUCCESSFUL YEAR. HOUSING ACTIVITY WAS BUOYANT, ALUMINIUM PRICES IMPROVED, VIRIDIAN RETURNED TO PROFITABILITY AND THE EXCHANGE RATE MOVEMENT WAS FAVOURABLE.
Most important of all, however, was that the business was run well, on the back of the positive macro environment.
The company’s management team continued to pursue its strategy of capitalising on the upswing in demand for building products from a lower cost base, and strengthening its business through innovation, strategic acquisitions and joint ventures, the most important of which being our recently completed east coast bricks joint venture with Boral.
All divisions delivered improved earnings contributing to our highest profit in five years. Net profit after tax (before significant items) was up 82% year on year to $146.5 million and our statutory profit of $125.5 million was up 43%. Importantly, our overall long term asbestos liabilities reduced, driven by a reduction in our US$ provision by 47% from its peak three years ago. This is reflected in the company’s determination to treat all claimants equitably, whether Australian or US residents.
The continuation of the turnaround at Viridian merits particular mention. Last year, we said that our plan was to return to profitability this year and we achieved this. Of course, we still have a long way to go to deliver an acceptable return on the capital we have employed in Viridian but its management has achieved this year’s goal and has clearly defined plans to continue the improvement.
Our new bricks joint venture with Boral was another milestone and was brought about by the company’s management adhering to its plan to achieve an acceptable return on assets across all of our divisions. This joint venture will result in cost savings, footprint benefits and release high-value land assets for development in the future.
JEREMY SUTCLIFFE CHAIRMAN

CSR ANNUAL REPORT 2015 54 CSR ANNUAL REPORT 2015
The Tomago aluminium smelter, in which CSR has a 25.2% interest, performed very well at an operational level which, when combined with higher aluminium prices (inclusive of ingot premiums), resulted in a strong result.
We remain mindful, however, that aluminium prices can be volatile and are largely out of the control of the company and that negotiations with Macquarie Generation in relation to the increase in electricity tariffs from 2017 are not yet concluded. These factors can have a material impact on earnings going forward.
DIVIDENDSOur dividend policy is based on payment of dividends between 60-80% of full year net profit after tax (before significant items). This ensures that as CSR’s earnings improve, shareholders will benefit through higher dividends. Following the significant increase in earnings, we have resolved to pay a final, unfranked dividend of 11.5 cents per share on 7 July 2015.
This brings the unfranked full year dividend to 20.0 cents per share, doubling the dividend from the previous year and represents a dividend payout ratio of 69% of net profit after tax (before significant items).
The company’s dividend reinvestment plan (DRP) will operate for the final dividend. Further details of the DRP are available on our website (www.csr.com.au).
PROGRESS ON OUR STRATEGYThe changes in the construction market are creating a number of opportunities for CSR to grow our building products businesses. Over the last 18 months, we have acquired AFS and Martini which increase our exposure to multi-residential and commercial construction, while investing in our own research to develop building systems which reduce construction time and complexity.
Over the near term, we will continue to invest in initiatives aligned to our core businesses and have identified a number of smaller capital investments in structural systems and offsite construction which will enable us to grow into these new markets.
We are also developing acoustic solutions in both glass and insulation and investing in commercial glass double glazing capacity. As construction markets continue to change, these investments are positioning us well for the future.
Our financial position remains strong with net cash of $68.4 million as of 31 March 2015 and we are well placed to seize further acquisition opportunities as they arise.
CSR PEOPLEThanks go to all of our employees, both here in Australia and in New Zealand. And finally I would like to acknowledge our management team. Starting with a 31% reduction in lost time injuries this year, right through all aspects of the business, they have performed admirably. Their work developing the culture of the organisation in particular, sets us apart from our competitors and is to be commended.
Thanks as well, to you the shareholders, for your ongoing support.
JEREMY SUTCLIFFE CHAIRMAN
The substantial lift in full year net profit to the highest level in five years reflects strong performance from all divisions
43% LIGHTWEIGHT SYSTEMS
15% BRICKS AND ROOFING
14% VIRIDIAN
26% ALUMINIUM
2% PROPERTY
TOTAL REVENUEYEAR ENDED 31 MARCH 2015
CSR ANNUAL REPORT 2015 76 CSR ANNUAL REPORT 2015
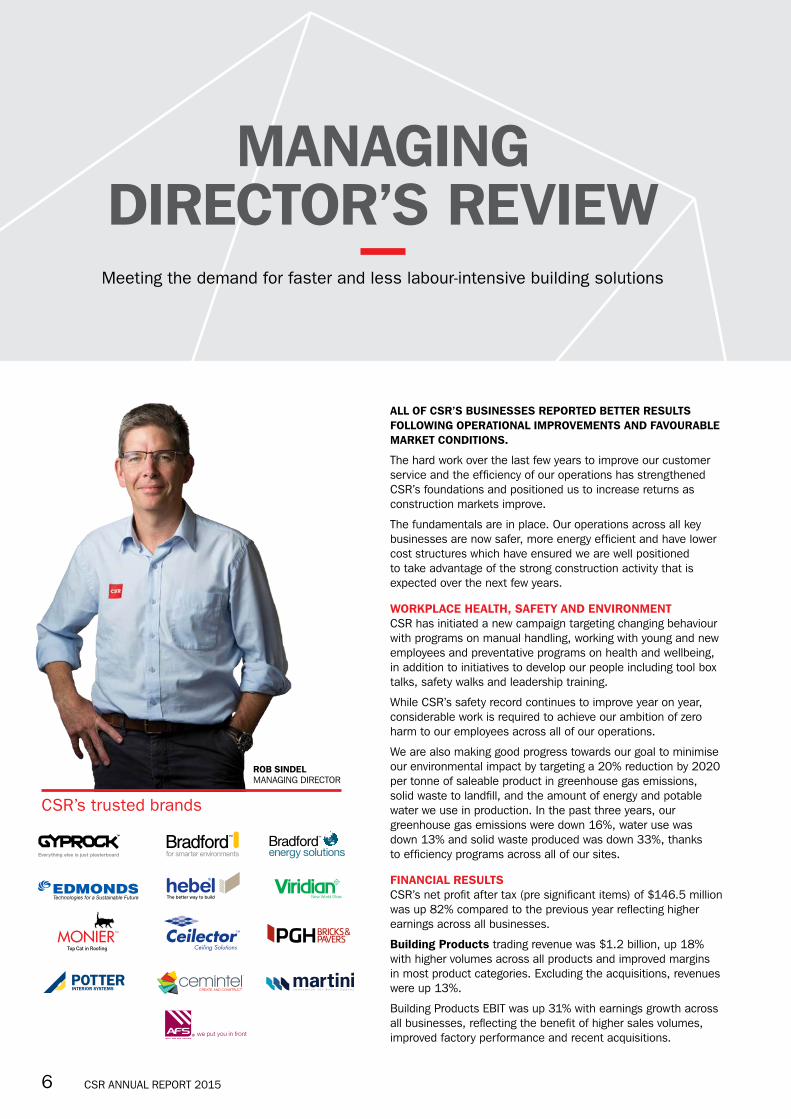
MANAGING DIRECTOR’S REVIEW
Meeting the demand for faster and less labour-intensive building solutions
ALL OF CSR’S BUSINESSES REPORTED BETTER RESULTS FOLLOWING OPERATIONAL IMPROVEMENTS AND FAVOURABLE MARKET CONDITIONS.
The hard work over the last few years to improve our customer service and the efficiency of our operations has strengthened CSR’s foundations and positioned us to increase returns as construction markets improve.
The fundamentals are in place. Our operations across all key businesses are now safer, more energy efficient and have lower cost structures which have ensured we are well positioned to take advantage of the strong construction activity that is expected over the next few years.
WORKPLACE HEALTH, SAFETY AND ENVIRONMENTCSR has initiated a new campaign targeting changing behaviour with programs on manual handling, working with young and new employees and preventative programs on health and wellbeing, in addition to initiatives to develop our people including tool box talks, safety walks and leadership training.
While CSR’s safety record continues to improve year on year, considerable work is required to achieve our ambition of zero harm to our employees across all of our operations.
We are also making good progress towards our goal to minimise our environmental impact by targeting a 20% reduction by 2020 per tonne of saleable product in greenhouse gas emissions, solid waste to landfill, and the amount of energy and potable water we use in production. In the past three years, our greenhouse gas emissions were down 16%, water use was down 13% and solid waste produced was down 33%, thanks to efficiency programs across all of our sites.
FINANCIAL RESULTSCSR’s net profit after tax (pre significant items) of $146.5 million was up 82% compared to the previous year reflecting higher earnings across all businesses.
Building Products trading revenue was $1.2 billion, up 18% with higher volumes across all products and improved margins in most product categories. Excluding the acquisitions, revenues were up 13%.
Building Products EBIT was up 31% with earnings growth across all businesses, reflecting the benefit of higher sales volumes, improved factory performance and recent acquisitions.
ROB SINDEL MANAGING DIRECTOR
CSR’s trusted brands
CSR ANNUAL REPORT 2015 76 CSR ANNUAL REPORT 2015
EBIT was also impacted by planned shutdowns at the Schofields and Horsley Park brick facilities to deliver efficiency improvements, as well as further investment in new brick products.
EBIT margin increased by one percentage point to 10.0%. Profitability also improved in the second half of the year with EBIT margins increasing 1.6 percentage points to 9.6% year on year as improved volume, pricing and product mix took effect.
Viridian’s trading revenue of $279.3 million was up 7% from $262.0 million following the benefit of pricing initiatives and higher volumes driven by market demand. Viridian recorded a positive EBIT of $3.1 million, a significant improvement on the EBIT loss of $14.9 million in the prior year. The return to profitability is ahead of schedule following restructuring initiatives launched in March 2013 which included improved utilisation of the float glass manufacturing facility at Dandenong in Victoria. New Zealand operations also improved driven by strong construction activity and operational improvement initiatives.
In Aluminium, sales volumes of 202,423 tonnes were 3% higher as productivity improvements drove increased production at Tomago. Trading revenue of $532.9 million was up 17%, reflecting the increased sales volumes and higher realised prices, including the effects of hedging and premiums. EBIT of $104.3 million was up 101%, with the EBIT margin improving to 19.6% from 11.4%.
Property recorded EBIT of $30.2 million up from $17.3 million in the previous year. The result includes the first tranche of the sale of the multi-residential development site at New Lynn located southwest of Auckland completed in December 2014. The result also includes the sale of sites at Pyrmont and surplus industrial land at Ingleburn in Sydney, both of which completed in the first half of the year.
OUTLOOKIn Building Products, building approval levels for detached and multi-residential housing remain strong. This is expected to lead to increased demand for CSR’s products across detached and multi-residential segments. From YEM16 onwards, the results will include the consolidated earnings from the Boral CSR Bricks JV which began operations on 1 May 2015.
Having returned Viridian to profitability and restructured the business to focus on key market segments, management is targeting new opportunities for revenue growth – particularly in residential performance and the commercial and architectural design markets. This will require modest levels of investment in capital and customer service initiatives over the next two to three years, which should be more than offset by improved market activity and growth in higher-margin products.
In Aluminium, Gove Aluminium Finance (GAF) – in which CSR has a 70% stake – continues to increase its hedge book when pricing opportunities arise, with 59% of net sales for YEM16 currently hedged at an average price of A$2,311 per tonne (before premiums).
We have seen increased volatility in premiums in recent months as a result of increased exports from China and lower LME inventories. For the first quarter of CSR’s current financial year (YEM16), premiums declined by approximately 11% (Platts Main Japan Port premium) for the quarter to US$380 per tonne. Spot prices for premiums have fallen further in recent weeks.
Conversely, LME pricing has strengthened recently, with the US dollar cash LME aluminium price increasing by US$154 per tonne during the month of April 2015.
Property earnings are always subject to timing of completion of transactions. The formation of the Boral CSR Bricks JV provides additional opportunities for development of selected high-value land assets over the next five to ten years.
In summary, CSR expects to make further progress this year as we build on our strategy to invest in growth opportunities that accelerate the construction process while improving the comfort and performance of buildings.
ROB SINDEL MANAGING DIRECTOR
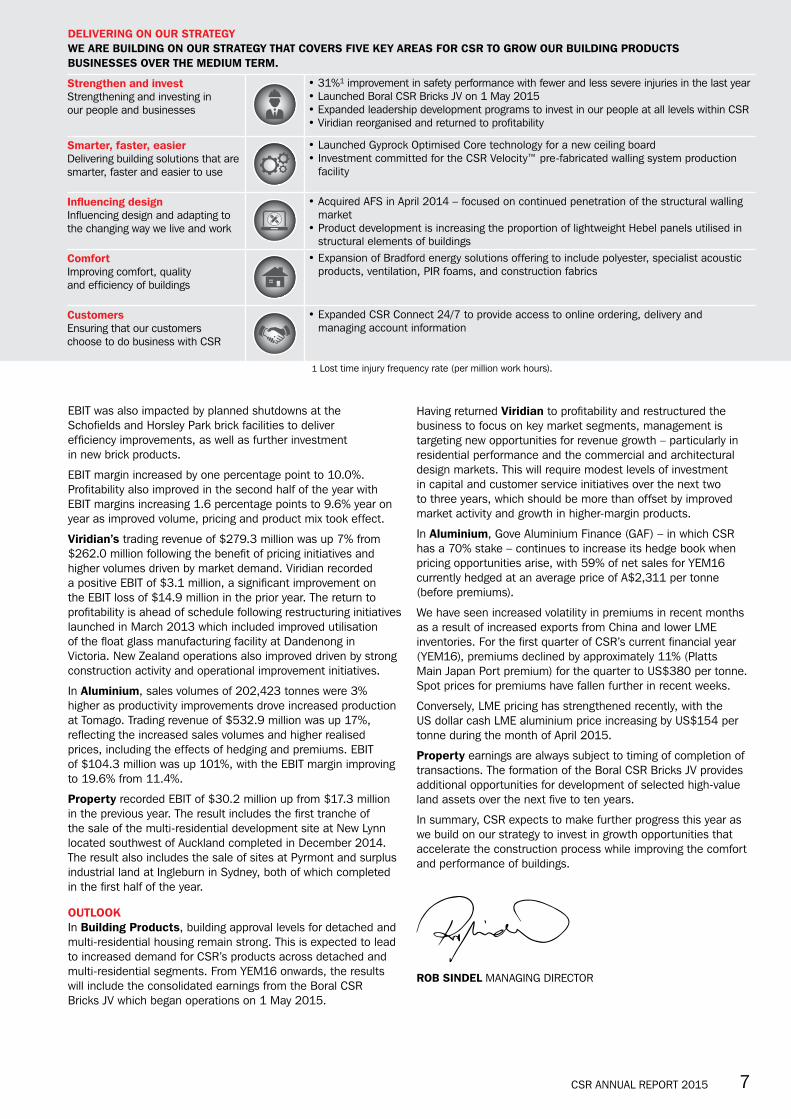
1 Lost time injury frequency rate (per million work hours).
Strengthen and investStrengthening and investing in our people and businesses
• 31%1 improvement in safety performance with fewer and less severe injuries in the last year• Launched Boral CSR Bricks JV on 1 May 2015• Expanded leadership development programs to invest in our people at all levels within CSR• Viridian reorganised and returned to profitability
Smarter, faster, easierDelivering building solutions that are smarter, faster and easier to use
• Launched Gyprock Optimised Core technology for a new ceiling board• Investment committed for the CSR Velocity™ pre-fabricated walling system production
facility
Influencing designInfluencing design and adapting to the changing way we live and work
• Acquired AFS in April 2014 – focused on continued penetration of the structural walling market
• Product development is increasing the proportion of lightweight Hebel panels utilised in structural elements of buildings
ComfortImproving comfort, quality and efficiency of buildings
• Expansion of Bradford energy solutions offering to include polyester, specialist acoustic products, ventilation, PIR foams, and construction fabrics
CustomersEnsuring that our customers choose to do business with CSR
• Expanded CSR Connect 24/7 to provide access to online ordering, delivery and managing account information
DELIVERING ON OUR STRATEGYWE ARE BUILDING ON OUR STRATEGY THAT COVERS FIVE KEY AREAS FOR CSR TO GROW OUR BUILDING PRODUCTS BUSINESSES OVER THE MEDIUM TERM.

CSR ANNUAL REPORT 2015 98 CSR ANNUAL REPORT 2015
BUILDING PRODUCTS OVERVIEW
Higher volumes and improved pricing lift earnings
RESIDENTIAL CONSTRUCTION COMMENCEMENTS CONTINUED TO GROW STRONGLY ACROSS BOTH DETACHED AND MULTI-RESIDENTIAL SECTORS.
All state activity increased in the period, with New South Wales and Queensland experiencing sustained growth and Victoria continuing its steady recovery. Multi-residential activity continues to increase as a percentage of total dwellings and now represents over 40% of housing activity.
Non-residential and renovations activity remains largely subdued. A contraction in social projects has been offset by some recovery in commercial activity.
Building Products trading revenue was $1.2 billion, up 18% with higher volumes across all products and improved margins in most product categories. Excluding acquisitions, revenues were up 13%.
EBIT was up 31% with earnings growth across all businesses, reflecting the benefit of higher sales volumes, improved factory performance and recent acquisitions. EBIT was also impacted by planned shutdowns at the Schofields and Horsley Park brick facilities to deliver efficiency improvements, as well as further investment in new brick products. EBIT margin increased by one percentage point to 10.0%. Profitability also improved in the second half of the year with EBIT margins increasing 1.6 percentage points to 9.6% year on year as improved volume, pricing and product mix took effect.
BRICKS AND ROOFINGBricks and Roofing includes PGH™ Bricks, Monier™ Roofing, MonierPrime™ and NZ Brick Distributors.
In PGH Bricks, earnings increased as the business benefited from volume growth from the three major regions where PGH operates in Queensland, New South Wales and South Australia.
Margins improved following a lift in volumes supported by ongoing production efficiencies, despite reduced plant availability during recent months to deliver efficiency improvements at Schofields and Horsley Park.
Earnings in Monier Roofing were higher with increased volumes reflecting increased demand from the detached housing market across all states with modest pricing gains and improved factory performance.
CASE STUDY
EAST COAST BRICKS JV LAUNCHED WITH BORALOn 1 May 2015, the Australian east coast brick joint venture Boral CSR Bricks Pty Limited began trading with annual production capacity in excess of 600 million standard bricks across 12 manufacturing operations. The formation of the bricks joint venture is an important step to ensure the longer term competitiveness of the combined brick businesses while delivering the best of both businesses to our customers. Initial overhead savings of $7-$10 million per annum are expected following the integration of the two businesses over the next 12 months.
2013
2014 284.1
271.7
2011 286.6
2012 255.7
0.0 78.2 156.4 234.6 312.8
2015 312.8
BRICKS AND ROOFING REVENUEYEAR ENDED 31 MARCH ($ MILLION)
AUSTRALIAN HOUSING STARTSYEAR ENDED 31 MARCH (‘000 PER ANNUM)
2013
2012
2014 95
90
2011 117
97
69
2015 109 86
57
Detached housingMulti-residential
Source: ABS
61
62
0.00 48.65 97.30 145.95 194.60

CSR ANNUAL REPORT 2015 98 CSR ANNUAL REPORT 2015
LIGHTWEIGHT SYSTEMSLightweight Systems includes Gyprock™ plasterboard, Cemintel™ fibre cement, Ceilector™ ceilings, Potter™ interior systems, Hebel® lightweight concrete products, AFS® walling systems, Bradford™ and Martini insulation and the Edmonds™ ventilation systems.
Lightweight Systems trading revenue was $898.4 million, up 21%. Excluding acquisitions, Lightweight Systems revenue was up 14%.
Gyprock plasterboard increased earnings with higher volumes reflecting the improved housing market while average selling prices increased across all states. Gyprock maintained its market-leading brand position with product and system development including the roll-out of the Optimised Core technology for Supaceil™ ceiling board. New products using this technology are under development.
Cemintel fibre cement earnings were higher with increased volumes across the east coast. Growth continues for new external cladding products in residential and commercial construction.
Hebel lightweight concrete products continued to increase earnings with volumes higher in the detached housing and multi-residential markets. Margins improved as the construction services offering expands for major builders in Victoria and NSW and a growing presence in New Zealand.
2013
2014 745.1
2015 898.4
699.2
2011 762.7
2012 723.2
0.0 224.6 449.2 673.8 898.4
LIGHTWEIGHT SYSTEMS REVENUEYEAR ENDED 31 MARCH ($ MILLION)
CASE STUDY
GYPROCK LAUNCHES OPTIMISED CORE TECHNOLOGYGyprock maintained its market-leading brand position through continued product innovation including the August 2014 launch of Optimised Core technology for Supaceil™ ceiling board. The new and improved Supaceil™ is stronger and easier to use while being 15% lighter. New products using this technology are under development.
Bradford insulation earnings increased with higher volumes and improved pricing including strong demand in the retrofit housing market for special application products including acoustic and underfloor insulation. Earnings from polyester manufacturer Martini also grew following demand from major commercial projects in Australia.
AFS walling systems increased sales volumes following growing demand from the multi-residential market. The business, acquired on 2 April 2014, is performing slightly ahead of expectations in terms of both Logicwall® (fibre cement) and Rediwall® (polymer) permanent formwork solutions.
“ Higher volumes reflect improved residential markets”

CSR ANNUAL REPORT 2015 1110 CSR ANNUAL REPORT 2015
VIRIDIAN IS AUSTRALIA’S LEADING ARCHITECTURAL GLASS PROVIDER AND THE ONLY MANUFACTURER OF FLOAT AND HARD COAT PERFORMANCE GLASS PRODUCTS IN AUSTRALIA.
Viridian’s broad product range includes energy efficient glass and glass for a variety of other solutions, including noise reduction, security, mirrored and privacy glass and decorative interior glass.
Trading revenue of $279.3 million was up 7% from $262.0 million following the benefit of pricing initiatives and higher volumes driven by market demand.
Viridian recorded a positive EBIT of $3.1 million up from the EBIT loss of $14.9 million in the prior year. The return to profitability is ahead of schedule following restructuring initiatives launched in March 2013 which included improved utilisation of the float glass manufacturing facility at Dandenong in Victoria and the closure of some underperforming sites. New Zealand operations also improved driven by strong construction activity and operational improvement initiatives.
On 30 April 2015, Viridian acquired the Queensland glass processing business of the Australian Glass Group which supports Viridian’s strategy of strengthening its core operations and broadening its market segment exposure.
Viridian is also progressing a number of initiatives to deliver future revenue growth by targeting increased volumes in the residential market for double glazing and coated products, expanding its merchandising capability and developing new product and service offerings for the commercial glass market.
VIRIDIAN OVERVIEWSignificant turnaround in profitability
CASE STUDY
VIRIDIAN LAUNCHES LIGHTBRIDGE HIGH PERFORMANCE GLASSViridian LightBridge double glazing creates a seamless bridge between inside and out, allowing us to bring into our daily lives the light, space and colours of nature. LightBridge offers a market-leading combination of insulation, security and noise-reduction properties for domestic windows, which means the desire to bathe our homes in natural light and reconnect with the world around us through expansive glazing can easily be achieved.
0.0 87.2 174.4 261.6 348.8
2013
2014 262.0
2015 279.3
268.2
2011 348.8
2012 306.1
VIRIDIAN REVENUEYEAR ENDED 31 MARCH ($ MILLION)
2013
2014(4.1)
2015
(14.1)
2011 29.7
2012 5.3
-33.933333-29.066667-24.200000-19.333333-14.466667-9.600000-4.7333330.133333
12.8
VIRIDIAN EBITDAYEAR ENDED 31 MARCH ($ MILLION)
“ The return to profitability is ahead of schedule”

CSR ANNUAL REPORT 2015 1110 CSR ANNUAL REPORT 2015
ALUMINIUM: CSR HOLDS AN EFFECTIVE 25.24% INTEREST IN THE TOMAGO ALUMINIUM SMELTER JV THROUGH ITS 70% INTEREST IN GOVE ALUMINIUM FINANCE LIMITED WHICH IN TURN OWNS 36.05% OF TOMAGO.
The realised aluminium price in Australian dollars (including hedging and premiums) was up 13%, to A$2,633 per tonne for the year, as a result of record ingot premiums and a lower Australian dollar.
US dollar cash LME aluminium prices fell by approximately 7.5% in the second half of the financial year as market fundamentals were impacted by increased exports (particularly of semi-finished products) from China, reduced LME aluminium inventories and concerns over global economic growth. This was more than offset by the 12% fall in the Australian dollar over the same period, leading to a net improvement in pricing in Australian dollar terms.
Ingot premiums, the premiums paid to producers above the LME aluminium price, rose to record levels during the financial year, with the Platts Main Japan Port premium reaching approximately US$425 per tonne in the January to March 2015 quarter.
More recently, markets have seen increased volatility in ingot premiums. For the first quarter of the current financial year, premiums declined by approximately 11% (Platts Main Japan Port premium) to US$380 per tonne and the spot price has declined further in recent weeks.
Conversely, during the month of April 2015, the US dollar cash LME price for aluminium has increased by US$154 per tonne.
GOVE ALUMINIUM FINANCE (GAF – 70% CSR) sales volumes of 202,423 tonnes were 3% higher as productivity initiatives drove increased production at Tomago. Trading revenue of $532.9 million was up 17%, reflecting the increased sales volumes and higher realised prices which included the effects of hedging and premiums.
EBIT of $104.3 million was up 101%, with the EBIT margin improving to 19.6% from 11.4% due to the higher realised price, increased production volumes and continued operational improvements at the Tomago smelter.
2013
2014 51.9
2015 104.3
50.3
2011 111.9
2012 80.5
0.000 27.975 55.950 83.925 111.900
ALUMINIUM EBITYEAR ENDED 31 MARCH (A$ MILLION)
2013
2014 1,815
2,005
2011 2,281
2012 2,345
0.00 586.25 1172.50 1758.75 2345.00
2015 1,909
AVERAGE LME ALUMINIUM PRICEYEAR ENDED 31 MARCH (US$ PER TONNE)
“ Tomago has an ongoing improvement program to increase production, minimise waste and improve profitability”
ALUMINIUM OVERVIEW
Improving operational efficiency
CASE STUDY
TOMAGO REDUCING POWER USAGESmelting aluminium is a power-intensive process and small reductions in cell voltage can yield large savings in energy cost. Several optimisation strategies are currently in place, with a focus on reducing cell voltage while maintaining overall efficiency. Throughout last year, Tomago upgraded its electrolytic cells to the latest technology; these operate at a lower voltage and produce more metal at higher amperages, which has delivered significant cost savings and reduced power usage per tonne of aluminium produced.

CSR ANNUAL REPORT 2015 1312 CSR ANNUAL REPORT 2015
CSR’S PROPERTY DIVISION IS RESPONSIBLE FOR MANAGING CSR’S PROPERTY PORTFOLIO, WITH A PRIMARY FOCUS ON MAXIMISING FINANCIAL RETURNS BY DEVELOPING SURPLUS FORMER CSR MANUFACTURING SITES AND INDUSTRIAL LAND FOR SALE.
UPDATE ON DEVELOPMENT PIPELINE
Brendale, Brisbane• 38.5 hectare industrial development• Site remediation works completed with
civil works underway• Development over next four years
Chirnside Park, Melbourne• 533 lot residential development• Stage 2 and 3 sales underway
Schofields, Sydney• Surplus land at existing brick plant
– 70 hectare future residential development
Horsley Park, Sydney• Surplus land at existing brick plant
– 50 hectare future industrial development
CSR’s Property division recorded EBIT of $30.2 million up from $17.3 million in the previous year. The result includes the first tranche of the sale of the multi-residential development site at New Lynn located southwest of Auckland completed in December 2014.
The result also includes the sale of sites at Pyrmont and surplus industrial land at Ingleburn in Sydney, both of which completed in the first half of the year.
Construction continues on stages 2 and 3 of the 533 lot residential development at Chirnside Park, Melbourne with 186 sales contracts exchanged as of 30 April 2015.
Development continues of the remaining 38.5 hectare industrial site at Brendale in Brisbane.
PROPERTY OVERVIEW
Strong development pipeline
“ CSR is progressing a number of property development opportunities”
2013
2014 17.3
2015 30.2
0
2011 14.6
2012 24.4
0.00 7.55 15.10 22.65 30.20
PROPERTY EBITYEAR ENDED 31 MARCH ($ MILLION)
CASE STUDY
NEW HOME CONSTRUCTION UNDERWAY AT CLOVERLEAIn April 2014, construction of new homes began at CSR’s Chirnside Park development located in the Yarra Valley shire around 40 minutes from the Melbourne CBD. Cloverlea is the first major development in the area for more than a decade with the potential to develop 533 homes during the next five years. CSR’s Property team has co-ordinated this major project over the last several years to deliver infrastructure, roads and other services to the site to enable buyers to begin construction of their new home.

CSR ANNUAL REPORT 2015 1312 CSR ANNUAL REPORT 2015
CSR REMAINS COMMITTED TO SUSTAINABLE BUSINESS PRACTICES THROUGHOUT ALL OF OUR BUSINESSES.
Full details of CSR’s sustainability agenda and data relating to greenhouse gas emissions, energy consumption and water and waste production are included in CSR’s sustainability report which is available on CSR’s website at www.csr.com.au.
SAFETYA major focus on sustainability remains on safety and we place the same emphasis and importance on managing workplace health and safety as any other business imperative.
CSR’s safety performance continued to improve with a 31% reduction in the lost time injury frequency rate. A number of new initiatives including an innovative manual handling risk assessment process were developed to focus on coaching and setting controls. As a result, CSR achieved a 45% reduction in recordable injuries due to manual handling in the past year. While CSR’s safety record continues to improve year on year, there is considerable work still required to achieve our ambition of zero harm across all of our operations. All employees are expected to take personal responsibility and be involved with setting and complying with the company’s standards and driving improvement initiatives.
ENVIRONMENTOur ongoing commitment is to minimise the impact on the environment with specific targets to reduce greenhouse gas emissions and waste production and the consumption of energy and water used in production.
We have continued to make progress to ensure CSR is on track to meet its 2020 goal of a 20% reduction per tonne of saleable product using 2009/10 as the base year, with the following reductions achieved over the last three years:
• total greenhouse gas emissions down 16% • potable water usage down 13% • solid waste produced down 33%
Note: data reported for the period from 1 July 2011 to 30 June 2014 to be consistent with National Greenhouse and Energy Reporting scheme.
To achieve these targets, CSR progressed a number of initiatives to improve operational performance and efficiency with over 200 energy reduction initiatives underway across our sites.
COMMUNITYWe continue to partner with a number of organisations in line with our commitment to operate in a sustainable manner, with the community at the centre of our right to operate. The CSR Community Support Program operates as a core component of our community involvement in which CSR matches employee contributions dollar for dollar to a range of charitable organisations.
CSR launched the Community Support Program eleven years ago and during that time CSR and its employees have donated over $2.6 million to charity. In YEM15, CSR and its employees donated $94,000 to a range of charitable organisations.
CSR also works with the Australian Business and Community Network, a partnership of highly committed national business leaders and companies working on mentoring and coaching programs in schools in high need areas. In YEM15, 88 CSR employees mentored 159 students and volunteered 845 hours.
PEOPLEAt CSR, we are committed to investing in our people. Over the last three years, we have developed a suite of leadership development programs designed to provide our leaders with the knowledge, skills and support to enable them to perform at their best.
CSR recognises that improving diversity requires cultural change driven by the leadership and commitment of the board and senior management. The cultural change themes have been used by CSR to define measurable objectives which are expanded in detail in the corporate governance section of this report on pages 18 and 19.
As at 31 March 2015, CSR had 3,134 full-time equivalent employees across its operations in Australia and New Zealand. This total is up 5% from the comparable figure last year mainly due to acquisitions.
COMMUNITY AND SUSTAINABILITY
Progressing our sustainability agenda
Note: excludes joint ventures and businesses acquired during the financial year ended 31 March 2015.
2013
2014 4.5
2015 3.1
4.2
2011 5.4
2012 5.1
0.00 1.35 2.70 4.05 5.40
LOST TIME INJURY FREQUENCY RATEYEAR ENDED 31 MARCH (PER MILLION WORK HOURS)
2013
2014 17.7
2015 13.8
17.5
2011 27.4
2012 25.6
0.00 6.85 13.70 20.55 27.40
TOTAL RECORDABLE INJURY FREQUENCY RATEYEAR ENDED 31 MARCH (PER MILLION WORK HOURS)

CSR ANNUAL REPORT 2015 1514 CSR ANNUAL REPORT 2015
BOARD OF DIRECTORS
JEREMY SUTCLIFFELLB (HONS), MAICD.
Chairman since July 2011, non-executive director since December 2008 and held the position of interim CEO and managing director from 1 April to 31 December 2010.
Experience, expertise and other directorshipsJeremy was Group CEO of Sims Metal Management Limited from 2002 until 2008 and a director until 2009. He is a non-executive director of Amcor Limited (2009 to current), Orora Limited (2013 to current), and a member and director of The Australian Rugby League Commission Limited (2012 to current). He also holds an advisory role with Veolia Environmental Australia.
Other CSR responsibilitiesMember of the Risk & Audit Committee and Remuneration & Human Resources Committee.
ROB SINDELBENG, MBA, GAICD.
Appointed to the board as an executive director in December 2010 and managing director in January 2011. Rob joined CSR in April 2008 as executive general manager of CSR Lightweight Systems. In October 2009, he was appointed CEO of CSR Building Products.
Experience, expertise and other directorshipsRob was formerly the managing director of Hanson’s slag cement business in the United Kingdom, a subsidiary of the global building materials company, Heidelberg Cement Group. Rob also held the position of commercial trading director for Hanson Aggregates in the United Kingdom. His 25 year career in the construction industry started with Pioneer in Australia. A member of the UNSW Australian School of Business Advisory Council, a director of the Green Building Council of Australia, and chair of the Remuneration Committee of the Green Building Council of Australia. Rob is also a director of the Australian Business and Community Network Council, a not-for-profit organisation, working on mentoring and coaching programs with schools in areas of high need.
Other CSR responsibilitiesAttends committee meetings by invitation.
KATHLEEN CONLONBA (ECON) (DIST), MBA, FAICD.
Non-executive director since December 2004.
Experience, expertise and other directorshipsKathleen was a partner and director of the Boston Consulting Group (BCG) for seven years where she led BCG’s Asia Pacific Operational Effectiveness Practice Area and, previously, the Sydney office. She is a member of Chief Executive Women, and a non-executive director of REA Group Limited (2007 to current), Lynas Corporation Limited (2011 to current), Aristocrat Leisure Limited (2014 to current), The Benevolent Society and the Australian Institute of Company Directors (AICD).
Other CSR responsibilitiesChairman of the Remuneration & Human Resources Committee.

CSR ANNUAL REPORT 2015 1514 CSR ANNUAL REPORT 2015
MIKE IHLEINBBUS (Accounting), FAICD, FCPA, FFIN.
Non-executive director since July 2011.
Experience, expertise and other directorshipsMike was formerly chief executive officer and executive director of Brambles Limited until November 2009, prior to which he was Brambles’ chief financial officer for four years. Mike has also had a long career with Coca-Cola Amatil Limited including seven years as chief financial officer and executive director and a number of senior operational, finance, business development and treasury roles including managing director of Coca-Cola Amatil Poland. Mike is currently a non-executive director of Scentre Group (2014 to current – formed through a merger with Westfield Retail Trust on which Mike was a non-executive director from 2010). He is also a non-executive director of Snowy Hydro Limited and Murray Goulburn Co-operative Co. Ltd. Mike is a fellow of the Australian Institute of Company Directors (AICD), CPA Australia and Financial Services Institute of Australasia and a member of Financial Executives Institute of Australia. He is also a director of Spark Software sp. z o.o. and chair of Australian Theatre for Young People.
Other CSR responsibilitiesChairman of the Risk & Audit Committee and member of the Workplace Health, Safety & Environment Committee.
REBECCA MCGRATH BTP (HONS), MASC, FAICD.
Non-executive director since February 2012.
Experience, expertise and other directorshipsRebecca was formerly chief financial officer and executive director of BP Australasia, a position held until January 2012, prior to which she was vice president operations and executive director, Australia & Pacific for BP Australasia and general manager, group marketing performance, for BP Plc (London). Rebecca’s management career with BP spanned 23 years. Rebecca is currently a non-executive director of Goodman Group (2012 to current), OZ Minerals Limited (2010 to current) and Incitec Pivot Limited (2011 to current) and was previously a director of Big Sky Credit Union. She is a fellow of the Australian Institute of Company Directors (AICD) and Chairman of Project New Dawn, a homeless and unemployment focused not-for-profit organisation.
Other CSR responsibilitiesChairman of the Workplace Health, Safety & Environment Committee and member of the Remuneration & Human Resources Committee.
MATTHEW QUINNBSC (HONS), ACA, ARCS, FAPI, FRICS.
Non-executive director since August 2013.
Experience, expertise and other directorshipsMatthew was formerly managing director of Stockland, a position held until January 2013. Matthew’s management career with Stockland spanned 12 years, and he has an extensive background in commercial, retail, industrial and residential property investment and development. Matthew is a non-executive director of Urban Growth NSW, a State owned corporation, and chairman of Carbonxt Group Limited and mPort Pty Limited. He is also a non-executive director of the Public Interest Advocacy Centre (PIAC) and member of the Australian Business and Community Network Scholarship Foundation. He is a Chartered Accountant as well as fellow of the Australian Property Institute and of the Royal Institute of Chartered Surveyors.
Other CSR responsibilitiesMember of the Risk & Audit Committee and Workplace Health, Safety & Environment Committee.
COMPANY SECRETARY
DEBBIE SCHROEDERBED (HONS), LLB, MAICD, MGIA.
Company secretary since July 2010 and CSR legal counsel. Joined CSR in September 2001, managing workers’ compensation from 2003 to 2006 and human resources for the sugar division from 2006 to 2008. Debbie was appointed legal counsel for CSR Limited in 2008. Debbie was previously a lawyer at Tress Cocks & Maddox and Lander & Rogers. Debbie has extensive experience in corporations law and corporate governance, dispute resolution, employment law, insurance and competition and consumer law. Debbie holds a Graduate Diploma in Applied Corporate Governance and is a member of Governance Institute of Australia and of the Australian Institute of Company Directors (AICD).

CSR ANNUAL REPORT 2015
CSR ANNUAL REPORT 2015 1716 CSR ANNUAL REPORT 2015
CORPORATE GOVERNANCE
CSR’s corporate governance is the system by which the company is directed and managed. It is the framework of rules, relationships, systems and processes that underpin CSR’s long established values and behaviours, the way it does business and within which: • the CSR board of directors is accountable to shareholders
for the operations, financial performance and growth of the company; and
• the risks of business are identified and managed.
CSR actively reviews Australian and international developments in corporate governance and considers the views of shareholders, regulators and other stakeholders. The CSR board adopts those arrangements which it considers are in the best interests of CSR and its shareholders.
The directors of CSR are committed to ensuring that the company maintains an effective system of corporate governance and that good corporate governance is an integral part of the culture and business practices of the CSR group.
Throughout the reporting period, being the year ended 31 March 2015, CSR complied with the recommendations contained in the ASX Corporate Governance Council’s Corporate Governance Principles and Recommendations (2nd edition) (ASX CGC Principles).
Charters and policies referred to in this corporate governance statement are available on CSR’s internet site in the ‘Investor Centre & News’ section under ‘Corporate Governance’ at htt p://ww w.csr.c om.au/Investor-Centre-and-News/Corporate-Governance.
This corporate governance statement is organised under headings reflecting the ASX CGC Principles.
ROLES AND RESPONSIBILITIESCSR has solid foundations for management and oversight (ASX CGC Principle 1)The board strives to create shareholder value and ensure that shareholders’ funds are prudently safeguarded.
CSR’s constitution (available on CSR’s internet site), which sets out the provisions that govern the internal management of the company, can only be amended by special resolution of shareholders. Under the constitution, shareholders elect directors whose function is to represent shareholders and to act in the best interests of the company.
The roles of board and managementThe board has adopted a formal board charter (available on CSR’s internet site), which establishes those matters reserved for the board and authority delegated to management. The board’s functions, as summarised in the board charter, include:• approving CSR strategies, budgets, plans and policies; • assessing performance against business plans to monitor both the
performance of management as well as the continuing suitability of business strategies;
• reviewing operating information to understand the state of the company;
• considering management recommendations on proposed acquisitions, divestments and significant capital expenditure;
• considering management recommendations on capital management, the issue or allotment of equity, borrowings and other financing proposals, guarantees of non-group liabilities, and restructures;
• ensuring that the company operates an appropriate corporate governance structure, in particular ensuring that CSR acts legally and responsibly on all matters and that the highest ethical standards are maintained;
• approving CSR’s risk management strategy and frameworks and monitoring their effectiveness;
• considering the social, ethical and environmental impact of CSR’s activities and monitoring compliance with CSR’s sustainability policies and practices;
• maintaining a constructive and ongoing relationship with the Australian Securities Exchange and regulators, and approving policies regarding disclosure and communications with the market and shareholders; and
• monitoring internal governance including delegated authorities, and monitoring resources available to senior executives.
Day-to-day management of the company’s affairs and the implementation of strategy and policy initiatives are formally delegated by the board to the managing director and senior executives.
Letters of appointment The managing director’s responsibilities and terms of employment, including termination entitlements, are set out in a formal executive service agreement. A summary of the main elements and terms of the agreement is set out in the remuneration report.
Letters of appointment are prepared for non-executive directors and senior executives, covering duties, time commitments, induction and company policies and corporate governance.
Induction of senior executivesNew executives undertake a structured induction program when they join the company. This includes comprehensive briefings and information on the company’s businesses, and its policies and procedures. Additionally, the program includes site visits and meetings with people in key internal and external roles in order to build the relationships necessary to meet the requirements of their roles.
As discussed further below, and in the remuneration report, key performance indicators are agreed with each executive to ensure goals and performance measures are fully and accurately understood and disclosed.
Performance evaluation of senior executives CSR’s performance management framework requires that a balanced scorecard of annual key performance indicators (including financial and non-financial measures) is set for each senior executive. Every half year, each senior executive discusses their performance with their manager. At the end of the year, as part of a formal review process, each senior executive’s performance is reviewed against compliance with the performance indicators. Also, each individual’s performance and behaviour are compared and measured against the performance of their peers, and measures are reviewed and adjusted if required. CSR conducted evaluations of its senior executives in accordance with this process in October 2014, March and April 2015.
Further details of the process for evaluating the performance of key management personnel and the remuneration policy for key management personnel are provided in the remuneration report.
BOARD OF DIRECTORS CSR structures the board to add value (ASX CGC Principle 2)The board charter prescribes the structure of the board and its committees, the framework for independence and some obligations of directors.
Information regarding the induction program for directors is set out on page 18 in this statement.

CSR ANNUAL REPORT 2015
CSR ANNUAL REPORT 2015 1716 CSR ANNUAL REPORT 2015
CORPORATE GOVERNANCE CONTINUED
Size and composition of the board The board considers that its membership should comprise directors with an appropriate mix of skills, experience and personal attributes that allow the directors individually, and the board collectively, to: • discharge their responsibilities and duties under the law effectively
and efficiently;• understand the suite of CSR businesses and the environment in
which CSR operates these businesses so as to be able to agree with management the objectives, goals and strategic direction which will maximise shareholder value; and
• assess the performance of management in meeting those objectives and goals.
The board currently comprises five non-executive directors and one executive director.
The chairman is appointed by the board and provides leadership to ensure that a high standard of values, processes and constructive interaction is maintained by the board. The chairman represents the views of the board to shareholders and canvasses the views of stakeholders, including through the annual general meeting.
There were no changes to the board in YEM15.
Information about directors, including their skills, experience, expertise and their period in office is on pages 14 and 15. The board keeps the balance of skills and experience of its members, as well as their independence, under review. The board strives to achieve diversity in its composition.
Directors’ independence At all times throughout YEM15, the board has comprised a majority of independent directors. Each of the non-executive directors, including the chairman, has been determined by the board to be independent of CSR and its management, having no business or other relationships that could compromise his or her autonomy as a director.
The board’s framework for determining director independence is included in the board charter and operates in accordance with the considerations set out in the ASX CGC Principles. Any past or present relationship with the company is regularly examined carefully to assess the likely impact on a director’s ability to be objective and exercise independent judgement.
Dealing with conflicts of interestThe board has a process in place to ensure that conflicts of interest are managed appropriately. If a potential conflict of interest arises, the director concerned is excluded from all discussion and decision making on the matter. At all times, directors are required to keep the company secretary informed of all relevant interests and directors must advise the board immediately of any interests that could potentially conflict with those of CSR.
Appointment and election of directorsThe board takes on the role of the nominations and governance committee, which includes the following functions:• determining the appropriate size and composition of the board
(in accordance with the company’s constitution);• determining the appropriate criteria (necessary and desirable
skills and experience) for appointment of directors;• recommending the appointment and removal of directors;• defining the terms and conditions of appointment to and retirement
from the board;• overseeing induction and continuing education programs for
non-executive directors; and• evaluating the board’s performance.
The company’s size is not considered sufficient to warrant a separate nominations and governance committee.
The company aims to have a board which, as a whole, has the range of skills, knowledge, background and experience to govern CSR, made up of individuals of high integrity, with sound commercial judgement and inquiring minds and able to work cohesively with other directors. When considering director candidates, CSR seeks a combination of former chief executives and individuals experienced in manufacturing, finance, the law and, ideally, the industries in which CSR participates.
CSR undertakes a rigorous process when selecting new directors. Specifically, CSR develops a matrix of required skills and experience. This matrix is developed by taking into account CSR’s desire to ensure a diverse range of gender, background and experience is maintained on the board at all times, and also ensuring directors are appropriately qualified.
External consultants are engaged, where appropriate, to advise on potential appointees. The potential appointees must have a strong reputation and high ethical standards. Prospective directors confirm that they will have sufficient time to meet their obligations and that they will keep the company informed of their other commitments.
Non-executive directors are subject to re-election by rotation at least every three years. Newly appointed directors must seek election at the first general meeting of shareholders following their appointment. The board charter states that non-executive directors appointed from 2001 shall not seek re-election after serving for ten years, unless determined by the board that it is appropriate to do so.
Board committeesTo increase its effectiveness, the board has three committees consisting of the Risk & Audit Committee, Workplace Health, Safety & Environment Committee and Remuneration & Human Resources Committee. It is the policy of the board that a majority of the members of each committee be independent directors, that all Risk & Audit Committee members be independent directors and that the Remuneration & Human Resources Committee and the Workplace Health, Safety & Environment Committee be chaired by an independent director.
Each committee has a charter which includes a more detailed description of its duties, responsibilities and specific composition requirements. The charters are available on CSR’s internet site. The Risk & Audit Committee, the Remuneration & Human Resources Committee and the Workplace Health, Safety & Environment Committee each comprise at least three non-executive directors and are chaired by a director who is not the chairman of the board. All committees meet at least four times per year.
Rob Sindel, the managing director, attends meetings of board committees by invitation. He is not present at the meetings where it is considered that his presence could compromise the objectivity of proceedings.
Committee papers are copied to all directors before the meetings. Minutes of committee meetings are included in the papers for the next board meeting and the chair of each committee reports to the board on matters addressed by the committee.
The membership of these committees, the number of meetings held and each director’s attendance record in YEM15 are shown in the ‘Directors’ meetings’ table on page 22.
The work of directors In addition to attending board and committee meetings, non-executive directors allocate time for strategy and budget sessions, preparing for meetings and inspecting operations.
The chairman commits additional time and meets regularly with the managing director to review business and strategic issues and to agree board meeting agendas. The directors usually meet with no management present at the commencement of board meetings and on other occasions as required.
CSR ANNUAL REPORT 2015
CSR ANNUAL REPORT 2015 1918 CSR ANNUAL REPORT 2015
CORPORATE GOVERNANCE CONTINUED
Except where the directors need to meet privately, the company secretary attends all board meetings.
The directors regularly visit the company’s operations to better understand the issues facing each of the businesses and their people.
Since September 2011, every meeting of the Workplace Health, Safety & Environment Committee has been held at a CSR site. In YEM15, the Workplace Health, Safety & Environment Committee visited the PGH Bricks and Pavers factory at Darra, Queensland, the Viridian glass factory at Jandakot, Western Australia, the Lightweight Systems factories at Coopers Plains, Queensland, Yarraville, Victoria and Welshpool, Western Australia, the Martini factory at Ingleburn, New South Wales and the AFS factory at Goulburn, New South Wales.
Directors’ induction education and access to informationThe board strives to ensure that directors and key executives have the knowledge and information needed to operate effectively.
The chairman briefs new directors on their roles and responsibilities. New directors receive a comprehensive information pack as part of this induction, as well as special briefings from management and visits to key operating sites to assist them to rapidly understand CSR’s businesses and issues.
Time is allocated at board and committee meetings for continuing education on significant issues facing the company and changes to the regulatory environment.
To help directors maintain their understanding of the businesses and to assess the people managing them, directors are briefed regularly by each member of the senior management team. Directors also have access to a wide range of employees at all levels during inspections of operations and in other meetings.
Directors receive a comprehensive monthly performance report from the managing director regardless of whether a board meeting is scheduled. Directors have unrestricted access to company records and information.
At specially organised functions, directors meet customers, business partners, suppliers and other stakeholders of the company.
Directors may obtain independent professional advice, at CSR’s expense on matters arising in the course of their board and committee duties, after obtaining the chairman’s approval. The board charter requires that all directors be provided with a copy of such advice and be notified if the chairman’s approval is withheld.
The board appoints and removes the company secretary. All directors have direct access to the company secretary who is accountable to the managing director and, through the chairman, to the board, on all governance matters.
Performance evaluationThe performance of the board is reviewed regularly. The board undertakes a self-assessment of both its collective performance and that of individual directors and seeks specific feedback from the senior management team on particular aspects of its performance. The board establishes procedures and oversees this annual performance assessment program. The process may be assisted by an independent third party facilitator. The results and any action plans flowing from this annual assessment are documented, together with specific performance goals that are agreed for the coming year.
The performance of the managing director is reviewed, at least annually, through a formal performance appraisal process conducted by the board.
In YEM15, the board conducted a thorough review of its functions and responsibilities via an external consultant. In YEM16, the Risk & Audit Committee and the Remuneration and Human Resources Committees will be reviewed.
CODE OF CONDUCT CSR actively promotes ethical and responsible decision making (ASX CGC Principle 3) CSR has a robust framework of policies, underpinned by its goals and values and code of business conduct and ethics. CSR’s code of business conduct and ethics and policies discussed below set the standards for dealing with obligations to external stakeholders. A statement of CSR’s community engagement is detailed in this annual report and the sustainability report, both of which are available on CSR’s internet site.
Code of business conduct and ethics The underlying principle of CSR’s code of business conduct and ethics is that ethical behaviour is required of directors, executives and all other employees, as well as advisers, consultants and contractors.
The board has endorsed a code of business conduct and ethics (available on CSR’s internet site) that formalises the longstanding obligation of all CSR people, including directors, to behave ethically, act within the law, avoid conflicts of interest and act honestly in all business activities.
CSR’s code of business conduct and ethics reinforces the company’s commitment to giving proper regard to the interests of people and organisations dealing with the company. Each CSR person is required to respect and abide by the company’s obligations to employees, shareholders, customers, suppliers and the communities in which it operates.
In addition, the board has adopted specific policies in key areas, including trade practices; workplace health, safety, and the environment; fairness, respect and diversity in employment; capital investment; dealing with price sensitive and other confidential information; trading in CSR shares; privacy; indemnification of employees; and requirements for authorising and entering into business transactions on behalf of CSR.
CSR employees are required to sign a certificate of compliance each year signifying that they have read and complied with the code of business conduct and ethics and are not aware of any breaches of that policy.
Further, CSR employees are encouraged to report potential breaches to a confidential telephone service. The CSR policy on the reporting of misconduct within the organisation provides that an employee will not be subject to retaliation by CSR for reporting in good faith a possible violation of the code of business conduct and ethics.
DiversityCSR has policies and practices to improve the diversity within the organisation. A summary of this policy is available on CSR’s internet site in the ‘Careers’ section under ‘Our People’.
CSR recognises that improving diversity is important to improving and sustaining a workforce capable of generating better relationships and more innovative solutions for its customers. Ultimately, this improves the results of CSR. CSR has adopted the ASX CGC Principles in respect of diversity.
Improving diversity requires cultural change driven by the leadership and commitment of the board and senior management. The culture change themes have been used by CSR to structure its measurable objectives. The objectives and achievements for YEM15 are described later in this corporate governance statement along with a brief outline of the objectives for YEM16.
CSR workplace profile At board level, two of the five non-executive directors (40%) are women.
14.5% of employees in senior management positions are women including the company secretary, group treasurer, group financial controller and general manager investor relations and corporate communications.
During YEM15, the percentage of women in the CSR workforce increased from 16.4% to 16.7%.

CSR ANNUAL REPORT 2015
CSR ANNUAL REPORT 2015 1918 CSR ANNUAL REPORT 2015
CORPORATE GOVERNANCE CONTINUED
Measurable objectivesThe following table describes the measurable objectives that CSR will use to plan and report progress on diversity initiatives:
MEASURABLE OBJECTIVE YEM15 ACHIEVEMENTS OVERVIEW OF YEM16 INITIATIVES
Leadership and culture
• Increased participation of women in CSR leadership programs from 24% to 36%
• Completed a gender pay equity review as part of the annual salary review process
• Continued investment in specific diversity training as part of the CSR leadership programs and through diversity recruitment training
• Ensure opportunities for women to attend CSR leadership programs are promoted and include more diversity initiatives as part of these programs
• Achieve and maintain pay equity as part of annual salary review process
• Expand accountability for diversity by including specific objectives for executive members with achievements assessed as part of their short term incentives
• Use diversity performance metrics to drive improvement in attracting and retaining women
Career management • Promoted career opportunities and development of women with 30% of internal promotions awarded to women including appointments to line management roles
• The managing director led a series of six CSR lunches to engage and connect with a representative group of women to improve diversity objectives and understand issues affecting women in the workplace
• Formalise career sponsorships for senior women to improve attraction, development and retention
• Improve CSR policies and practices as they relate to workplace flexibility
Recruitment and retention
• Introduced a recruitment policy that each vacant role must include a woman on the short list and apply a “if not, why not rule”
• Completed review with labour hire organisations to assess performance against specific objectives to attract more women to CSR
• Conducted quarterly analysis and review of attraction, appointment and retention of staff by gender
• Worked with industry associations to attract more women to non-traditional roles, including a partnership with the Australian Glass and Glazing Association to develop and encourage more women in glass processing, glazing and business management
• Increase the attraction of female applicants by 15% by: – improving the employee value proposition and search
capability for women through universities and industry partnerships;
– ensuring labour hire and other recruitment providers meet objectives of having women on the short list for all roles; and
– conducting additional recruitment training for line managers including any bias that may occur when selecting staff.
• Target a 10% reduction in voluntary turnover of women through our investment in career development and review of turnover analysis
Trading in CSR shares Directors’ shareholdings at 12 May 2015 are shown in the table ‘Directors’ interests in CSR shares’ on page 22.
Under the company’s share trading policy (available on CSR’s internet site), directors and senior managers may only buy or sell CSR shares, or give instructions to the trustee of CSR’s employee share acquisition plan (ESAP), during one month periods commencing 24 hours after the date of the full-year and half-year results announcements and the annual general meeting. Also, they are prohibited from dealing in any financial products relating to CSR securities or entering into hedging arrangements in respect of CSR securities they hold, or which are held on their behalf. Under the policy, and as required by law, all directors and employees are prohibited from buying or selling CSR shares at any time if they are aware of any price sensitive information that has not been made public. All CSR share dealings by directors are notified to the ASX within the required time.
Additional trading restrictions apply to key management personnel.
AUDITCSR has implemented a structure in order to independently verify and safeguard the integrity of the company’s financial reporting (ASX CGC Principle 4)
Risk & Audit CommitteeThe Risk & Audit Committee is chaired by Mike Ihlein. The other members of the committee during YEM15 were Jeremy Sutcliffe and Matthew Quinn.
The external audit firm partner in charge of the CSR audit attends Risk & Audit Committee meetings by invitation, together with the internal audit manager and relevant senior managers.
The committee advises the board on all aspects of internal and external audit, the adequacy of accounting and risk management procedures, systems, controls and financial reporting.
The committee’s specific responsibilities are set out in its charter and include:• reviewing the scope of the annual audit plans of the external auditor
and internal auditor and oversight of the work performed by the auditors throughout the year;
• considering and recommending to the board significant accounting policies and material estimates and judgements in financial reports;
• reviewing and monitoring internal controls and risk management across the group;
• reviewing and recommending to the board the adoption of the company’s full-year and half-year financial statements; and
• reviewing the performance and effectiveness of internal and external auditors.

CSR ANNUAL REPORT 2015
CSR ANNUAL REPORT 2015 2120 CSR ANNUAL REPORT 2015
CORPORATE GOVERNANCE CONTINUED
The committee is a direct link for providing the views of internal and external auditors to the board, when necessary, independently of management influence. Time is allocated for detailed questioning of the material presented and separate sessions with each of the external auditor, internal auditor and chief financial officer.
The committee seeks to ensure the independence of the external auditor. The policy on auditor independence applies to services supplied by the external auditor and their related firms to CSR. Under the policy on auditor independence:• the external auditor is not to provide non-audit services under which
the auditor assumes the role of management, becomes an advocate for the group, or audits its own professional expertise;
• significant permissible non-audit assignments awarded to the external auditor must be approved in advance by the committee or, between committee meetings by the chairman of the committee; and
• the external audit engagement partner and review partner must be rotated every five years.
Procedures for selection and appointment of the external auditor, and for the rotation of external audit engagement partners, are set out in the committee charter.
The external auditor annually confirms its independence within the meaning of applicable legislation and professional standards.
Financial report accountability CSR’s managing director and chief financial officer, who are present for board discussion of financial matters, are required to state to the board, in writing, that the company’s financial statements are in accordance with relevant accounting standards, give a true and fair view in all material respects of the company’s and the group’s financial condition and operational results and comply with the Corporations Act 2001 and associated regulations.
DISCLOSURECSR promotes timely and balanced disclosure of all material matters concerning the company (ASX CGC Principle 5)
Continuous disclosure CSR believes that shareholders, regulators, ratings agencies and the investment community generally, should be informed of all major business events and risks that influence CSR, in a factual, timely and widely available manner. CSR has a long established practice of providing relevant and timely information to stakeholders, supported by its share market disclosure policy (available on CSR’s internet site) which details comprehensive procedures to ensure compliance with all legal obligations. Under this policy, any price sensitive material for public announcement, including full-year and half-year results announcements, release of financial reports, presentations to investors and analysts and other prepared investor briefings for CSR, will be: • lodged with the ASX as soon as practical and before external
disclosure elsewhere; and• posted on CSR’s internet site.
The policy limits external briefings in the periods between the end of a full-year and half-year and the release to the ASX of the relevant results. CSR’s Corporate Governance and Disclosure Committee meets as required, and often on very short notice, to ensure compliance with disclosure requirements. Members of this committee are the managing director, chief financial officer, company secretary and general manager investor relations and corporate communications. The managing director approves all disclosures before they are released. The board approves all disclosures that are significant.
The share market disclosure policy is reviewed regularly to ensure compliance with the ASX listing rules and guidance on continuous disclosure.
The company secretary is responsible for communications with the ASX.
Commentary on financial results CSR provides a review of operations and financial performance in this annual report, which also includes the company’s financial report. Results announcements to the ASX, analyst presentations and the full text of the chairman’s and managing director’s addresses at the company’s annual general meeting are made available on CSR’s internet site.
SHAREHOLDERSCSR respects the rights of shareholders and facilitates the effective exercise of those rights (ASX CGC Principle 6)CSR strives to communicate effectively with shareholders about the company’s performance, presenting this annual report and other corporate information in clear language, supported by descriptive graphics and tables.
Where practicable, the company uses the latest widely available electronic technology to communicate openly and continually with shareholders, and the share market in general. Announcements to the ASX, significant briefings, notices of meetings and speeches at annual general meetings are promptly posted on the company’s internet site and retained there for a minimum of three years.
Shareholders and other interested parties can receive emails with links to the newly posted annual report and can lodge proxies electronically for the annual general meeting. CSR keeps summary records for internal use of the issues discussed at group and one-on-one briefings with investors and analysts.
The annual general meeting and profit announcement briefings are available via a live webcast from CSR’s internet site, for access by all interested parties.
The company’s shareholder communication policy is available on CSR’s internet site.
Auditor attendance at the annual general meetingThe external audit firm partner in charge of the CSR audit will be available to answer shareholder questions at the company’s annual general meeting.
RISK MANAGEMENTCSR has a sound system of risk oversight and management and internal control (ASX CGC Principle 7)There are many risks in the markets in which CSR operates. A range of factors, some of which are beyond CSR’s control, can influence performance across CSR’s businesses. In many of these businesses, CSR constantly and deliberately assumes certain levels of risk in a calculated and controlled manner. CSR has in place limits and a range of policies and procedures to monitor the risk in its activities and these are periodically reviewed by the board. CSR’s risk management policy, which sets out the framework for risk management, internal compliance and control systems, is available on CSR’s internet site. There are several layers that assist the board in ensuring the appropriate focus is placed on the risk management framework: • Risk & Audit Committee – reviews and reports to the board
in relation to the company’s financial reporting, internal control structure, risk management systems and the internal and external audit functions. The Risk & Audit Committee recommends to the board the appointment or dismissal of the internal auditor, who is independent of the external auditor;
• Workplace Health, Safety & Environment Committee – reviews and reports to the board on the management of the company’s safety, health and environment liabilities and legal responsibilities as well as the company’s involvement in the communities in which it operates; and
• Senior management team – manages and reports to the board on business and financial risks and overall compliance.

CSR ANNUAL REPORT 2015
CSR ANNUAL REPORT 2015 2120 CSR ANNUAL REPORT 2015
CORPORATE GOVERNANCE CONTINUED
Risk management is sponsored by the board, and is a priority for senior managers, starting with the managing director. The board oversees the risk appetite and profile of CSR and ensures that business developments are consistent with the risk appetite and goals of CSR.
The risk management framework covering business risk, financial risk, financial integrity and legal compliance, including the establishment of policies for the control of these risks, is in place. The board, through the Risk & Audit Committee, receives recommendations in relation to the risk profile of CSR, breaches of the policy framework and external developments which may impact on the effectiveness of the risk management framework. It also approves significant changes to the risk management framework and related policies.
The Risk & Audit Committee has responsibility for monitoring compliance with the risk management framework approved by the board for internal control and compliance matters. In this role, the Risk & Audit Committee monitors and reviews the effectiveness of the internal audit and compliance functions. CSR’s Corporate Governance and Disclosure Committee has responsibility for any governance matters. Committees exist at the executive management level to ensure the necessary elements of expertise are focused on specific risk areas. Beneath this level, other committees exist where senior specialists focus on specific risks as appropriate.
The risk management framework is designed to ensure policies and procedures are in place to manage the risks arising within each business unit. Application varies in detail from one part of CSR to another; however, the same risk management framework applies across all business activities without exception.
Risk management accountability As part of the process of approving the financial statements, at each reporting date the managing director and other responsible senior executives provide statements in writing to the board on the quality and effectiveness of the company’s risk management and internal compliance and control systems. The statements are substantiated in part by an annual review using applicable elements of the frameworks provided by the Committee of Sponsoring Organizations of the Treadway Commission (COSO) on Internal Control and Enterprise Risk Management.
The board has also received statements from the managing director and the chief financial officer certifying that, having made all reasonable enquiries and to the best of their knowledge and belief: • the statements made in relation to the financial integrity of the CSR
group financial reports are founded on a sound system of effective and efficient risk management and internal compliance and control;
• the system of risk management in operation at 31 March 2015 implemented the policies adopted and delegated by the board and of the other decision making bodies operating within the CSR group and was operating effectively; and
• the systems relating to financial reporting were operating effectively in all material respects.
The board received the relevant declarations required under section 295A of the Corporations Act 2001 from the managing director and chief financial officer as well as the relevant reports and assurances required under ASX CGC Principles 7.2 and 7.3.
REMUNERATION CSR ensures that the level and composition of remuneration is sufficient and reasonable and that its relationship to performance is clear (ASX CGC Principle 8) CSR’s policy is to reward executives with a combination of fixed remuneration and short and long term incentives structured to drive improvements in shareholder value. Non-executive directors receive no incentive payments and there are no retirement benefit schemes in place. Executives and directors may forgo part of their cash remuneration or, for non-executive directors, their directors’ fees, to acquire shares in CSR. Employees cannot approve their own remuneration, nor can they review that of their direct subordinates without their manager’s approval.
Remuneration & Human Resources CommitteeKathleen Conlon chairs the Remuneration & Human Resources Committee. The other members of the committee during YEM15 were Jeremy Sutcliffe and Rebecca McGrath.
The committee advises the board on remuneration policies and practices, evaluates the performance of the managing director against pre-agreed goals and makes recommendations to the board on remuneration for the managing director and senior managers reporting to him. The committee also oversees CSR’s human resources strategy, particularly succession and development planning for senior managers. The committee considers independent advice on policies and practices to attract, motivate, reward and retain strong performers.
The remuneration report includes further details on CSR’s remuneration policy and its relationship to the company’s performance on pages 23 to 39. It also includes details of the remuneration of directors and key management personnel for YEM15 and clearly distinguishes between the structure of non-executive director remuneration from that of the executive director and other key management personnel. Shareholders are invited to vote on the adoption of the report at the company’s annual general meeting.
Equity based executive remunerationKey features of the employee share plans used by CSR, the company’s policy on share ownership and details of CSR shares beneficially owned by directors and key management personnel appear in the remuneration report on pages 23 to 39.
Workplace health, safety and environment responsibilitiesAn important part of CSR’s governance commitments includes protection of its people’s workplace health and safety, and for the environment (WHS&E). The board endorsed WHS&E policy (available on CSR’s internet site) details the company’s and individuals’ obligations.
The board’s Workplace Health, Safety & Environment Committee oversees and reports to the board on the management of the company’s WHS&E responsibilities. In YEM15, Rebecca McGrath chaired the committee and the other members were Mike Ihlein and Matthew Quinn.
Rob Sindel attends all meetings of the Workplace Health, Safety & Environment Committee by invitation.
The committee receives regular performance reports from management, reviews the adequacy of WHS&E management systems and ensures appropriate improvement targets and benchmarks. It monitors potential liabilities, changes in legislation, community expectations, research findings and technological changes.
The committee has every meeting at a CSR site and such meetings include a presentation from local management and a site tour.

CSR ANNUAL REPORT 2015
CSR ANNUAL REPORT 2015 2322 CSR ANNUAL REPORT 2015
CORPORATE GOVERNANCE CONTINUED
Corporate governance and disclosureCSR considers that the above corporate governance practices comply with the ASX CGC Principles (as applied during the relevant reporting period).
The company’s corporate governance framework is kept under review. A report is provided to the board by the company secretary at least annually, recommending any improvements necessary to respond to changes to the company’s business or applicable legislation and standards.
Statement as at 12 May 2015.
DIRECTORS’ INTERESTS IN CSR SHARES
AS AT 12 MAY TOTAL 2015 TOTAL 2014
Jeremy Sutcliffe (chairman) 127,596 127,596
Kathleen Conlon 39,019 37,249
Michael Ihlein 56,976 55,542
Rebecca McGrath 27,483 25,808
Matthew Quinn 15,587 15,000
Rob Sindel 351,887 114,818
DIRECTORS’ MEETINGS
CSR BOARDRISK & AUDIT COMMITTEE
WORKPLACE HEALTH, SAFETY & ENVIRONMENT
COMMITTEE
REMUNERATION & HUMAN RESOURCES
COMMITTEE
YEAR ENDED 31 MARCH 2015 HELDa ATTENDEDb HELDa ATTENDEDb HELDa ATTENDEDb HELDa ATTENDEDb
Jeremy Sutcliffe 10 10 4 4 n/a n/a 5 5
Kathleen Conlon 10 10 n/a n/a n/a n/a 5 5
Michael Ihlein 10 10 4 4 4 3 n/a n/a
Rebecca McGrath 10 10 n/a n/a 4 4 5 4
Matthew Quinn 10 9 4 4 4 4 n/a n/a
Rob Sindel 10 10 4 4 4 4 5 5
a Meetings held while a member.b Meetings attended.
CSR ANNUAL REPORT 2015
CSR ANNUAL REPORT 2015 2322 CSR ANNUAL REPORT 2015
THIS REPORT FORMS PART OF THE DIRECTORS’ REPORT FOR THE YEAR ENDED 31 MARCH 2015
INTRODUCTIONThis remuneration report provides a summary of CSR’s remuneration policy and practices during the past financial year as they apply to CSR directors and executives.
The report begins with an executive summary intended to provide a ‘plain English’ explanation for shareholders of the CSR remuneration framework and key outcomes and events that occurred during the financial year. The report then outlines the role of the CSR Remuneration & Human Resources Committee, details CSR’s remuneration policy and practices and provides information on the remuneration and shareholdings of key management personnel (KMP). CSR’s KMP are the non-executive directors, the managing director and the chief financial officer.
Key points to note in relation to this report are:• the disclosures set out in this report have been prepared in accordance with the requirements of section 300A of the Corporations Act 2001 and
Corporations Regulation 2M.3.03;• the report has been audited by CSR’s external auditor;• as in YEM13 and YEM14 and following an assessment of senior executives against the criteria for determining KMP only the managing director
and chief financial officer qualify as KMP; • in the interests of transparency year on year analysis is also provided on remuneration for Senior Executives (as defined below); • in some cases, where aspects of the remuneration framework apply to other senior roles within CSR, the term “executive” is also used.
KEY MANAGEMENT PERSONNEL (KMP)KMP disclosed in this year’s report are detailed in the table below. KMP are as defined by the Accounting Standard AASB 124 Related Party Disclosures.
NAME POSITION TERM AS KMPNon-executive directors (NEDs)Jeremy Sutcliffe Chairman (July 2011) – Appointed: December 2008 Full yearKathleen Conlon Director – Appointed: December 2004 Full yearMichael Ihlein Director – Appointed: July 2011 Full yearRebecca McGrath Director – Appointed: February 2012 Full yearMatthew Quinn Director – Appointed: August 2013 Full yearExecutive KMPRob Sindel Managing Director Full yearGreg Barnes Chief Financial Officer Full year
SENIOR EXECUTIVESSenior Executives of CSR are detailed in the table below. These senior executives are not KMP as defined by AASB 124.
NAME POSITION TERM AS SENIOR EXECUTIVEIan Hardiman Executive General Manager – Lightweight Systems Full yearPeter Moeller Executive General Manager – Viridian Full yearLuke Murphy Executive General Manager – Human Resources Full yearNick Pezet Executive General Manager – Bricks and Roofing Full yearAnthony Tannous Executive General Manager – Bradford Full yearAndrew Mackenzie General Manager – Property Full yearMark White General Manager – Aluminium Full year
CONTENTS
A. Executive summary: – year ended 31 March 2015 (YEM15) remuneration framework update; – overview of executive remuneration approach and framework; – overview of non-executive director remuneration; – remuneration outcomes for YEM15; and – reviews undertaken of the remuneration framework.
B. The Remuneration & Human Resources Committee’s role;
C. Executive remuneration policy;
D. Executive remuneration framework;
E. Link between remuneration and company performance;
F. Executive Services Agreements;
G. Remuneration and shareholdings for YEM15 (and comparatives); and
H. Non-executive director remuneration.
REMUNERATION REPORT
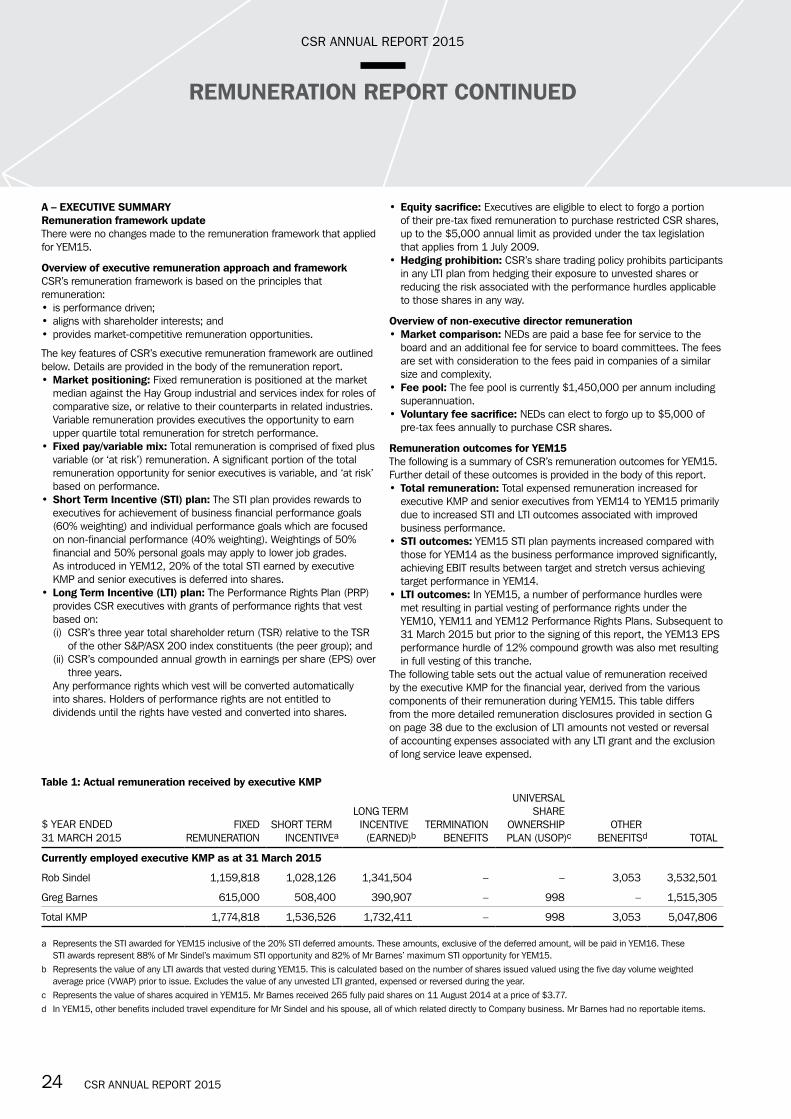
CSR ANNUAL REPORT 2015
CSR ANNUAL REPORT 2015 2524 CSR ANNUAL REPORT 2015
A – EXECUTIVE SUMMARYRemuneration framework updateThere were no changes made to the remuneration framework that applied for YEM15.
Overview of executive remuneration approach and frameworkCSR’s remuneration framework is based on the principles that remuneration:• is performance driven;• aligns with shareholder interests; and• provides market-competitive remuneration opportunities.
The key features of CSR’s executive remuneration framework are outlined below. Details are provided in the body of the remuneration report.• Market positioning: Fixed remuneration is positioned at the market
median against the Hay Group industrial and services index for roles of comparative size, or relative to their counterparts in related industries. Variable remuneration provides executives the opportunity to earn upper quartile total remuneration for stretch performance.
• Fixed pay/variable mix: Total remuneration is comprised of fixed plus variable (or ‘at risk’) remuneration. A significant portion of the total remuneration opportunity for senior executives is variable, and ‘at risk’ based on performance.
• Short Term Incentive (STI) plan: The STI plan provides rewards to executives for achievement of business financial performance goals (60% weighting) and individual performance goals which are focused on non-financial performance (40% weighting). Weightings of 50% financial and 50% personal goals may apply to lower job grades. As introduced in YEM12, 20% of the total STI earned by executive KMP and senior executives is deferred into shares.
• Long Term Incentive (LTI) plan: The Performance Rights Plan (PRP) provides CSR executives with grants of performance rights that vest based on:
(i) CSR’s three year total shareholder return (TSR) relative to the TSR of the other S&P/ASX 200 index constituents (the peer group); and
(ii) CSR’s compounded annual growth in earnings per share (EPS) over three years.
Any performance rights which vest will be converted automatically into shares. Holders of performance rights are not entitled to dividends until the rights have vested and converted into shares.
• Equity sacrifice: Executives are eligible to elect to forgo a portion of their pre-tax fixed remuneration to purchase restricted CSR shares, up to the $5,000 annual limit as provided under the tax legislation that applies from 1 July 2009.
• Hedging prohibition: CSR’s share trading policy prohibits participants in any LTI plan from hedging their exposure to unvested shares or reducing the risk associated with the performance hurdles applicable to those shares in any way.
Overview of non-executive director remuneration• Market comparison: NEDs are paid a base fee for service to the
board and an additional fee for service to board committees. The fees are set with consideration to the fees paid in companies of a similar size and complexity.
• Fee pool: The fee pool is currently $1,450,000 per annum including superannuation.
• Voluntary fee sacrifice: NEDs can elect to forgo up to $5,000 of pre-tax fees annually to purchase CSR shares.
Remuneration outcomes for YEM15 The following is a summary of CSR’s remuneration outcomes for YEM15. Further detail of these outcomes is provided in the body of this report.• Total remuneration: Total expensed remuneration increased for
executive KMP and senior executives from YEM14 to YEM15 primarily due to increased STI and LTI outcomes associated with improved business performance.
• STI outcomes: YEM15 STI plan payments increased compared with those for YEM14 as the business performance improved significantly, achieving EBIT results between target and stretch versus achieving target performance in YEM14.
• LTI outcomes: In YEM15, a number of performance hurdles were met resulting in partial vesting of performance rights under the YEM10, YEM11 and YEM12 Performance Rights Plans. Subsequent to 31 March 2015 but prior to the signing of this report, the YEM13 EPS performance hurdle of 12% compound growth was also met resulting in full vesting of this tranche.
The following table sets out the actual value of remuneration received by the executive KMP for the financial year, derived from the various components of their remuneration during YEM15. This table differs from the more detailed remuneration disclosures provided in section G on page 38 due to the exclusion of LTI amounts not vested or reversal of accounting expenses associated with any LTI grant and the exclusion of long service leave expensed.
REMUNERATION REPORT CONTINUED
Table 1: Actual remuneration received by executive KMP
$ YEAR ENDED 31 MARCH 2015
FIXED REMUNERATION
SHORT TERMINCENTIVEa
LONG TERM INCENTIVE(EARNED)b
TERMINATION BENEFITS
UNIVERSAL SHARE
OWNERSHIPPLAN (USOP)c
OTHERBENEFITSd TOTAL
Currently employed executive KMP as at 31 March 2015
Rob Sindel 1,159,818 1,028,126 1,341,504 – – 3,053 3,532,501
Greg Barnes 615,000 508,400 390,907 – 998 – 1,515,305
Total KMP 1,774,818 1,536,526 1,732,411 – 998 3,053 5,047,806
a Represents the STI awarded for YEM15 inclusive of the 20% STI deferred amounts. These amounts, exclusive of the deferred amount, will be paid in YEM16. These STI awards represent 88% of Mr Sindel’s maximum STI opportunity and 82% of Mr Barnes’ maximum STI opportunity for YEM15.
b Represents the value of any LTI awards that vested during YEM15. This is calculated based on the number of shares issued valued using the five day volume weighted average price (VWAP) prior to issue. Excludes the value of any unvested LTI granted, expensed or reversed during the year.
c Represents the value of shares acquired in YEM15. Mr Barnes received 265 fully paid shares on 11 August 2014 at a price of $3.77.d In YEM15, other benefits included travel expenditure for Mr Sindel and his spouse, all of which related directly to Company business. Mr Barnes had no reportable items.

CSR ANNUAL REPORT 2015
CSR ANNUAL REPORT 2015 2524 CSR ANNUAL REPORT 2015
Table 2: Senior executives – year on year remuneration analysisGiven the flat structure of the company and following a review of senior executives against the criteria for determining KMP, only the managing director and chief financial officer qualify as KMP.
The table below summarises the year on year change in total remuneration for senior executives. This analysis excludes the executive KMP, Mr Sindel and Mr Barnes. There were no termination payments made to any senior executives during the year. The year on year increase in total remuneration for senior executives was driven predominantly by the STI and LTI outcomes.
$ YEAR ENDED 31 MARCH
FIXEDREMUNERATIONb
% CHANGE IN FIXED
REMUNERATIONSHORT TERM
INCENTIVE
LONG TERM INCENTIVE (EARNED)b
TERMINATION BENEFITS USOP
OTHERBENEFITSc TOTAL
% CHANGE IN TOTAL
Senior executivesa
2014 3,025,278 1,730,682 – – 3,996 50,621 4,810,577
2015 3,165,581 4.6% 2,561,363 1,230,500 – 2,994 58,721 7,019,159 45.9%
a Senior executives are named in the introduction to this report. Other than two senior executives whose roles and remuneration were re-evaluated following market testing, the average increase in senior executives’ fixed remuneration was 2.7% for YEM15.
b Represents the value of any LTI awards that vested during YEM15. This is calculated based on the number of shares issued valued using the five day VWAP prior to issue. Excludes the value of any unvested LTI granted, expensed or reversed during the year.
c Other benefits included travel expenditure and relocation costs, all relating to company business or contractual obligations. The comparative figure has been updated to reflect items that are not subject to fringe benefit tax.
Reviews undertaken of the remuneration frameworkThe CSR board continues to monitor the remuneration framework to ensure ongoing alignment with shareholders and market practice. Following a detailed review of the LTI plan, the board has determined two changes for the YEM16 Performance Rights Plan (PRP):(i) the performance period will be assessed over three years with the removal of the re-test on the fourth anniversary. In removing the re-test,
there were no changes made to remuneration or the overall LTI quantum. Grants will continue to be made on face value; and(ii) the performance period for both TSR (Tranche A) and EPS (Tranche B) will be aligned to end on 31 March. Previously, the TSR tranche was
assessed in July each year. This change is made to provide a simpler plan for shareholders and participants as well as administrators of the PRP.
Any other changes made by the CSR board will be disclosed in the YEM16 remuneration report.
B – THE REMUNERATION & HUMAN RESOURCES COMMITTEE’S ROLEWhilst the board retains ultimate responsibility, CSR’s remuneration policy is implemented by the board operating through its Remuneration & Human Resources Committee. The composition and functions of the Remuneration & Human Resources Committee, which oversees remuneration issues and human resources matters, are set out in the charter available from the CSR website. The charter was reviewed and updated during the year.
The role of the committee is to review and make recommendations to the board on (but not limited to):• remuneration of NEDs;• remuneration of the managing director and senior executives;• incentive scheme policies and guidelines for executives;• talent management – including succession planning; • initiatives to improve and drive a strong performance culture; and• diversity.
Throughout the year, the Remuneration & Human Resources Committee and management received information from external providers Ernst and Young, Hay Group, Herbert Smith Freehills, Mercer Consulting (Australia) Pty Ltd and Deloitte Touche Tohmatsu related to remuneration market data and analysis, market practice on the structure and design of incentive programs (both long term and short term), performance testing of existing long term incentives and legislative and regulatory requirements.
Support to the committee is provided through CSR’s executive general manager – human resources.
No remuneration recommendations were sought from remuneration consultants during YEM15.
REMUNERATION REPORT CONTINUED
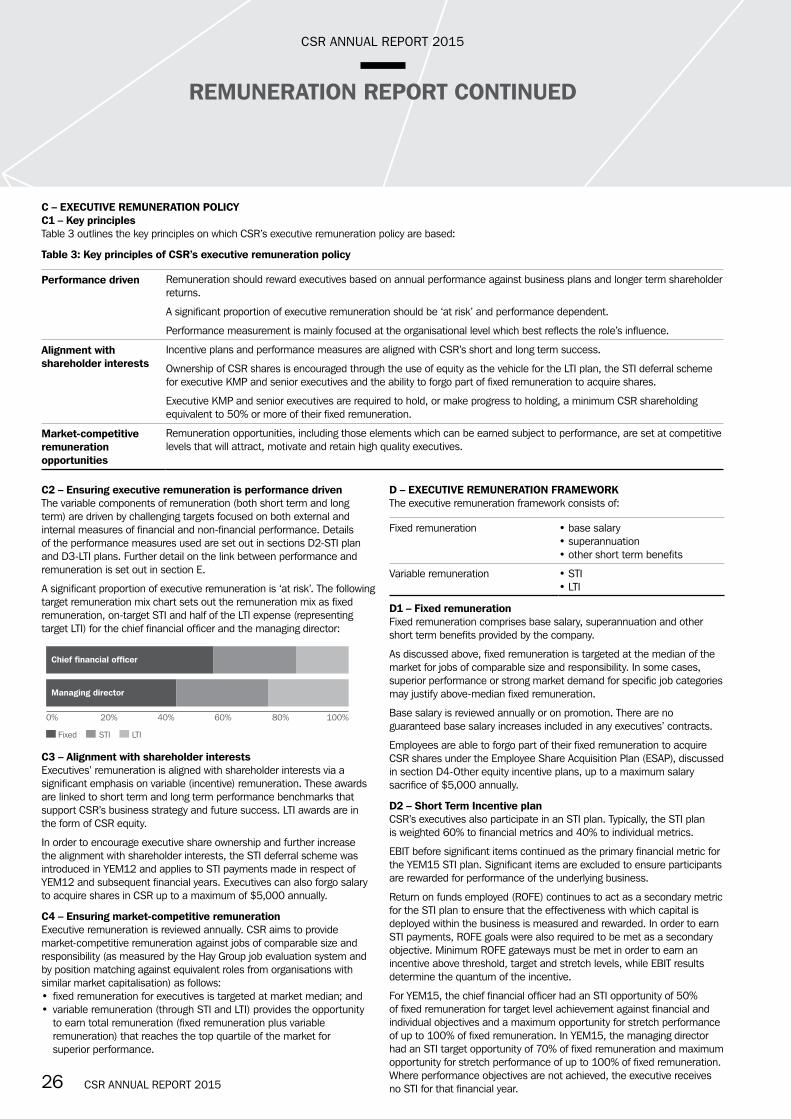
CSR ANNUAL REPORT 2015
CSR ANNUAL REPORT 2015 2726 CSR ANNUAL REPORT 2015
C – EXECUTIVE REMUNERATION POLICYC1 – Key principlesTable 3 outlines the key principles on which CSR’s executive remuneration policy are based:
Table 3: Key principles of CSR’s executive remuneration policy
Performance driven Remuneration should reward executives based on annual performance against business plans and longer term shareholder returns.
A significant proportion of executive remuneration should be ‘at risk’ and performance dependent.
Performance measurement is mainly focused at the organisational level which best reflects the role’s influence.
Alignment with shareholder interests
Incentive plans and performance measures are aligned with CSR’s short and long term success.
Ownership of CSR shares is encouraged through the use of equity as the vehicle for the LTI plan, the STI deferral scheme for executive KMP and senior executives and the ability to forgo part of fixed remuneration to acquire shares.
Executive KMP and senior executives are required to hold, or make progress to holding, a minimum CSR shareholding equivalent to 50% or more of their fixed remuneration.
Market-competitive remuneration opportunities
Remuneration opportunities, including those elements which can be earned subject to performance, are set at competitive levels that will attract, motivate and retain high quality executives.
REMUNERATION REPORT CONTINUED
C2 – Ensuring executive remuneration is performance drivenThe variable components of remuneration (both short term and long term) are driven by challenging targets focused on both external and internal measures of financial and non-financial performance. Details of the performance measures used are set out in sections D2-STI plan and D3-LTI plans. Further detail on the link between performance and remuneration is set out in section E.
A significant proportion of executive remuneration is ‘at risk’. The following target remuneration mix chart sets out the remuneration mix as fixed remuneration, on-target STI and half of the LTI expense (representing target LTI) for the chief financial officer and the managing director:
Chief financial officer
0%
Fixed STI LTI
20% 40% 60% 80% 100%
Managing director
C3 – Alignment with shareholder interestsExecutives’ remuneration is aligned with shareholder interests via a significant emphasis on variable (incentive) remuneration. These awards are linked to short term and long term performance benchmarks that support CSR’s business strategy and future success. LTI awards are in the form of CSR equity.
In order to encourage executive share ownership and further increase the alignment with shareholder interests, the STI deferral scheme was introduced in YEM12 and applies to STI payments made in respect of YEM12 and subsequent financial years. Executives can also forgo salary to acquire shares in CSR up to a maximum of $5,000 annually.
C4 – Ensuring market-competitive remunerationExecutive remuneration is reviewed annually. CSR aims to provide market-competitive remuneration against jobs of comparable size and responsibility (as measured by the Hay Group job evaluation system and by position matching against equivalent roles from organisations with similar market capitalisation) as follows:• fixed remuneration for executives is targeted at market median; and• variable remuneration (through STI and LTI) provides the opportunity
to earn total remuneration (fixed remuneration plus variable remuneration) that reaches the top quartile of the market for superior performance.
D – EXECUTIVE REMUNERATION FRAMEWORKThe executive remuneration framework consists of:
Fixed remuneration • base salary• superannuation• other short term benefits
Variable remuneration • STI• LTI
D1 – Fixed remunerationFixed remuneration comprises base salary, superannuation and other short term benefits provided by the company.
As discussed above, fixed remuneration is targeted at the median of the market for jobs of comparable size and responsibility. In some cases, superior performance or strong market demand for specific job categories may justify above-median fixed remuneration.
Base salary is reviewed annually or on promotion. There are no guaranteed base salary increases included in any executives’ contracts.
Employees are able to forgo part of their fixed remuneration to acquire CSR shares under the Employee Share Acquisition Plan (ESAP), discussed in section D4-Other equity incentive plans, up to a maximum salary sacrifice of $5,000 annually.
D2 – Short Term Incentive planCSR’s executives also participate in an STI plan. Typically, the STI plan is weighted 60% to financial metrics and 40% to individual metrics.
EBIT before significant items continued as the primary financial metric for the YEM15 STI plan. Significant items are excluded to ensure participants are rewarded for performance of the underlying business.
Return on funds employed (ROFE) continues to act as a secondary metric for the STI plan to ensure that the effectiveness with which capital is deployed within the business is measured and rewarded. In order to earn STI payments, ROFE goals were also required to be met as a secondary objective. Minimum ROFE gateways must be met in order to earn an incentive above threshold, target and stretch levels, while EBIT results determine the quantum of the incentive.
For YEM15, the chief financial officer had an STI opportunity of 50% of fixed remuneration for target level achievement against financial and individual objectives and a maximum opportunity for stretch performance of up to 100% of fixed remuneration. In YEM15, the managing director had an STI target opportunity of 70% of fixed remuneration and maximum opportunity for stretch performance of up to 100% of fixed remuneration. Where performance objectives are not achieved, the executive receives no STI for that financial year.
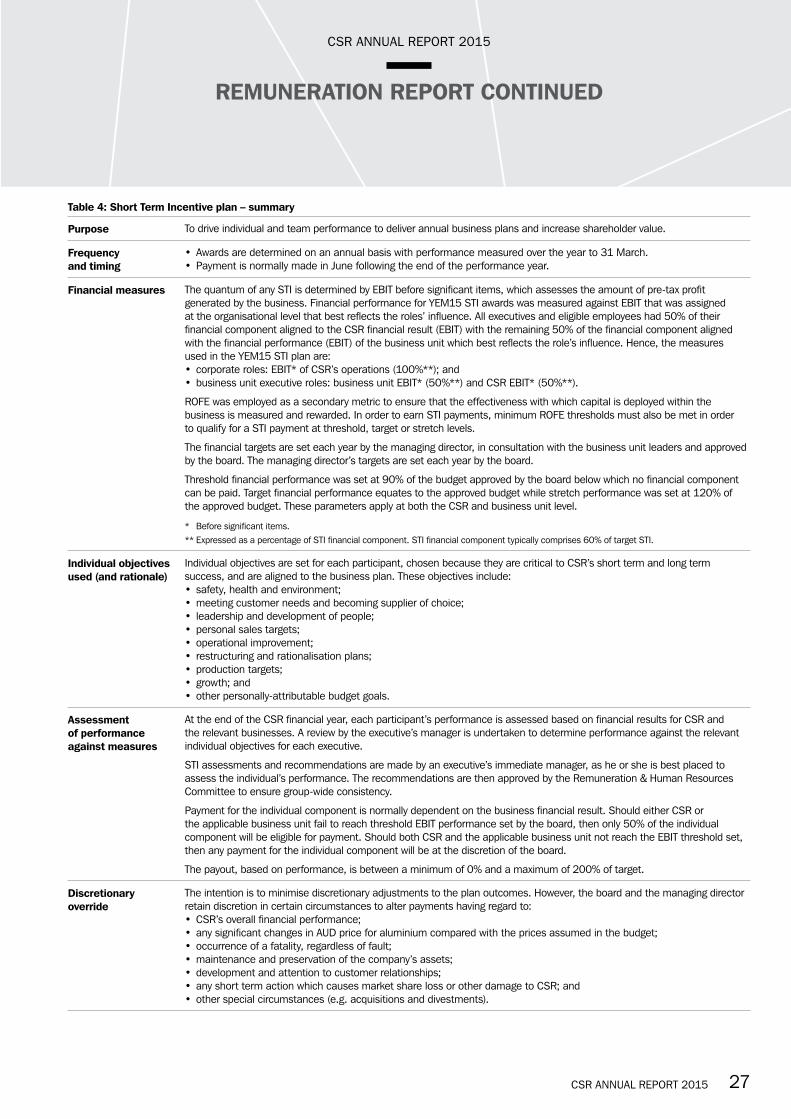
CSR ANNUAL REPORT 2015
CSR ANNUAL REPORT 2015 2726 CSR ANNUAL REPORT 2015
Table 4: Short Term Incentive plan – summary
Purpose To drive individual and team performance to deliver annual business plans and increase shareholder value.
Frequency and timing
• Awards are determined on an annual basis with performance measured over the year to 31 March.• Payment is normally made in June following the end of the performance year.
Financial measures The quantum of any STI is determined by EBIT before significant items, which assesses the amount of pre-tax profit generated by the business. Financial performance for YEM15 STI awards was measured against EBIT that was assigned at the organisational level that best reflects the roles’ influence. All executives and eligible employees had 50% of their financial component aligned to the CSR financial result (EBIT) with the remaining 50% of the financial component aligned with the financial performance (EBIT) of the business unit which best reflects the role’s influence. Hence, the measures used in the YEM15 STI plan are:• corporate roles: EBIT* of CSR’s operations (100%**); and• business unit executive roles: business unit EBIT* (50%**) and CSR EBIT* (50%**).
ROFE was employed as a secondary metric to ensure that the effectiveness with which capital is deployed within the business is measured and rewarded. In order to earn STI payments, minimum ROFE thresholds must also be met in order to qualify for a STI payment at threshold, target or stretch levels.
The financial targets are set each year by the managing director, in consultation with the business unit leaders and approved by the board. The managing director’s targets are set each year by the board.
Threshold financial performance was set at 90% of the budget approved by the board below which no financial component can be paid. Target financial performance equates to the approved budget while stretch performance was set at 120% of the approved budget. These parameters apply at both the CSR and business unit level.
* Before significant items.** Expressed as a percentage of STI financial component. STI financial component typically comprises 60% of target STI.
Individual objectives used (and rationale)
Individual objectives are set for each participant, chosen because they are critical to CSR’s short term and long term success, and are aligned to the business plan. These objectives include:• safety, health and environment;• meeting customer needs and becoming supplier of choice;• leadership and development of people;• personal sales targets;• operational improvement;• restructuring and rationalisation plans;• production targets;• growth; and• other personally-attributable budget goals.
Assessment of performance against measures
At the end of the CSR financial year, each participant’s performance is assessed based on financial results for CSR and the relevant businesses. A review by the executive’s manager is undertaken to determine performance against the relevant individual objectives for each executive.
STI assessments and recommendations are made by an executive’s immediate manager, as he or she is best placed to assess the individual’s performance. The recommendations are then approved by the Remuneration & Human Resources Committee to ensure group-wide consistency.
Payment for the individual component is normally dependent on the business financial result. Should either CSR or the applicable business unit fail to reach threshold EBIT performance set by the board, then only 50% of the individual component will be eligible for payment. Should both CSR and the applicable business unit not reach the EBIT threshold set, then any payment for the individual component will be at the discretion of the board.
The payout, based on performance, is between a minimum of 0% and a maximum of 200% of target.
Discretionary override
The intention is to minimise discretionary adjustments to the plan outcomes. However, the board and the managing director retain discretion in certain circumstances to alter payments having regard to:• CSR’s overall financial performance;• any significant changes in AUD price for aluminium compared with the prices assumed in the budget;• occurrence of a fatality, regardless of fault;• maintenance and preservation of the company’s assets;• development and attention to customer relationships;• any short term action which causes market share loss or other damage to CSR; and• other special circumstances (e.g. acquisitions and divestments).
REMUNERATION REPORT CONTINUED

CSR ANNUAL REPORT 2015
CSR ANNUAL REPORT 2015 2928 CSR ANNUAL REPORT 2015
Service condition New starters with CSR or people promoted into eligible roles can participate in the STI with pro-rata entitlements if they have been in the role for more than three months of the relevant financial year.
For staff who retire, die or are retrenched during the performance period, the managing director and the board have discretion in awarding a payment.
No payment will be made to participants who cease employment voluntarily, or have their employment terminated for inadequate performance or misconduct, before the end of the performance year.
Equity deferral Under the STI deferral scheme, 20% of any STI earned by senior executives is delivered in CSR shares. These shares must be held in trust subject to trading restrictions and have a continued service requirement for a minimum of two years from the date of allocation. During this restriction period, the shares are subject to forfeiture if the executive resigns or is terminated for cause. No further performance conditions will apply and shares will fully vest to the executive at the end of the restriction period if the continued service requirement is met. As the shares are awarded in lieu of a full cash STI payment and relate to an incentive that has already been earned, the board has determined that during the restriction period, executives will be entitled to all dividend and voting entitlements applying to the shares held on trust in their name. An important feature of the STI deferral plan rules is the clawback provisions which can allow the board to withhold some or all of the deferred equity in the event of fraud, financial errors, misstatement or misrepresentations.
REMUNERATION REPORT CONTINUED
D3 – Long Term Incentive plansPurposeDuring the financial year, eligible executives were invited to participate in CSR’s LTI program, which aims to:• provide executives with performance rights in order to build their
interest in CSR equity; and• attract, motivate and retain the necessary executive talent to
deliver and sustain business performance and increase returns to shareholders. All securities referred to in this report are granted by CSR Limited.
CSR’s executive LTI plansUnder the PRP, participants are granted performance rights subject to a three year vesting period and associated performance hurdles. The YEM10 and YEM11 PRP performance hurdles were based on CSR’s TSR over the performance period of three years with subsequent performance subject to a second and final test in years four and five. On vesting of performance rights, CSR shares will be provided at no cost to the participant. If there is no, or partial, vesting of the performance rights after the initial performance hurdle test, there will be opportunities for a second and final test of performance on the fourth and fifth grant date anniversaries (YEM10 and YEM11 plans only). 50% of the performance rights will vest if the TSR of CSR equals the median TSR of the constituents of the S&P/ASX 200 index (defined at date of grant), and 100% will vest for upper quartile performance.
In YEM12, two changes were made to PRP which have been applied consistently to all grants since that time. Firstly, the removal of the second re-test on the fifth year anniversary date. As a result, all grants from YEM12 have an initial three year performance period with a single and final re-test on the fourth anniversary. Secondly, the introduction of an additional performance condition based upon the annual compound EPS growth over the performance period. EPS is defined as net profit after tax per share and is calculated pre significant items. 50% of PRP grants are subject to CSR’s TSR performance against the comparator group (Tranche A) and 50% are based upon compound EPS growth (Tranche B) relative to specified targets.
The following vesting schedules apply for these tranches for all PRPs from YEM12 to YEM15:
TSR OF CSR RELATIVE TO THE PEER GROUP
PROPORTION OF TRANCHE A TO VEST
Below the 50th percentile 0%At the 50th percentile 50%Between the 50th percentile and the 75th percentile
Straight-line vesting between 50% and 100% (e.g. each percentile improvement will result in an additional 2% vesting)
75th percentile or greater 100%
EPS TARGET RANGE (COMPOUND GROWTH PER ANNUM)
PROPORTION OF TRANCHE B TO VEST
Below 7% compound EPS 0%Equal to 7% compound EPS 50%Between 7% and 12% compound EPS
Between 50% and 100% increasing on a straight-line basis
Greater than 12% compound EPS 100%
Other features of the PRP are as follows:• LTI participation eligibility is restricted to the managing director and
his direct reports and other selected roles within CSR;• under the PRP, participants are not entitled to dividends in respect
of unvested performance rights; and• consistent with the prohibitions under the Corporations Act 2001,
the CSR Share Trading Policy prohibits participants hedging their exposure risk in relation to unvested performance rights or reducing the risk associated with the performance hurdles applicable to those performance rights in any way. Under the policy, participants forfeit their interest in unvested shares (i.e. shares that have not met the performance hurdles) if they enter into any hedging transaction in relation to those shares.
Historically, the CSR executive LTI plan was the Cash Award Share Plan (CASP). There have been no CASP grants since 2009. The 2009 CASP plan concluded on 20 July 2014 and no vesting condition was met.
On 3 March 2011, CSR shares underwent a 3:1 consolidation. The consolidation applied to existing grants under CSR’s LTI plans which equated to a reduction in the number of shares or rights by two-thirds. The impact of the share consolidation on LTI grants to KMP under the PRP is disclosed in section G.
Table 4: Short Term Incentive plan – summary (continued)

CSR ANNUAL REPORT 2015
CSR ANNUAL REPORT 2015 2928 CSR ANNUAL REPORT 2015
Operation of LTI plans for YEM15The operation of the LTI plans for YEM15 is described in more detail below:
Table 5: Long Term Incentive plans – summary of the PRP
Participation Managing director, direct reports and selected key roles are eligible subject to approval by the board.
Grant frequency Grants are intended to be made on an annual basis.
Type of award Grants of performance rights subject to service requirements and performance vesting criteria.
If performance conditions are met, CSR shares will be purchased and transferred to participants.
Refer to ‘Performance period and conditions’ below for more detail.
Vesting/ performance period
Under the YEM15 PRP, awards are initially subject to a three year vesting period. Immediately following completion of the vesting period, the performance conditions (detailed below) are tested to determine whether, and to what extent, awards vest. If some or all of the awards do not vest at the initial test date, they are carried forward and re-tested over a four year performance period to determine if any additional vesting is achieved.
Performance period and conditions
For YEM12 to YEM15 PRP grants, two equally weighted (50%) performance hurdles are applied and assessed over the performance period as follows:
(i) relative TSR (Tranche A)• TSR measures the percentage growth in shareholder value, taking into account share price growth, dividends and
capital returns;• TSR performance is assessed against the constituents of the S&P/ASX200 index defined at the start of the
performance period;• if CSR’s TSR equals the median TSR of the constituents of the S&P/ASX200 index over the performance period,
50% of the grant of performance rights will vest;• if CSR’s TSR equals the upper quartile TSR of the constituents of the S&P/ASX200 index over the performance
period, 100% of the grant of performance rights will vest;• for TSR performance between the median and the upper quartile TSR of the constituents of the S&P/ASX
200 index over the performance period, each percentile improvement will result in an additional 2% vesting (i.e. straight-line vesting between 50% and 100%);
• to the extent that performance rights have not vested following the three year testing dates, the performance period will be extended by 12 months; and
• for the purposes of the TSR calculation, the start and end share prices will be calculated based on ten trading day VWAP.
The initial testing period for YEM15 awards commenced on 23 July 2014, finishes on or around 22 July 2017, and can extend to 22 July 2018 or such other period as the board dictates.
(ii) EPS (Tranche B)• the annual compound EPS growth over the period from commencement of the performance period to the
test date;• EPS is defined as net profit after tax per share pre significant items. The board may adjust EPS to exclude the
effects of material business acquisitions or divestments and for certain one off costs;• the board sets a threshold vesting schedule of 7% compound growth in EPS per year. In the event that this
7% compound growth in EPS is achieved, then 50% of this component would vest progressing on a straight-line basis to 100% vesting for achieving a 12% compound growth in EPS;
• to the extent any performance rights that are tested against this hurdle remain unvested at the end of the initial three year period, the performance period will be extended and performance will be subject to a second and final test at the end of the four year period; and
• the second and final test at the end of the four year period will be done based on the entire applicable four year period (i.e. the EPS targets will be compounded for four years rather than three).
The initial testing period for YEM15 awards commenced on 1 April 2014, finishes on 31 March 2017, and can extend to 31 March 2018 or such other period as the board dictates.
For either tranche, participants will forfeit their interests in any performance rights that remain unvested after the second and final test.
Performance for both tranches is measured over this period to ensure that the long term measurement of performance under the plan is not distorted by business and commodity cycles or capital investment decisions.
REMUNERATION REPORT CONTINUED
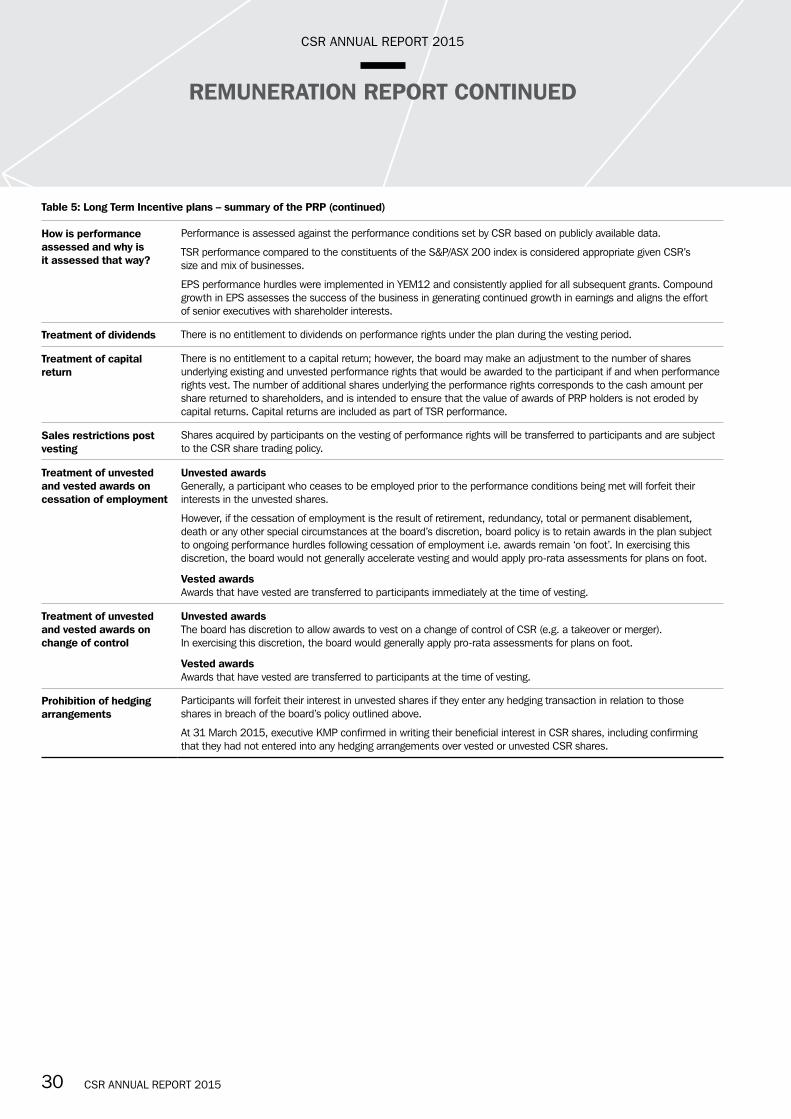
CSR ANNUAL REPORT 2015
CSR ANNUAL REPORT 2015 3130 CSR ANNUAL REPORT 2015
How is performance assessed and why is it assessed that way?
Performance is assessed against the performance conditions set by CSR based on publicly available data.
TSR performance compared to the constituents of the S&P/ASX 200 index is considered appropriate given CSR’s size and mix of businesses.
EPS performance hurdles were implemented in YEM12 and consistently applied for all subsequent grants. Compound growth in EPS assesses the success of the business in generating continued growth in earnings and aligns the effort of senior executives with shareholder interests.
Treatment of dividends There is no entitlement to dividends on performance rights under the plan during the vesting period.
Treatment of capital return
There is no entitlement to a capital return; however, the board may make an adjustment to the number of shares underlying existing and unvested performance rights that would be awarded to the participant if and when performance rights vest. The number of additional shares underlying the performance rights corresponds to the cash amount per share returned to shareholders, and is intended to ensure that the value of awards of PRP holders is not eroded by capital returns. Capital returns are included as part of TSR performance.
Sales restrictions post vesting
Shares acquired by participants on the vesting of performance rights will be transferred to participants and are subject to the CSR share trading policy.
Treatment of unvested and vested awards on cessation of employment
Unvested awardsGenerally, a participant who ceases to be employed prior to the performance conditions being met will forfeit their interests in the unvested shares.
However, if the cessation of employment is the result of retirement, redundancy, total or permanent disablement, death or any other special circumstances at the board’s discretion, board policy is to retain awards in the plan subject to ongoing performance hurdles following cessation of employment i.e. awards remain ‘on foot’. In exercising this discretion, the board would not generally accelerate vesting and would apply pro-rata assessments for plans on foot.
Vested awardsAwards that have vested are transferred to participants immediately at the time of vesting.
Treatment of unvested and vested awards on change of control
Unvested awardsThe board has discretion to allow awards to vest on a change of control of CSR (e.g. a takeover or merger). In exercising this discretion, the board would generally apply pro-rata assessments for plans on foot.
Vested awardsAwards that have vested are transferred to participants at the time of vesting.
Prohibition of hedging arrangements
Participants will forfeit their interest in unvested shares if they enter any hedging transaction in relation to those shares in breach of the board’s policy outlined above.
At 31 March 2015, executive KMP confirmed in writing their beneficial interest in CSR shares, including confirming that they had not entered into any hedging arrangements over vested or unvested CSR shares.
REMUNERATION REPORT CONTINUED
Table 5: Long Term Incentive plans – summary of the PRP (continued)
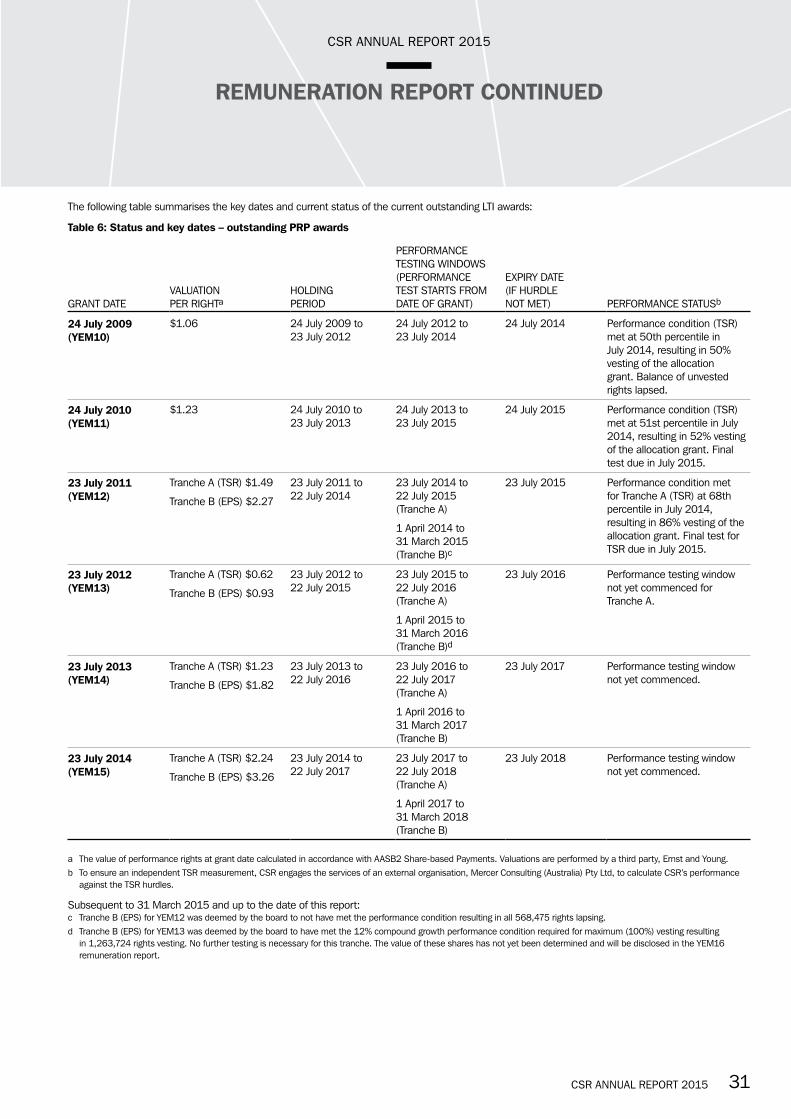
CSR ANNUAL REPORT 2015
CSR ANNUAL REPORT 2015 3130 CSR ANNUAL REPORT 2015
The following table summarises the key dates and current status of the current outstanding LTI awards:
Table 6: Status and key dates – outstanding PRP awards
GRANT DATEVALUATION PER RIGHTa
HOLDING PERIOD
PERFORMANCE TESTING WINDOWS (PERFORMANCE TEST STARTS FROM DATE OF GRANT)
EXPIRY DATE (IF HURDLE NOT MET) PERFORMANCE STATUSb
24 July 2009 (YEM10)
$1.06 24 July 2009 to 23 July 2012
24 July 2012 to 23 July 2014
24 July 2014 Performance condition (TSR) met at 50th percentile in July 2014, resulting in 50% vesting of the allocation grant. Balance of unvested rights lapsed.
24 July 2010 (YEM11)
$1.23 24 July 2010 to 23 July 2013
24 July 2013 to 23 July 2015
24 July 2015 Performance condition (TSR) met at 51st percentile in July 2014, resulting in 52% vesting of the allocation grant. Final test due in July 2015.
23 July 2011 (YEM12)
Tranche A (TSR) $1.49
Tranche B (EPS) $2.27
23 July 2011 to 22 July 2014
23 July 2014 to 22 July 2015 (Tranche A)
1 April 2014 to 31 March 2015 (Tranche B)c
23 July 2015 Performance condition met for Tranche A (TSR) at 68th percentile in July 2014, resulting in 86% vesting of the allocation grant. Final test for TSR due in July 2015.
23 July 2012 (YEM13)
Tranche A (TSR) $0.62
Tranche B (EPS) $0.93
23 July 2012 to 22 July 2015
23 July 2015 to 22 July 2016 (Tranche A)
1 April 2015 to 31 March 2016 (Tranche B)d
23 July 2016 Performance testing window not yet commenced for Tranche A.
23 July 2013 (YEM14)
Tranche A (TSR) $1.23
Tranche B (EPS) $1.82
23 July 2013 to 22 July 2016
23 July 2016 to 22 July 2017 (Tranche A)
1 April 2016 to 31 March 2017 (Tranche B)
23 July 2017 Performance testing window not yet commenced.
23 July 2014 (YEM15)
Tranche A (TSR) $2.24
Tranche B (EPS) $3.26
23 July 2014 to 22 July 2017
23 July 2017 to 22 July 2018 (Tranche A)
1 April 2017 to 31 March 2018 (Tranche B)
23 July 2018 Performance testing window not yet commenced.
a The value of performance rights at grant date calculated in accordance with AASB2 Share-based Payments. Valuations are performed by a third party, Ernst and Young.b To ensure an independent TSR measurement, CSR engages the services of an external organisation, Mercer Consulting (Australia) Pty Ltd, to calculate CSR’s performance
against the TSR hurdles.
Subsequent to 31 March 2015 and up to the date of this report: c Tranche B (EPS) for YEM12 was deemed by the board to not have met the performance condition resulting in all 568,475 rights lapsing. d Tranche B (EPS) for YEM13 was deemed by the board to have met the 12% compound growth performance condition required for maximum (100%) vesting resulting
in 1,263,724 rights vesting. No further testing is necessary for this tranche. The value of these shares has not yet been determined and will be disclosed in the YEM16 remuneration report.
REMUNERATION REPORT CONTINUED
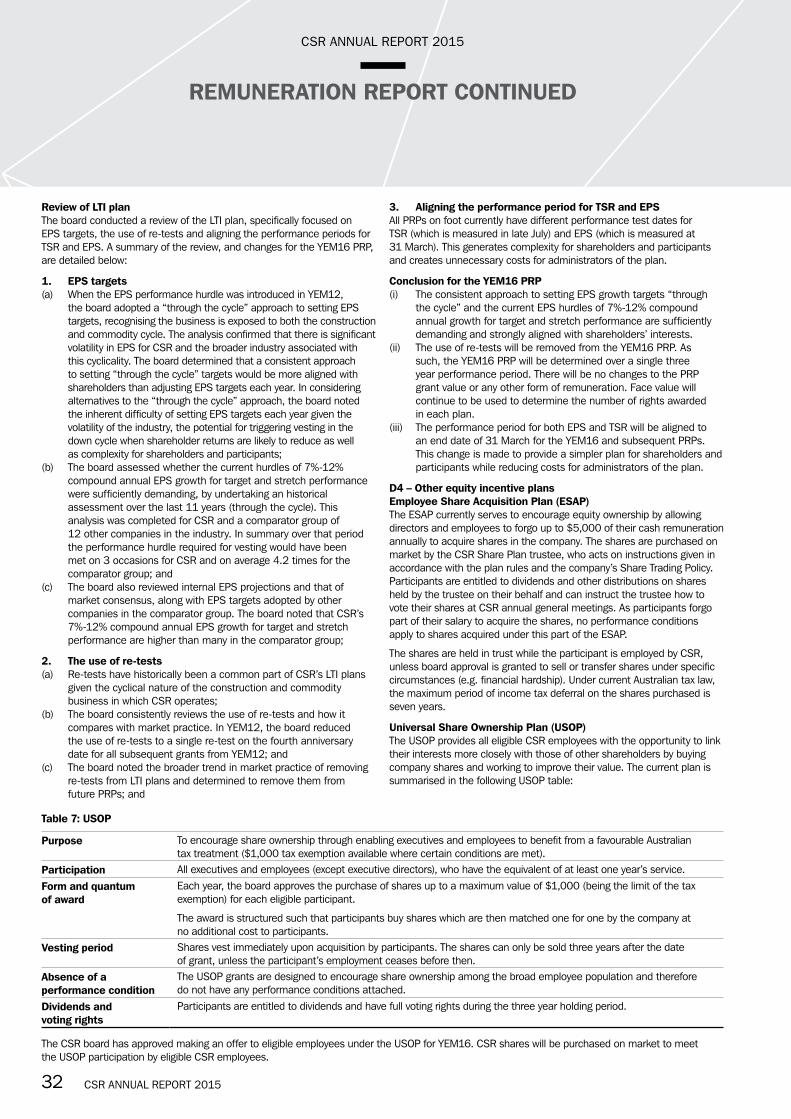
CSR ANNUAL REPORT 2015
CSR ANNUAL REPORT 2015 3332 CSR ANNUAL REPORT 2015
Review of LTI planThe board conducted a review of the LTI plan, specifically focused on EPS targets, the use of re-tests and aligning the performance periods for TSR and EPS. A summary of the review, and changes for the YEM16 PRP, are detailed below:
1. EPS targets(a) When the EPS performance hurdle was introduced in YEM12,
the board adopted a “through the cycle” approach to setting EPS targets, recognising the business is exposed to both the construction and commodity cycle. The analysis confirmed that there is significant volatility in EPS for CSR and the broader industry associated with this cyclicality. The board determined that a consistent approach to setting “through the cycle” targets would be more aligned with shareholders than adjusting EPS targets each year. In considering alternatives to the “through the cycle” approach, the board noted the inherent difficulty of setting EPS targets each year given the volatility of the industry, the potential for triggering vesting in the down cycle when shareholder returns are likely to reduce as well as complexity for shareholders and participants;
(b) The board assessed whether the current hurdles of 7%-12% compound annual EPS growth for target and stretch performance were sufficiently demanding, by undertaking an historical assessment over the last 11 years (through the cycle). This analysis was completed for CSR and a comparator group of 12 other companies in the industry. In summary over that period the performance hurdle required for vesting would have been met on 3 occasions for CSR and on average 4.2 times for the comparator group; and
(c) The board also reviewed internal EPS projections and that of market consensus, along with EPS targets adopted by other companies in the comparator group. The board noted that CSR’s 7%-12% compound annual EPS growth for target and stretch performance are higher than many in the comparator group;
2. The use of re-tests(a) Re-tests have historically been a common part of CSR’s LTI plans
given the cyclical nature of the construction and commodity business in which CSR operates;
(b) The board consistently reviews the use of re-tests and how it compares with market practice. In YEM12, the board reduced the use of re-tests to a single re-test on the fourth anniversary date for all subsequent grants from YEM12; and
(c) The board noted the broader trend in market practice of removing re-tests from LTI plans and determined to remove them from future PRPs; and
3. Aligning the performance period for TSR and EPSAll PRPs on foot currently have different performance test dates for TSR (which is measured in late July) and EPS (which is measured at 31 March). This generates complexity for shareholders and participants and creates unnecessary costs for administrators of the plan.
Conclusion for the YEM16 PRP(i) The consistent approach to setting EPS growth targets “through
the cycle” and the current EPS hurdles of 7%-12% compound annual growth for target and stretch performance are sufficiently demanding and strongly aligned with shareholders’ interests.
(ii) The use of re-tests will be removed from the YEM16 PRP. As such, the YEM16 PRP will be determined over a single three year performance period. There will be no changes to the PRP grant value or any other form of remuneration. Face value will continue to be used to determine the number of rights awarded in each plan.
(iii) The performance period for both EPS and TSR will be aligned to an end date of 31 March for the YEM16 and subsequent PRPs. This change is made to provide a simpler plan for shareholders and participants while reducing costs for administrators of the plan.
D4 – Other equity incentive plansEmployee Share Acquisition Plan (ESAP)The ESAP currently serves to encourage equity ownership by allowing directors and employees to forgo up to $5,000 of their cash remuneration annually to acquire shares in the company. The shares are purchased on market by the CSR Share Plan trustee, who acts on instructions given in accordance with the plan rules and the company’s Share Trading Policy. Participants are entitled to dividends and other distributions on shares held by the trustee on their behalf and can instruct the trustee how to vote their shares at CSR annual general meetings. As participants forgo part of their salary to acquire the shares, no performance conditions apply to shares acquired under this part of the ESAP.
The shares are held in trust while the participant is employed by CSR, unless board approval is granted to sell or transfer shares under specific circumstances (e.g. financial hardship). Under current Australian tax law, the maximum period of income tax deferral on the shares purchased is seven years.
Universal Share Ownership Plan (USOP)The USOP provides all eligible CSR employees with the opportunity to link their interests more closely with those of other shareholders by buying company shares and working to improve their value. The current plan is summarised in the following USOP table:
Table 7: USOP
Purpose To encourage share ownership through enabling executives and employees to benefit from a favourable Australian tax treatment ($1,000 tax exemption available where certain conditions are met).
Participation All executives and employees (except executive directors), who have the equivalent of at least one year’s service.
Form and quantum of award
Each year, the board approves the purchase of shares up to a maximum value of $1,000 (being the limit of the tax exemption) for each eligible participant.
The award is structured such that participants buy shares which are then matched one for one by the company at no additional cost to participants.
Vesting period Shares vest immediately upon acquisition by participants. The shares can only be sold three years after the date of grant, unless the participant’s employment ceases before then.
Absence of a performance condition
The USOP grants are designed to encourage share ownership among the broad employee population and therefore do not have any performance conditions attached.
Dividends and voting rights
Participants are entitled to dividends and have full voting rights during the three year holding period.
The CSR board has approved making an offer to eligible employees under the USOP for YEM16. CSR shares will be purchased on market to meet the USOP participation by eligible CSR employees.
REMUNERATION REPORT CONTINUED
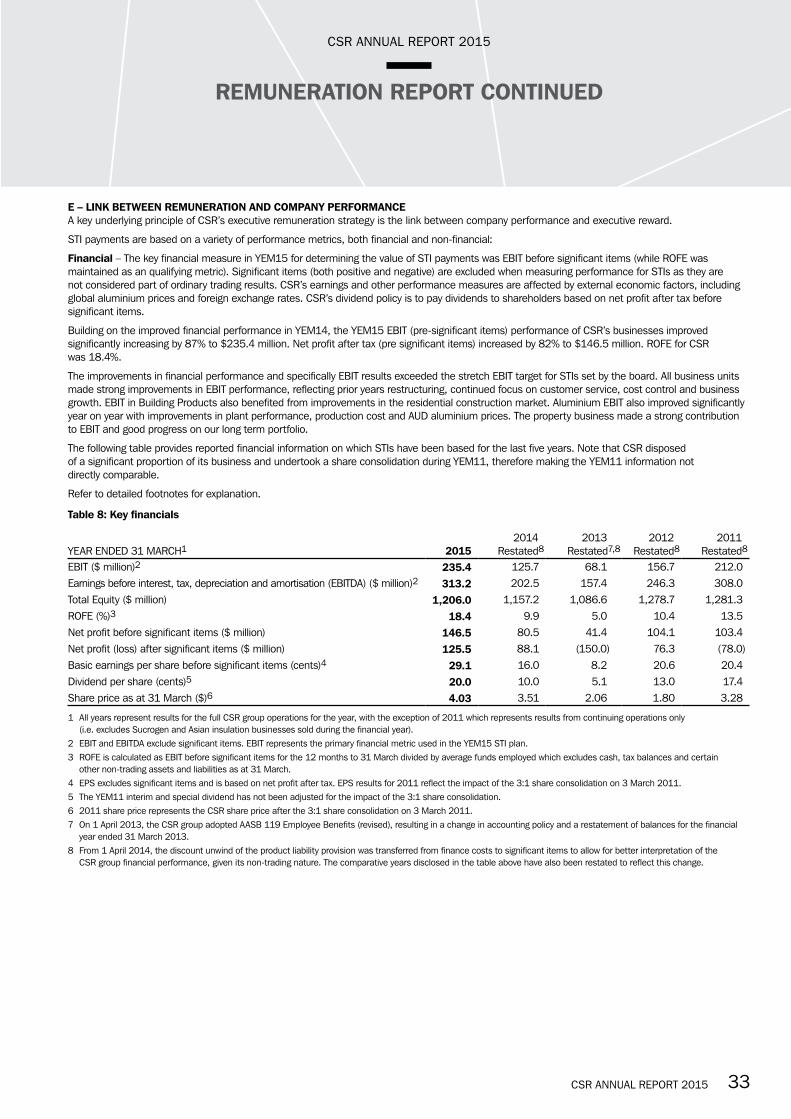
CSR ANNUAL REPORT 2015
CSR ANNUAL REPORT 2015 3332 CSR ANNUAL REPORT 2015
E – LINK BETWEEN REMUNERATION AND COMPANY PERFORMANCE A key underlying principle of CSR’s executive remuneration strategy is the link between company performance and executive reward.
STI payments are based on a variety of performance metrics, both financial and non-financial:
Financial – The key financial measure in YEM15 for determining the value of STI payments was EBIT before significant items (while ROFE was maintained as an qualifying metric). Significant items (both positive and negative) are excluded when measuring performance for STIs as they are not considered part of ordinary trading results. CSR’s earnings and other performance measures are affected by external economic factors, including global aluminium prices and foreign exchange rates. CSR’s dividend policy is to pay dividends to shareholders based on net profit after tax before significant items.
Building on the improved financial performance in YEM14, the YEM15 EBIT (pre-significant items) performance of CSR’s businesses improved significantly increasing by 87% to $235.4 million. Net profit after tax (pre significant items) increased by 82% to $146.5 million. ROFE for CSR was 18.4%.
The improvements in financial performance and specifically EBIT results exceeded the stretch EBIT target for STIs set by the board. All business units made strong improvements in EBIT performance, reflecting prior years restructuring, continued focus on customer service, cost control and business growth. EBIT in Building Products also benefited from improvements in the residential construction market. Aluminium EBIT also improved significantly year on year with improvements in plant performance, production cost and AUD aluminium prices. The property business made a strong contribution to EBIT and good progress on our long term portfolio.
The following table provides reported financial information on which STIs have been based for the last five years. Note that CSR disposed of a significant proportion of its business and undertook a share consolidation during YEM11, therefore making the YEM11 information not directly comparable.
Refer to detailed footnotes for explanation.
Table 8: Key financials
YEAR ENDED 31 MARCH1 2015 2014
Restated82013
Restated7,82012
Restated82011
Restated8
EBIT ($ million)2 235.4 125.7 68.1 156.7 212.0 Earnings before interest, tax, depreciation and amortisation (EBITDA) ($ million)2 313.2 202.5 157.4 246.3 308.0 Total Equity ($ million) 1,206.0 1,157.2 1,086.6 1,278.7 1,281.3 ROFE (%)3 18.4 9.9 5.0 10.4 13.5Net profit before significant items ($ million) 146.5 80.5 41.4 104.1 103.4 Net profit (loss) after significant items ($ million) 125.5 88.1 (150.0) 76.3 (78.0)Basic earnings per share before significant items (cents)4 29.1 16.0 8.2 20.6 20.4 Dividend per share (cents)5 20.0 10.0 5.1 13.0 17.4 Share price as at 31 March ($)6 4.03 3.51 2.06 1.80 3.28
1 All years represent results for the full CSR group operations for the year, with the exception of 2011 which represents results from continuing operations only (i.e. excludes Sucrogen and Asian insulation businesses sold during the financial year).
2 EBIT and EBITDA exclude significant items. EBIT represents the primary financial metric used in the YEM15 STI plan.3 ROFE is calculated as EBIT before significant items for the 12 months to 31 March divided by average funds employed which excludes cash, tax balances and certain
other non-trading assets and liabilities as at 31 March.4 EPS excludes significant items and is based on net profit after tax. EPS results for 2011 reflect the impact of the 3:1 share consolidation on 3 March 2011.5 The YEM11 interim and special dividend has not been adjusted for the impact of the 3:1 share consolidation.6 2011 share price represents the CSR share price after the 3:1 share consolidation on 3 March 2011. 7 On 1 April 2013, the CSR group adopted AASB 119 Employee Benefits (revised), resulting in a change in accounting policy and a restatement of balances for the financial
year ended 31 March 2013.8 From 1 April 2014, the discount unwind of the product liability provision was transferred from finance costs to significant items to allow for better interpretation of the
CSR group financial performance, given its non-trading nature. The comparative years disclosed in the table above have also been restated to reflect this change.
REMUNERATION REPORT CONTINUED

CSR ANNUAL REPORT 2015
CSR ANNUAL REPORT 2015 3534 CSR ANNUAL REPORT 2015
Non-financialIn YEM15, payments approved by the board for the non-financial component of the STI averaged across executive KMP and senior executives were marginally ahead of target. The following table provides some examples of key performance measures used in YEM15 to assess executive performance in the non-financial component of the STI:
PERFORMANCE AREA MEASURE OUTCOME
Workplace Health, Safety and Environment Year on Year Reduction in: Lost Time
Injury Frequency Rate (LTIFR) and Total Recordable Injury Frequency Rate (TRIFR)
On Target
LTIFR reduced by 31%. TRIFR reduced by 22%.
Leading Safety Indicators Achieving ahead of 90% target on Injury Prevention Indicator.
Energy Reduction On target to deliver a 2.85% reduction at major facilities versus a target reduction of 2.5%.
People and Culture
Leadership Development
On Target
Investment and sponsorship of the CSR leadership programs.
Succession Bi-annual talent and succession reviews completed and actions implemented.
Culture and Employee Engagement In YEM15, all dimensions of CSR’s culture improved.
Diversity These measures are important in delivering CSR’s overall business strategy and the full set of measureable objectives are set out in the corporate governance section of the annual report.
CSR’s female participation in the business continues to increase and is now at 16.7%. Promotions across the business for women also increased from 29% to 30% during the year.
Innovation and Growth
Product Development
On Target
Each business has targets to develop and introduce new products e.g. lightweight ceiling board launched in September 2014.
Growth from New Business or Acquisitions
Bricks joint venture progressed with completion achieved on 1 May 2015.
AFS and Martini acquisitions completed as well as a number of other smaller bolt on acquisitions.
Customer
Customer Service
On Target
Each business unit has a range of customer service metrics that are monitored during the year.
Digital Strategy Development of solutions to provide more flexibility and better service through the digital CSR Connect platform.
LTIs have been linked to company performance as follows:• the value of performance rights (under the PRP) ultimately depends on share price performance; and• awards vest subject to CSR’s relative TSR performance compared against the constituents of the S&P/ASX 200 index and EPS growth.
CSR’s TSR improved significantly against that of the S&P/ASX 200 index for YEM15, resulting in partial vesting of the YEM10, YEM11 and YEM12 PRPs.
Subsequent to 31 March 2015, and up to the date of this report:• the EPS tranche of the YEM12 PRP grant did not meet the performance condition required, resulting in no vesting and all rights lapsing.• the EPS tranche of the YEM13 PRP grant met the performance condition resulting in all rights vesting.
During YEM15, the CASP was terminated and all shares in the plan were forfeited as the performance hurdles were not met.
REMUNERATION REPORT CONTINUED

CSR ANNUAL REPORT 2015
CSR ANNUAL REPORT 2015 3534 CSR ANNUAL REPORT 2015
The following table summarises the clear link between company performance and incentives awarded to executive KMP, senior executives and other eligible employees:
FINANCIAL PERFORMANCE STI LTI
EBIT($ MILLION)a TSR (%)b
EPS(CENTS)a
EXECUTIVE KMP
($ MILLION)
SENIOR EXECUTIVE($ MILLION)
ALL ELIGIBLE EMPLOYEES ($ MILLION)
ALL ELIGIBLE EMPLOYEES STI AS A % OF EBIT
VESTED VALUE – KMP
($ MILLION)
VESTED VALUE – SENIOR
EXECUTIVES($ MILLION)
YEM13 68.1 27.0 8.2 – 0.5 3.5 5.1% – –
YEM14 125.7 74.6 16.0 1.3 1.7 13.4 10.7% – –
YEM15 235.4 17.3 29.1 1.5c 2.6c 21.1c 9.0% 1.7 1.2
a EBIT and EPS are calculated pre significant items.b TSR calculation for YEM sourced from Bloomberg.c Represents approved and expensed STI for YEM15 but at the time of writing this report, this amount has not yet been paid.
F – EXECUTIVE SERVICES AGREEMENTS F1 – MANAGING DIRECTOR – EXECUTIVE SERVICES AGREEMENTRob Sindel was appointed as managing director of CSR effective 1 January 2011. Mr Sindel’s remuneration package is summarised as follows:
Table 9: Managing director’s remuneration package
Fixed remuneration The managing director receives annual fixed remuneration of $1,168,325 inclusive of superannuation contributions effective from 1 July 2014. Fixed remuneration is reviewed annually commencing 1 July 2015.
STI The annual maximum STI opportunity is 100% of annual fixed remuneration for exceptional performance. Achievement of target performance would result in 70% of the maximum STI being paid. The STI is weighted 60% on financial performance and 40% on individual performance.
LTI The managing director is able to participate in the PRP. The value of any award of performance rights he may earn is currently set at a maximum of 120% of annual fixed remuneration. Grants of performance rights are subject to performance hurdles and vesting criteria set by the board (refer to section D3 for details).
There was no sign-on incentive associated with Mr Sindel’s appointment as managing director.
The contract is for an indefinite duration. Under the Executive Services Agreement, Mr Sindel’s employment can be terminated by:• the company giving him 12 months’ notice of termination; or• Mr Sindel giving six months’ notice of resignation.
F2 – CHIEF FINANCIAL OFFICER – EXECUTIVE SERVICES AGREEMENTGreg Barnes was appointed as chief financial officer of CSR effective 1 December 2010. Mr Barnes’ remuneration package is summarised as follows:
Table 10: Chief financial officer’s remuneration package
Fixed remuneration The chief financial officer receives annual fixed remuneration of $620,000 inclusive of superannuation contributions effective from 1 July 2014. Fixed remuneration is reviewed annually commencing 1 July 2015.
STI The annual maximum STI opportunity is 100% of annual fixed remuneration for exceptional performance. Achievement of target performance would result in 50% of the maximum STI being paid. The STI is weighted 60% on financial performance and 40% on individual performance.
LTI The chief financial officer is able to participate in the PRP. The potential value of any award of performance rights he may earn is set at a maximum of 60% of annual fixed remuneration. Grants of performance rights are subject to performance hurdles and vesting criteria set by the board (refer to section D3 for details).
There was no sign-on incentive associated with Mr Barnes’ appointment as chief financial officer.
The contract is for an indefinite duration. Under the Executive Services Agreement, Mr Barnes’ employment can be terminated by:• the company giving him six months’ notice of termination; or• Mr Barnes giving three months’ notice of resignation.
REMUNERATION REPORT CONTINUED

CSR ANNUAL REPORT 2015
CSR ANNUAL REPORT 2015 3736 CSR ANNUAL REPORT 2015
Under their Executive Services Agreements, Mr Sindel’s and Mr Barnes’ incentives are treated in the event of termination, or a change of control, as follows:
Table 11: Treatment of the managing director’s and chief financial officer’s incentives on termination
LONG TERM INCENTIVE
CIRCUMSTANCE SHORT TERM INCENTIVEa UNVESTED PERFORMANCE RIGHTSSHARES ALLOCATED IN RESPECT OF VESTED PERFORMANCE RIGHTS
Immediate termination for cause
No STI payable and clawback provisions may apply
Rights are forfeited Shares are not subject to restriction after vesting
Resignation Board discretion to award STI on a pro-rata basis
Rights are forfeited unless board determines otherwise
Shares are not subject to restriction after vesting
Notice by company Board discretion to award STI on a pro-rata basis
Board discretion to allow awards to vest or remain subject to performance hurdles after termination on a pro-rata basis
Shares are not subject to restriction after vesting
Good Leaver, retirement, redundancy, death or permanent disability
Board discretion to award STI on a pro-rata basis
Board discretion to allow awards to vest or remain subject to performance hurdles after termination on a pro-rata basis
Shares are not subject to restriction after vesting
Change of control and subsequent material change to managing director’s roleb
STI will be paid on a pro-rata basis The board has discretion to allow awards to vest on a change of control of CSR (e.g. a takeover or merger). In exercising this discretion, the board would generally apply pro-rata assessments for plans on foot
Shares are not subject to restriction after vesting
a Any STI payments will be paid according to the normal annual STI payment time frame (i.e. payment timing will not be accelerated).b Only applies to the managing director. If the managing director resigned due to a material change in the managing director’s status (including the company undergoing
a change of control), there would be an entitlement to a payment equivalent to 12 months’ notice of termination.
G – REMUNERATION AND SHAREHOLDINGS FOR YEM15 (AND COMPARATIVES)Managing director’s and chief financial officer’s long term incentives and STI deferralNote – number of performance rights granted under the PRP represents the maximum award for stretch performance.
NUMBER OF PERFORMANCE RIGHTS
RIGHTS GRANTED UNDER THE PRP
RIGHTS BALANCE
AT 1 APRILRIGHTS
GRANTEDRIGHTSVESTEDa
RIGHTSLAPSEDb
RIGHTS BALANCE
AT 31 MARCH
CSR SHARES ELIGIBLE AT
VESTINGd
Managing director
Rob Sindel YEM14 1,513,312 682,215 – – 2,195,527 2,292,651
YEM15 2,195,527 414,581c (331,493) (78,899) 2,199,716 2,220,601
Chief financial officer
Greg Barnes YEM14 473,741 160,923 – – 634,664 665,363
YEM15 634,664 100,953 (95,331) (22,543) 617,743 625,115
a The following rights vested to ordinary shares on 6 November 2014 as approved by the board: Mr Sindel YEM10 (rights vested 78,899: shares awarded 105,523), YEM11 (rights vested 68,135: shares awarded 91,127) and YEM12 (rights vested and shares awarded
184,459). The value of each of these shares was $3.52, representing a total value to Mr Sindel of $1,341,504. Mr Barnes YEM10 (rights vested 22,543: shares awarded 30,150), YEM11 (rights vested 24,048: shares awarded 32,163) and YEM12 (rights vested and shares awarded
48,740). The value of each of these shares was $3.52, representing a total value to Mr Barnes of $390,907. It does not include vested rights of Tranche B (EPS) from the YEM13 PRP that were approved by the board subsequent to 31 March 2015 but prior to the date of this report.
These approved rights represented 399,248 and 134,969 shares respectively for Mr Sindel and Mr Barnes.b Represents the number of rights that lapsed for Mr Sindel and Mr Barnes from the YEM10 PRP. This does not include rights lapsed from the YEM12 EPS tranche, that failed
to meet its performance condition as deemed by the board, subsequent to 31 March 2015 but prior to the date of this report. c Represents the correct number of rights issued for the YEM15 PRP following approval of the 345,485 rights at the 2014 annual general meeting and top-up adjustment for
the administrative error disclosed at the time. This maximum amount of rights for the YEM15 plan is consistent with Mr Sindel’s employment contract.d Represents the number of shares that will be granted to executive KMP if all outstanding performance rights vest. For grants on issue at the date of the CSR return of capital
on 3 March 2011, each performance right is worth 1.337 CSR shares on vesting. All grants made after this date are eligible for one CSR share per one performance right on vesting. Shares acquired on vesting are fully paid ordinary shares and the amount payable by executive KMP to acquire these shares is nil.
REMUNERATION REPORT CONTINUED
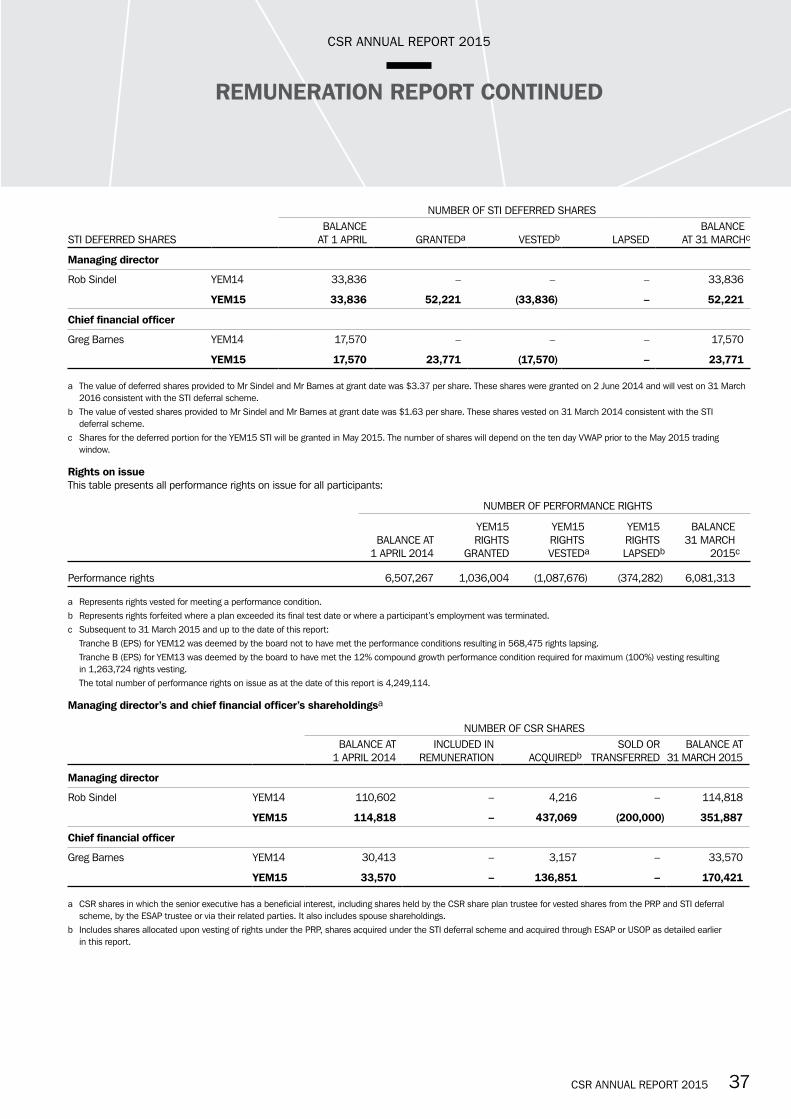
CSR ANNUAL REPORT 2015
CSR ANNUAL REPORT 2015 3736 CSR ANNUAL REPORT 2015
NUMBER OF STI DEFERRED SHARES
STI DEFERRED SHARESBALANCE
AT 1 APRIL GRANTEDa VESTEDb LAPSEDBALANCE
AT 31 MARCHc
Managing director
Rob Sindel YEM14 33,836 – – – 33,836
YEM15 33,836 52,221 (33,836) – 52,221
Chief financial officer
Greg Barnes YEM14 17,570 – – – 17,570
YEM15 17,570 23,771 (17,570) – 23,771
a The value of deferred shares provided to Mr Sindel and Mr Barnes at grant date was $3.37 per share. These shares were granted on 2 June 2014 and will vest on 31 March 2016 consistent with the STI deferral scheme.
b The value of vested shares provided to Mr Sindel and Mr Barnes at grant date was $1.63 per share. These shares vested on 31 March 2014 consistent with the STI deferral scheme.
c Shares for the deferred portion for the YEM15 STI will be granted in May 2015. The number of shares will depend on the ten day VWAP prior to the May 2015 trading window.
Rights on issueThis table presents all performance rights on issue for all participants:
NUMBER OF PERFORMANCE RIGHTS
YEM15 YEM15 YEM15 BALANCE BALANCE AT RIGHTS RIGHTS RIGHTS 31 MARCH 1 APRIL 2014 GRANTED VESTED a LAPSED b 2015 c
Performance rights 6,507,267 1,036,004 (1,087,676) (374,282) 6,081,313
a Represents rights vested for meeting a performance condition.b Represents rights forfeited where a plan exceeded its final test date or where a participant’s employment was terminated. c Subsequent to 31 March 2015 and up to the date of this report: Tranche B (EPS) for YEM12 was deemed by the board not to have met the performance conditions resulting in 568,475 rights lapsing. Tranche B (EPS) for YEM13 was deemed by the board to have met the 12% compound growth performance condition required for maximum (100%) vesting resulting
in 1,263,724 rights vesting. The total number of performance rights on issue as at the date of this report is 4,249,114.
Managing director’s and chief financial officer’s shareholdingsa
NUMBER OF CSR SHARESBALANCE AT
1 APRIL 2014INCLUDED IN
REMUNERATION ACQUIREDbSOLD OR
TRANSFERREDBALANCE AT
31 MARCH 2015
Managing director
Rob Sindel YEM14 110,602 – 4,216 – 114,818
YEM15 114,818 – 437,069 (200,000) 351,887
Chief financial officer
Greg Barnes YEM14 30,413 – 3,157 – 33,570
YEM15 33,570 – 136,851 – 170,421
a CSR shares in which the senior executive has a beneficial interest, including shares held by the CSR share plan trustee for vested shares from the PRP and STI deferral scheme, by the ESAP trustee or via their related parties. It also includes spouse shareholdings.
b Includes shares allocated upon vesting of rights under the PRP, shares acquired under the STI deferral scheme and acquired through ESAP or USOP as detailed earlier in this report.
REMUNERATION REPORT CONTINUED

CSR ANNUAL REPORT 2015
CSR ANNUAL REPORT 2015 3938 CSR ANNUAL REPORT 2015
Managing director’s and chief financial officer’s remuneration The remuneration table below shows an increase in total remuneration expensed for accounting purposes for executive KMP in YEM15 compared with YEM14. The STI and LTI expense in YEM15 accounts for the significant majority of the change in total expensed remuneration year on year.
FIXEDa VARIABLE ‘AT RISK’
$ YEAR ENDED 31 MARCH CASH SALARY SUPERANNUATION
ANNUAL LEAVE AND LONG
SERVICE LEAVE OTHER
BENEFITSbSTI
EXPENSEcLTI
EXPENSEd TOTAL STIe LTIf
Managing director – Rob Sindel
2014 1,107,258 17,449 47,201 7,481 781,790 632,099 2,593,278 30% 24%
2015 1,141,287 18,531 67,714 3,053 949,829 903,058 3,083,472 31% 29%
Chief financial officer – Greg Barnes
2014 570,051 17,449 17,096 999 357,037 180,536 1,143,168 31% 16%
2015 596,469 18,531 32,591 998 467,373 238,604 1,354,566 35% 18%
a Fixed remuneration may be allocated at the executive’s discretion to cash, superannuation (subject to legislative minimums), motor vehicles and certain other benefits.b In YEM15 and YEM14, included travel expenditure for Mr Sindel and his spouse, all of which directly related to company business. Mr Barnes had no reportable items in
travel expenditure but participated in the USOP in YEM15 and YEM14. c The minimum entitlement to an STI payment is zero and the target entitlement as a % of fixed remuneration for YEM15 is 50% for the chief financial officer and 70% for
the managing director. Maximum potential STI entitlement is 100% of fixed remuneration. STI payments may be allocated at the executive’s discretion to cash or additional superannuation contributions. Under the STI deferral scheme rules, 20% of the STI value will be deferred into CSR shares.
d LTI expense is as defined in the accounting standards. PRP grants are expensed over the vesting period at a valuation determined on grant date. Valuations are performed by a third party. Expenses are net of any reversal of accounting expenses for grants associated with EPS performance hurdles that were reassessed during YEM13.
e STI as a percentage of total remuneration. f LTI as a percentage of total remuneration.
H – NON-EXECUTIVE DIRECTOR REMUNERATION
ROLE ANNUAL FEE FOR YEM15
Chairman base fees $327,025
Other NED base fees (including one committee membership) $130,810
Chairman of the Risk & Audit Committee An additional $30,000
Chairman of the Remuneration & Human Resources Committee An additional $20,000
Chairman of the Workplace Health, Safety & Environment Committee An additional $20,000
Additional committee membership An additional $10,000 per additional committee (applies to NEDs other than the chairman)
All fees are exclusive of any Superannuation Guarantee Contribution (SGC).
NEDs do not participate in the company’s STI or LTI plans or receive any variable remuneration, but are able to forgo fees for CSR shares under the ESAP. To further align NEDs’ interests with those of shareholders, the company expects all NEDs to acquire a beneficial interest in CSR shares.
No retirement allowances are payable to NEDs.
Following extensive market benchmarking in YEM15, a 2.75% fee increase will apply to the chairman’s base fees and other NED base fees. These increases were effective 1 April 2015 (YEM16).
REMUNERATION REPORT CONTINUED

CSR ANNUAL REPORT 2015
CSR ANNUAL REPORT 2015 3938 CSR ANNUAL REPORT 2015
Non-executive directors’ shareholdingsa
NUMBER OF CSR SHARESBALANCE
AT 1 APRILINCLUDED IN
REMUNERATION ACQUIREDSOLD OR
TRANSFERREDBALANCE AT
31 MARCH
Kathleen Conlon YEM14 34,806 – 2,443 – 37,249
YEM15 37,249 – 1,770 – 39,019
Ray Horsburgh YEM14 35,500 – – – n/a
(retired 20 August 2013) YEM15 – – – – –
Michael Ihlein YEM14 53,338 – 2,204 – 55,542
YEM15 55,542 – 1,434 – 56,976
Rebecca McGrath YEM14 13,608 – 12,200 – 25,808
YEM15 25,808 – 1,675 – 27,483
Matthew Quinn YEM14 – – 15,000 – 15,000
YEM15 15,000 – 587 – 15,587
Jeremy Sutcliffe (chairman) YEM14 127,596 – – – 127,596
YEM15 127,596 – – – 127,596
a CSR shares in which the director has a beneficial interest, including shares held under the ESAP trust or via related parties.
Non-executive directors’ remuneration
YEAR ENDED 31 MARCH DIRECTORS’ FEESTERMINATION
BENEFITS SUPERANNUATION TOTAL
Kathleen Conlon YEM14 147,000 – 13,506 160,506
YEM15 150,810 – 14,233 165,043
Ray Horsburgh YEM14 55,833 – 1,958 57,791
(retired 20 August 2013) YEM15 – – – –
Michael Ihlein YEM14 157,000 – 14,424 171,424
YEM15 160,810 – 15,176 175,986
Rebecca McGrath YEM14 141,028 – 12,959 153,987
YEM15 150,810 – 14,233 165,043
Matthew Quinn YEM14 84,355 – 7,803 92,158
YEM15 140,810 – 13,289 154,099
Jeremy Sutcliffe (chairman)a YEM14 329,221 – 17,449 346,670
YEM15 339,357 – 18,531 357,888
Total non-executive directors YEM14 914,437 – 68,099 982,536
YEM15 942,597 – 75,462 1,018,059
a Effective 1 July 2014, Jeremy Sutcliffe’s SGC was reduced from 9.5% of his base director’s fees to the capped minimum SGC. His base fees increased by the difference between the employer’s SGC requirement and the minimum SGC cap. The application of these arrangements continued in YEM15 consistent with any changes in SGC legislative requirements.
Other transactionsThere were no other transactions, including loans between CSR and KMP (including their related parties), during YEM14 and YEM15.
REMUNERATION REPORT CONTINUED
CSR ANNUAL REPORT 2015
CSR ANNUAL REPORT 2015 4140 CSR ANNUAL REPORT 2015
The board of directors of CSR Limited (CSR) present its report of the consolidated entity, being CSR and its controlled entities (CSR group), for the year ended 31 March 2015 and the auditor’s report thereon. Information in the annual report referred to in this report, including the remuneration report, the corporate governance statement as well as any information contained in a note to the financial statements referred to in this report, forms part of, and is to be read as part of, this report.
PRINCIPAL ACTIVITIES The principal activities of entities in the CSR group during the year included the manufacture and supply of building products in Australia and New Zealand.
In Australia, the CSR group has an interest in the smelting of aluminium through its 70% interest in Gove Aluminium Finance Limited, which owns 36.05% of the Tomago aluminium smelter located near Newcastle, NSW. CSR also maximises returns from the sale of its surplus land by advancing sites through stages of the development process.
REVIEW OF OPERATIONS AND FINANCIAL RESULTSA review of CSR group operations and the results for the year ended 31 March 2015 is set out on the inside front cover to page 3 and pages 43 to 93 of the annual report.
SUMMARY OF CONSOLIDATED RESULTSNet profit after tax (pre significant items) was $146.5 million compared to $80.5 million for the previous year.
Statutory net profit after tax was $125.5 million, which included a significant items charge of $21.0 million after tax. Significant items include the discount unwind expense, to record the asbestos related provision in present value terms, and restructuring costs. This compares to statutory net profit of $88.1 million for the year ended 31 March 2014, which included the benefit of a $33.0 million (pre tax) reduction in asbestos liabilities.
Tax expense of $63.1 million (pre significant items) was up from $27.7 million due to the increase in pre tax profits. CSR’s effective tax rate for the full year was 27.3%, an increase from 23.2% in the previous year. The increase in the effective tax rate mainly reflects improved profitability of controlled businesses relative to associates which are reported on an after tax basis.
Net cash position of $68.4 million improved by $96.9 million since 31 March 2014, despite funding $38.1 million in acquisitions, including AFS, during the period. This improvement reflects increased underlying operating cash flows as a result of higher earnings and working capital management, further year on year reductions in asbestos liability payments, as well as an increase in net Property cash flows.
Capital expenditure (excluding Property) was $56.0 million during the period, up from $52.7 million last year. Of this total, $32.1 million was for stay-in-business projects and $23.9 million was development related capital expenditure including factory upgrades in bricks and investment in warehouse automation. Capital expenditure represented 72% of depreciation.
As at 31 March 2015, the product liability provision was $350.7 million, the lowest level in ten years, due to a decrease in future estimated claims in the United States. This provision includes a prudential margin of $56.5 million or 19.2% above the combined estimate of the independent experts in Australia and the United States. CSR paid asbestos related claims of $31.1 million (including legal costs) down 8% from $33.8 million last year.
Note 1 (segment information) to the financial statements on page 55 provides a breakdown of operating results by business segment and supporting comments are provided below:
BUILDING PRODUCTSBuilding Products trading revenue was $1.2 billion, up 18% with higher volumes across all products and improved margins in most product categories. Excluding acquisitions, revenues were up 13%.
EBIT was up 31% with earnings growth across all businesses, reflecting the benefit of higher sales volumes, improved factory performance and recent acquisitions.
EBIT was also impacted by planned shutdowns at the Schofields and Horsley Park brick facilities to deliver efficiency improvements, as well as further investment in new brick products.
EBIT margin increased by one percentage point to 10.0%. Profitability also improved in the second half of the year with EBIT margins increasing 1.6 percentage point to 9.6% year on year as improved volume, pricing and product mix took effect.
GLASS (VIRIDIAN)Viridian trading revenue of $279.3 million was up 7% from $262.0 million following the benefit of pricing initiatives and higher volumes driven by market demand.
Viridian recorded a positive EBIT of $3.1 million, up from the EBIT loss of $14.9 million in the prior year. The return to profitability is ahead of schedule following restructuring initiatives launched in March 2013 which included improved utilisation of the float glass manufacturing facility at Dandenong in Victoria and the closure of some underperforming sites. New Zealand operations also improved driven by strong construction activity and operational improvement initiatives.
ALUMINIUM (GAF)Gove Aluminium Finance (GAF – 70% CSR) sales volumes of 202,423 tonnes were 3.5% higher as productivity initiatives drove increased production at Tomago. Trading revenue of $532.9 million was up 17%, reflecting the increased sales volumes and higher realised prices which included the effects of hedging and premiums.
EBIT of $104.3 million was up 101%, with the EBIT margin improving to 19.6% from 11.4% due to the higher realised price, increased production volumes and continued operational improvements at the Tomago smelter.
PROPERTYProperty recorded EBIT of $30.2 million up from $17.3 million in the previous year. The result includes the first tranche of the sale of the multi-residential development site at New Lynn located southwest of Auckland completed in December 2014.
The result also includes the sale of sites at Pyrmont and surplus industrial land at Ingleburn in Sydney, both of which completed in the first half of the year.
SIGNIFICANT CHANGESThere have been no significant changes to the CSR group in the financial year ended 31 March 2015.
EVENTS AFTER BALANCE DATEOn 1 May 2015, CSR completed the formation of a joint venture with Boral Limited to combine their Australian east coast brick operations. The joint venture trades under the entity of Boral CSR Bricks Pty Limited. As the joint venture is owned 60% by CSR and 40% by Boral, CSR will consolidate the results of the business effective 1 May 2015 with the portion of after tax earnings attributable to Boral’s share of the business recorded as a minority interest.
No other matters or circumstances have arisen since the end of the financial year that have significantly affected or may significantly affect the CSR group’s operations, the results of those operations or the CSR group’s state of affairs in future financial years.
DIRECTORS’ REPORT

CSR ANNUAL REPORT 2015
CSR ANNUAL REPORT 2015 4140 CSR ANNUAL REPORT 2015
STRATEGY, FUTURE PROSPECTS, LIKELY DEVELOPMENTS AND RISKSStrategy: The CSR group is focused on delivering long term sustainable earnings growth centred around five key themes:
Strengthen and invest
Strengthening and investing in our people and our businesses
• 31%1 improvement in safety with fewer and less severe injuries in the last year
• Launched Boral CSR Bricks JV on 1 May 2015
• Expanded leadership development programs to invest in our people at all levels within CSR
• Viridian reorganised and returned to profitability
Smarter, faster, easier
Delivering building solutions that are smarter, faster and easier to use
• Launched Gyprock Optimised Core technology for a new ceiling board
• Investment committed for the CSR Velocity™ pre-fabricated walling system production facility
Influencing design
Influencing design and adapting to the changing way we live and work
• Acquired AFS in April 2014 – focused on continued penetration of the structural walling market
• Product development is increasing the proportion of lightweight Hebel panels utilised in structural elements of buildings
Comfort
Improving comfort, quality and efficiency of buildings
• Expansion of Bradford energy solutions offering to include polyester, specialist acoustic products, ventilation, PIR foams, and construction fabrics
Customers
Ensuring that our customers choose to do business with CSR
• Expanded CSR Connect 24/7 to provide access to online ordering, delivery and managing account information
1 Lost time injury frequency rate (per million work hours).
Future Prospects and Likely Developments: In Building Products, building approval levels for detached and multi-residential housing remain strong. This is expected to lead to increased demand for CSR’s products across detached and multi-residential segments. From YEM16 onwards, the results will include the consolidated earnings from the Boral CSR Bricks JV which began operations on 1 May 2015.
Having returned Viridian to profitability and restructured the business to focus on key market segments, management is targeting new opportunities for revenue growth – particularly in residential performance and the commercial and architectural design markets. This will require modest levels of investment in capital and customer service initiatives over the next two to three years, which should be more than offset by improved market activity and growth in higher-margin products.
In Aluminium, Gove Aluminium Finance (GAF) – in which CSR has a 70% stake – continues to increase its hedge book when pricing opportunities arise, with 59% of net sales for YEM16 currently hedged at an average price of A$2,311 per tonne (before premiums).
We have seen increased volatility in premiums in recent months as a result of increased exports from China and lower LME inventories. For the first quarter of CSR’s current financial year (YEM16) premiums declined by approximately 11% (Platts Main Japan Port premium) for the quarter to US$380 per tonne. Spot prices for premiums have fallen further in recent weeks.
Conversely, LME pricing has strengthened recently, with the US dollar cash LME aluminium price increasing by US$154 per tonne during the month of April 2015.
Property earnings are always subject to timing of completion of transactions. The formation of the Boral CSR Bricks JV provides additional opportunities for development of selected high-value land assets over the next five to ten years.
Risks: CSR’s business segments are in building products (including architectural glass), aluminium and property development. As such, CSR’s long term profitability and cash flows are responsive to domestic and international economic conditions, outlook and sentiment. Specifically, building products demand is driven by movements in residential and non-residential construction activity in Australia and New Zealand, and aluminium results are responsive to movements in the global US dollar price for aluminium. Building Products also imports certain products and raw materials and has businesses that are exposed to import competition and currency fluctuations. As a result, Building Products, Aluminium and the asbestos provision are exposed to movements in foreign currency and, in particular, to movements in the Australian and US dollar exchange rates.
PERFORMANCE IN RELATION TO ENVIRONMENTAL REGULATION The board places a high priority on environmental issues and is satisfied that adequate systems are in place for the management of CSR’s compliance with applicable environmental regulations under the laws of the Commonwealth, States and Territories of Australia and of New Zealand. CSR is not aware of any pending prosecutions relating to environmental issues, nor is CSR aware of any environmental issues, not provided for, which would materially affect the business as a whole.
POLITICAL DONATIONSCSR contributed $11,700 including GST in indirect donations to political parties in the year ended 31 March 2015 (2014: $22,750). All payments are for attendance at organised events such as conferences. CSR’s businesses are often involved in a degree of interaction with all levels of government. CSR assists all sides of politics in the development of policy in fields where CSR has specific expertise.
All donations are disclosed in accordance with CSR’s obligations to the Australian Electoral Commission.
DIVIDENDS AND DISTRIBUTIONS TO SHAREHOLDERSDividends through the year have been as follows:• a final, unfranked dividend of 5.0 cents per ordinary share, with
respect to the financial year ended 31 March 2014, was paid on 8 July 2014; and
• an interim, unfranked dividend of 8.5 cents per ordinary share was paid on 16 December 2014 (as set out in Note 26 to the financial statements on page 70).
Following the end of the financial year, on 12 May 2015, the board resolved to pay a final, unfranked dividend for the year ended 31 March 2015 of 11.5 cents per ordinary share, on 7 July 2015.
No other distributions were paid during the year.
DIRECTORS’ REPORT CONTINUED

CSR ANNUAL REPORT 2015
CSR ANNUAL REPORT 2015 4342 CSR ANNUAL REPORT 2015
DIRECTORS, SECRETARIES, DIRECTORS’ MEETINGS AND DIRECTORS’ SHAREHOLDINGSThere were no changes to the board in YEM15.
The names of directors who held office at 12 May 2015, as well as details about current directors’ period of appointment, qualifications, experience, special responsibilities, current directorships and directorships for the past three years of other listed companies, are on pages 14 and 15. The qualifications and experience of the company secretary at 12 May 2015 are also on page 15.
Details about meetings of the board and of board committees, including attendance, are on page 22 and the directors’ relevant interests in shares in CSR or a related body corporate as at the date of this report are on page 22. Other than as disclosed elsewhere in this report, no director:• has any relevant interest in debentures of, or interests in a registered
scheme made available by, CSR or a related body corporate; • has any rights or options over shares in, debentures of or interests
in a registered scheme made available by, CSR or a related body corporate; or
• is a party to or entitled to a benefit under any contracts that confer a right to call for or deliver shares in, debentures of or interests in a registered scheme made available by, CSR or a related body corporate.
OPTIONS OVER SHARE CAPITALOther than as disclosed in the remuneration report:• no CSR options were granted to executives or non-executive directors
during the year;• there were no unissued shares or interests in CSR subject to options
at the date of this report; and• no CSR shares or interests were issued pursuant to exercised options
during or since the end of the year.
INDEMNITIES AND INSURANCEUnder rule 101 of CSR’s constitution, CSR indemnifies every person who is or has been an officer of CSR, to the extent permitted by law and subject to the restrictions in sections 199A and 199B of the Corporations Act 2001 against:• liability to third parties (other than related CSR companies) arising
out of conduct undertaken in good faith in their capacity as a CSR officer; and
• the costs and expenses of defending legal proceedings arising out of conduct undertaken in their capacity as a current or former CSR officer, unless the defence is unsuccessful.
For the purposes of rule 101 of CSR’s constitution, ‘officer’ means a director, secretary and executive officer (as defined in the Corporations Act 2001). CSR has entered into a deed of indemnity with current and former directors of CSR and its subsidiaries. The deeds of indemnity are substantially in the form approved by shareholders in July 1999.
CSR has a similar policy covering all employees. CSR’s external auditor is not indemnified under rule 101 of CSR’s constitution or any agreement.
During the year, CSR paid premiums in respect of insurance contracts for the year ended 31 March 2015 and, since the end of the year, CSR has paid, or agreed to pay, premiums in respect of such contracts for the year ending 31 March 2016. The insurance contracts insure against certain liability (subject to exclusion) incurred by persons who are or have been directors or officers of CSR and its controlled entities. In accordance with normal commercial practice, the insurance contract prohibits disclosure of the nature of the liability covered by, or the premium payable under, the contract of insurance. No claims under the indemnities have been made against CSR during or since the end of the year.
AUDITOR INDEPENDENCEThere is no current or former partner or director of Deloitte Touche Tohmatsu, CSR’s auditor, who is, or was at any time during the year ended 31 March 2015, an officer of the CSR group. No auditor played a significant role in the CSR group audit for the year ended 31 March 2015 in reliance on a declaration made under section 342A of the Corporations Act 2001. The auditor’s independence declaration (made under section 307C of the Corporations Act 2001) is set out on page 95 and forms part of this report.
NON-AUDIT SERVICESDetails of the amounts paid or payable to the CSR group auditor, Deloitte Touche Tohmatsu, for non-audit services provided by that firm during the year are shown in Note 29 to the financial statements on page 72. In accordance with written advice provided by the Risk & Audit Committee, the directors are satisfied that the provision of non-audit services during the year by Deloitte Touche Tohmatsu:• is compatible with the general standard of independence for auditors
imposed by the Corporations Act 2001; and• did not compromise the auditor independence requirements of the
Corporations Act 2001 in view of the materiality of the amounts, the nature of the services and the processes established to monitor the independence of the auditors.
PROCEEDINGS ON BEHALF OF CSRNo proceedings have been brought, or intervened in, on behalf of CSR, nor has any application for leave been made in respect of CSR under section 237 of the Corporations Act 2001.
REMUNERATION OF DIRECTORS AND KEY MANAGEMENT PERSONNELThe remuneration report on pages 23 to 39, which forms part of the directors’ report, provides: a summary of the board’s remuneration policy and practices during the past year as they apply to directors and other KMP (as defined by the Accounting Standard AASB 124 Related Party Disclosures); the relationship between remuneration policy and the CSR group’s performance; and the remuneration details for each director and other KMP.
Jeremy SutcliffeChairman
Rob SindelManaging Director
12 May 2015
DIRECTORS’ REPORT CONTINUED

CSR ANNUAL REPORT 2015
CSR ANNUAL REPORT 2015 4342 CSR ANNUAL REPORT 2015
FINANCIAL REPORTCSR LIMITED AND ITS CONTROLLED ENTITIES (CSR GROUP) YEAR ENDED 31 MARCH 2015
Statement of financial performance 44
Statement of comprehensive income 45
Statement of financial position 46
Statement of changes in equity 47
Statement of cash flows 48
Significant accounting policies 49
Notes to the financial statements 54
1 Segment information 542 Other income and expenses 563 Significant items 574 Net finance cost 575 Depreciation and amortisation 586 Income taxes 587 Acquisitions of controlled entities and businesses 608 Controlled entities and businesses disposed 629 Cash and cash equivalents 6210 Inventories 6211 Receivables 6312 Other financial assets 6313 Other assets 6414 Property, plant and equipment 6415 Movements in property, plant and equipment 6416 Goodwill 6517 Other intangible assets 6518 Payables and other liabilities 6619 Borrowings 6620 Other financial liabilities 6621 Credit facilities and maturity profile 6622 Provisions 6723 Issued capital 6724 Reserves 6825 Non-controlling interests 6926 Dividends and franking credits 7027 Related party information 7028 Interest in joint operation 7229 Auditor’s remuneration 7230 CSR Limited disclosures 7231 Superannuation commitments 7332 Financial risk management 7633 Equity accounting information 8534 Particulars relating to controlled entities 8635 Contracted operational expenditure 8736 Contracted capital expenditure 8737 Contingent liabilities 8738 Product liability 8839 Subsequent events 9040 Deed of cross guarantee 90
Directors’ declaration 93
Independent auditor’s report to the members of CSR Limited 94
Auditor’s independence declaration to the directors of CSR Limited 95

CSR ANNUAL REPORT 2015 4544 CSR ANNUAL REPORT 2015
CSR ANNUAL REPORT 2015
STATEMENT OF FINANCIAL PERFORMANCE
CSR LIMITED AND ITS CONTROLLED ENTITIES (CSR GROUP) YEAR ENDED 31 MARCH
($ MILLION) NOTE 2015 2014
Trading revenue – sale of goods 2,023.4 1,746.6
Cost of sales (1,368.9) (1,235.2)
Gross margin 654.5 511.4
Other income 2 39.2 55.9
Warehouse and distribution costs (191.0) (176.5)
Selling, administration and other operating costs (278.3) (240.8)
Share of net profit of joint venture entities 33 11.7 9.4
Other expenses 2 (25.5) (17.5)
Profit before finance and income tax 210.6 141.9
Interest income 4 3.0 2.5
Finance cost 4 (20.7) (21.1)
Profit before income tax 192.9 123.3
Income tax expense 6 (46.2) (24.2)
Net profit 146.7 99.1
Net profit attributable to non-controlling interests 25 21.2 11.0
Net profit attributable to shareholders of CSR Limiteda 125.5 88.1
EARNINGS PER SHARE (CENTS)
Basic earnings per share – based on net profit attributable to shareholders of CSR Limitedb 24.9 17.5
Diluted earnings per share – based on net profit attributable to shareholders of CSR Limitedb 24.9 17.5
a Net profit before significant items attributable to shareholders of CSR Limited is $146.5 million (2014: $80.5 million). Refer to Note 3 to the financial statements.b Weighted average number of shares used in the calculation of earnings per share is 504.2 million (2014: 503.9 million). The total number of shares on issue of 506.0 million
(2014: 506.0 million) has been reduced by the number of shares purchased on market and held in trust to satisfy incentive plans as these plans vest. During the period 1,800,847 (2014: 2,111,828) weighted average shares were held by the trust.
Notes to the financial statements are annexed.

CSR ANNUAL REPORT 2015 4544 CSR ANNUAL REPORT 2015
CSR ANNUAL REPORT 2015
STATEMENT OF COMPREHENSIVE INCOME
CSR LIMITED AND ITS CONTROLLED ENTITIES (CSR GROUP) YEAR ENDED 31 MARCH
($ MILLION) 2015 2014
Net profit 146.7 99.1
Other comprehensive income (expense)
Items that may be reclassified to profit or lossHedge profit recognised in equity 2.3 9.6
Hedge profit transferred to the statement of financial performance (10.7) (13.3)
Share of gain on changes in fair value of cash flow hedges of joint ventures 0.3 –
Exchange differences arising on translation of foreign operations 1.2 2.4
Income tax benefit relating to these items 2.6 1.1
Items that will not be reclassified to profit or lossActuarial (loss) gain on superannuation defined benefit plans (15.4) 17.1
Income tax benefit (expense) relating to these items 4.7 (5.1)
Other comprehensive (expense) income – net of tax (15.0) 11.8
Total comprehensive income 131.7 110.9
Total comprehensive income attributable to
Shareholders of CSR Limited 112.5 100.8
Non-controlling interests 19.2 10.1
Total comprehensive income 131.7 110.9
Notes to the financial statements are annexed.
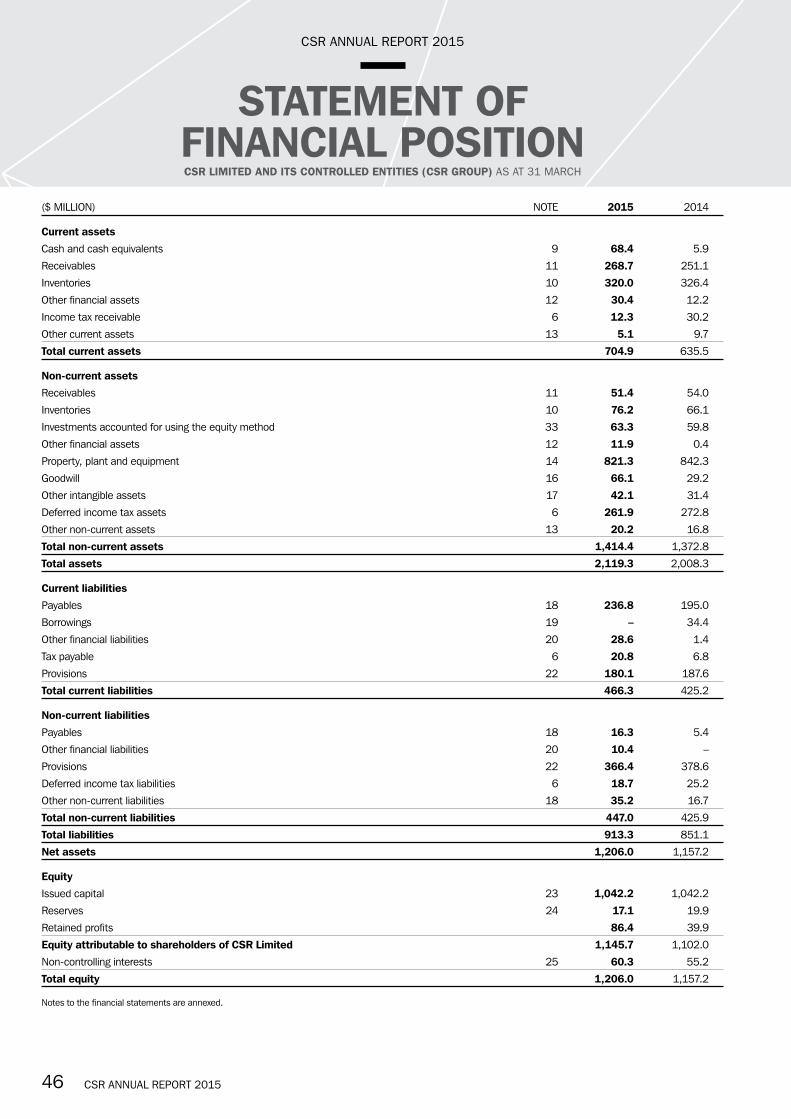
CSR ANNUAL REPORT 2015 4746 CSR ANNUAL REPORT 2015
CSR ANNUAL REPORT 2015
STATEMENT OF FINANCIAL POSITION CSR LIMITED AND ITS CONTROLLED ENTITIES (CSR GROUP) AS AT 31 MARCH
($ MILLION) NOTE 2015 2014
Current assets
Cash and cash equivalents 9 68.4 5.9
Receivables 11 268.7 251.1
Inventories 10 320.0 326.4
Other financial assets 12 30.4 12.2
Income tax receivable 6 12.3 30.2
Other current assets 13 5.1 9.7
Total current assets 704.9 635.5
Non-current assets
Receivables 11 51.4 54.0
Inventories 10 76.2 66.1
Investments accounted for using the equity method 33 63.3 59.8
Other financial assets 12 11.9 0.4
Property, plant and equipment 14 821.3 842.3
Goodwill 16 66.1 29.2
Other intangible assets 17 42.1 31.4
Deferred income tax assets 6 261.9 272.8
Other non-current assets 13 20.2 16.8
Total non-current assets 1,414.4 1,372.8
Total assets 2,119.3 2,008.3
Current liabilities
Payables 18 236.8 195.0
Borrowings 19 – 34.4
Other financial liabilities 20 28.6 1.4
Tax payable 6 20.8 6.8
Provisions 22 180.1 187.6
Total current liabilities 466.3 425.2
Non-current liabilities
Payables 18 16.3 5.4
Other financial liabilities 20 10.4 –
Provisions 22 366.4 378.6
Deferred income tax liabilities 6 18.7 25.2
Other non-current liabilities 18 35.2 16.7
Total non-current liabilities 447.0 425.9
Total liabilities 913.3 851.1
Net assets 1,206.0 1,157.2
Equity
Issued capital 23 1,042.2 1,042.2
Reserves 24 17.1 19.9
Retained profits 86.4 39.9
Equity attributable to shareholders of CSR Limited 1,145.7 1,102.0
Non-controlling interests 25 60.3 55.2
Total equity 1,206.0 1,157.2
Notes to the financial statements are annexed.

CSR ANNUAL REPORT 2015 4746 CSR ANNUAL REPORT 2015
CSR ANNUAL REPORT 2015
STATEMENT OF CHANGES IN EQUITY
CSR LIMITED AND ITS CONTROLLED ENTITIES (CSR GROUP) YEAR ENDED 31 MARCH
EQUITY ATTRIBUTABLE FOREIGN TO CSR CURRENCY EMPLOYEE LIMITED NON- ISSUED HEDGE TRANSLATION SHARE OTHER RETAINED SHARE- CONTROLLING ($ MILLION) CAPITAL RESERVE RESERVE RESERVE RESERVES PROFITS HOLDERS INTERESTS TOTAL
Balance at 1 April 2014 1,042.2 6.0 (4.4) 21.6 (3.3) 39.9 1,102.0 55.2 1,157.2
Net profit – – – – – 125.5 125.5 21.2 146.7
Exchange differences arising on translation of foreign operations – – 1.2 – – – 1.2 – 1.2
Hedge profit recognised in equity – 2.0 – – – – 2.0 0.3 2.3
Hedge profit transferred to the statement of financial performance – (7.5) – – – – (7.5) (3.2) (10.7)
Share of gain on changes in fair value of cash flow hedges of joint ventures – 0.3 – – – – 0.3 – 0.3
Actuarial loss on superannuation defined benefit plans – – – – – (15.4) (15.4) – (15.4)
Income tax benefit relating to components of other comprehensive income – 1.7 – – – 4.7 6.4 0.9 7.3
Total comprehensive (expense) income – (3.5) 1.2 – – 114.8 112.5 19.2 131.7
Payment of ordinary dividends – – – – – (68.3) (68.3) (14.1) (82.4)
Acquisition of treasury shares held by Employee Share Trust – – – – (3.4) – (3.4) – (3.4)
Recognition of share based payments – – – 3.2 – – 3.2 – 3.2
Income tax expense relating to share based payments – – – (0.3) – – (0.3) – (0.3)
Balance at 31 March 2015 1,042.2 2.5 (3.2) 24.5 (6.7) 86.4 1,145.7 60.3 1,206.0
Balance at 1 April 2013 1,042.2 7.7 (6.8) 19.4 – (24.3) 1,038.2 51.8 1,090.0
Net profit – – – – – 88.1 88.1 11.0 99.1
Exchange differences arising on translation of foreign operations – – 2.4 – – – 2.4 – 2.4
Hedge profit recognised in equity – 6.6 – – – – 6.6 3.0 9.6
Hedge profit transferred to the statement of financial performance – (9.0) – – – – (9.0) (4.3) (13.3)
Actuarial gain on superannuation defined benefit plans – – – – – 17.1 17.1 – 17.1
Income tax benefit (expense) relating to components of other comprehensive income – 0.7 – – – (5.1) (4.4) 0.4 (4.0)
Total comprehensive (expense) income – (1.7) 2.4 – – 100.1 100.8 10.1 110.9
Payment of ordinary dividends – – – – – (35.9) (35.9) (9.1) (45.0)
Other items recognised directly in equity – – – – (3.3) – (3.3) – (3.3)
Non-controlling interests on acquisition of subsidiary – – – – – – – 2.4 2.4
Recognition of share based payments – – – 1.8 – – 1.8 – 1.8
Income tax benefit relating to share based payments – – – 0.4 – – 0.4 – 0.4
Balance at 31 March 2014 1,042.2 6.0 (4.4) 21.6 (3.3) 39.9 1,102.0 55.2 1,157.2
Notes to the financial statements are annexed.

CSR ANNUAL REPORT 2015 4948 CSR ANNUAL REPORT 2015
CSR ANNUAL REPORT 2015
STATEMENT OF CASH FLOWSCSR LIMITED AND ITS CONTROLLED ENTITIES (CSR GROUP) YEAR ENDED 31 MARCH
($ MILLION) NOTE 2015 2014
Cash flows from operating activities
Receipts from customers 2,176.2 1,894.8
Payments to suppliers and employees (1,955.5) (1,796.7)
Dividends and distributions received 9.7 10.5
Interest received 3.0 3.0
Income tax (paid) received (2.5) 0.5
Net cash from operating activities 230.9 112.1
Cash flows from investing activities
Purchase of property, plant and equipment and other non-current assets (93.6) (102.0)
Proceeds from sale of property, plant and equipment and other non-current assets 93.5 53.1
Costs associated with acquisition and disposal of businesses (6.7) (1.5)
Purchase of controlled entities and businesses, net of cash acquired 7 (38.1) (10.1)
Loans and receivables advanced (0.5) (3.5)
Net cash used in investing activities (45.4) (64.0)
Cash flows from financing activities
Net repayment of borrowings (34.4) (2.6)
Dividends paid (82.4) (45.0)
Interest and other finance costs paid (6.6) (7.2)
Net cash used in financing activities (123.4) (54.8)
Net increase (decrease) in cash held 62.1 (6.7)
Net cash at the beginning of the financial year 5.9 11.9
Effects of exchange rate changes 0.4 0.7
Net cash at the end of the financial year 9 68.4 5.9
Reconciliation of net profit attributable to shareholders of CSR Limited to net cash from operating activities
Net profit attributable to shareholders of CSR Limited 125.5 88.1
Net profit attributable to non-controlling interests 21.2 11.0
Depreciation and amortisation 5 77.8 76.8
Movement in product liability provision (18.4) (54.7)
Net change in other provisions 5.4 (12.4)
Finance cost net of product liability discount unwind 7.6 9.0
Profit on disposal of assets 2 (35.4) (19.6)
Net change in trade receivables (27.2) (9.1)
Net change in current inventories (3.8) 2.3
Net change in trade payables 29.2 (1.0)
Movement in current and deferred tax balances 43.7 24.6
Net change in other assets and liabilities 5.3 (2.9)
Net cash from operating activities 230.9 112.1
Credit facilities are shown in Note 21 to the financial statements.
Notes to the financial statements are annexed.

CSR ANNUAL REPORT 2015 4948 CSR ANNUAL REPORT 2015
CSR ANNUAL REPORT 2015
SIGNIFICANT ACCOUNTING POLICIES
CSR LIMITED AND ITS CONTROLLED ENTITIES (CSR GROUP) YEAR ENDED 31 MARCH 2015
STATEMENT OF COMPLIANCECSR Limited is a limited company incorporated in Australia whose shares are publicly traded on the Australian Securities Exchange.
This general purpose financial report is prepared in accordance with the Corporations Act 2001 and applicable Accounting Standards and Interpretations, and complies with other requirements of the law. CSR Limited is a “for profit” entity.
The financial report includes the consolidated financial statements of CSR Limited and its controlled entities (CSR group).
Accounting Standards include Australian Accounting Standards. Compliance with Australian Accounting Standards ensures that the financial statements and notes of the company and the CSR group comply with International Financial Reporting Standards.
BASIS OF PREPARATION The financial report is based on historical cost, except for certain assets which are at deemed cost or at their revalued amount.
In preparing this financial report, the CSR group is required to make estimates and assumptions about carrying values of assets and liabilities. These estimates and assumptions are based on historical experience and various other factors that are believed to be reasonable under the circumstances. Actual results may differ from these estimates. The estimates and underlying assumptions are reviewed on an ongoing basis.
The accounting policies adopted are consistent with those of the previous year, unless otherwise stated. Details of the significant accounting policies adopted by the CSR group are provided below.
BASIS OF CONSOLIDATIONThe consolidated financial statements have been prepared by aggregating the financial statements of all the entities that comprise the CSR group, being CSR Limited and its controlled entities. In these consolidated financial statements:• results of each controlled entity are included from the date CSR
Limited obtains control and until such time as it ceases to control an entity; and
• all inter-entity balances and transactions are eliminated.
Control is achieved where CSR Limited is exposed to, or has rights to, variable returns from its involvement with an entity and has the ability to affect those returns through its power to direct the activities of the entity.
Entities controlled by CSR Limited are under no obligation to accept responsibility for liabilities of other common controlled entities except where such an obligation has been specifically undertaken.
JOINT VENTURE AND ASSOCIATE ENTITIESInvestments in joint venture and associate entities have been accounted for under the equity method in the CSR group financial statements.
JOINT OPERATIONSInterests in joint operations are recorded in the financial statements by including the entity’s share of assets employed, the share of liabilities incurred, and the share of any expenses incurred in relation to joint operations in their respective categories.
CHANGE IN ACCOUNTING POLICIES(i) New or revised accounting standardsThe CSR group has adopted all amendments to Australian Accounting Standards which became applicable from 1 April 2014.
Hedge accountingThe CSR group has elected to apply AASB 9 Financial Instruments from 1 April 2014. The new standard provides a simplified model for classifying and recognising financial instruments. It amends hedge accounting
requirements to align more closely with an entity’s risk management framework and permits entities to present changes in its own credit risk in respect of liabilities designated at fair value, which at reporting date are unrealised gains or losses, as other comprehensive income (OCI). See changes to accounting policies note on page 53 for further details on the impact of the change in accounting policy.
(ii) Significant items classificationFrom 1 April 2014, the discount unwind adjustment has been recognised as a significant item given its non-trading nature within the segment information and significant items notes to allow for better interpretation of the CSR group’s financial performance. This amount was and continues to be disclosed as a finance cost. Comparative figures have been adjusted accordingly.
IMPACT OF ACCOUNTING STANDARDS AND INTERPRETATIONS ON ISSUE BUT NOT YET EFFECTIVEThe following Australian Accounting Standards and Interpretations have not yet been adopted by the CSR group:
(i) AASB 9 Financial Instruments (AASB 9)The CSR group has adopted AASB 9 as issued in December 2013, which resulted in changes in accounting policies and adjustments to the amounts recognised in the financial statements. The CSR group has adopted the two main phases relating to classification and measurement of financial assets and financial liabilities (Phase 1) and hedge accounting (Phase 3). The update to AASB 9 Financial Instruments as issued in December 2013 which includes impairment (Phase 2) has not yet been adopted by the CSR group. Phase 2 of this standard is not expected to have a material impact to the CSR group.
(ii) AASB 15 Revenue from Contracts with Customers (AASB 15)This standard was issued in December 2014 and is expected to be first applicable to CSR Limited no earlier than the year commencing 1 April 2017, with amended comparatives. AASB 15 will replace AASB 118 Revenue, which covers contracts for goods and services, and AASB 111 Construction Contracts, which covers construction contracts. The new standard is based on the principle that revenue is recognised when control of a good or service transfers to a customer, that is, the “notion of control” replaces the existing “notion of risks and rewards”. The impact of this standard is not expected to be material to the CSR group.
CURRENCY Unless otherwise shown in the financial statements, amounts are in Australian dollars, which is the CSR group’s functional currency.
CRITICAL ACCOUNTING JUDGEMENTS AND KEY SOURCES OF ESTIMATION UNCERTAINTYThe following are critical judgements and key assumptions that management has made in the process of applying the CSR group’s accounting policies and that have the most significant effect on the amounts recognised in the financial statements:
Product liability: CSR Limited and/or certain subsidiaries (CSR) were involved in mining asbestos and manufacturing and marketing products containing asbestos in Australia, and exporting asbestos to the United States. CSR’s involvement in asbestos ceased with the disposal of the Wunderlich asbestos cement business in 1977. As a result of these activities, CSR has been named as a defendant in litigation in Australia and the United States. At 31 March 2015, a provision of $350.7 million (2014: $369.1 million) has been made for all known claims and reasonably foreseeable future claims. Refer to Note 38 for further details of the key assumptions and uncertainties in estimating this liability.

CSR ANNUAL REPORT 2015 5150 CSR ANNUAL REPORT 2015
CSR ANNUAL REPORT 2015
SIGNIFICANT ACCOUNTING POLICIES CONTINUEDCSR LIMITED AND ITS CONTROLLED ENTITIES (CSR GROUP) YEAR ENDED 31 MARCH 2015
Asset impairment: Assets are reviewed for impairment at each reporting date in accordance with the CSR group accounting policy. Where a valuation is required, the valuation is determined using discounted cash flows. Management judgement is required in these valuations to forecast future cash flows and a suitable discount rate in order to calculate the present value of these future cash flows. Future cash flows take into consideration forecast changes in the building cycle, aluminium prices and exchange rates where appropriate.
Cash flows are reforecast annually, covering the next 10 years and a valuation calculated using a post-tax annual discount rate of 10.2% for all segments other than Aluminium which uses 12.2% (2014: 10.2% for all segments other than Aluminium which was 12.2%). Discounted cash flow projections over a 10 year period are used and deemed appropriate given the cyclical nature of the markets in which the CSR group operates. The first five years represent financial plans forecast by management, based on the CSR group’s view of the respective cycle, with years six to 10 applying averaging assumptions to ensure cash flows in year 10 are sufficiently stable to apply the terminal value. A terminal value is used from year 11 onwards including an annual growth rate, which was 2.5% in the year ended 31 March 2015 (2014: 2.5%).
Measurement of provisions for restoration and environmental rehabilitation and legal claims: The CSR group is in the process of remediating land in relation to legacy factory sites and is involved in a number of ongoing legal disputes. Judgement is required in arriving at an estimate of future costs required to extinguish these obligations. Expert advice is relied upon (where available) and known facts at the date of this report are considered to arrive at the best estimate for future liabilities that the CSR group will incur. Given the nature of these issues, circumstances may change and estimates and provisions will be updated accordingly. Refer to Note 22.
Provision for uninsured losses and future claims: The provision for uninsured losses and future claims relates to the CSR group’s self insurance for workers’ compensation program. CSR Limited is a licensed self insurer in New South Wales, Queensland, Victoria, Western Australia and the Australian Capital Territory for workers’ compensation insurance. As at 31 March 2015, a provision of $29.2 million (2014: $31.3 million) has been made for all known claims and reasonably foreseeable future claims. Management assesses the provision at each reporting date and obtains reports from independent experts annually. Refer to Note 22.
Non consolidation of entities in which the CSR group holds more than 50%: The directors have determined that they do not control Viridian Glass Limited Partnership even though the CSR group owns a 58% of the interest of this entity. It is not a controlled entity of CSR Limited because the decisions over the relevant activities of the entity require unanimous consent between the two partners. Refer to Note 33.
Classification of joint arrangements: The agreements in relation to the existing joint arrangements require unanimous consent over the relevant activities between the CSR group and at least one other participant. Where the CSR group is jointly and severally liable for the assets and liabilities incurred by the partnership, it will classify the entity as a joint operation and recognise its direct right to the assets and liabilities. Where the CSR group and the parties to the agreements only have rights to the net assets of each of the partnerships under the arrangements, these entities will be classified as joint ventures of the CSR group and accounted for using the equity method. Refer to Note 33.
SIGNIFICANT ITEMS Significant items are those which by their size, nature or incidence are relevant in explaining the financial performance of the CSR group, and as such are disclosed separately. Refer to Note 3.
REVENUE RECOGNITIONTrading revenue is measured at the fair value of the consideration receivable, and is recognised when each of the following conditions is met:
• persuasive evidence of an arrangement exists, which is usually in the form of a contractual arrangement;
• the significant risks and rewards of ownership of the goods have transferred from the CSR group to the buyer;
• the seller’s price to the buyer is fixed or determinable; and• collectibility is reasonably assured.
LEASESLeases in which a significant portion of the risks and rewards of ownership are not transferred to the CSR group as lessee are classified as operating leases. Payments made under operating leases (net of any incentives received by the lessor) are charged to the statement of financial performance on a straight-line basis over the period of the lease.
NET FINANCE COSTInterest income and expense are accrued on a time basis, by reference to the principal outstanding and at the applicable effective interest rates.
Funding costs are capitalised and subsequently amortised over the term of the facility. Unwinding of the interest component of discounted assets and liabilities is treated as interest (finance cost).
TAX CONSOLIDATION Legislation to allow groups, comprising a parent entity and its Australian resident wholly owned entities, to elect to consolidate and be treated as a single entity for income tax purposes, was substantively enacted on 21 October 2002.
The CSR group has elected for those entities within the CSR group that are wholly owned Australian resident entities to be taxed as a single entity from 1 April 2004.
Prior to the adoption of the tax consolidation system, CSR Limited, as the head entity in the tax consolidated group, agreed to compensate or be compensated by its wholly owned controlled entities for the balance of their current tax liability (or asset) and any tax loss related deferred tax asset assumed by CSR Limited. Due to the existence of a tax funding arrangement between the entities in the tax consolidated group, amounts are recognised as payable to or receivable by CSR Limited and each member of the group in relation to the tax contribution amounts paid or payable between CSR Limited and the other members of the tax consolidated group in accordance with the arrangement.
INCOME TAXCurrent tax is calculated by reference to the amount of income taxes payable or recoverable in respect of the taxable income for the financial year. It is calculated using tax rates and tax laws that have been enacted or substantively enacted by the reporting date. Current tax for current and prior periods is recognised as a liability (or asset) to the extent that it is unpaid (or refundable).
Deferred income tax is accounted for using the comprehensive balance sheet liability method in respect of temporary differences arising from differences between the carrying amount of assets and liabilities in the financial statements and the corresponding tax base of those items. In principle, deferred tax assets or liabilities are recognised for all taxable temporary differences. Deferred tax assets are recognised to the extent that it is probable that sufficient taxable amounts will be available against which deductible temporary differences or unused tax losses and tax offsets can be utilised. A deferred tax liability is not recognised in relation to taxable temporary differences arising from goodwill.

CSR ANNUAL REPORT 2015 5150 CSR ANNUAL REPORT 2015
CSR ANNUAL REPORT 2015
SIGNIFICANT ACCOUNTING POLICIES CONTINUEDCSR LIMITED AND ITS CONTROLLED ENTITIES (CSR GROUP) YEAR ENDED 31 MARCH 2015
Deferred tax assets and liabilities are measured at the tax rates that are expected to apply to the period(s) when the asset and liability giving rise to them are realised or settled, based on tax rates (and tax laws) that have been enacted or substantively enacted by reporting date. The measurement of deferred tax assets and liabilities reflects the tax consequences that would follow from the manner in which the CSR group expects, at the reporting date, to recover or settle the carrying amount of its assets and liabilities.
Deferred tax assets and liabilities are not recognised for temporary differences between the carrying amount and tax bases of investments in controlled entities where the parent entity is able to control the timing of the reversal of the temporary differences and it is probable that the differences will not reverse in the foreseeable future.
Deferred tax assets and liabilities are offset when they relate to income tax levied by the same taxation authority and when the CSR group intends to settle the tax assets and liabilities on a net basis.
No provision for withholding tax has been made on undistributed earnings of overseas controlled entities where there is no intention to distribute those earnings.
Current and deferred tax is recognised as an expense in the statement of financial performance except when it relates to items credited or debited directly to equity, in which case the deferred tax is also recognised directly in equity, or where it arises from an initial accounting for a business acquisition, in which case it is taken into account in the determination of goodwill.
GOODS AND SERVICES TAXRevenues, expenses and assets are recognised net of the amount of goods and services tax (GST), except where the amount of GST incurred is not recoverable from the taxation authority. In these circumstances, the GST is recognised as part of the cost of acquisition of the asset or as part of the expense.
Receivables and payables are stated with the amount of GST included. The net amount of GST recoverable from, or payable to, the taxation authority is included as a current asset or liability.
Cash flows are included in the statement of cash flows on a gross basis. The GST components of cash flows arising from investing and financing activities which are recoverable from, or payable to, the taxation authority are classified as operating cash flows.
FOREIGN CURRENCY All foreign currency transactions during the financial year have been brought to account using the exchange rate in effect at the date of the transaction. Foreign currency monetary items at reporting date are translated at the exchange rate existing at that date. Exchange differences are brought to account in profit or loss in the period in which they arise except if designated as cash flow hedges.
On consolidation, the results and financial position of foreign operations are translated as follows:
• assets and liabilities are translated using exchange rates prevailing at the end of the reporting period;
• income and expense items are translated at the average exchange rates for the period; and
• exchange differences arising, if any, are recognised in the foreign currency translation reserve and recognised in profit or loss on disposal of the operation.
CASH AND CASH EQUIVALENTSNet cash is defined as cash at banks and on hand and cash equivalents, net of bank overdrafts. Cash equivalents include highly liquid investments which are readily convertible to cash, and loans which are not subject to a term facility.
TRADE RECEIVABLESTrade receivables are recognised initially at fair value and subsequently measured at amortised cost. An allowance for doubtful debts is raised based on a review of outstanding balances at balance date. Bad debts are written off against the allowance account and any other change in the allowance account is recognised in the statement of financial performance.
INVENTORIESInventories are valued at the lower of cost and net realisable value. Costs included in inventories consist of materials, labour and manufacturing overheads which are related to the purchase and production of inventories. The value of inventories is derived by the method most appropriate to each particular class of inventories. The major portion is valued on either a first-in-first-out or average cost basis.
ACQUISITION OF ASSETSAssets acquired are recorded at the cost of acquisition, being the purchase consideration determined as at the date of acquisition. In the event that settlement of all or part of the cash consideration given in the acquisition of an asset is deferred, the fair value of the purchase consideration is determined by discounting the amounts payable in the future to their value as at the date of acquisition.
DEPRECIATION Depreciable assets are depreciated at rates based upon their expected economic life using the straight-line method. The economic lives of property, plant and equipment assets are detailed in Note 14.
INTANGIBLE ASSETS Goodwill represents the excess of the cost of acquisition over the fair value of the identifiable assets and liabilities acquired. Goodwill is not amortised, but tested annually or whenever there is an indication that the goodwill may be impaired. Any impairment is recognised immediately in the statement of financial performance and is not subsequently reversed. Certain trade names determined as having an indefinite life are not amortised but are assessed annually for impairment. Internal costs relating to acquired intangible assets are expensed.
Other intangible assets, including software and capitalised development costs, are initially recorded at cost and subsequently amortised over the period over which the benefits are expected to arise; in most cases, this is five years.
FINANCIAL ASSETSFinancial assets are classified as available for sale financial assets, or loans and receivables (stated at amortised cost less impairment). The classification depends on the nature and purpose of the financial asset and is determined at the time of initial recognition.

CSR ANNUAL REPORT 2015 5352 CSR ANNUAL REPORT 2015
CSR ANNUAL REPORT 2015
SIGNIFICANT ACCOUNTING POLICIES CONTINUEDCSR LIMITED AND ITS CONTROLLED ENTITIES (CSR GROUP) YEAR ENDED 31 MARCH 2015
IMPAIRMENT OF ASSETS Goodwill and intangible assets that have an indefinite useful life are not subject to amortisation and are tested annually for impairment, or more frequently if events or changes in circumstances indicate that they might be impaired.
Other assets are reviewed for impairment at each reporting date to determine whether there is any indication that those assets have suffered an impairment loss. If any such indication exists, the recoverable amount of the asset is estimated in order to determine the extent of the impairment loss. If the recoverable amount of a cash generating unit is estimated to be less than its carrying amount, the carrying amount of the cash generating unit is reduced to its recoverable amount.
PUT OPTION LIABILITIES FOR NON-CONTROLLING INTERESTSContracts that contain an obligation to pay cash in the future to purchase minority shares held by non-controlling interests, even if the payment is conditional on the option being exercised by the holder, are recorded as a financial liability.
The initial redemption liability is recorded against equity. The financial liability is recognised at the present value of the expected redemption amount. Any adjustments to the liability are recorded through equity.
PAYABLES Trade and other payables are recognised when the CSR group becomes obliged to make future payments resulting from the purchase of goods and services. Payables are stated at their amortised cost.
BORROWINGS Borrowings are recorded initially at fair value, net of transaction costs. Subsequent to initial recognition, borrowings are measured at amortised cost with any difference between the initial recognised amount and the redemption value being recognised in profit or loss over the period of the borrowing using the effective interest rate method.
EMPLOYEE BENEFITSProvision is made for benefits accruing to employees in respect of wages and salaries, annual leave, long service leave and other employee obligations (based on wage rates expected at the time of settling the liability) when it is probable that settlement will be required and they are capable of being reliably measured.
Provisions made in respect of employee benefits expected to be settled within 12 months are measured at their nominal values using the remuneration rate expected to apply at the time of settlement.
Provisions made in respect of employee benefits which are not expected to be settled within 12 months are measured as the present value of the estimated future cash outflows to be made by the CSR group.
For superannuation defined benefit plans, the cost of providing benefits is determined using the projected unit credit method, with actuarial valuations being carried out at each reporting date. Actuarial gains and losses are recognised in full, directly in retained profits, in the period in which they occur, and are presented in the statement of comprehensive income. Past service cost is recognised immediately to the extent that the benefits are already vested, and otherwise is amortised on a straight-line basis over the average period until the benefits become vested. The defined benefit obligation recognised in the statement of financial position represents the present value of the defined benefit obligation, adjusted for unrecognised past service cost, net of the fair value of the plan assets. Any asset resulting from this calculation is limited to past service costs, plus the present value of available refunds and reductions in future contributions to the plan.
Contributions to superannuation defined contribution plans are expensed when incurred and the CSR group’s legal or constructive obligation is limited to these contributions.
SHARE BASED PAYMENTS The fair value determined at the grant date of the equity-settled share based payments is expensed on a straight-line basis over the vesting period, based on the CSR group’s estimate of shares that will eventually vest.
PROVISIONSProvisions are recognised when the CSR group has a present obligation (legal or constructive) as a result of a past event, it is probable that settlement will be required and the obligation can be reliably estimated.
Provision for product liability: The CSR group’s provision for product liability is determined using reports provided by independent experts in each of Australia and the United States. The CSR group has included within the provision an appropriate prudential margin. Refer to Note 38 for further information on the basis for determining the product liability provision.
Provision for restoration and environmental rehabilitation: The net present value of estimated costs of environmental rehabilitation of commercial sites which require remediation of existing conditions resulting from present and past operations is taken up as a provision. The liability is immediately recognised when the environmental exposure is identified and the rehabilitation costs can be reliably estimated. The estimate is revised at each reporting period and the provision is adjusted accordingly.
Provision for uninsured losses and future claims: The provision for uninsured losses and future claims relates to the CSR group’s self insurance for workers’ compensation program. The provision recognises the best estimate of the consideration required to settle the present obligation for anticipated compensation payments and is determined at each reporting date using reports provided by independent experts annually.
FINANCIAL INSTRUMENTSDerivatives are initially recognised at fair value on the date a derivative contract is entered into and are subsequently remeasured to their fair value at each reporting date. The resulting gain or loss is recognised in profit or loss immediately unless the derivative is designated and effective as a hedging instrument, in which event the timing of the recognition in income depends on the nature of the hedge relationship. The CSR group designates certain derivatives as either hedges of the fair value of recognised assets or liabilities or firm commitments (fair value hedges), or hedges of highly probable forecast transactions (cash flow hedges).
Fair value hedges: Changes in the fair value of derivatives that are designated and qualify as fair value hedges are recorded in profit or loss immediately, together with any changes in the fair value of the hedged asset or liability that is attributable to the hedged risk.
Cash flow hedges: The effective portion of changes in the fair value of derivatives that are designated and qualify as cash flow hedges are deferred in equity. The gain or loss relating to the ineffective portion is recognised immediately in profit or loss. Amounts deferred in equity are recycled in profit or loss in the periods when the hedged item is recognised in profit or loss.
Embedded derivatives: Derivatives embedded in other financial instruments or other host contracts are treated as separate derivatives when their risks and characteristics are not closely related to those of the host contracts.

CSR ANNUAL REPORT 2015 5352 CSR ANNUAL REPORT 2015
CSR ANNUAL REPORT 2015
SIGNIFICANT ACCOUNTING POLICIES CONTINUEDCSR LIMITED AND ITS CONTROLLED ENTITIES (CSR GROUP) YEAR ENDED 31 MARCH 2015
COMPARATIVE INFORMATIONWhere applicable, comparative information has been reclassified in order to comply with current period disclosure requirements.
ROUNDINGUnless otherwise shown in the financial statements, amounts have been rounded to the nearest tenth of a million dollars and are shown by $ million. CSR Limited is a company of the kind referred to in the Australian Securities and Investments Commission (ASIC) Class Order 98/100 issued 10 July 1998.
CHANGES TO ACCOUNTING POLICIESThe CSR group has adopted AASB 9 Financial Instruments as issued in December 2013, which resulted in changes in accounting policies and adjustments to the amounts recognised in the financial statements. The CSR group has adopted the two main phases relating to classification and measurement of financial assets and financial liabilities (Phase 1) and hedge accounting (Phase 3). The update to AASB 9 as issued in July 2014 which includes impairment (Phase 2) has not yet been adopted by the CSR group.
Recognition and measurement of financial instrumentsThe policies were changed to comply with AASB 9 as issued in December 2013 which replaces the provisions of AASB 139 Financial Instruments – Recognition and Measurement that relate to the recognition, classification and measurement of financial assets and financial liabilities and the derecognition of financial instruments. It requires financial assets to be classified into two measurement categories: those measured at fair value and those measured at amortised cost. The determination is made at initial recognition. The classification depends on the entity’s business model for managing its financial instruments and the contractual cash flow characteristics of the instrument.
While AASB 9 does not need to be applied until 1 January 2018, the CSR group decided to adopt it early from 1 April 2014. On that date, CSR group’s management has assessed which business models apply to the financial assets held by the CSR group at the date of initial application of AASB 9 (1 April 2014). The main effects resulting from this assessment were immaterial.
There were no changes in the levels of fair value measurement of the financial instruments as a result of the application of AASB 9.
Hedge accounting policy and impact of adopting AASB 9The CSR group’s hedge accounting policies were changed to comply with AASB 9 on a prospective basis. The current year impact primarily relates to the impact of hedge accounting on a component of commodity price risk, which is now permitted under AASB 9. The current year impact on the individual line items in the financial statements as a result of adopting AASB 9 is summarised in the table below. There has been no impact for the year ended 31 March 2014 following the adoption of AASB 9 as issued in December 2013.
Current year impact
Profit 2015 2015 Increase as presented ($ MILLION) (under AASB 139) (decrease) (under AASB 9)
Statement of financial performance (extract)
Other income 43.9 (4.7) 39.2
Income tax expense (47.6) 1.4 (46.2)
Net impact on profit for the period (3.7) (3.3) (7.0)
Statement of comprehensive income (extract)
Items that may be reclassified to profit or lossHedge (loss) profit recognised in equity (2.4) 4.7 2.3
Income tax relating to these items 4.0 (1.4) 2.6
Net impact on other comprehensive income (net of tax) 1.6 3.3 4.9
Net impact on total comprehensive income (2.1) – (2.1)
EARNINGS PER SHARE (CENTS)
Basic earnings per share attributable to shareholders of CSR Limiteda 25.6 (0.7) 24.9
Diluted earnings per share attributable to shareholders of CSR Limiteda 25.6 (0.7) 24.9
a Weighted number of shares used in the calculation of earnings per share is 504.2 million (2014: 503.9 million). Refer to the Statement of Financial Performance for details on calculation of weighted number of shares.
There is no impact to the Statement of Financial Position as adoption of AASB 9 did not change classification or measurement of the financial instruments held by the CSR group.
CSR ANNUAL REPORT 2015 5554 CSR ANNUAL REPORT 2015
CSR ANNUAL REPORT 2015
NOTES TO THE FINANCIAL STATEMENTSCSR LIMITED AND ITS CONTROLLED ENTITIES (CSR GROUP) YEAR ENDED 31 MARCH 2015
1. SEGMENT INFORMATION Operating and reportable segmentsThe CSR group has identified its operating segments based on the internal reports that are reviewed and used by the board of directors in its role as the chief operating decision maker (CODM) in assessing performance and in determining the allocation of resources. Operating segments are identified by management and the board of directors based on the nature of the product sold and production processes involved. Reportable segments are based on aggregated operating segments determined by the similarity of the products produced and sold as these are the sources of the CSR group’s major risks and have the most effect on the rates of return. Each of the business units disclosed below has been determined as both an operating segment and reportable segment.
Building Products Lightweight Systems (Gyprock plasterboard, Hebel autoclaved aerated concrete products, Cemintel fibre cement, Ceilector ceiling solutions, Potter interior systems and Rondo rollformed steel products joint venture), Insulation (Bradford and Martini insulation, Bradford energy solutions and Edmonds ventilation systems) and AFS walling systems.
Bricks and Roofing (PGH bricks, Monier roofing and New Zealand Brick Distributors joint venture).
Glass The Glass business includes the operations of Viridian, Australia’s leading architectural glass provider and the only manufacturer of float glass and hard coated performance products in Australia. It manufactures clear float, coated and bulk laminate glass in Victoria and value-added processing of glass from a number of facilities across Australia. It also participates in a glass processing joint venture in New Zealand.
Aluminium The Aluminium business unit relates to the CSR group’s 70% interest in Gove Aluminium Finance Limited, which in turn holds a 36.05% interest in the Tomago aluminium smelter (i.e. an effective interest of 25.24%). Gove Aluminium Finance Limited sources alumina, has it toll manufactured by Tomago and then sells aluminium into predominantly the Asian market. Products from the aluminium business include aluminium ingots, billets and slabs.
Property The Property business unit generates returns typically from the sale of former operating sites by advancing the sites through various stages of the development cycle. In addition, this business is currently involved in a small number of large-scale developments in New South Wales, Queensland and Victoria. These projects, in most cases, are in-fill developments (currently vacant land or discontinued operating sites within otherwise built up areas) located in metropolitan regions.
Accounting policies and inter-segment transactionsThe accounting policies used by the CSR group in reporting segments internally are the same as those disclosed in the significant accounting policies included within these financial statements, with the exception that significant items (i.e. those items which by their size, nature or incidence are relevant in explaining financial performance) are excluded from trading profits. This approach is consistent with the manner in which results are reported to the CODM.
Transfers of assets between segments are recognised at book value.
It is the CSR group’s policy that if items of revenue and expense are not allocated to operating segments, then any associated assets and liabilities are also not allocated to segments. This is to avoid asymmetrical allocations within segments which management believes would be inconsistent. Reporting provided to the board of directors in respect of earnings is primarily measured based on earnings before interest and tax (EBIT), excluding significant items, with significant items reviewed and reported separately to the CODM.
The following items and associated assets and liabilities are not allocated to operating segments as they are not considered part of the core trading operations of any segment:
• corporate overheads;• restructuring and provisions (including product liability provisions);• net finance cost; and• significant items.

CSR ANNUAL REPORT 2015 5554 CSR ANNUAL REPORT 2015
CSR ANNUAL REPORT 2015
NOTES TO THE FINANCIAL STATEMENTS CONTINUEDCSR LIMITED AND ITS CONTROLLED ENTITIES (CSR GROUP) YEAR ENDED 31 MARCH 2015
1. SEGMENT INFORMATION (CONTINUED)
NET PROFIT (LOSS) ATTRIBUTABLE TO PROFIT (LOSS) INCOME TAX NON-CONTROLLING SHAREHOLDERS OF BEFORE INCOME TAX (EXPENSE) BENEFIT INTERESTS CSR LIMITED
2014 2014 2014 ($ MILLION) NOTE 2015 (Restated)a 2015 (Restated)a 2015 2014 2015 (Restated)a
Business segments
Building Products 120.9 92.6 (33.8) (25.8) (0.1) (0.1) 87.0 66.7
Glass 3.1 (14.9) (1.1) 4.9 – – 2.0 (10.0)
Aluminium 104.3 51.9 (31.3) (12.4) (21.1) (10.9) 51.9 28.6
Property 30.2 17.3 (3.9) (3.3) – – 26.3 14.0
Segment total 258.5 146.9 (70.1) (36.6) (21.2) (11.0) 167.2 99.3
Corporateb (18.0) (15.7) 4.3 5.7 – – (13.7) (10.0)
Restructuring and provisionsc (5.1) (5.5) 1.3 1.1 – – (3.8) (4.4)
Earnings before interest and significant items 235.4 125.7 (64.5) (29.8) (21.2) (11.0) 149.7 84.9
Net finance cost 4 (4.6) (6.5) 1.4 2.1 – – (3.2) (4.4)
Total before significant items 230.8 119.2 (63.1) (27.7) (21.2) (11.0) 146.5 80.5
Significant items 3 (37.9) 4.1 16.9 3.5 – – (21.0) 7.6
Total after significant items 192.9 123.3 (46.2) (24.2) (21.2) (11.0) 125.5 88.1
SHARE OF NET PROFIT DEPRECIATION AND ADDITIONS TO TOTAL REVENUEd OF JOINT VENTURES AMORTISATIONe NON-CURRENT ASSETSf
($ MILLION) NOTE 2015 2014 2015 2014 2015 2014 2015 2014
Business segments
Building Products 1,211.4 1,029.2 12.0 11.3 40.1 38.0 99.0 45.5
Glass 280.9 262.1 1.0 (0.7) 9.7 10.8 2.5 8.8
Aluminium 536.0 458.1 – – 27.2 26.9 6.8 5.2
Property 34.3 20.1 – – – – 37.0 34.3
Segment total 2,062.6 1,769.5 13.0 10.6 77.0 75.7 145.3 93.8
Corporateb – – – – 0.8 1.1 – 1.3
Restructuring and provisionsc – – (1.3) (1.2) – – – –
Interest income 4 3.0 2.5 – – – – – –
Total before significant items 2,065.6 1,772.0 11.7 9.4 77.8 76.8 145.3 95.1
Significant items 3 – 33.0 – – – – – –
Total after significant items 2,065.6 1,805.0 11.7 9.4 77.8 76.8 145.3 95.1

CSR ANNUAL REPORT 2015 5756 CSR ANNUAL REPORT 2015
CSR ANNUAL REPORT 2015
NOTES TO THE FINANCIAL STATEMENTS CONTINUEDCSR LIMITED AND ITS CONTROLLED ENTITIES (CSR GROUP) YEAR ENDED 31 MARCH 2015
1. SEGMENT INFORMATION (CONTINUED)
INVESTMENTS ACCOUNTED FOR USING ASSETSg LIABILITIES THE EQUITY METHOD
($ MILLION) 2015 2014 2015 2014 2015 2014
Building Products 1,060.6 979.2 228.4 188.7 40.3 37.9
Glass 248.5 250.2 67.4 67.3 23.0 21.9
Aluminium 290.2 276.6 111.8 66.3 – –
Property 139.0 153.8 14.8 18.8 – –
Segment total 1,738.3 1,659.8 422.4 341.1 63.3 59.8
Unallocatedc 38.4 39.6 451.4 443.6 – –
1,776.7 1,699.4 873.8 784.7 63.3 59.8
Cash/borrowings 68.4 5.9 – 34.4 – –
Tax assets/liabilities 274.2 303.0 39.5 32.0 – –
Group total 2,119.3 2,008.3 913.3 851.1 63.3 59.8
a On 1 April 2014 a change in accounting policy over the classification of the discount unwind for the asbestos liability was adopted by CSR Limited, resulting in a restatement of balances for the financial year ended 31 March 2014. Refer to Significant Accounting Policies.
b Represents unallocated overhead and other revenues.c Includes legal and managerial costs associated with long term product liabilities and minor product liability claims that arise from time to time, certain defined benefit
superannuation liabilities and expenses, other payables, non-operating revenue and other costs (excluding those categorised as significant items).d Inter-segment sales are negligible. Total revenue includes trading revenue, other income, interest income and dividend income from other entities and excludes share
of net profit of associates.e Depreciation and amortisation includes $4.1 million (2014: $3.5 million) amortisation of intangible assets. Other significant non-cash expenses such as movements
in provisions and other rationalisation expenses which are significant items are disclosed in Note 3. Other non-cash expenses are immaterial.f Includes additions for property, plant and equipment, goodwill and other intangible assets acquired through capital expenditure and business combinations.g All acquisitions of controlled entities and businesses in 2015 and 2014 were in Building Products.
Geographical informationThe CSR group operates principally in Australia. For the year ended 31 March 2015, the CSR group’s trading revenue from external customers in Australia amounted to $1,969.9 million (2014: $1,692.4 million), with $53.5 million (2014: $54.2 million) of trading revenue related to other geographical areas. The CSR group’s non-current assets excluding investments accounted for using the equity method, deferred tax assets and other financial assets from continuing operations in Australia amounted to $1,028.0 million at 31 March 2015 (2014: $991.8 million), with $49.3 million (2014: $48.0 million) related to other geographical areas.
2. OTHER INCOME AND EXPENSES
($ MILLION) NOTE 2015 2014
Income
Significant items 3 – 33.0
Profit on disposal of assets 35.4 19.6
Other 3.8 3.3
Total other income 39.2 55.9
Expenses
Significant items 3 (24.8) (16.8)
Other (0.7) (0.7)
Total other expenses (25.5) (17.5)
During the financial year ended 31 March 2015, expenses incurred in relation to employee benefits amounted to $454.6 million (2014: $433.5 million) and defined contribution expense amounted to $29.1 million (2014: $23.7 million).
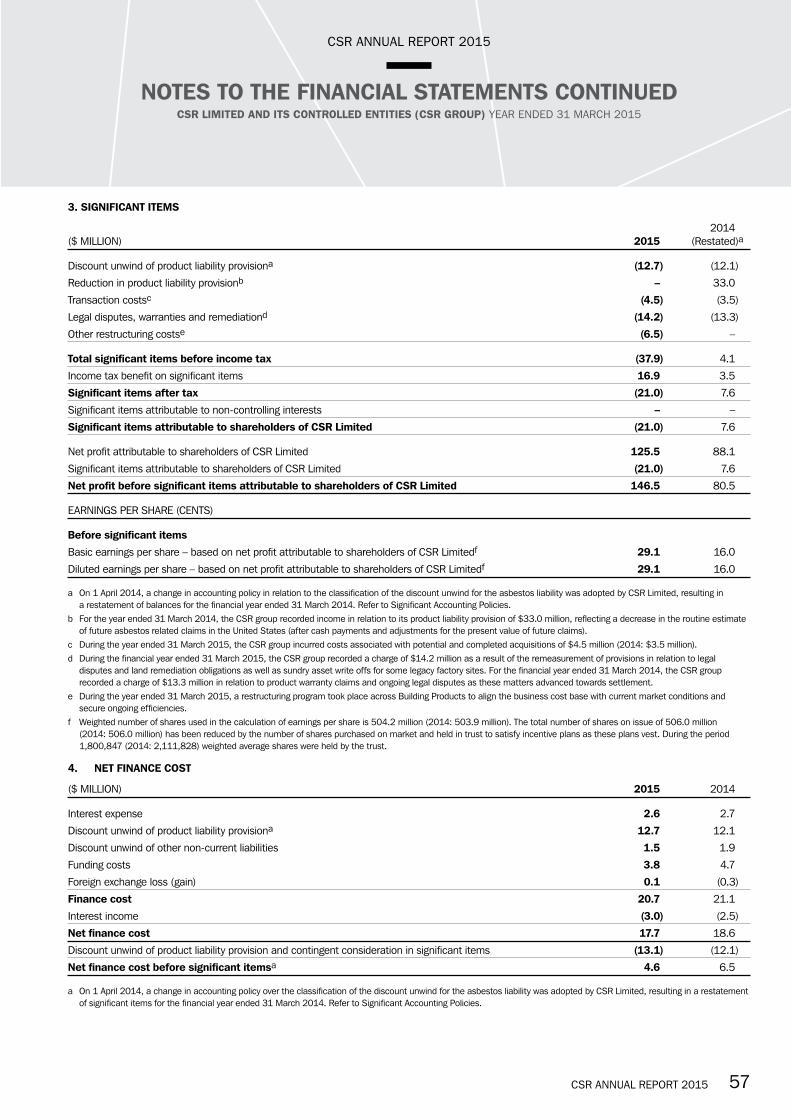
CSR ANNUAL REPORT 2015 5756 CSR ANNUAL REPORT 2015
CSR ANNUAL REPORT 2015
NOTES TO THE FINANCIAL STATEMENTS CONTINUEDCSR LIMITED AND ITS CONTROLLED ENTITIES (CSR GROUP) YEAR ENDED 31 MARCH 2015
3. SIGNIFICANT ITEMS
2014 ($ MILLION) 2015 (Restated)a
Discount unwind of product liability provisiona (12.7) (12.1)
Reduction in product liability provisionb – 33.0
Transaction costsc (4.5) (3.5)
Legal disputes, warranties and remediationd (14.2) (13.3)
Other restructuring costse (6.5) –
Total significant items before income tax (37.9) 4.1
Income tax benefit on significant items 16.9 3.5
Significant items after tax (21.0) 7.6
Significant items attributable to non-controlling interests – –
Significant items attributable to shareholders of CSR Limited (21.0) 7.6
Net profit attributable to shareholders of CSR Limited 125.5 88.1
Significant items attributable to shareholders of CSR Limited (21.0) 7.6
Net profit before significant items attributable to shareholders of CSR Limited 146.5 80.5
EARNINGS PER SHARE (CENTS)
Before significant items
Basic earnings per share – based on net profit attributable to shareholders of CSR Limitedf 29.1 16.0
Diluted earnings per share – based on net profit attributable to shareholders of CSR Limitedf 29.1 16.0
a On 1 April 2014, a change in accounting policy in relation to the classification of the discount unwind for the asbestos liability was adopted by CSR Limited, resulting in a restatement of balances for the financial year ended 31 March 2014. Refer to Significant Accounting Policies.
b For the year ended 31 March 2014, the CSR group recorded income in relation to its product liability provision of $33.0 million, reflecting a decrease in the routine estimate of future asbestos related claims in the United States (after cash payments and adjustments for the present value of future claims).
c During the year ended 31 March 2015, the CSR group incurred costs associated with potential and completed acquisitions of $4.5 million (2014: $3.5 million).d During the financial year ended 31 March 2015, the CSR group recorded a charge of $14.2 million as a result of the remeasurement of provisions in relation to legal
disputes and land remediation obligations as well as sundry asset write offs for some legacy factory sites. For the financial year ended 31 March 2014, the CSR group recorded a charge of $13.3 million in relation to product warranty claims and ongoing legal disputes as these matters advanced towards settlement.
e During the year ended 31 March 2015, a restructuring program took place across Building Products to align the business cost base with current market conditions and secure ongoing efficiencies.
f Weighted number of shares used in the calculation of earnings per share is 504.2 million (2014: 503.9 million). The total number of shares on issue of 506.0 million (2014: 506.0 million) has been reduced by the number of shares purchased on market and held in trust to satisfy incentive plans as these plans vest. During the period 1,800,847 (2014: 2,111,828) weighted average shares were held by the trust.
4. NET FINANCE COST
($ MILLION) 2015 2014
Interest expense 2.6 2.7
Discount unwind of product liability provisiona 12.7 12.1
Discount unwind of other non-current liabilities 1.5 1.9
Funding costs 3.8 4.7
Foreign exchange loss (gain) 0.1 (0.3)
Finance cost 20.7 21.1
Interest income (3.0) (2.5)
Net finance cost 17.7 18.6
Discount unwind of product liability provision and contingent consideration in significant items (13.1) (12.1)
Net finance cost before significant itemsa 4.6 6.5
a On 1 April 2014, a change in accounting policy over the classification of the discount unwind for the asbestos liability was adopted by CSR Limited, resulting in a restatement of significant items for the financial year ended 31 March 2014. Refer to Significant Accounting Policies.
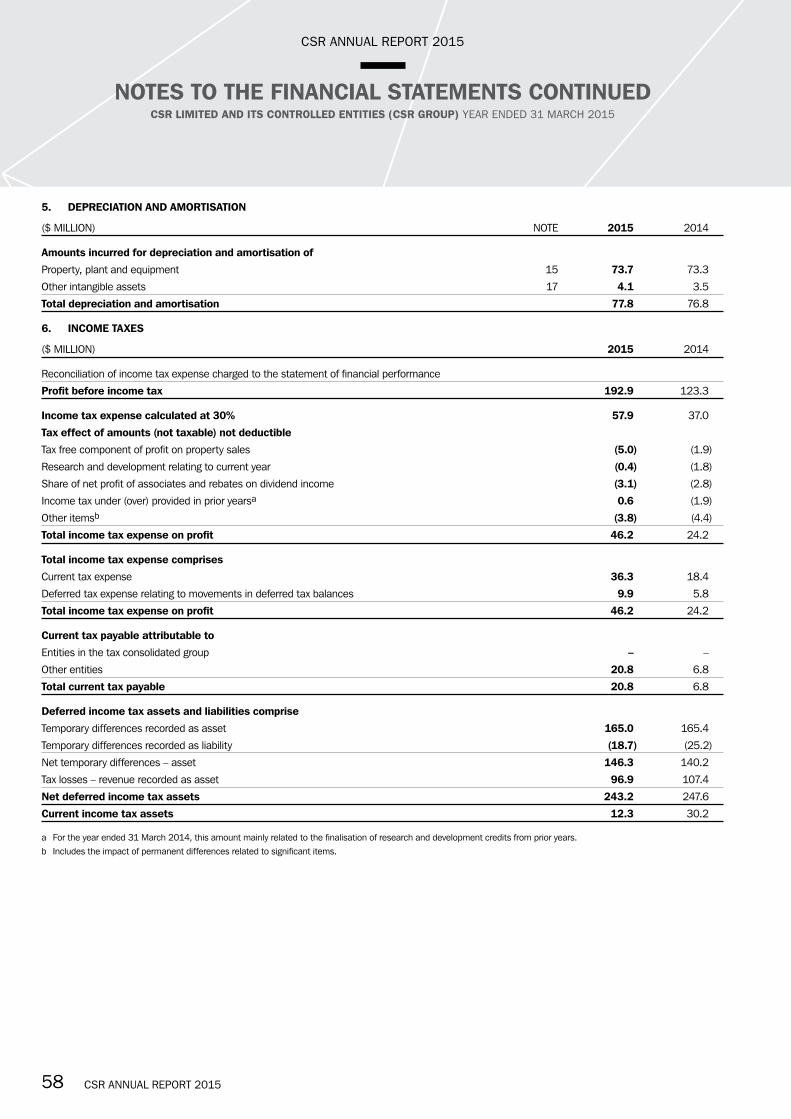
CSR ANNUAL REPORT 2015 5958 CSR ANNUAL REPORT 2015
CSR ANNUAL REPORT 2015
NOTES TO THE FINANCIAL STATEMENTS CONTINUEDCSR LIMITED AND ITS CONTROLLED ENTITIES (CSR GROUP) YEAR ENDED 31 MARCH 2015
5. DEPRECIATION AND AMORTISATION
($ MILLION) NOTE 2015 2014
Amounts incurred for depreciation and amortisation of
Property, plant and equipment 15 73.7 73.3
Other intangible assets 17 4.1 3.5
Total depreciation and amortisation 77.8 76.8
6. INCOME TAXES
($ MILLION) 2015 2014
Reconciliation of income tax expense charged to the statement of financial performance
Profit before income tax 192.9 123.3
Income tax expense calculated at 30% 57.9 37.0
Tax effect of amounts (not taxable) not deductible
Tax free component of profit on property sales (5.0) (1.9)
Research and development relating to current year (0.4) (1.8)
Share of net profit of associates and rebates on dividend income (3.1) (2.8)
Income tax under (over) provided in prior yearsa 0.6 (1.9)
Other itemsb (3.8) (4.4)
Total income tax expense on profit 46.2 24.2
Total income tax expense comprises
Current tax expense 36.3 18.4
Deferred tax expense relating to movements in deferred tax balances 9.9 5.8
Total income tax expense on profit 46.2 24.2
Current tax payable attributable to
Entities in the tax consolidated group – –
Other entities 20.8 6.8
Total current tax payable 20.8 6.8
Deferred income tax assets and liabilities comprise
Temporary differences recorded as asset 165.0 165.4
Temporary differences recorded as liability (18.7) (25.2)
Net temporary differences – asset 146.3 140.2
Tax losses – revenue recorded as asset 96.9 107.4
Net deferred income tax assets 243.2 247.6
Current income tax assets 12.3 30.2
a For the year ended 31 March 2014, this amount mainly related to the finalisation of research and development credits from prior years.b Includes the impact of permanent differences related to significant items.
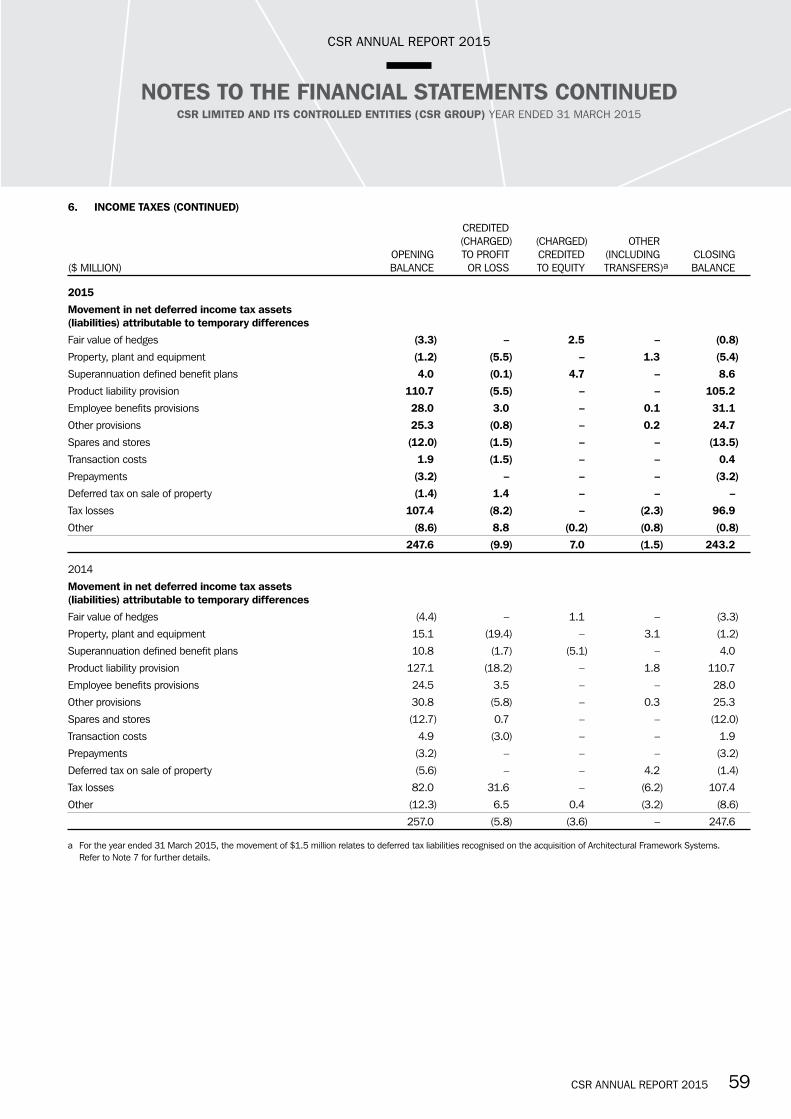
CSR ANNUAL REPORT 2015 5958 CSR ANNUAL REPORT 2015
CSR ANNUAL REPORT 2015
NOTES TO THE FINANCIAL STATEMENTS CONTINUEDCSR LIMITED AND ITS CONTROLLED ENTITIES (CSR GROUP) YEAR ENDED 31 MARCH 2015
6. INCOME TAXES (CONTINUED)
CREDITED (CHARGED) (CHARGED) OTHER OPENING TO PROFIT CREDITED (INCLUDING CLOSING ($ MILLION) BALANCE OR LOSS TO EQUITY TRANSFERS )a BALANCE
2015
Movement in net deferred income tax assets (liabilities) attributable to temporary differences
Fair value of hedges (3.3) – 2.5 – (0.8)
Property, plant and equipment (1.2) (5.5) – 1.3 (5.4)
Superannuation defined benefit plans 4.0 (0.1) 4.7 – 8.6
Product liability provision 110.7 (5.5) – – 105.2
Employee benefits provisions 28.0 3.0 – 0.1 31.1
Other provisions 25.3 (0.8) – 0.2 24.7
Spares and stores (12.0) (1.5) – – (13.5)
Transaction costs 1.9 (1.5) – – 0.4
Prepayments (3.2) – – – (3.2)
Deferred tax on sale of property (1.4) 1.4 – – –
Tax losses 107.4 (8.2) – (2.3) 96.9
Other (8.6) 8.8 (0.2) (0.8) (0.8)
247.6 (9.9) 7.0 (1.5) 243.2
2014
Movement in net deferred income tax assets (liabilities) attributable to temporary differences
Fair value of hedges (4.4) – 1.1 – (3.3)
Property, plant and equipment 15.1 (19.4) – 3.1 (1.2)
Superannuation defined benefit plans 10.8 (1.7) (5.1) – 4.0
Product liability provision 127.1 (18.2) – 1.8 110.7
Employee benefits provisions 24.5 3.5 – – 28.0
Other provisions 30.8 (5.8) – 0.3 25.3
Spares and stores (12.7) 0.7 – – (12.0)
Transaction costs 4.9 (3.0) – – 1.9
Prepayments (3.2) – – – (3.2)
Deferred tax on sale of property (5.6) – – 4.2 (1.4)
Tax losses 82.0 31.6 – (6.2) 107.4
Other (12.3) 6.5 0.4 (3.2) (8.6)
257.0 (5.8) (3.6) – 247.6
a For the year ended 31 March 2015, the movement of $1.5 million relates to deferred tax liabilities recognised on the acquisition of Architectural Framework Systems. Refer to Note 7 for further details.

CSR ANNUAL REPORT 2015 6160 CSR ANNUAL REPORT 2015
CSR ANNUAL REPORT 2015
NOTES TO THE FINANCIAL STATEMENTS CONTINUEDCSR LIMITED AND ITS CONTROLLED ENTITIES (CSR GROUP) YEAR ENDED 31 MARCH 2015
7. ACQUISITIONS OF CONTROLLED ENTITIES AND BUSINESSESAcquisition of Architectural Framework SystemsThe CSR group acquired 100% of Architectural Framework Systems (AFS) on 2 April 2014 (Building Products segment). AFS is a leader in permanent formwork walling solutions for the construction industry. The primary reason for the acquisition was to continue CSR’s growth in the Building Products segment.
The accounting for this acquisition has been finalised at 31 March 2015. Acquisition related costs expensed were $1.8 million. Details of the purchase consideration and the fair value of assets and liabilities acquired are given below.
($ MILLION) NOTE 2015
Purchase consideration:
Cash consideration (i) 36.7
Contingent consideration (ii) 12.4
Total consideration 49.1
Fair value of net assets acquired
FAIR VALUE ($ MILLION) 2015
Receivables 5.2
Inventories 2.3
Property, plant and equipment 8.3
Intangible assets 7.0
Payables (6.8)
Provisions (0.7)
Deferred tax liabilities (1.5)
Net identifiable assets acquired 13.8
Add: goodwill acquired 35.3
Total consideration 49.1
The goodwill is attributable to the workforce, profitability and growth potential of the acquired business. It will not be deductible for tax purposes.
(i) Purchase consideration – cash outflow
($ MILLION) 2015
Outflow of cash to acquire subsidiaries, net of cash acquired
Cash consideration 36.7
Less: cash acquired –
Outflow of cash – investing activities 36.7
(ii) Contingent earn-outIn the event that certain pre-determined earning measures are achieved by the subsidiary for the year ended 31 March 2015 and 31 March 2017, additional consideration may be payable in cash 60 days after each of the reporting periods. There is no limit to the maximum amount payable. Contingent consideration of $12.4 million was estimated by calculating the present value of the future expected cash flows.
Other acquisitions During the year ended 31 March 2015, two trade centres were acquired by the Building Products segment, with total consideration paid of $1.4 million and goodwill of $0.6 million arising in relation to the acquisitions.

CSR ANNUAL REPORT 2015 6160 CSR ANNUAL REPORT 2015
CSR ANNUAL REPORT 2015
NOTES TO THE FINANCIAL STATEMENTS CONTINUEDCSR LIMITED AND ITS CONTROLLED ENTITIES (CSR GROUP) YEAR ENDED 31 MARCH 2015
7. ACQUISITIONS OF CONTROLLED ENTITIES AND BUSINESSES (CONTINUED)Businesses acquired for the year ended 31 March 2014The CSR group acquired the net assets of the following businesses during the year ended 31 March 2014:
• 70% of the equity of Martini Investments (Australia) Pty Limited (“Martini Business”), a polyester manufacturer and importer of high performance reflective insulation, effective 1 November 2013 (Building Products segment);
• Alsupply Aluminium Partitions on 1 May 2013 (Building Products segment); and• Accent Powdercoaters on 1 May 2013 (Building Products segment).The primary reason for these acquisitions was to continue CSR’s growth in the Building Products segment.
The initial accounting for the acquisitions for the year ended 31 March 2014 has now been fully determined resulting in the following adjustments to the acquisition accounting:
($ MILLION)
Goodwill calculated on initial accounting in 2014 5.2
Adjustments to net identifiable assets acquired recorded in 2015 0.5
Adjusted goodwill for business acquisitions 5.7
Details of the purchase consideration and the fair value of assets and liabilities acquired are given below.
($ MILLION) 2014
Purchase consideration:
Cash paid 11.3
Add: non-controlling interests 2.4
Less: fair value of net identifiable assets acquired (refer to below) (8.0)
Goodwill acquired 5.7
Fair value of net assets acquired
FAIR VALUE ($ MILLION) 2014
Cash 0.8
Receivables 3.0
Inventories 2.7
Property, plant and equipment 2.7
Other assets 0.6
Intangible assets 0.2
Deferred income tax assets 0.1
Payables (0.8)
Provisions (0.5)
Other creditors (0.8)
Net identifiable assets acquired 8.0
Less: non-controlling interests (2.4)
Add: goodwill acquired 5.7
Total consideration 11.3
The goodwill is attributable to the workforce, profitability and growth potential of the acquired businesses. It will not be deductible for tax purposes.
(i) ConsiderationTotal consideration is comprised of payments of $10.9 million. An additional $0.4 million is expected to be payable in future periods and is contingent on achievement of performance targets.
(ii) Contingent earn-out – Martini businessIn the event that certain pre-determined earnings targets are achieved by the subsidiary from acquisition date until 30 June 2015, additional payment may be payable in cash at the time of finalisation of the financial statements for that financial year. The earn-out is linked to continued employment and has therefore been classified as compensation. The potential amount payable under the agreement is dependent on the performance of the business.

CSR ANNUAL REPORT 2015 6362 CSR ANNUAL REPORT 2015
CSR ANNUAL REPORT 2015
NOTES TO THE FINANCIAL STATEMENTS CONTINUEDCSR LIMITED AND ITS CONTROLLED ENTITIES (CSR GROUP) YEAR ENDED 31 MARCH 2015
7. ACQUISITIONS OF CONTROLLED ENTITIES AND BUSINESSES (CONTINUED)(iii) Non-controlling interests – Martini businessThe CSR group elected to recognise the non-controlling interests in Martini Investments (Australia) Pty Limited at its proportionate share of the acquired net identifiable assets.
(iv) Put and call options over non-controlling interests – Martini businessThe CSR group has a call option over the remaining 30% non-controlling interest. The option has three exercise periods, the first one commencing on 31 March 2016 (for three months). The non-controlling shareholders have a put option to sell all of their remaining interest to the group at a discount to the call option price with two exercise windows that match the first and last call option periods. The exercise price of the options is based on the financial results of the business.
(v) Purchase consideration – cash outflow
($ MILLION) 2014
Outflow of cash to acquire subsidiaries, net of cash acquired
Cash consideration paid 10.9
Less: cash acquired (0.8)
Outflow of cash – investing activities 10.1
8. CONTROLLED ENTITIES AND BUSINESSES DISPOSED(i) Establishment of joint venture – Bricks New Zealand (disposal of a business)On 15 April 2013, a joint venture between CSR Limited’s subsidiary, CSR Building Products (NZ) Limited and Brickworks Building Products (NZ) Pty Limited was established. This transaction involved the disposal of certain operating assets totalling $3.6 million of the Bricks New Zealand business from CSR Building Products (NZ) Limited into the joint venture vehicle “NZ Brick Distributors Limited Partnership.” A gain of $1.0 million was recorded on the transaction.
(ii) Cash flows from disposal of a businessConsideration for the disposal was 50% of the shares of NZ Brick Distributors GP Limited entitling the CSR group to a 50% share of the profits of the NZ Brick Distributors Limited Partnership.
Costs associated with the establishment of the joint venture were $0.1 million and were expensed in the financial year ended 31 March 2014.
9. CASH AND CASH EQUIVALENTS
($ MILLION) 2015 2014
Cash at bank and on hand 11.0 5.9
Short term loans and deposits 57.4 –
Total cash 68.4 5.9
10. INVENTORIES
($ MILLION) 2015 2014
Current
Raw and process materials and stores 83.0 84.2
Work in progress 13.6 13.0
Finished goods 183.9 175.7
Land held for sale and development costs 39.5 53.5
Total current inventories 320.0 326.4
Non-current
Raw and process materials and stores – 1.2
Land held for sale and development costs 76.2 64.9
Total non-current inventories 76.2 66.1
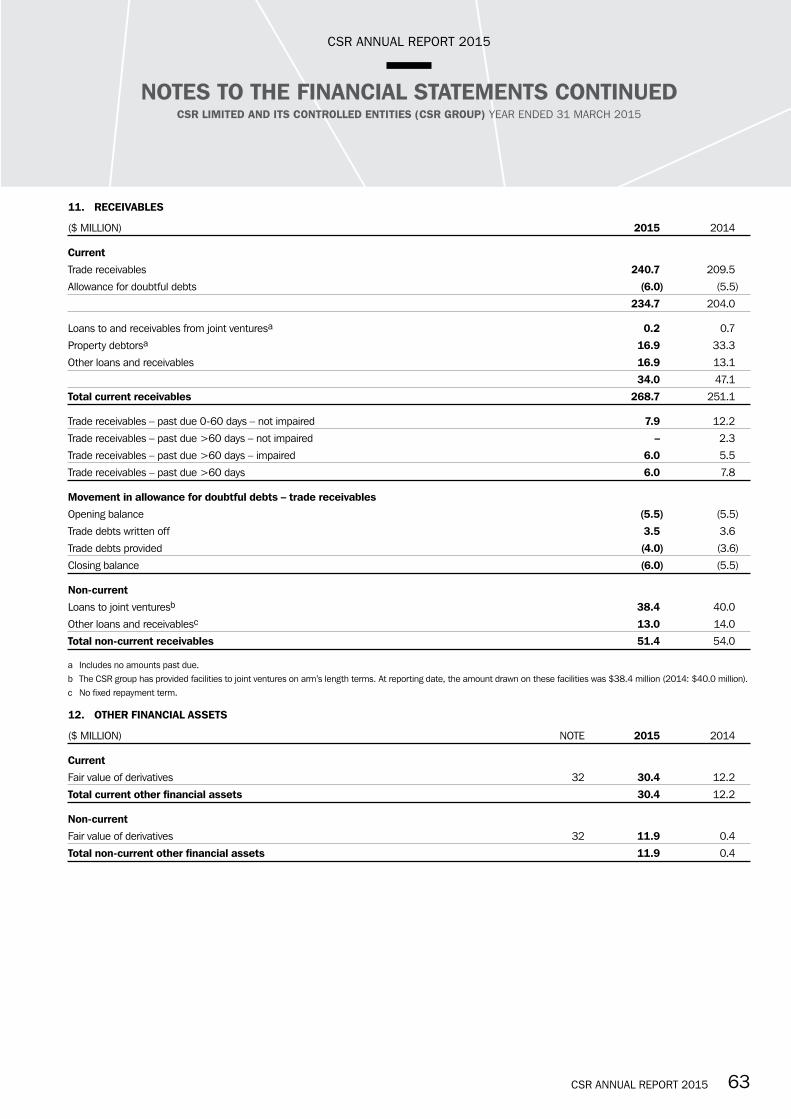
CSR ANNUAL REPORT 2015 6362 CSR ANNUAL REPORT 2015
CSR ANNUAL REPORT 2015
NOTES TO THE FINANCIAL STATEMENTS CONTINUEDCSR LIMITED AND ITS CONTROLLED ENTITIES (CSR GROUP) YEAR ENDED 31 MARCH 2015
11. RECEIVABLES
($ MILLION) 2015 2014
Current
Trade receivables 240.7 209.5
Allowance for doubtful debts (6.0) (5.5)
234.7 204.0
Loans to and receivables from joint venturesa 0.2 0.7
Property debtorsa 16.9 33.3
Other loans and receivables 16.9 13.1
34.0 47.1
Total current receivables 268.7 251.1
Trade receivables – past due 0-60 days – not impaired 7.9 12.2
Trade receivables – past due >60 days – not impaired – 2.3
Trade receivables – past due >60 days – impaired 6.0 5.5
Trade receivables – past due >60 days 6.0 7.8
Movement in allowance for doubtful debts – trade receivables
Opening balance (5.5) (5.5)
Trade debts written off 3.5 3.6
Trade debts provided (4.0) (3.6)
Closing balance (6.0) (5.5)
Non-current
Loans to joint venturesb 38.4 40.0
Other loans and receivablesc 13.0 14.0
Total non-current receivables 51.4 54.0
a Includes no amounts past due.b The CSR group has provided facilities to joint ventures on arm’s length terms. At reporting date, the amount drawn on these facilities was $38.4 million (2014: $40.0 million).c No fixed repayment term.
12. OTHER FINANCIAL ASSETS
($ MILLION) NOTE 2015 2014
Current
Fair value of derivatives 32 30.4 12.2
Total current other financial assets 30.4 12.2
Non-current
Fair value of derivatives 32 11.9 0.4
Total non-current other financial assets 11.9 0.4
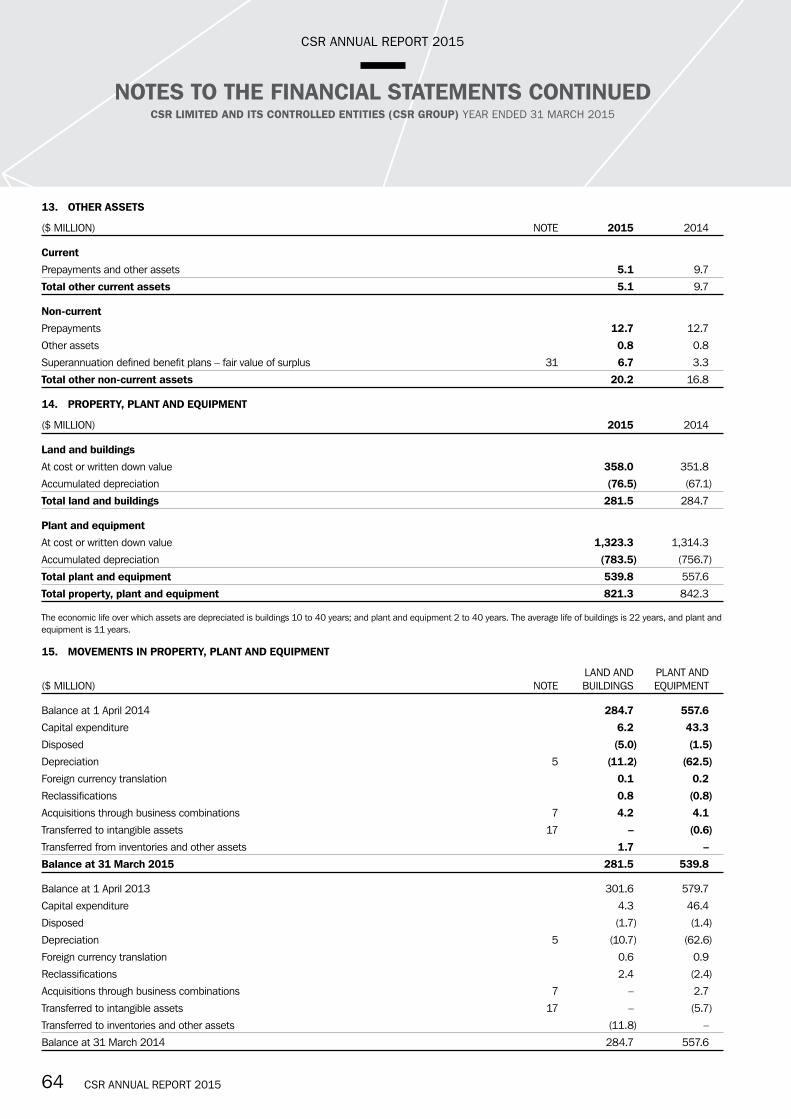
CSR ANNUAL REPORT 2015 6564 CSR ANNUAL REPORT 2015
CSR ANNUAL REPORT 2015
NOTES TO THE FINANCIAL STATEMENTS CONTINUEDCSR LIMITED AND ITS CONTROLLED ENTITIES (CSR GROUP) YEAR ENDED 31 MARCH 2015
13. OTHER ASSETS
($ MILLION) NOTE 2015 2014
Current
Prepayments and other assets 5.1 9.7
Total other current assets 5.1 9.7
Non-current
Prepayments 12.7 12.7
Other assets 0.8 0.8
Superannuation defined benefit plans – fair value of surplus 31 6.7 3.3
Total other non-current assets 20.2 16.8
14. PROPERTY, PLANT AND EQUIPMENT
($ MILLION) 2015 2014
Land and buildings
At cost or written down value 358.0 351.8
Accumulated depreciation (76.5) (67.1)
Total land and buildings 281.5 284.7
Plant and equipment
At cost or written down value 1,323.3 1,314.3
Accumulated depreciation (783.5) (756.7)
Total plant and equipment 539.8 557.6
Total property, plant and equipment 821.3 842.3
The economic life over which assets are depreciated is buildings 10 to 40 years; and plant and equipment 2 to 40 years. The average life of buildings is 22 years, and plant and equipment is 11 years.
15. MOVEMENTS IN PROPERTY, PLANT AND EQUIPMENT
LAND AND PLANT AND ($ MILLION) NOTE BUILDINGS EQUIPMENT
Balance at 1 April 2014 284.7 557.6
Capital expenditure 6.2 43.3
Disposed (5.0) (1.5)
Depreciation 5 (11.2) (62.5)
Foreign currency translation 0.1 0.2
Reclassifications 0.8 (0.8)
Acquisitions through business combinations 7 4.2 4.1
Transferred to intangible assets 17 – (0.6)
Transferred from inventories and other assets 1.7 –
Balance at 31 March 2015 281.5 539.8
Balance at 1 April 2013 301.6 579.7
Capital expenditure 4.3 46.4
Disposed (1.7) (1.4)
Depreciation 5 (10.7) (62.6)
Foreign currency translation 0.6 0.9
Reclassifications 2.4 (2.4)
Acquisitions through business combinations 7 – 2.7
Transferred to intangible assets 17 – (5.7)
Transferred to inventories and other assets (11.8) –
Balance at 31 March 2014 284.7 557.6
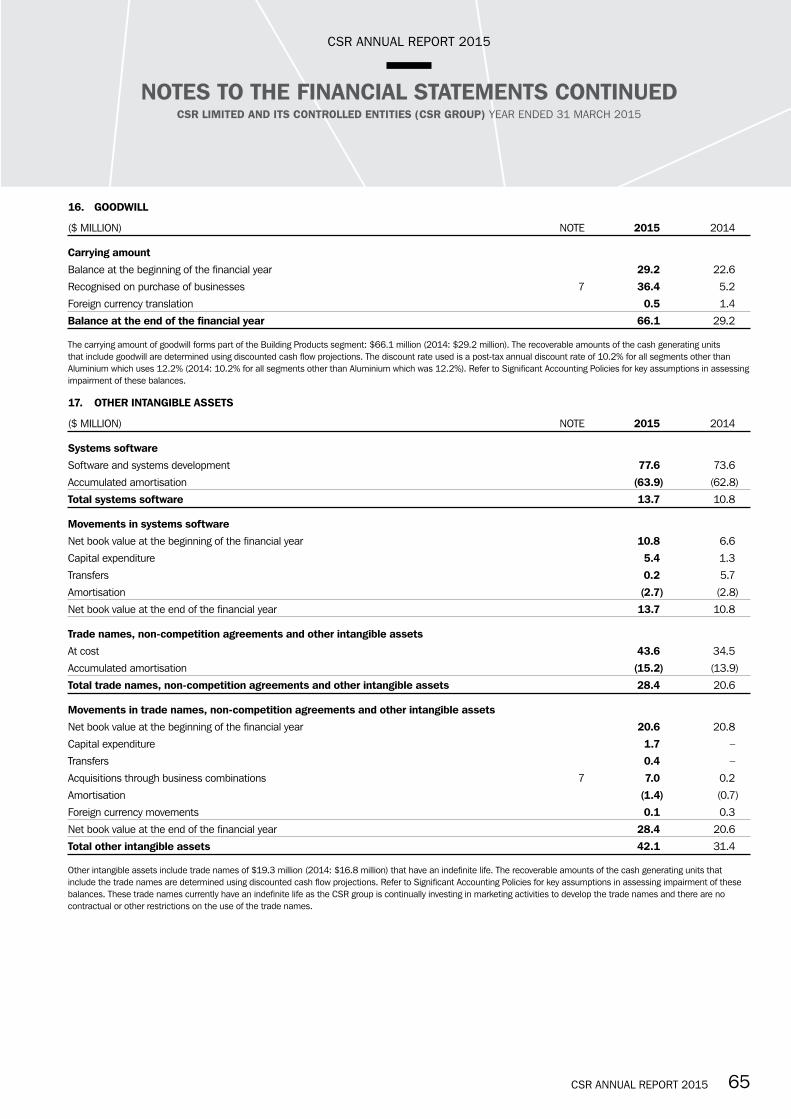
CSR ANNUAL REPORT 2015 6564 CSR ANNUAL REPORT 2015
CSR ANNUAL REPORT 2015
NOTES TO THE FINANCIAL STATEMENTS CONTINUEDCSR LIMITED AND ITS CONTROLLED ENTITIES (CSR GROUP) YEAR ENDED 31 MARCH 2015
16. GOODWILL
($ MILLION) NOTE 2015 2014
Carrying amount
Balance at the beginning of the financial year 29.2 22.6
Recognised on purchase of businesses 7 36.4 5.2
Foreign currency translation 0.5 1.4
Balance at the end of the financial year 66.1 29.2
The carrying amount of goodwill forms part of the Building Products segment: $66.1 million (2014: $29.2 million). The recoverable amounts of the cash generating units that include goodwill are determined using discounted cash flow projections. The discount rate used is a post-tax annual discount rate of 10.2% for all segments other than Aluminium which uses 12.2% (2014: 10.2% for all segments other than Aluminium which was 12.2%). Refer to Significant Accounting Policies for key assumptions in assessing impairment of these balances.
17. OTHER INTANGIBLE ASSETS
($ MILLION) NOTE 2015 2014
Systems software
Software and systems development 77.6 73.6
Accumulated amortisation (63.9) (62.8)
Total systems software 13.7 10.8
Movements in systems software
Net book value at the beginning of the financial year 10.8 6.6
Capital expenditure 5.4 1.3
Transfers 0.2 5.7
Amortisation (2.7) (2.8)
Net book value at the end of the financial year 13.7 10.8
Trade names, non-competition agreements and other intangible assets
At cost 43.6 34.5
Accumulated amortisation (15.2) (13.9)
Total trade names, non-competition agreements and other intangible assets 28.4 20.6
Movements in trade names, non-competition agreements and other intangible assets
Net book value at the beginning of the financial year 20.6 20.8
Capital expenditure 1.7 –
Transfers 0.4 –
Acquisitions through business combinations 7 7.0 0.2
Amortisation (1.4) (0.7)
Foreign currency movements 0.1 0.3
Net book value at the end of the financial year 28.4 20.6
Total other intangible assets 42.1 31.4
Other intangible assets include trade names of $19.3 million (2014: $16.8 million) that have an indefinite life. The recoverable amounts of the cash generating units that include the trade names are determined using discounted cash flow projections. Refer to Significant Accounting Policies for key assumptions in assessing impairment of these balances. These trade names currently have an indefinite life as the CSR group is continually investing in marketing activities to develop the trade names and there are no contractual or other restrictions on the use of the trade names.
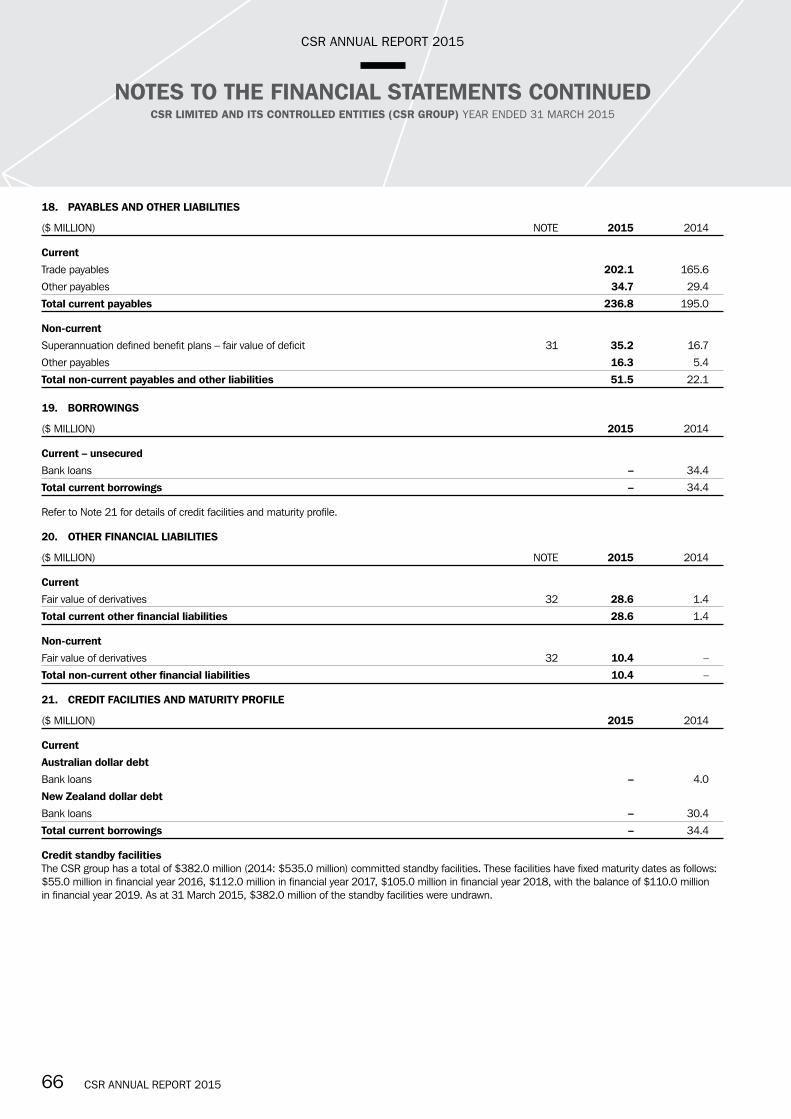
CSR ANNUAL REPORT 2015 6766 CSR ANNUAL REPORT 2015
CSR ANNUAL REPORT 2015
NOTES TO THE FINANCIAL STATEMENTS CONTINUEDCSR LIMITED AND ITS CONTROLLED ENTITIES (CSR GROUP) YEAR ENDED 31 MARCH 2015
18. PAYABLES AND OTHER LIABILITIES
($ MILLION) NOTE 2015 2014
Current
Trade payables 202.1 165.6
Other payables 34.7 29.4
Total current payables 236.8 195.0
Non-current
Superannuation defined benefit plans – fair value of deficit 31 35.2 16.7
Other payables 16.3 5.4
Total non-current payables and other liabilities 51.5 22.1
19. BORROWINGS
($ MILLION) 2015 2014
Current – unsecured
Bank loans – 34.4
Total current borrowings – 34.4
Refer to Note 21 for details of credit facilities and maturity profile.
20. OTHER FINANCIAL LIABILITIES
($ MILLION) NOTE 2015 2014
Current
Fair value of derivatives 32 28.6 1.4
Total current other financial liabilities 28.6 1.4
Non-current
Fair value of derivatives 32 10.4 –
Total non-current other financial liabilities 10.4 –
21. CREDIT FACILITIES AND MATURITY PROFILE
($ MILLION) 2015 2014
Current
Australian dollar debt
Bank loans – 4.0
New Zealand dollar debt
Bank loans – 30.4
Total current borrowings – 34.4
Credit standby facilities The CSR group has a total of $382.0 million (2014: $535.0 million) committed standby facilities. These facilities have fixed maturity dates as follows: $55.0 million in financial year 2016, $112.0 million in financial year 2017, $105.0 million in financial year 2018, with the balance of $110.0 million in financial year 2019. As at 31 March 2015, $382.0 million of the standby facilities were undrawn.
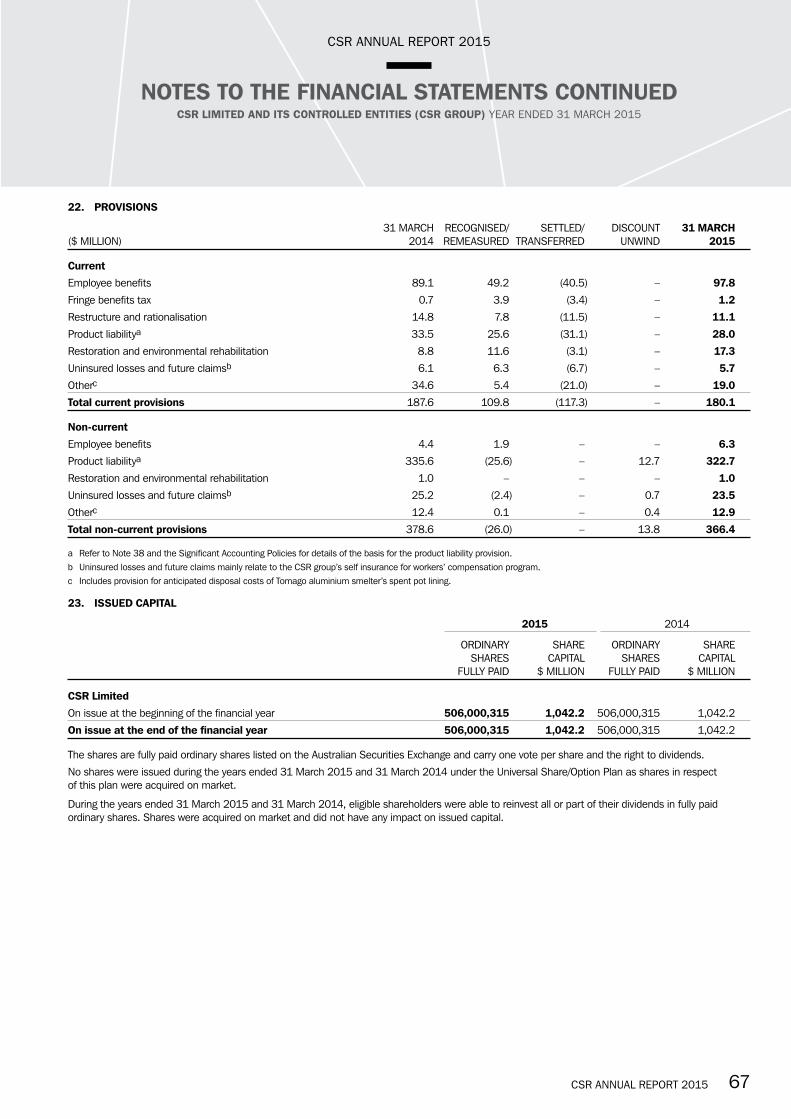
CSR ANNUAL REPORT 2015 6766 CSR ANNUAL REPORT 2015
CSR ANNUAL REPORT 2015
NOTES TO THE FINANCIAL STATEMENTS CONTINUEDCSR LIMITED AND ITS CONTROLLED ENTITIES (CSR GROUP) YEAR ENDED 31 MARCH 2015
22. PROVISIONS
31 MARCH RECOGNISED/ SETTLED/ DISCOUNT 31 MARCH ($ MILLION) 2014 REMEASURED TRANSFERRED UNWIND 2015
Current
Employee benefits 89.1 49.2 (40.5) – 97.8
Fringe benefits tax 0.7 3.9 (3.4) – 1.2
Restructure and rationalisation 14.8 7.8 (11.5) – 11.1
Product liabilitya 33.5 25.6 (31.1) – 28.0
Restoration and environmental rehabilitation 8.8 11.6 (3.1) – 17.3
Uninsured losses and future claimsb 6.1 6.3 (6.7) – 5.7
Otherc 34.6 5.4 (21.0) – 19.0
Total current provisions 187.6 109.8 (117.3) – 180.1
Non-current
Employee benefits 4.4 1.9 – – 6.3
Product liabilitya 335.6 (25.6) – 12.7 322.7
Restoration and environmental rehabilitation 1.0 – – – 1.0
Uninsured losses and future claimsb 25.2 (2.4) – 0.7 23.5
Otherc 12.4 0.1 – 0.4 12.9
Total non-current provisions 378.6 (26.0) – 13.8 366.4
a Refer to Note 38 and the Significant Accounting Policies for details of the basis for the product liability provision.b Uninsured losses and future claims mainly relate to the CSR group’s self insurance for workers’ compensation program.c Includes provision for anticipated disposal costs of Tomago aluminium smelter’s spent pot lining.
23. ISSUED CAPITAL
2015 2014
ORDINARY SHARE ORDINARY SHARE SHARES CAPITAL SHARES CAPITAL FULLY PAID $ MILLION FULLY PAID $ MILLION
CSR Limited
On issue at the beginning of the financial year 506,000,315 1,042.2 506,000,315 1,042.2
On issue at the end of the financial year 506,000,315 1,042.2 506,000,315 1,042.2
The shares are fully paid ordinary shares listed on the Australian Securities Exchange and carry one vote per share and the right to dividends.
No shares were issued during the years ended 31 March 2015 and 31 March 2014 under the Universal Share/Option Plan as shares in respect of this plan were acquired on market.
During the years ended 31 March 2015 and 31 March 2014, eligible shareholders were able to reinvest all or part of their dividends in fully paid ordinary shares. Shares were acquired on market and did not have any impact on issued capital.

CSR ANNUAL REPORT 2015 6968 CSR ANNUAL REPORT 2015
CSR ANNUAL REPORT 2015
NOTES TO THE FINANCIAL STATEMENTS CONTINUEDCSR LIMITED AND ITS CONTROLLED ENTITIES (CSR GROUP) YEAR ENDED 31 MARCH 2015
24. RESERVES
($ MILLION) 2015 2014
Hedge reserve
Value at the beginning of the financial year 6.0 7.7
Hedge profit recognised in equity 2.0 6.6
Hedge profit transferred to the statement of financial performance (7.5) (9.0)
Share of gain on changes in fair value of cash flow hedges of joint ventures 0.3 –
Income tax benefit 1.7 0.7
Value at the end of the financial year 2.5 6.0
Foreign currency translation reserve
Value at the beginning of the financial year (4.4) (6.8)
Translation of foreign operations 1.2 2.4
Value at the end of the financial year (3.2) (4.4)
Employee share reserve
Value at the beginning of the financial year 21.6 19.4
Share based payments expense net of tax 2.9 2.2
Value at the end of the financial year 24.5 21.6
Other reserves
Value at the beginning of the financial year (3.3) –
Acquisition of treasury shares held by Employee Share Trust (3.4) –
Put option held by non-controlling interests – (3.3)
Value at the end of the financial year (6.7) (3.3)
Total reserves 17.1 19.9
Hedge reserveThe hedge reserve is used to record gains or losses on a hedging instrument in a cash flow hedge that are recognised in other comprehensive income. Amounts are reclassified to profit or loss when the associated hedged transaction affects profit or loss.
Foreign currency translation reserveExchange differences arising on translation of foreign controlled entities are recognised in other comprehensive income and accumulated in a separate reserve within equity.
The cumulative amount is reclassified to profit or loss when the net investment is disposed of.
Employee share reserveThe employee share reserve is used to recognise:
• the share-based payments expenses; and• the income tax related to share based payments required to be recognised through other comprehensive income.
Other reservesOther reserves are used to recognise:
• Put option: the written put option the minority shareholders of the Martini business have to sell all of their remaining interest to the CSR group at an agreed price (based on the financial results of the business); and
• Share based payments trust reserve: where CSR Limited Share Plan Trust (‘Trust’) purchases the company’s equity instruments, the consideration paid is recorded in the share based payments trust reserve until the shares are cancelled or reissued. During the year ended 31 March 2015, 997,470 shares were acquired by the Trust at an average share price of $3.70.
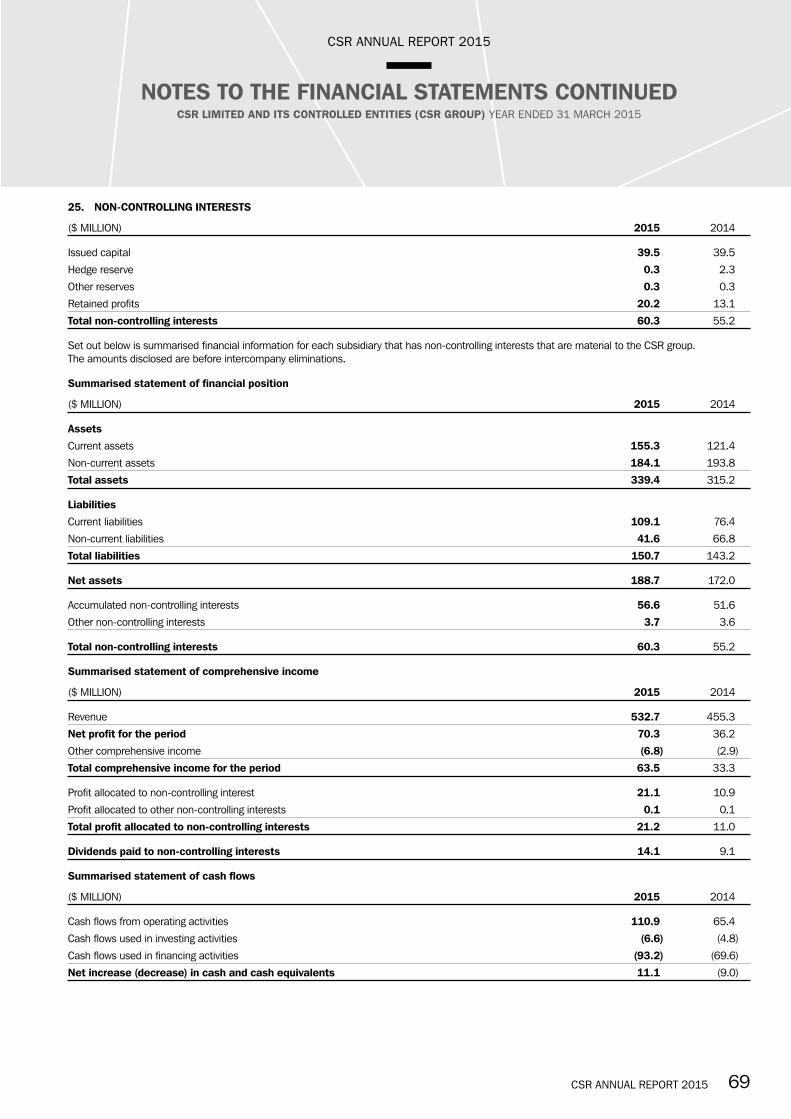
CSR ANNUAL REPORT 2015 6968 CSR ANNUAL REPORT 2015
CSR ANNUAL REPORT 2015
NOTES TO THE FINANCIAL STATEMENTS CONTINUEDCSR LIMITED AND ITS CONTROLLED ENTITIES (CSR GROUP) YEAR ENDED 31 MARCH 2015
25. NON-CONTROLLING INTERESTS
($ MILLION) 2015 2014
Issued capital 39.5 39.5
Hedge reserve 0.3 2.3
Other reserves 0.3 0.3
Retained profits 20.2 13.1
Total non-controlling interests 60.3 55.2
Set out below is summarised financial information for each subsidiary that has non-controlling interests that are material to the CSR group. The amounts disclosed are before intercompany eliminations.
Summarised statement of financial position
($ MILLION) 2015 2014
Assets
Current assets 155.3 121.4
Non-current assets 184.1 193.8
Total assets 339.4 315.2
Liabilities
Current liabilities 109.1 76.4
Non-current liabilities 41.6 66.8
Total liabilities 150.7 143.2
Net assets 188.7 172.0
Accumulated non-controlling interests 56.6 51.6
Other non-controlling interests 3.7 3.6
Total non-controlling interests 60.3 55.2
Summarised statement of comprehensive income
($ MILLION) 2015 2014
Revenue 532.7 455.3
Net profit for the period 70.3 36.2
Other comprehensive income (6.8) (2.9)
Total comprehensive income for the period 63.5 33.3
Profit allocated to non-controlling interest 21.1 10.9
Profit allocated to other non-controlling interests 0.1 0.1
Total profit allocated to non-controlling interests 21.2 11.0
Dividends paid to non-controlling interests 14.1 9.1
Summarised statement of cash flows
($ MILLION) 2015 2014
Cash flows from operating activities 110.9 65.4
Cash flows used in investing activities (6.6) (4.8)
Cash flows used in financing activities (93.2) (69.6)
Net increase (decrease) in cash and cash equivalents 11.1 (9.0)
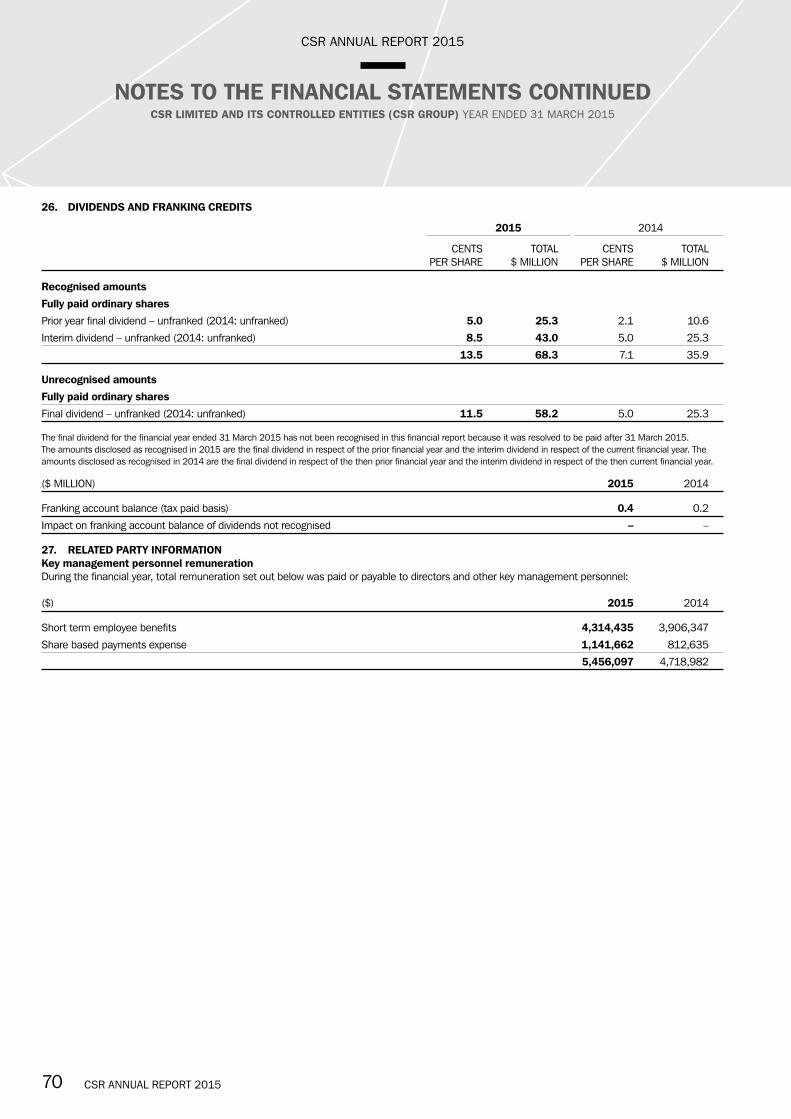
CSR ANNUAL REPORT 2015 7170 CSR ANNUAL REPORT 2015
CSR ANNUAL REPORT 2015
NOTES TO THE FINANCIAL STATEMENTS CONTINUEDCSR LIMITED AND ITS CONTROLLED ENTITIES (CSR GROUP) YEAR ENDED 31 MARCH 2015
26. DIVIDENDS AND FRANKING CREDITS
2015 2014
CENTS TOTAL CENTS TOTAL PER SHARE $ MILLION PER SHARE $ MILLION
Recognised amounts
Fully paid ordinary shares
Prior year final dividend – unfranked (2014: unfranked) 5.0 25.3 2.1 10.6
Interim dividend – unfranked (2014: unfranked) 8.5 43.0 5.0 25.3
13.5 68.3 7.1 35.9
Unrecognised amounts
Fully paid ordinary shares
Final dividend – unfranked (2014: unfranked) 11.5 58.2 5.0 25.3
The final dividend for the financial year ended 31 March 2015 has not been recognised in this financial report because it was resolved to be paid after 31 March 2015. The amounts disclosed as recognised in 2015 are the final dividend in respect of the prior financial year and the interim dividend in respect of the current financial year. The amounts disclosed as recognised in 2014 are the final dividend in respect of the then prior financial year and the interim dividend in respect of the then current financial year.
($ MILLION) 2015 2014
Franking account balance (tax paid basis) 0.4 0.2
Impact on franking account balance of dividends not recognised – –
27. RELATED PARTY INFORMATION Key management personnel remunerationDuring the financial year, total remuneration set out below was paid or payable to directors and other key management personnel:
($) 2015 2014
Short term employee benefits 4,314,435 3,906,347
Share based payments expense 1,141,662 812,635
5,456,097 4,718,982
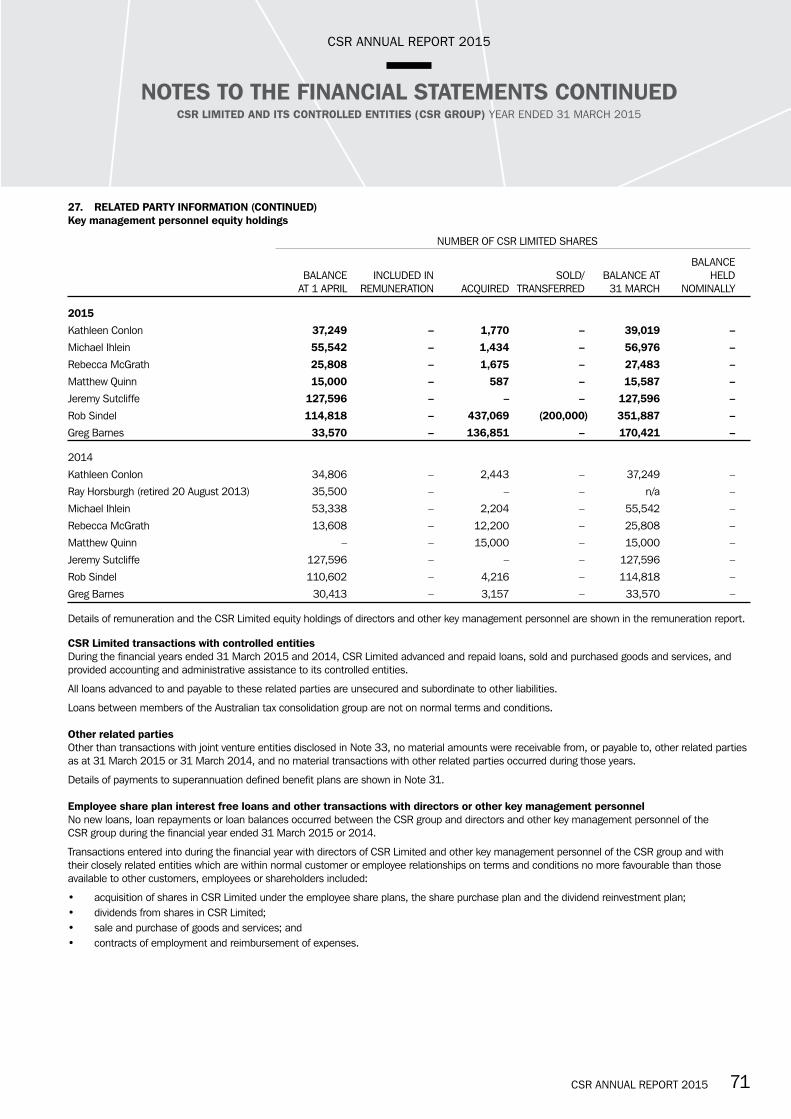
CSR ANNUAL REPORT 2015 7170 CSR ANNUAL REPORT 2015
CSR ANNUAL REPORT 2015
NOTES TO THE FINANCIAL STATEMENTS CONTINUEDCSR LIMITED AND ITS CONTROLLED ENTITIES (CSR GROUP) YEAR ENDED 31 MARCH 2015
27. RELATED PARTY INFORMATION (CONTINUED)Key management personnel equity holdings
NUMBER OF CSR LIMITED SHARES
BALANCE BALANCE INCLUDED IN SOLD/ BALANCE AT HELD AT 1 APRIL REMUNERATION ACQUIRED TRANSFERRED 31 MARCH NOMINALLY
2015
Kathleen Conlon 37,249 – 1,770 – 39,019 –
Michael Ihlein 55,542 – 1,434 – 56,976 –
Rebecca McGrath 25,808 – 1,675 – 27,483 –
Matthew Quinn 15,000 – 587 – 15,587 –
Jeremy Sutcliffe 127,596 – – – 127,596 –
Rob Sindel 114,818 – 437,069 (200,000) 351,887 –
Greg Barnes 33,570 – 136,851 – 170,421 –
2014
Kathleen Conlon 34,806 – 2,443 – 37,249 –
Ray Horsburgh (retired 20 August 2013) 35,500 – – – n/a –
Michael Ihlein 53,338 – 2,204 – 55,542 –
Rebecca McGrath 13,608 – 12,200 – 25,808 –
Matthew Quinn – – 15,000 – 15,000 –
Jeremy Sutcliffe 127,596 – – – 127,596 –
Rob Sindel 110,602 – 4,216 – 114,818 –
Greg Barnes 30,413 – 3,157 – 33,570 –
Details of remuneration and the CSR Limited equity holdings of directors and other key management personnel are shown in the remuneration report.
CSR Limited transactions with controlled entitiesDuring the financial years ended 31 March 2015 and 2014, CSR Limited advanced and repaid loans, sold and purchased goods and services, and provided accounting and administrative assistance to its controlled entities.
All loans advanced to and payable to these related parties are unsecured and subordinate to other liabilities.
Loans between members of the Australian tax consolidation group are not on normal terms and conditions.
Other related partiesOther than transactions with joint venture entities disclosed in Note 33, no material amounts were receivable from, or payable to, other related parties as at 31 March 2015 or 31 March 2014, and no material transactions with other related parties occurred during those years.
Details of payments to superannuation defined benefit plans are shown in Note 31.
Employee share plan interest free loans and other transactions with directors or other key management personnelNo new loans, loan repayments or loan balances occurred between the CSR group and directors and other key management personnel of the CSR group during the financial year ended 31 March 2015 or 2014.
Transactions entered into during the financial year with directors of CSR Limited and other key management personnel of the CSR group and with their closely related entities which are within normal customer or employee relationships on terms and conditions no more favourable than those available to other customers, employees or shareholders included:
• acquisition of shares in CSR Limited under the employee share plans, the share purchase plan and the dividend reinvestment plan;• dividends from shares in CSR Limited;• sale and purchase of goods and services; and• contracts of employment and reimbursement of expenses.
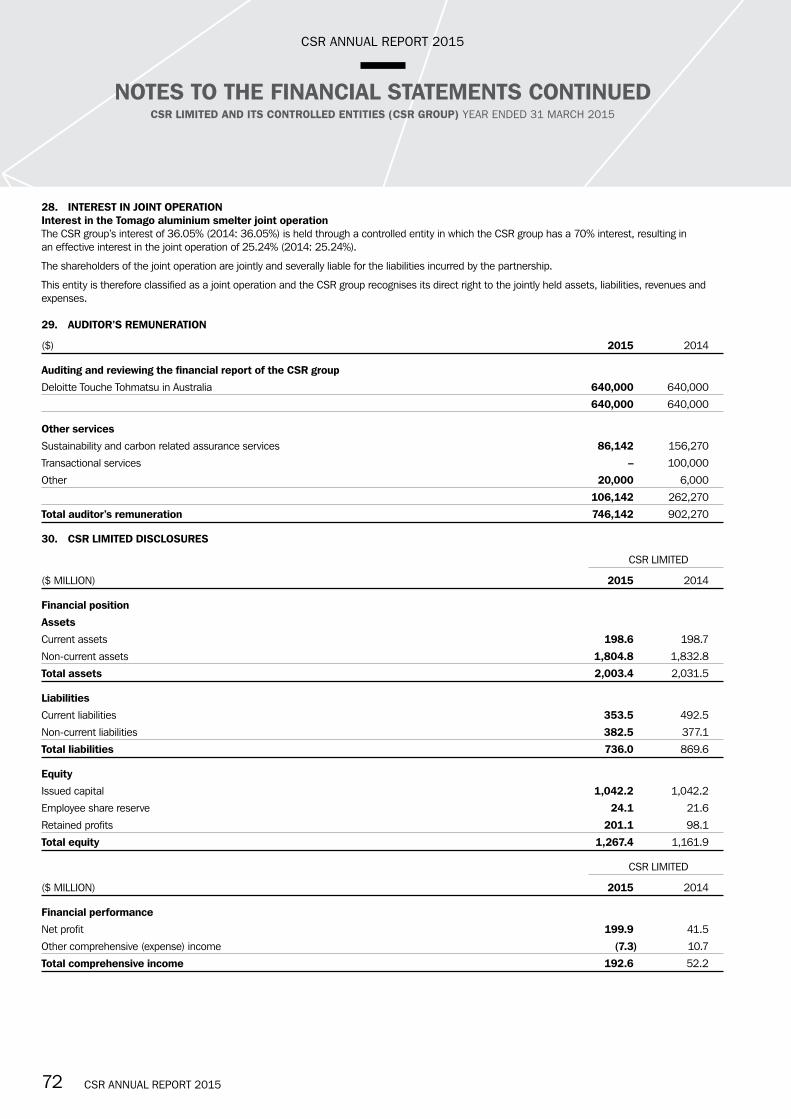
CSR ANNUAL REPORT 2015 7372 CSR ANNUAL REPORT 2015
CSR ANNUAL REPORT 2015
NOTES TO THE FINANCIAL STATEMENTS CONTINUEDCSR LIMITED AND ITS CONTROLLED ENTITIES (CSR GROUP) YEAR ENDED 31 MARCH 2015
28. INTEREST IN JOINT OPERATIONInterest in the Tomago aluminium smelter joint operationThe CSR group’s interest of 36.05% (2014: 36.05%) is held through a controlled entity in which the CSR group has a 70% interest, resulting in an effective interest in the joint operation of 25.24% (2014: 25.24%).
The shareholders of the joint operation are jointly and severally liable for the liabilities incurred by the partnership.
This entity is therefore classified as a joint operation and the CSR group recognises its direct right to the jointly held assets, liabilities, revenues and expenses.
29. AUDITOR’S REMUNERATION
($) 2015 2014
Auditing and reviewing the financial report of the CSR group
Deloitte Touche Tohmatsu in Australia 640,000 640,000
640,000 640,000
Other services
Sustainability and carbon related assurance services 86,142 156,270
Transactional services – 100,000
Other 20,000 6,000
106,142 262,270
Total auditor’s remuneration 746,142 902,270
30. CSR LIMITED DISCLOSURES
CSR LIMITED
($ MILLION) 2015 2014
Financial position
Assets
Current assets 198.6 198.7
Non-current assets 1,804.8 1,832.8
Total assets 2,003.4 2,031.5
Liabilities
Current liabilities 353.5 492.5
Non-current liabilities 382.5 377.1
Total liabilities 736.0 869.6
Equity
Issued capital 1,042.2 1,042.2
Employee share reserve 24.1 21.6
Retained profits 201.1 98.1
Total equity 1,267.4 1,161.9
CSR LIMITED
($ MILLION) 2015 2014
Financial performance
Net profit 199.9 41.5
Other comprehensive (expense) income (7.3) 10.7
Total comprehensive income 192.6 52.2

CSR ANNUAL REPORT 2015 7372 CSR ANNUAL REPORT 2015
CSR ANNUAL REPORT 2015
NOTES TO THE FINANCIAL STATEMENTS CONTINUEDCSR LIMITED AND ITS CONTROLLED ENTITIES (CSR GROUP) YEAR ENDED 31 MARCH 2015
30. CSR LIMITED DISCLOSURES (CONTINUED)Contingent liabilities
CSR LIMITED
($ MILLION) 2015 2014
Contingent liabilities, capable of estimation, arise in respect of the following categories
Performance guarantees provided to third parties 61.2 65.8
Bank guarantees to Harwood Superannuation Funda 1.4 25.7
Total contingent liabilitiesb 62.6 91.5
a There is an obligation for CSR Limited to contribute such amounts so as to ensure that the assets attributable to certain superannuation defined benefit plans are not less than 120% of the amount required to meet the actuarial liabilities. Refer to Note 31 for details of superannuation commitments as at 31 March 2015.
b CSR Limited has not directly provided any financial guarantees to third parties outside of the CSR group. All financial guarantees disclosed above are related to bank guarantees provided to third parties to guarantee CSR Limited’s performance of its liabilities. In addition, CSR Limited has undertaken to provide financial support, as and when required, to certain wholly owned controlled entities so as to enable those entities to pay their debts as and when such debts become due and payable.
Workers’ compensationCSR Limited is a licensed self insurer in New South Wales, Queensland, Victoria, Western Australia and the Australian Capital Territory for workers’ compensation insurance. Adequate provision has been made for all known claims and reasonably foreseeable future claims with a provision of $29.2 million as at 31 March 2015 (2014: $31.3 million).
Product liabilityCSR Limited is liable for all product liability exposure in the CSR group shown in Note 38.
Commitments for the acquisition of property, plant and equipmentCSR Limited has committed $nil to the acquisition of any property, plant and equipment as at 31 March 2015 (2014: $nil).
31. SUPERANNUATION COMMITMENTS During the year, the CSR group participated in a number of superannuation funds (funds) in Australia and New Zealand. The funds provide benefits either on a cash accumulation or defined benefit basis, for employees (and spouses) on retirement, resignation or disablement, or to their dependants on death. Employer contributions are legally enforceable, with the right to terminate, reduce or suspend those contributions upon giving written notice to the trustees. CSR Limited and its Australian controlled entities are required to provide a minimum level of superannuation support for employees under the Australian superannuation guarantee legislation.
Australian superannuation fundsIn Australia, the CSR group participates in the Harwood Superannuation Fund and the Pilkington (Australia) Superannuation Scheme for those employees and pensioners who are currently members of these funds and any new employees who become members.
Retirement fundsThe contributions to the funds for the year ended 31 March 2015 for the CSR group were $33.3 million (2014: $41.2 million).
Accumulation fundsThe benefits provided by accumulation funds are based on the contributions and income thereon held by the funds on behalf of the members. Contributions are made as agreed between the member and the company. These contributions are expensed in the period they are incurred.
Defined benefit fundsThe benefits provided by defined benefit divisions of funds (DBDs) are based on length of service or membership and salary of the member at or near retirement. Member contributions, based on a percentage of salary, are specified by the rules of the fund. Employer contributions generally vary based on actuarial advice and may be reduced or cease when a fund is in actuarial surplus. The accounting treatment of the superannuation defined benefit plans is discussed in Significant Accounting Policies. All DBDs are closed to new members.
Changes to defined benefit obligationsThe CSR Viridian (New Zealand) Limited Superannuation Scheme was wound up during the year ended 31 March 2013. All beneficiary obligations were settled as at 31 March 2013.
The Harwood Superannuation Fund Trust Deed was amended with effect from midnight on 31 December 2011 to restructure the various plans within the fund, including splitting the CSR Plan Division One (defined benefit) into three separate plans. The amendment reflected the agreement between CSR Limited and Wilmar International Limited that Sucrogen Limited would assume full responsibility to fund its obligations for defined benefit members employed by the Sucrogen business as well as its share of the funding obligation in respect of the Harwood Pensioner DBD Plan. As such, amounts recorded for the CSR group exclude funding obligations and share of assets and liabilities which have been assumed by Wilmar Sugar Australia Limited.

CSR ANNUAL REPORT 2015 7574 CSR ANNUAL REPORT 2015
CSR ANNUAL REPORT 2015
NOTES TO THE FINANCIAL STATEMENTS CONTINUEDCSR LIMITED AND ITS CONTROLLED ENTITIES (CSR GROUP) YEAR ENDED 31 MARCH 2015
31. SUPERANNUATION COMMITMENTS (CONTINUED)Asset backingThe assets of the funds at 31 March 2015 were insufficient to satisfy all benefits which would have been vested in the event of termination of the funds, or in the event of the voluntary or compulsory termination of the employment of each employee. The funds have obligations in excess of the fair value of assets as at 31 March 2015. The CSR group’s obligation in respect of the shortfall in asset value is $28.5 million (2014: $13.4 million). The CSR group is making contributions to the funds as follows:
Harwood Superannuation Fund – DBD CSR $nil per month from 1 April 2015.
– DBD Harwood Pensioner $nil per month from 1 April 2015.
– DBD Monier PGH For accumulation members, 11.2% from 1 July 2014.
Pilkington (Australia) Superannuation Scheme – DBD 14.6% of eligible salary.
The last actuarial assessment for Harwood Superannuation Fund and Pilkington (Australia) Superannuation Scheme was completed as at 30 June 2014. The funding requirements were reviewed as at 30 June 2014. A combination of the attained age normal and projected unit credit funding methods were used to determine the contribution rates for the Harwood Superannuation Fund. The projected unit credit funding method was used for the Pilkington (Australia) Superannuation Scheme.
Defined benefit funds sponsored by the CSR group
PRESENT PRESENT NET DEFINED VALUE OF VALUE OF BENEFIT CONTRIBUTIONS ($ MILLION) FUND ASSETS FUND LIABILITY OBLIGATION PAID
Harwood Superannuation Fund – DBD CSR and DBD Harwood Pensionerab 78.3 (105.8) (27.5) 1.0
– DBD Monier PGHc 51.4 (44.7) 6.7 1.5
Pilkington (Australia) Superannuation Scheme – DBDc 52.8 (60.5) (7.7) 1.8
a Actuarial liabilities are determined to be past service liabilities based on membership accrued up to 31 March 2015. These amounts were calculated at 31 March 2015 based on the assumptions used in the last actuarial review performed on 30 June 2014 by K Knapman FIAA.
b There is an obligation for plan employers to contribute such amounts so as to ensure that the assets are not less than 120% of the amount required to meet the actuarial liabilities of Division One of the Harwood Superannuation Fund which includes DBD CSR and DBD Harwood Pensioner. At the time of the last actuarial review, DBD CSR had a funding position of 145% and DBD Harwood Pensioner had a funding position of 118%. Therefore, CSR Limited made available to the trustee of the fund bank guarantees to satisfy the balance of its commitment to 120%. As at 31 March 2015, CSR Limited has provided bank guarantees of $1.4 million to the Trustee of the fund (2014: $25.7 million). The bank guarantees have been disclosed in Note 30 and Note 37.
c These amounts were calculated at 31 March 2015 based on assumptions used in the last actuarial review performed on 30 June 2014.
($ MILLION) 2015 2014
Amounts recognised in the statement of financial performance (selling, administration and other operating costs) in respect of the defined benefit plans
Current service cost 3.5 4.0
Finance cost 7.0 6.4
Interest income (6.5) (5.4)
Total expense included in the statement of financial performance 4.0 5.0
Actuarial (loss) gain incurred during the financial year and recognised in the statement of comprehensive income (15.4) 17.1
Cumulative actuarial losses recognised in the statement of comprehensive income (94.4) (79.0)
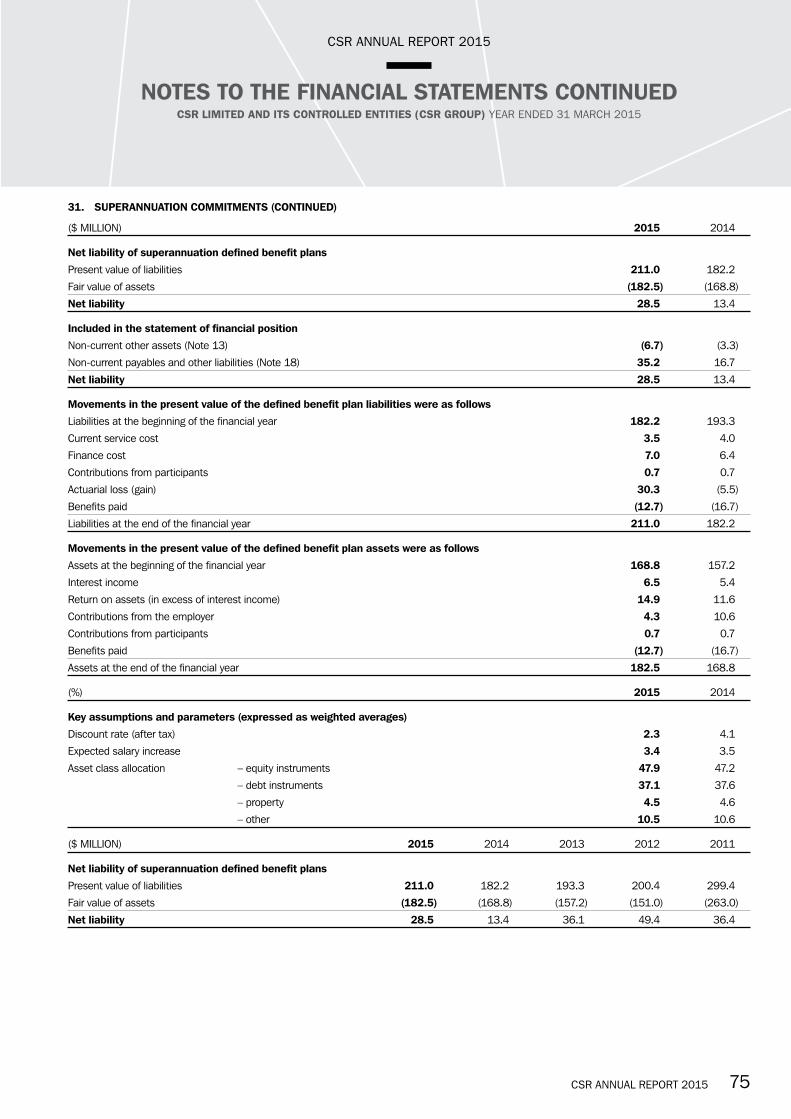
CSR ANNUAL REPORT 2015 7574 CSR ANNUAL REPORT 2015
CSR ANNUAL REPORT 2015
NOTES TO THE FINANCIAL STATEMENTS CONTINUEDCSR LIMITED AND ITS CONTROLLED ENTITIES (CSR GROUP) YEAR ENDED 31 MARCH 2015
31. SUPERANNUATION COMMITMENTS (CONTINUED)
($ MILLION) 2015 2014
Net liability of superannuation defined benefit plans
Present value of liabilities 211.0 182.2
Fair value of assets (182.5) (168.8)
Net liability 28.5 13.4
Included in the statement of financial position
Non-current other assets (Note 13) (6.7) (3.3)
Non-current payables and other liabilities (Note 18) 35.2 16.7
Net liability 28.5 13.4
Movements in the present value of the defined benefit plan liabilities were as follows
Liabilities at the beginning of the financial year 182.2 193.3
Current service cost 3.5 4.0
Finance cost 7.0 6.4
Contributions from participants 0.7 0.7
Actuarial loss (gain) 30.3 (5.5)
Benefits paid (12.7) (16.7)
Liabilities at the end of the financial year 211.0 182.2
Movements in the present value of the defined benefit plan assets were as follows
Assets at the beginning of the financial year 168.8 157.2
Interest income 6.5 5.4
Return on assets (in excess of interest income) 14.9 11.6
Contributions from the employer 4.3 10.6
Contributions from participants 0.7 0.7
Benefits paid (12.7) (16.7)
Assets at the end of the financial year 182.5 168.8
(%) 2015 2014
Key assumptions and parameters (expressed as weighted averages)
Discount rate (after tax) 2.3 4.1
Expected salary increase 3.4 3.5
Asset class allocation – equity instruments 47.9 47.2
– debt instruments 37.1 37.6
– property 4.5 4.6
– other 10.5 10.6
($ MILLION) 2015 2014 2013 2012 2011
Net liability of superannuation defined benefit plans
Present value of liabilities 211.0 182.2 193.3 200.4 299.4
Fair value of assets (182.5) (168.8) (157.2) (151.0) (263.0)
Net liability 28.5 13.4 36.1 49.4 36.4

CSR ANNUAL REPORT 2015 7776 CSR ANNUAL REPORT 2015
CSR ANNUAL REPORT 2015
NOTES TO THE FINANCIAL STATEMENTS CONTINUEDCSR LIMITED AND ITS CONTROLLED ENTITIES (CSR GROUP) YEAR ENDED 31 MARCH 2015
32. FINANCIAL RISK MANAGEMENT The CSR group’s activities expose it to a variety of financial risks: credit risk, liquidity risk and market risk (including commodity price risk, foreign exchange risk and interest rate risk). This note presents information about the CSR group’s exposure to each of the above risks, the CSR group’s objectives, policies and processes for measuring and managing risk, and the CSR group’s management of capital. There have been no changes in the CSR group’s exposure to risks, objectives, policies and processes applied in managing the risks, or methods used to measure these financial risks during the years ended 31 March 2015 and 31 March 2014.
Risk management frameworkThe CSR group uses a variety of derivative instruments to manage financial and commodity price risks. The CSR group does not use derivative or financial instruments for speculative or trading purposes. The use of financial derivatives is governed by the Risk Management Policy framework which has been approved by the board of directors. The Risk Management Policy framework sets out specific principles in relation to the use of financial instruments in hedging exposures to foreign exchange risk, interest rate risk, credit risk, in addition to the use of derivatives and the investment of excess liquidity. Risk management policies and systems are reviewed regularly to reflect changes in market conditions and the CSR group’s activities. Compliance with the Risk Management Policy framework and procedures is reviewed by the Finance Committee on a routine basis. The Finance Committee membership consists of the managing director and other relevant senior executives.
Capital managementThe CSR group manages its capital to ensure that entities in the CSR group will be able to continue as a going concern while maximising the return to shareholders through the optimisation of the debt and equity balances.
The capital structure of the CSR group consists of debt which includes the borrowings disclosed in Note 19 (2015: $nil, 2014: $34.4 million), cash and cash equivalents disclosed in Note 9, issued capital and reserves disclosed in Notes 23 and 24 and retained profits. The CSR group reviews the capital structure regularly and balances its overall capital structure through the payment of dividends, new share issues, share consolidations and share buy-backs, as well as the issue of new debt or the redemption of existing debt.
Fair valuesThe fair values of financial assets and liabilities are determined as follows:
• the fair values of financial assets and liabilities with standard terms and conditions and traded on active liquid markets are determined with reference to quoted market prices;
• the fair values of other financial assets and financial liabilities (excluding derivatives) are determined in accordance with generally accepted pricing models based on discounted cash flow analysis using prices from observable current market transactions and dealer quotes for similar instruments; and
• the fair values of derivative instruments are calculated using quoted market prices. Where such prices are not available, a discounted cash flow analysis is performed using the applicable yield curve for the duration of the instruments for non-optional derivatives, and option pricing models for optional derivatives. Foreign currency forward contracts are measured using quoted exchange rates and yield curves derived from quoted interest rates matching maturities of the contract. Interest rate swaps are measured at the present value of future cash flows estimated and discounted based on the applicable yield curves derived from quoted interest rates.
The assumptions and methods used to estimate fair value for the following financial assets and financial liabilities were:
• Foreign currency contracts, foreign exchange options, currency swaps and commodity swaps: The fair value is estimated using market quoted spot and forward exchange rates and commodity prices and applicable yield curves following market accepted formulae and practices;
• Cash, short term loans and deposits, receivables, payables and short term borrowings: The carrying amounts of these financial instruments approximate fair value because of their short maturity;
• Long term borrowings: The present value of expected cash flows has been used to determine fair value using interest rates derived from market parameters that accurately reflect their term structure. Certain estimates and judgements were required to develop the fair value amounts; and
• Interest rate swaps: The present value of expected cash flows has been used to determine fair value using yield curves derived from market parameters that accurately reflect their term structure. Certain estimates and judgements were required to develop the fair value amounts.
The fair value amounts shown below are not necessarily indicative of the amounts that the CSR group would realise upon disposition, nor do they indicate the CSR group’s intent or ability to dispose of the financial instrument.
Credit riskCredit risk is the risk of financial loss to the CSR group if a customer or counterparty to a financial instrument fails to meet its contractual obligations, and arises principally from the CSR group’s receivables from customers and investments in debt securities.
The carrying amount of financial assets represents the maximum credit exposure.
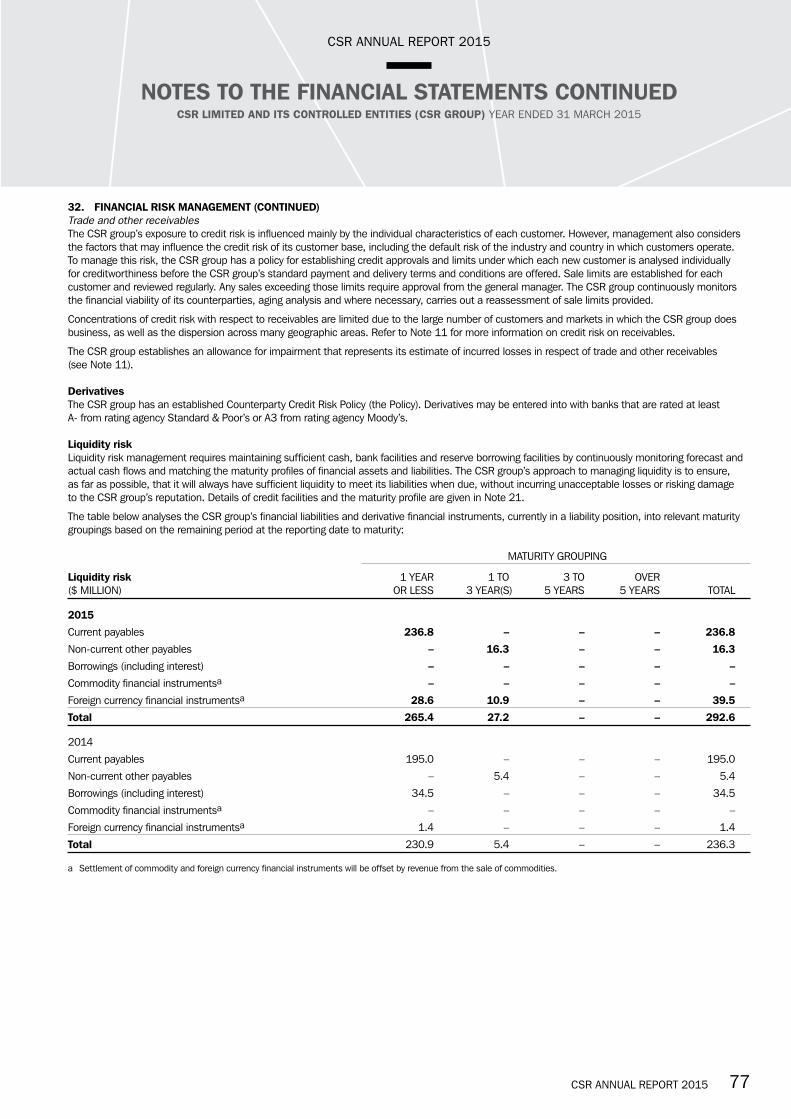
CSR ANNUAL REPORT 2015 7776 CSR ANNUAL REPORT 2015
CSR ANNUAL REPORT 2015
NOTES TO THE FINANCIAL STATEMENTS CONTINUEDCSR LIMITED AND ITS CONTROLLED ENTITIES (CSR GROUP) YEAR ENDED 31 MARCH 2015
32. FINANCIAL RISK MANAGEMENT (CONTINUED)Trade and other receivablesThe CSR group’s exposure to credit risk is influenced mainly by the individual characteristics of each customer. However, management also considers the factors that may influence the credit risk of its customer base, including the default risk of the industry and country in which customers operate. To manage this risk, the CSR group has a policy for establishing credit approvals and limits under which each new customer is analysed individually for creditworthiness before the CSR group’s standard payment and delivery terms and conditions are offered. Sale limits are established for each customer and reviewed regularly. Any sales exceeding those limits require approval from the general manager. The CSR group continuously monitors the financial viability of its counterparties, aging analysis and where necessary, carries out a reassessment of sale limits provided.
Concentrations of credit risk with respect to receivables are limited due to the large number of customers and markets in which the CSR group does business, as well as the dispersion across many geographic areas. Refer to Note 11 for more information on credit risk on receivables.
The CSR group establishes an allowance for impairment that represents its estimate of incurred losses in respect of trade and other receivables (see Note 11).
DerivativesThe CSR group has an established Counterparty Credit Risk Policy (the Policy). Derivatives may be entered into with banks that are rated at least A- from rating agency Standard & Poor’s or A3 from rating agency Moody’s.
Liquidity riskLiquidity risk management requires maintaining sufficient cash, bank facilities and reserve borrowing facilities by continuously monitoring forecast and actual cash flows and matching the maturity profiles of financial assets and liabilities. The CSR group’s approach to managing liquidity is to ensure, as far as possible, that it will always have sufficient liquidity to meet its liabilities when due, without incurring unacceptable losses or risking damage to the CSR group’s reputation. Details of credit facilities and the maturity profile are given in Note 21.
The table below analyses the CSR group’s financial liabilities and derivative financial instruments, currently in a liability position, into relevant maturity groupings based on the remaining period at the reporting date to maturity:
MATURITY GROUPING
Liquidity risk 1 YEAR 1 TO 3 TO OVER ($ MILLION) OR LESS 3 YEAR(S) 5 YEARS 5 YEARS TOTAL
2015
Current payables 236.8 – – – 236.8
Non-current other payables – 16.3 – – 16.3
Borrowings (including interest) – – – – –
Commodity financial instrumentsa – – – – –
Foreign currency financial instrumentsa 28.6 10.9 – – 39.5
Total 265.4 27.2 – – 292.6
2014
Current payables 195.0 – – – 195.0
Non-current other payables – 5.4 – – 5.4
Borrowings (including interest) 34.5 – – – 34.5
Commodity financial instrumentsa – – – – –
Foreign currency financial instrumentsa 1.4 – – – 1.4
Total 230.9 5.4 – – 236.3
a Settlement of commodity and foreign currency financial instruments will be offset by revenue from the sale of commodities.
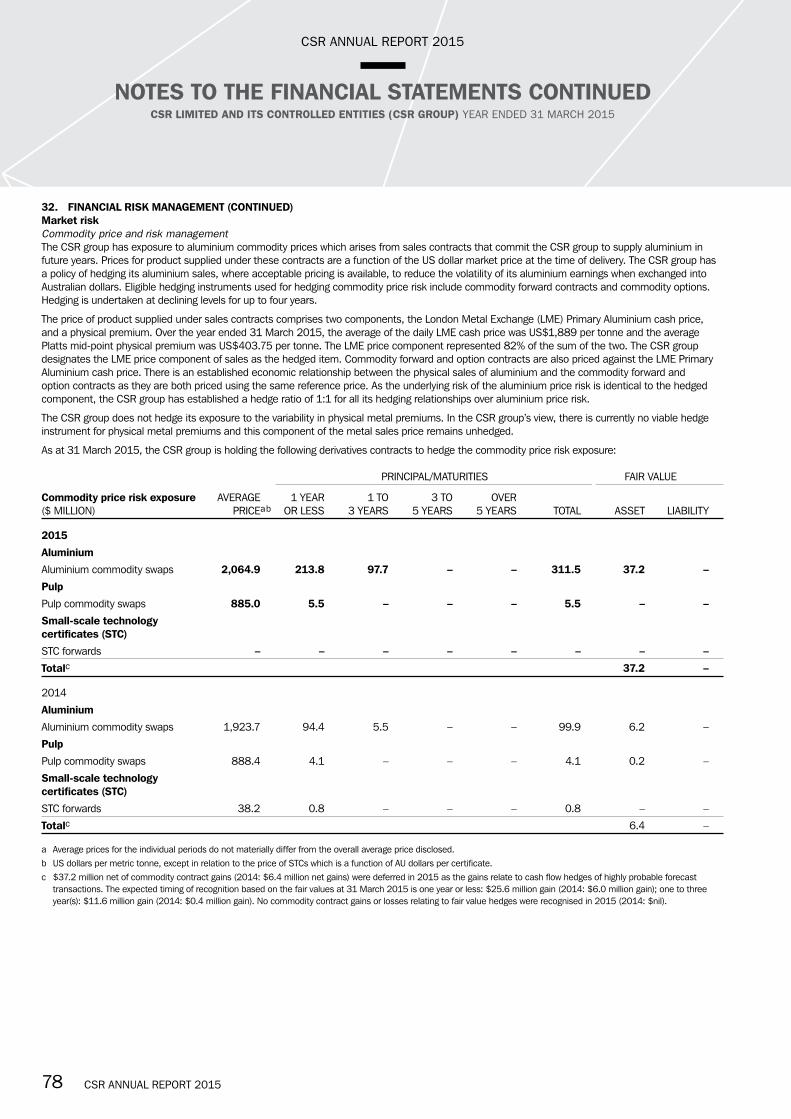
CSR ANNUAL REPORT 2015 7978 CSR ANNUAL REPORT 2015
CSR ANNUAL REPORT 2015
NOTES TO THE FINANCIAL STATEMENTS CONTINUEDCSR LIMITED AND ITS CONTROLLED ENTITIES (CSR GROUP) YEAR ENDED 31 MARCH 2015
32. FINANCIAL RISK MANAGEMENT (CONTINUED)Market riskCommodity price and risk managementThe CSR group has exposure to aluminium commodity prices which arises from sales contracts that commit the CSR group to supply aluminium in future years. Prices for product supplied under these contracts are a function of the US dollar market price at the time of delivery. The CSR group has a policy of hedging its aluminium sales, where acceptable pricing is available, to reduce the volatility of its aluminium earnings when exchanged into Australian dollars. Eligible hedging instruments used for hedging commodity price risk include commodity forward contracts and commodity options. Hedging is undertaken at declining levels for up to four years.
The price of product supplied under sales contracts comprises two components, the London Metal Exchange (LME) Primary Aluminium cash price, and a physical premium. Over the year ended 31 March 2015, the average of the daily LME cash price was US$1,889 per tonne and the average Platts mid-point physical premium was US$403.75 per tonne. The LME price component represented 82% of the sum of the two. The CSR group designates the LME price component of sales as the hedged item. Commodity forward and option contracts are also priced against the LME Primary Aluminium cash price. There is an established economic relationship between the physical sales of aluminium and the commodity forward and option contracts as they are both priced using the same reference price. As the underlying risk of the aluminium price risk is identical to the hedged component, the CSR group has established a hedge ratio of 1:1 for all its hedging relationships over aluminium price risk.
The CSR group does not hedge its exposure to the variability in physical metal premiums. In the CSR group’s view, there is currently no viable hedge instrument for physical metal premiums and this component of the metal sales price remains unhedged.
As at 31 March 2015, the CSR group is holding the following derivatives contracts to hedge the commodity price risk exposure:
PRINCIPAL/MATURITIES FAIR VALUE
Commodity price risk exposure AVERAGE 1 YEAR 1 TO 3 TO OVER ($ MILLION) PRICE a b OR LESS 3 YEARS 5 YEARS 5 YEARS TOTAL ASSET LIABILITY
2015
Aluminium
Aluminium commodity swaps 2,064.9 213.8 97.7 – – 311.5 37.2 –
Pulp
Pulp commodity swaps 885.0 5.5 – – – 5.5 – –
Small-scale technology certificates (STC)
STC forwards – – – – – – – –
Totalc 37.2 –
2014
Aluminium
Aluminium commodity swaps 1,923.7 94.4 5.5 – – 99.9 6.2 –
Pulp
Pulp commodity swaps 888.4 4.1 – – – 4.1 0.2 –
Small-scale technology certificates (STC)
STC forwards 38.2 0.8 – – – 0.8 – –
Totalc 6.4 –
a Average prices for the individual periods do not materially differ from the overall average price disclosed.b US dollars per metric tonne, except in relation to the price of STCs which is a function of AU dollars per certificate.c $37.2 million net of commodity contract gains (2014: $6.4 million net gains) were deferred in 2015 as the gains relate to cash flow hedges of highly probable forecast
transactions. The expected timing of recognition based on the fair values at 31 March 2015 is one year or less: $25.6 million gain (2014: $6.0 million gain); one to three year(s): $11.6 million gain (2014: $0.4 million gain). No commodity contract gains or losses relating to fair value hedges were recognised in 2015 (2014: $nil).
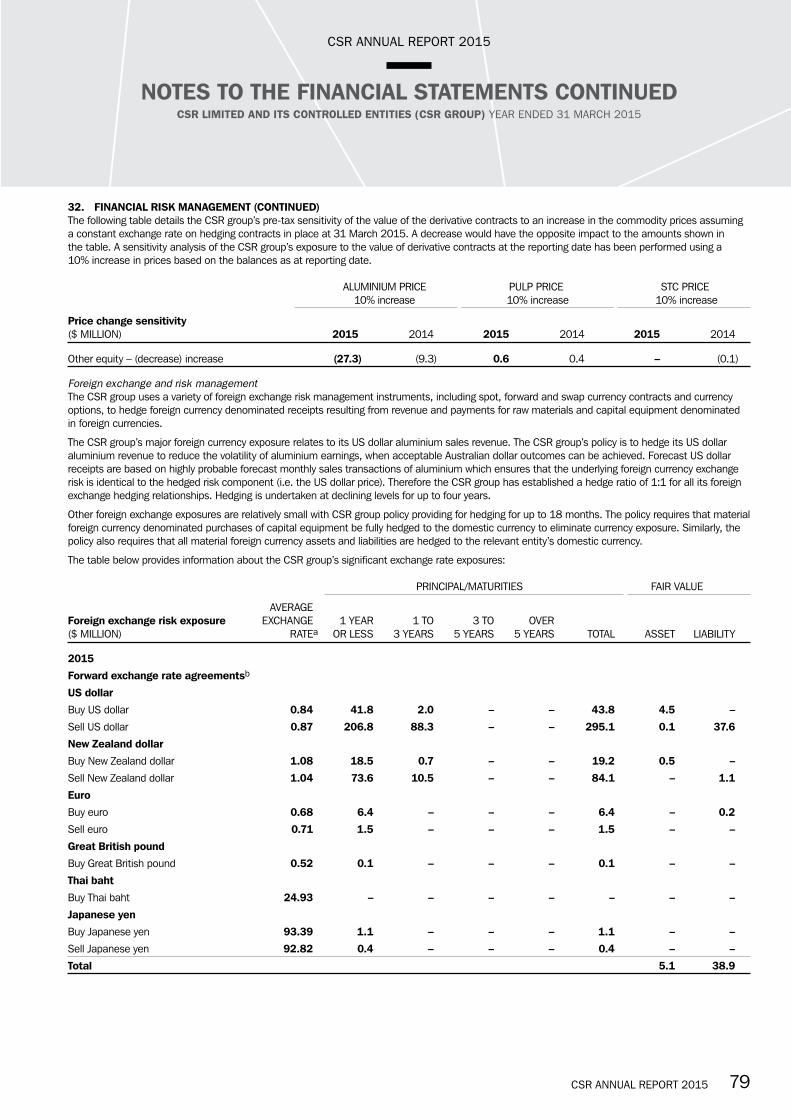
CSR ANNUAL REPORT 2015 7978 CSR ANNUAL REPORT 2015
CSR ANNUAL REPORT 2015
NOTES TO THE FINANCIAL STATEMENTS CONTINUEDCSR LIMITED AND ITS CONTROLLED ENTITIES (CSR GROUP) YEAR ENDED 31 MARCH 2015
32. FINANCIAL RISK MANAGEMENT (CONTINUED)The following table details the CSR group’s pre-tax sensitivity of the value of the derivative contracts to an increase in the commodity prices assuming a constant exchange rate on hedging contracts in place at 31 March 2015. A decrease would have the opposite impact to the amounts shown in the table. A sensitivity analysis of the CSR group’s exposure to the value of derivative contracts at the reporting date has been performed using a 10% increase in prices based on the balances as at reporting date.
ALUMINIUM PRICE PULP PRICE STC PRICE 10% increase 10% increase 10% increase
Price change sensitivity ($ MILLION) 2015 2014 2015 2014 2015 2014
Other equity – (decrease) increase (27.3) (9.3) 0.6 0.4 – (0.1)
Foreign exchange and risk managementThe CSR group uses a variety of foreign exchange risk management instruments, including spot, forward and swap currency contracts and currency options, to hedge foreign currency denominated receipts resulting from revenue and payments for raw materials and capital equipment denominated in foreign currencies.
The CSR group’s major foreign currency exposure relates to its US dollar aluminium sales revenue. The CSR group’s policy is to hedge its US dollar aluminium revenue to reduce the volatility of aluminium earnings, when acceptable Australian dollar outcomes can be achieved. Forecast US dollar receipts are based on highly probable forecast monthly sales transactions of aluminium which ensures that the underlying foreign currency exchange risk is identical to the hedged risk component (i.e. the US dollar price). Therefore the CSR group has established a hedge ratio of 1:1 for all its foreign exchange hedging relationships. Hedging is undertaken at declining levels for up to four years.
Other foreign exchange exposures are relatively small with CSR group policy providing for hedging for up to 18 months. The policy requires that material foreign currency denominated purchases of capital equipment be fully hedged to the domestic currency to eliminate currency exposure. Similarly, the policy also requires that all material foreign currency assets and liabilities are hedged to the relevant entity’s domestic currency.
The table below provides information about the CSR group’s significant exchange rate exposures:
PRINCIPAL/MATURITIES FAIR VALUE
AVERAGE Foreign exchange risk exposure EXCHANGE 1 YEAR 1 TO 3 TO OVER ($ MILLION) RATE a OR LESS 3 YEARS 5 YEARS 5 YEARS TOTAL ASSET LIABILITY
2015
Forward exchange rate agreementsb
US dollar
Buy US dollar 0.84 41.8 2.0 – – 43.8 4.5 –
Sell US dollar 0.87 206.8 88.3 – – 295.1 0.1 37.6
New Zealand dollar
Buy New Zealand dollar 1.08 18.5 0.7 – – 19.2 0.5 –
Sell New Zealand dollar 1.04 73.6 10.5 – – 84.1 – 1.1
Euro
Buy euro 0.68 6.4 – – – 6.4 – 0.2
Sell euro 0.71 1.5 – – – 1.5 – –
Great British pound
Buy Great British pound 0.52 0.1 – – – 0.1 – –
Thai baht
Buy Thai baht 24.93 – – – – – – –
Japanese yen
Buy Japanese yen 93.39 1.1 – – – 1.1 – –
Sell Japanese yen 92.82 0.4 – – – 0.4 – –
Total 5.1 38.9

CSR ANNUAL REPORT 2015 8180 CSR ANNUAL REPORT 2015
CSR ANNUAL REPORT 2015
NOTES TO THE FINANCIAL STATEMENTS CONTINUEDCSR LIMITED AND ITS CONTROLLED ENTITIES (CSR GROUP) YEAR ENDED 31 MARCH 2015
32. FINANCIAL RISK MANAGEMENT (CONTINUED)
PRINCIPAL/MATURITIES FAIR VALUE
AVERAGE EXCHANGE 1 YEAR 1 TO 3 TO OVER ($ MILLION) RATE a OR LESS 3 YEARS 5 YEARS 5 YEARS TOTAL ASSET LIABILITY
2014
Forward exchange rate agreementsb
US dollar
Buy US dollar 0.91 45.8 1.7 – – 47.5 0.3 0.7
Sell US dollar 0.88 128.5 0.9 – – 129.4 5.9 0.5
New Zealand dollar
Buy New Zealand dollar 1.07 15.7 0.9 – – 16.6 – –
Sell New Zealand dollar 1.07 42.4 0.9 – – 43.3 – 0.1
Euro
Buy euro 0.65 4.2 – – – 4.2 – 0.1
Sell euro 0.65 0.4 – – – 0.4 – –
Great British pound
Buy Great British pound 0.54 0.2 – – – 0.2 – –
Sell Great British pound 0.54 – – – – – – –
Thai baht
Buy Thai baht 29.17 0.3 – – – 0.3 – –
Sell Thai baht 29.06 0.2 – – – 0.2 – –
Japanese yen
Buy Japanese yen 91.64 0.1 – – – 0.1 – –
Sell Japanese yen 91.34 0.1 – – – 0.1 – –
Total 6.2 1.4
a Average rates for the individual periods do not materially differ from the overall average rates disclosed.b $34.6 million of net foreign exchange contract losses (2014: $4.8 million gains) have been deferred as the gains relate to cash flow hedges of highly probable forecast
transactions. The expected timing of recognition based on the fair values at 31 March 2015 is one year or less: $24.7 million loss (2014: $4.8 million gain); one to three years: $9.9 million loss (2014: $nil); and three to five years: $nil (2014: $nil).
At 31 March 2015, had the Australian dollar strengthened/weakened by 10% against the respective foreign currencies with all other variables held constant, the post-tax profit arising from forward exchange rate agreements would have been materially unchanged mainly as a result of the effectiveness of the hedging in place. Equity would have been $28.5 million higher/$34.8 million lower (2014: $9.6 million higher/$11.8 million lower) had the Australian dollar strengthened/weakened by 10% against the respective foreign currencies arising mainly from foreign forward exchange contracts designated as cash flow hedges.
At 31 March 2015, had the New Zealand dollar strengthened/weakened by 10% against the Australian dollar with all other variables held constant, the post-tax profit would have been $0.6 million higher/$0.7 million lower (2014: $2.6 million higher/$3.2 million lower).
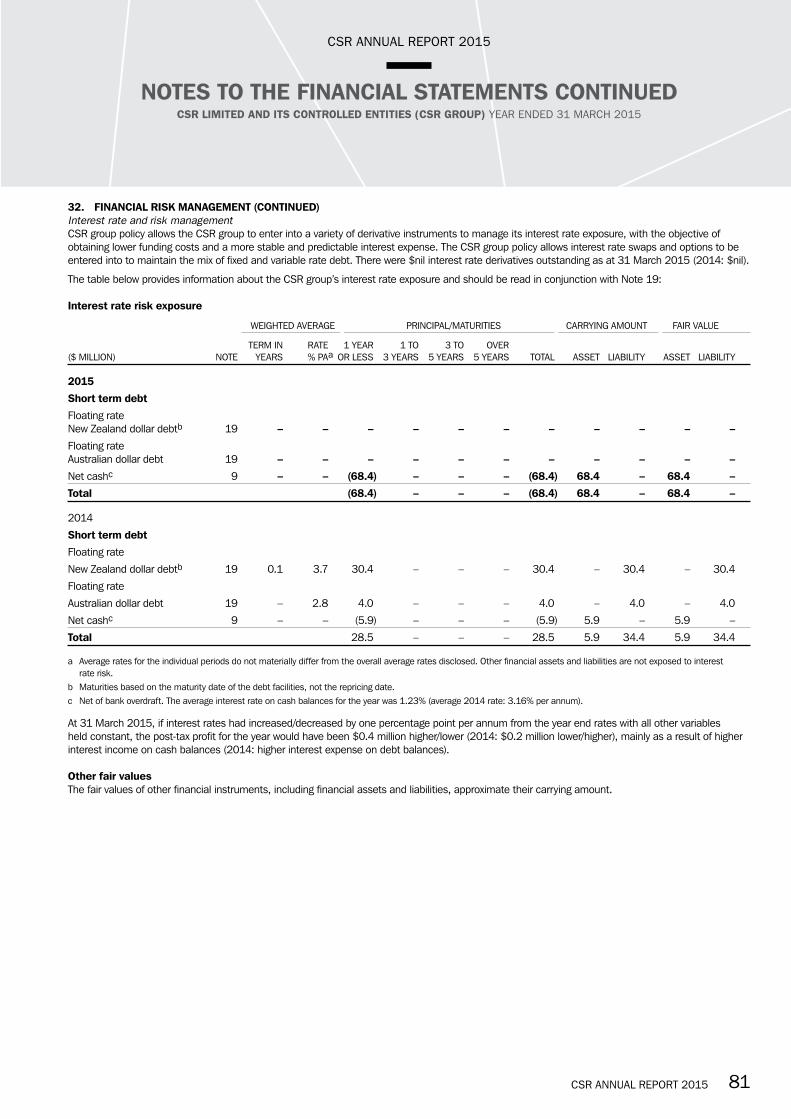
CSR ANNUAL REPORT 2015 8180 CSR ANNUAL REPORT 2015
CSR ANNUAL REPORT 2015
NOTES TO THE FINANCIAL STATEMENTS CONTINUEDCSR LIMITED AND ITS CONTROLLED ENTITIES (CSR GROUP) YEAR ENDED 31 MARCH 2015
32. FINANCIAL RISK MANAGEMENT (CONTINUED)Interest rate and risk management CSR group policy allows the CSR group to enter into a variety of derivative instruments to manage its interest rate exposure, with the objective of obtaining lower funding costs and a more stable and predictable interest expense. The CSR group policy allows interest rate swaps and options to be entered into to maintain the mix of fixed and variable rate debt. There were $nil interest rate derivatives outstanding as at 31 March 2015 (2014: $nil).
The table below provides information about the CSR group’s interest rate exposure and should be read in conjunction with Note 19:
Interest rate risk exposure
WEIGHTED AVERAGE PRINCIPAL/MATURITIES CARRYING AMOUNT FAIR VALUE
TERM IN RATE 1 YEAR 1 TO 3 TO OVER ($ MILLION) NOTE YEARS % PA a OR LESS 3 YEARS 5 YEARS 5 YEARS TOTAL ASSET LIABILITY ASSET LIABILITY
2015
Short term debt
Floating rate New Zealand dollar debtb 19 – – – – – – – – – – –
Floating rate Australian dollar debt 19 – – – – – – – – – – –
Net cashc 9 – – (68.4) – – – (68.4) 68.4 – 68.4 –
Total (68.4) – – – (68.4) 68.4 – 68.4 –
2014
Short term debt
Floating rate
New Zealand dollar debtb 19 0.1 3.7 30.4 – – – 30.4 – 30.4 – 30.4
Floating rate
Australian dollar debt 19 – 2.8 4.0 – – – 4.0 – 4.0 – 4.0
Net cashc 9 – – (5.9) – – – (5.9) 5.9 – 5.9 –
Total 28.5 – – – 28.5 5.9 34.4 5.9 34.4
a Average rates for the individual periods do not materially differ from the overall average rates disclosed. Other financial assets and liabilities are not exposed to interest rate risk.
b Maturities based on the maturity date of the debt facilities, not the repricing date.c Net of bank overdraft. The average interest rate on cash balances for the year was 1.23% (average 2014 rate: 3.16% per annum).
At 31 March 2015, if interest rates had increased/decreased by one percentage point per annum from the year end rates with all other variables held constant, the post-tax profit for the year would have been $0.4 million higher/lower (2014: $0.2 million lower/higher), mainly as a result of higher interest income on cash balances (2014: higher interest expense on debt balances).
Other fair valuesThe fair values of other financial instruments, including financial assets and liabilities, approximate their carrying amount.

CSR ANNUAL REPORT 2015 8382 CSR ANNUAL REPORT 2015
CSR ANNUAL REPORT 2015
NOTES TO THE FINANCIAL STATEMENTS CONTINUEDCSR LIMITED AND ITS CONTROLLED ENTITIES (CSR GROUP) YEAR ENDED 31 MARCH 2015
32. FINANCIAL RISK MANAGEMENT (CONTINUED)Cash flow hedging The impact of hedging instruments designated in hedging relationships as of 31 March 2015 on the statement of financial position of the CSR group is as follows:
CARRYING AMOUNT GAIN (LOSS)
CHANGES IN VALUE OF INSTRUMENT USED LINE ITEM IN FOR CALCULATING STATEMENT OF HEDGE ($ MILLION) NOTIONAL AMOUNT ASSETS LIABILITIES FINANCIAL POSITION INEFFECTIVENESS
2015Cash flow hedgesCommodity price risk
Aluminium commodity swaps (hedging forecast sales) 115,500 tonnes 37.2 – Other financial assets a 37.2
Pulp commodity swaps (hedging forecast purchases) 4,800 tonnes – – Other financial liabilities –
Foreign exchange risk
Forward currency contracts (hedging forecast sales) 233.4 – 35.8 Other financial liabilities b (35.8)
Forward currency contracts (hedging forecast purchases) 33.7 1.9 0.6 Other financial assets 1.3 and liabilities c
a $25.6 million of the carrying amount of Aluminium commodity swaps are disclosed within current other financial assets and $11.6 million within non-current other financial assets.
b $25.7 million of the carrying amount of forward currency contracts (sales) are disclosed within current other financial liabilities and $10.1 million within non-current other financial liabilities.
c $1.7 million of the carrying amount of forward currency contracts (purchases) are disclosed within current other financial assets and $0.2 million as non-current other financial assets. $0.6 million of forward current contract liabilities are disclosed within current other financial liabilities.
The impact of hedging instruments designated in hedging relationships as at 31 March 2014 on the statement of financial position of the CSR group is as follows:
CARRYING AMOUNT GAIN (LOSS)
CHANGES IN VALUE OF INSTRUMENT USED LINE ITEM IN FOR CALCULATING STATEMENT OF HEDGE ($ MILLION) NOTIONAL AMOUNT ASSETS LIABILITIES FINANCIAL POSITION INEFFECTIVENESS
2014Cash flow hedgesCommodity price risk
Aluminium commodity swaps (hedging forecast sales) 48,000 tonnes 6.2 – Other financial assets a 6.2
Pulp commodity swaps (hedging forecast purchases) 4,300 tonnes 0.1 – Current other financial – assets
Foreign exchange risk
Forward currency contracts (hedging forecast sales) 121.8 5.1 0.2 Other financial assets 4.9 and liabilities b
Forward currency contracts (hedging forecast purchases) 17.2 0.1 0.2 Other financial assets (0.1) and liabilities
a $5.8 million of the carrying amount of Aluminium commodity swaps are disclosed within current other financial assets and $0.4 million within non-current other financial assets.
b $5.1 million of the carrying amount of forward exchange swaps assets are disclosed within current other financial assets and $0.2 million of forward exchange swaps liabilities within non-current other financial liabilities.

CSR ANNUAL REPORT 2015 8382 CSR ANNUAL REPORT 2015
CSR ANNUAL REPORT 2015
NOTES TO THE FINANCIAL STATEMENTS CONTINUEDCSR LIMITED AND ITS CONTROLLED ENTITIES (CSR GROUP) YEAR ENDED 31 MARCH 2015
32. FINANCIAL RISK MANAGEMENT (CONTINUED)The impact of hedged items designated in hedging relationships as at 31 March 2015 on the statement of financial position of the CSR group is as follows:
GAIN (LOSS)
CHANGES IN VALUE OF HEDGED CASH FLOW ITEM USED FOR CALCULATING HEDGE RESERVE ($ MILLION) HEDGE EFFECTIVENESS (CONTINUING HEDGES)
2015Cash flow hedgesCommodity price risk Aluminium commodity swaps (hedging forecast sales) (37.3) 37.2 Pulp commodity swaps (hedging forecast purchases) – – Foreign exchange riskForward currency contracts (hedging forecast sales) 36.0 (35.8)Forward currency contracts (hedging forecast purchases) (1.3) 1.3
No hedge ineffectiveness was recognised in profit or loss during the year.
The above hedging relationships affected profit or loss and other comprehensive income as follows:
GAIN (LOSS) AFTER TAX
HEDGE GAIN/(LOSS) AMOUNT RECLASSIFIED FROM LINE ITEM IN RECOGNISED IN OTHER OTHER COMPREHENSIVE INCOME STATEMENT OF ($ MILLION) COMPREHENSIVE INCOME TO PROFIT OR LOSS AFTER TAX COMPREHENSIVE INCOME
2015Cash flow hedgesCommodity price riskAluminium commodity swaps (hedging forecast sales) 25.7 4.0 Trading revenuePulp commodity swaps (hedging forecast purchases) – 0.1 Cost of salesForeign exchange riskForward currency contracts (hedging forecast sales) (25.1) 3.4 Trading revenueForward currency contracts (hedging forecast purchases) 0.9 (0.1) Cost of sales
The impact of hedged items designated in hedging relationships as at 31 March 2014 on the statement of financial position of the CSR group is as follows:
GAIN (LOSS)
CHANGES IN VALUE OF HEDGED CASH FLOW ITEM USED FOR CALCULATING HEDGE RESERVE ($ MILLION) HEDGE EFFECTIVENESS (CONTINUING HEDGES)
2014Cash flow hedgesCommodity price risk Aluminium commodity swaps (hedging forecast sales) (6.2) 6.2 Pulp commodity swaps (hedging forecast purchases) (0.1) 0.1 Foreign exchange riskForward currency contracts (hedging forecast sales) (4.9) 4.9 Forward currency contracts (hedging forecast purchases) 0.1 0.1
The above hedging relationships affected profit or loss and other comprehensive income as follows: GAIN (LOSS) AFTER TAX
HEDGE GAIN (LOSS) AMOUNT RECLASSIFIED FROM LINE ITEM IN RECOGNISED IN OTHER OTHER COMPREHENSIVE INCOME STATEMENT OF ($ MILLION) COMPREHENSIVE INCOME TO PROFIT OR LOSS AFTER TAX COMPREHENSIVE INCOME
2014Cash flow hedgesCommodity price risk Aluminium commodity swaps (hedging forecast sales) 3.8 8.2 Trading revenuePulp commodity swaps (hedging forecast purchases) 0.1 (0.2) Cost of salesForeign exchange riskForward currency contracts (hedging forecast sales) 3.3 1.7 Trading revenueForward currency contracts (hedging forecast purchases) (0.1) (0.2) Cost of sales

CSR ANNUAL REPORT 2015 8584 CSR ANNUAL REPORT 2015
CSR ANNUAL REPORT 2015
NOTES TO THE FINANCIAL STATEMENTS CONTINUEDCSR LIMITED AND ITS CONTROLLED ENTITIES (CSR GROUP) YEAR ENDED 31 MARCH 2015
32. FINANCIAL RISK MANAGEMENT (CONTINUED)The following table provides an analysis of financial instruments that are measured subsequent to initial recognition of fair value, grouped into Level(s) 1 to 3 based on the degree to which the fair value is observable:
• Level 1 – fair value measurements are those derived from quoted prices (unadjusted) in active markets for identical assets or liabilities;
• Level 2 – fair value measurements are those derived from inputs other than quoted prices included within Level 1 that are observable for the asset or liability, either directly (i.e. as prices) or indirectly (i.e. derived from prices); and
• Level 3 – fair value measurements are those derived from valuation techniques that include inputs for the asset or liability that are not based on observable market data (unobservable inputs).
2015
($ MILLION) LEVEL 1 LEVEL 2 LEVEL 3 TOTAL
Financial assets at fair valueAluminiumAluminium commodity swaps – 37.2 – 37.2 PulpPulp commodity swaps – – – – Small-scale technology certificates (STC)STC forwards – – – – Other financial instrumentsForward exchange rate agreements – 5.1 – 5.1 Total – 42.3 – 42.3
2015
($ MILLION) LEVEL 1 LEVEL 2 LEVEL 3 TOTAL
Financial liabilities at fair valueSmall-scale technology certificates (STC)STC forwards – – – – PulpPulp commodity swaps – – – – Other financial instrumentsForward exchange rate agreements – 39.0 – 39.0 Total – 39.0 – 39.0
2014
($ MILLION) LEVEL 1 LEVEL 2 LEVEL 3 TOTAL
Financial assets at fair valueAluminiumAluminium commodity swaps – 6.2 – 6.2 PulpPulp commodity swaps – 0.2 – 0.2 Other financial instrumentsForward exchange rate agreements – 6.2 – 6.2 Total – 12.6 – 12.6
2014
($ MILLION) LEVEL 1 LEVEL 2 LEVEL 3 TOTAL
Financial liabilities at fair valueSmall-scale technology certificates (STC)STC forwards – – – – PulpPulp commodity swaps – – – – Other financial instrumentsForward exchange rate agreements – 1.4 – 1.4 Total – 1.4 – 1.4
There were no transfers from Level 2 to Level 1 and Level 3 in 2015 and no transfers in either direction in 2014.
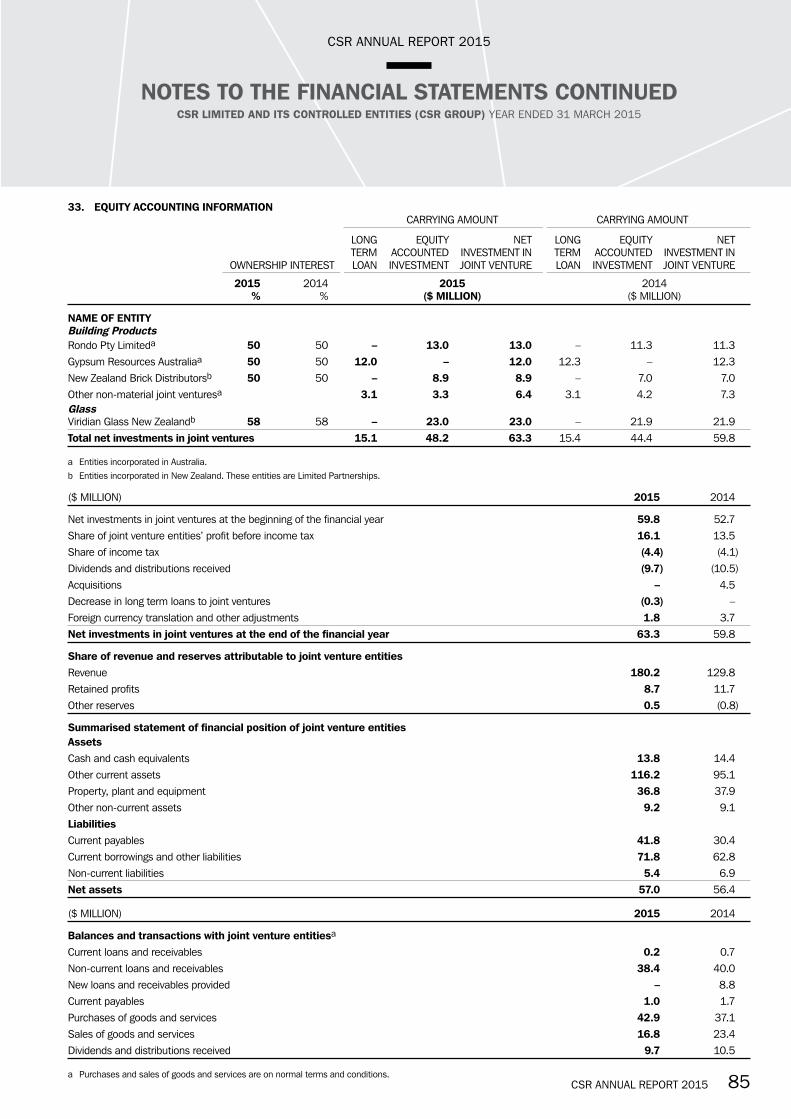
CSR ANNUAL REPORT 2015 8584 CSR ANNUAL REPORT 2015
CSR ANNUAL REPORT 2015
NOTES TO THE FINANCIAL STATEMENTS CONTINUEDCSR LIMITED AND ITS CONTROLLED ENTITIES (CSR GROUP) YEAR ENDED 31 MARCH 2015
33. EQUITY ACCOUNTING INFORMATION CARRYING AMOUNT CARRYING AMOUNT
LONG EQUITY NET LONG EQUITY NET TERM ACCOUNTED INVESTMENT IN TERM ACCOUNTED INVESTMENT IN OWNERSHIP INTEREST LOAN INVESTMENT JOINT VENTURE LOAN INVESTMENT JOINT VENTURE
2015 2014 2015 2014 % % ($ MILLION) ($ MILLION)
NAME OF ENTITYBuilding ProductsRondo Pty Limiteda 50 50 – 13.0 13.0 – 11.3 11.3 Gypsum Resources Australiaa 50 50 12.0 – 12.0 12.3 – 12.3 New Zealand Brick Distributorsb 50 50 – 8.9 8.9 – 7.0 7.0 Other non-material joint venturesa 3.1 3.3 6.4 3.1 4.2 7.3 Glass Viridian Glass New Zealandb 58 58 – 23.0 23.0 – 21.9 21.9 Total net investments in joint ventures 15.1 48.2 63.3 15.4 44.4 59.8
a Entities incorporated in Australia.b Entities incorporated in New Zealand. These entities are Limited Partnerships.
($ MILLION) 2015 2014
Net investments in joint ventures at the beginning of the financial year 59.8 52.7 Share of joint venture entities’ profit before income tax 16.1 13.5 Share of income tax (4.4) (4.1)Dividends and distributions received (9.7) (10.5)Acquisitions – 4.5 Decrease in long term loans to joint ventures (0.3) – Foreign currency translation and other adjustments 1.8 3.7 Net investments in joint ventures at the end of the financial year 63.3 59.8
Share of revenue and reserves attributable to joint venture entitiesRevenue 180.2 129.8 Retained profits 8.7 11.7 Other reserves 0.5 (0.8)
Summarised statement of financial position of joint venture entitiesAssetsCash and cash equivalents 13.8 14.4 Other current assets 116.2 95.1 Property, plant and equipment 36.8 37.9 Other non-current assets 9.2 9.1 LiabilitiesCurrent payables 41.8 30.4 Current borrowings and other liabilities 71.8 62.8 Non-current liabilities 5.4 6.9 Net assets 57.0 56.4
($ MILLION) 2015 2014
Balances and transactions with joint venture entitiesa
Current loans and receivables 0.2 0.7 Non-current loans and receivables 38.4 40.0 New loans and receivables provided – 8.8 Current payables 1.0 1.7 Purchases of goods and services 42.9 37.1 Sales of goods and services 16.8 23.4 Dividends and distributions received 9.7 10.5
a Purchases and sales of goods and services are on normal terms and conditions.

CSR ANNUAL REPORT 2015 8786 CSR ANNUAL REPORT 2015
CSR ANNUAL REPORT 2015
NOTES TO THE FINANCIAL STATEMENTS CONTINUEDCSR LIMITED AND ITS CONTROLLED ENTITIES (CSR GROUP) YEAR ENDED 31 MARCH 2015
34. PARTICULARS RELATING TO CONTROLLED ENTITIES
% CSR % CSR OWNERSHIP OWNERSHIP
COUNTRY OF COUNTRY OF INCORPORATION/ INCORPORATION/ FORMATION 2015 2014 FORMATION 2015 2014
AFS Systems Pty Limited Australia 100 – CSR Viridian International Pty Limited Australia 100 100
AFS Unit Trust Australia 100 – CSR Viridian Investment Company Pty Limited Australia 100 100
BI (Contracting) Pty Ltd Australia 100 100 CSR Viridian Limitedc Australia 100 100
Boral CSR Bricks Pty Limitedd Australia 100 100 CSR Viridian Operations Pty Limited Australia 100 100
Bradford Energy Finance Pty Limited Australia 100 100 CSR Viridian Properties Pty Limited Australia 100 100
Bradford Insulation Industries Pty Ltd Australia 100 100 CSR Viridian (New Zealand) Holdings Limited New Zealand 100 100
Bradford Insulation (SA) Pty Ltda Australia 100 100 CSR Viridian (New Zealand) Limited New Zealand 100 100
Bricks Australia Services Pty Limited Australia 100 100 CSR (Guangdong) Rockwool Co., Ltda China 100 100
Buchanan Borehole Collieries Pty Ltd Australia 100 100 CSR-ER Nominees Pty Limited Australia 100 100
CSR Building Products (NZ) Ltd New Zealand 100 100 DMS Security Glass Pty Limited Australia 100 100
CSR Building Products Ltdc Australia 100 100 Don Mathieson & Staff Glass Pty Limited Australia 100 100
CSR Developments Pty Ltd Australia 100 100 Farley & Lewers Pty Ltdb Australia 100 100
CSR Erskine Park Trust Australia 100 100 FEP Concrete Pty Ltdb Australia 100 100
CSR Finance Ltdc Australia 100 100 Gove Aluminium Finance Ltd Australia 70 70
CSR Guangdong Glasswool Co., Ltd China 79 79 Gyprock Holdings Pty Ltdb Australia 100 100
CSR Industrial Property Trust Australia 100 100 Midalco Pty Ltd Australia 100 100
CSR Industrial Property Nominees No 1 Pty Ltd Australia 100 100 Monier PGH Superannuation Pty Limited Australia 100 100
CSR Industrial Property Nominees No 2 Pty Ltd Australia 100 100 PASS Pty Limited Australia 100 100
CSR Insurance Pte Limited Singapore 100 100 PT Prima Karya Plasterboard Indonesia 100 100
CSR International Pty Ltd Australia 100 100 Rediwall Unit Trust Australia 100 –
CSR Investments Pty Ltdc Australia 100 100 Rivarol Pty Limitedc Australia 100 100
CSR Investments (Asia) Pty Ltd Australia 100 100 SA Independent Glass Pty Limited Australia 100 100
CSR Investments (Indonesia) Pty Ltd Australia 100 100 Seltsam Pty Ltd Australia 100 100
CSR Investments (Thailand) Pty Ltdb Australia 100 100 Softwood Holdings Ltda Australia 100 100
CSR Martini Pty Ltd Australia 70 70 Softwood Plantations Pty Ltda Australia 100 100
CSR Share Plan Pty Ltd Australia 100 100 Softwoods Queensland Pty Ltda Australia 100 100
CSR Structural Systems Pty Limitedc Australia 100 100 Thiess Bros Pty Ltd Australia 100 100
CSR Viridian Finance Pty Ltdc Australia 100 100 Thiess Holdings Pty Ltd Australia 100 100
CSR Viridian Holdings Limitedc Australia 100 100 VEST Super Pty Limitede Australia – 100
a In members’ voluntary liquidation.b CSR group is in the process of deregistering these companies.c These subsidiaries have been granted relief from the necessity to prepare financial reports in accordance with Class Order 98/1418 issued by ASIC. For further information
refer to Note 40.d Company name changed from CSR DJD Pty Limited during the financial year.e Deregistered during the previous financial year.

CSR ANNUAL REPORT 2015 8786 CSR ANNUAL REPORT 2015
CSR ANNUAL REPORT 2015
NOTES TO THE FINANCIAL STATEMENTS CONTINUEDCSR LIMITED AND ITS CONTROLLED ENTITIES (CSR GROUP) YEAR ENDED 31 MARCH 2015
35. CONTRACTED OPERATIONAL EXPENDITUREOperating lease and hire expenditurea
($ MILLION) 2015 2014
Contracted lease and hire expenditure commitments not otherwise provided for in the financial statements
Land and buildings 161.8 149.3
Plant and equipment 17.1 17.4
178.9 166.7
Contracted lease and hire expenditure comprises
Within one year 41.5 36.5
Between one and five year(s) 95.3 89.5
After five years 42.1 40.7
178.9 166.7
a The operating lease and rental payments during the year ended 31 March 2015 were $54.0 million (2014: $52.8 million).
The total of minimum rentals to be received in the future under non-cancellable sub-leases as at 31 March 2015 is not material. Contingent rentals for 2015 and 2014 financial years were not material. The leases on most of the CSR group’s rental premises contain renewal options. The CSR group’s decision to exercise renewal options is primarily dependent upon the profitability of business conducted at the location.
36. CONTRACTED CAPITAL EXPENDITURE
($ MILLION) 2015 2014
Estimated capital expenditure contracted for at year end but not provided for
Payable within one year – CSR group 12.1 12.1
Total contracted capital expenditure 12.1 12.1
37. CONTINGENT LIABILITIES
($ MILLION) 2015 2014
Contingent liabilities, capable of estimation, arise in respect of the following categories
Performance guarantees provided to third parties 61.2 65.8
Bank guarantees to Harwood Superannuation Fund 1.4 25.7
Total contingent liabilitiesa 62.6 91.5
a CSR Limited has not directly provided any financial guarantees to third parties outside the CSR group. All financial guarantees disclosed above are related to bank guarantees provided to third parties to guarantee CSR Limited’s performance of its liabilities. In addition, CSR Limited has undertaken to provide financial support, as and when required, to certain wholly owned controlled entities so as to enable those entities to pay their debts as and when such debts become due and payable.
Claims and possible claims (other than product liability which is discussed in Note 38) have arisen in the course of business against entities in the CSR group and have been made by entities in the CSR group. Based on legal advice obtained, the directors believe that any resultant liability or asset will not materially affect the financial position of the CSR group.
Workers’ compensationCSR Limited is a licensed self insurer in New South Wales, Queensland, Victoria, Western Australia and the Australian Capital Territory for workers’ compensation insurance. Adequate provision has been made for all known claims and reasonably foreseeable future claims with a provision of $29.2 million as at 31 March 2015 (2014: $31.3 million).

CSR ANNUAL REPORT 2015 8988 CSR ANNUAL REPORT 2015
CSR ANNUAL REPORT 2015
NOTES TO THE FINANCIAL STATEMENTS CONTINUEDCSR LIMITED AND ITS CONTROLLED ENTITIES (CSR GROUP) YEAR ENDED 31 MARCH 2015
38. PRODUCT LIABILITY CSR Limited and/or certain subsidiaries (CSR) were involved in mining asbestos and manufacturing and marketing products containing asbestos in Australia, and exporting asbestos to the United States. CSR’s involvement in asbestos mining, and the manufacture of products containing asbestos, began in the early 1940s and ceased with the disposition of the Wunderlich asbestos cement business in 1977. As a result of these activities, CSR has been named as a defendant in litigation in Australia and the United States.
In Australia, asbestos related personal injury claims have been made by employees and ex-employees of CSR, by others such as contractors and transporters and by users of products containing asbestos, by people who lived near factories operated by former subsidiaries of CSR, as well as residents of and visitors to Wittenoom. As at 31 March 2015, there were 473 such claims pending.
In the United States, claims are made by people who allege exposure to asbestos fibre used in the manufacture of products containing asbestos or in the installation or use of those products. As at 31 March 2015, there were 541 such claims pending.
CSR has been settling claims since 1989. As at 31 March 2015, CSR had resolved approximately 3,800 claims in Australia and approximately 137,000 claims in the United States.
CSR’s recent claims experience can be summarised as follows:
YEAR ENDED 31 MARCH 2015 2014 2013 2012 2011
Number of claims received 258 339 347 435 412
Number of claims resolved 257 804 488 418 634
Amount spent on settlements (A$ million)a 25.0 29.2 31.0 34.7 32.5
Average cost per resolved claim (A$) 97,276 36,411 63,553 83,067 51,300
a Excludes external legal costs, net of insurance recoveries.
The annual amounts paid by CSR in respect of asbestos related claims vary year on year depending on the number and types of claims received and resolved during each year, the litigation or other determination of particular claims or issues and any determination by management to resolve claims that may have been received in earlier years.
Basis of provisionCSR includes in its financial statements a product liability provision covering all known claims and reasonably foreseeable future asbestos related claims. This provision is reviewed every six months. The provision recognises the best estimate of the consideration required to settle the present obligation for anticipated compensation payments and legal costs as at the reporting date. The provision is net of anticipated workers’ compensation payments from available workers’ compensation insurers. CSR does not believe there is any other significant source of insurance available to meet its asbestos liabilities. CSR no longer has general insurance coverage in relation to its ongoing asbestos liabilities.
In determining the product liability provision, CSR has obtained independent expert advice in relation to the future incidence and value of asbestos related claims in each of the United States and Australia. CSR has appointed Finity Consulting Pty Limited, as the independent expert to estimate the Australian liabilities. CSR has appointed Gnarus Advisors LLC as the independent expert to estimate the United States liabilities. The independent experts make their own determination of the methodology most appropriate for estimating CSR’s future liabilities. The assessments of those independent experts project CSR’s claims experience into the future using modelling techniques that take into account a range of possible outcomes. The present value of the liabilities is estimated by discounting the estimated cash flows using the pre-tax rate that reflects the current market assessment of the time value of money and risks specific to those liabilities.
Many factors are relevant to the independent experts’ estimates of future asbestos liabilities, including:
• numbers of claims received by disease and claimant type and expected future claims numbers, including expectations as to when claims experience will peak;
• expected value of claims;• the presence of other defendants in litigation or claims involving CSR;• the impact of and developments in the litigation and settlement environment in each of Australia and the United States;• estimations of legal costs; • expected claims inflation; and• the discount rate applied to future payments.
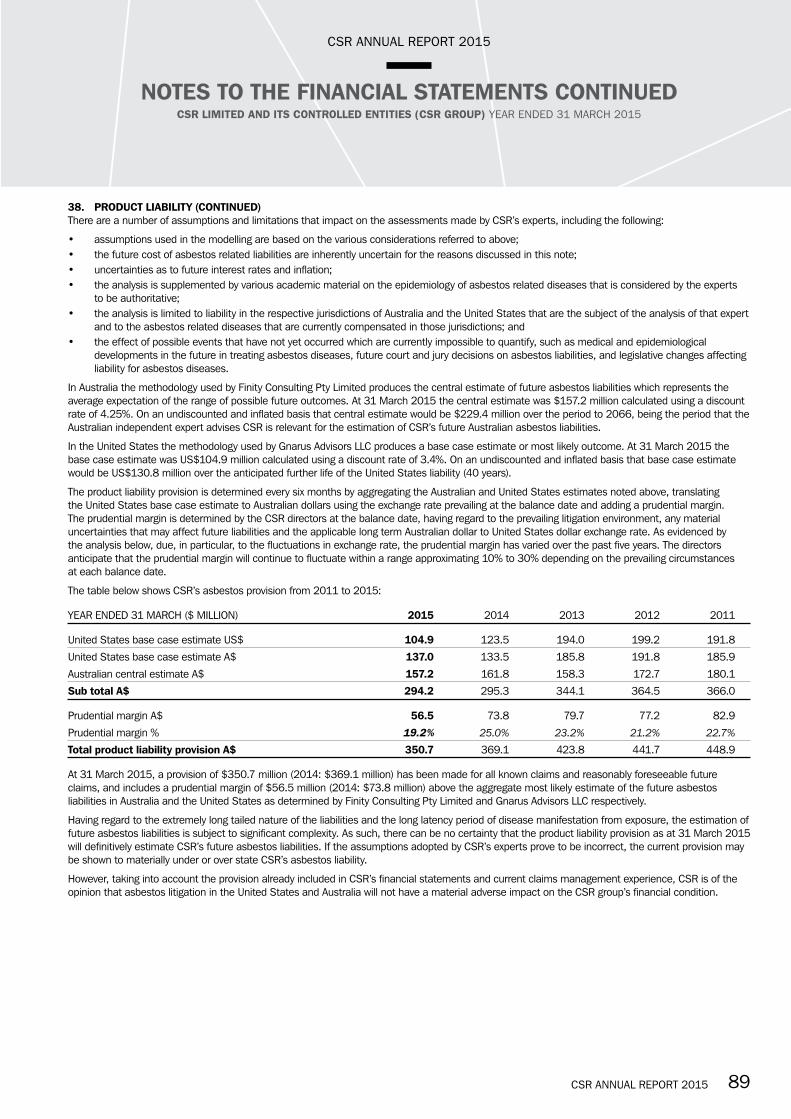
CSR ANNUAL REPORT 2015 8988 CSR ANNUAL REPORT 2015
CSR ANNUAL REPORT 2015
NOTES TO THE FINANCIAL STATEMENTS CONTINUEDCSR LIMITED AND ITS CONTROLLED ENTITIES (CSR GROUP) YEAR ENDED 31 MARCH 2015
38. PRODUCT LIABILITY (CONTINUED)There are a number of assumptions and limitations that impact on the assessments made by CSR’s experts, including the following:
• assumptions used in the modelling are based on the various considerations referred to above;• the future cost of asbestos related liabilities are inherently uncertain for the reasons discussed in this note;• uncertainties as to future interest rates and inflation;• the analysis is supplemented by various academic material on the epidemiology of asbestos related diseases that is considered by the experts
to be authoritative;• the analysis is limited to liability in the respective jurisdictions of Australia and the United States that are the subject of the analysis of that expert
and to the asbestos related diseases that are currently compensated in those jurisdictions; and• the effect of possible events that have not yet occurred which are currently impossible to quantify, such as medical and epidemiological
developments in the future in treating asbestos diseases, future court and jury decisions on asbestos liabilities, and legislative changes affecting liability for asbestos diseases.
In Australia the methodology used by Finity Consulting Pty Limited produces the central estimate of future asbestos liabilities which represents the average expectation of the range of possible future outcomes. At 31 March 2015 the central estimate was $157.2 million calculated using a discount rate of 4.25%. On an undiscounted and inflated basis that central estimate would be $229.4 million over the period to 2066, being the period that the Australian independent expert advises CSR is relevant for the estimation of CSR’s future Australian asbestos liabilities.
In the United States the methodology used by Gnarus Advisors LLC produces a base case estimate or most likely outcome. At 31 March 2015 the base case estimate was US$104.9 million calculated using a discount rate of 3.4%. On an undiscounted and inflated basis that base case estimate would be US$130.8 million over the anticipated further life of the United States liability (40 years).
The product liability provision is determined every six months by aggregating the Australian and United States estimates noted above, translating the United States base case estimate to Australian dollars using the exchange rate prevailing at the balance date and adding a prudential margin. The prudential margin is determined by the CSR directors at the balance date, having regard to the prevailing litigation environment, any material uncertainties that may affect future liabilities and the applicable long term Australian dollar to United States dollar exchange rate. As evidenced by the analysis below, due, in particular, to the fluctuations in exchange rate, the prudential margin has varied over the past five years. The directors anticipate that the prudential margin will continue to fluctuate within a range approximating 10% to 30% depending on the prevailing circumstances at each balance date.
The table below shows CSR’s asbestos provision from 2011 to 2015:
YEAR ENDED 31 MARCH ($ MILLION) 2015 2014 2013 2012 2011
United States base case estimate US$ 104.9 123.5 194.0 199.2 191.8
United States base case estimate A$ 137.0 133.5 185.8 191.8 185.9
Australian central estimate A$ 157.2 161.8 158.3 172.7 180.1
Sub total A$ 294.2 295.3 344.1 364.5 366.0
Prudential margin A$ 56.5 73.8 79.7 77.2 82.9
Prudential margin % 19.2% 25.0% 23.2% 21.2% 22.7%Total product liability provision A$ 350.7 369.1 423.8 441.7 448.9
At 31 March 2015, a provision of $350.7 million (2014: $369.1 million) has been made for all known claims and reasonably foreseeable future claims, and includes a prudential margin of $56.5 million (2014: $73.8 million) above the aggregate most likely estimate of the future asbestos liabilities in Australia and the United States as determined by Finity Consulting Pty Limited and Gnarus Advisors LLC respectively.
Having regard to the extremely long tailed nature of the liabilities and the long latency period of disease manifestation from exposure, the estimation of future asbestos liabilities is subject to significant complexity. As such, there can be no certainty that the product liability provision as at 31 March 2015 will definitively estimate CSR’s future asbestos liabilities. If the assumptions adopted by CSR’s experts prove to be incorrect, the current provision may be shown to materially under or over state CSR’s asbestos liability.
However, taking into account the provision already included in CSR’s financial statements and current claims management experience, CSR is of the opinion that asbestos litigation in the United States and Australia will not have a material adverse impact on the CSR group’s financial condition.

CSR ANNUAL REPORT 2015 9190 CSR ANNUAL REPORT 2015
CSR ANNUAL REPORT 2015
NOTES TO THE FINANCIAL STATEMENTS CONTINUEDCSR LIMITED AND ITS CONTROLLED ENTITIES (CSR GROUP) YEAR ENDED 31 MARCH 2015
38. PRODUCT LIABILITY (CONTINUED)Process agreed with the Foreign Investment Review Board (FIRB)On 22 December 2010, CSR sold its Sucrogen business, to Wilmar International Limited (Wilmar). The sale of Sucrogen to Wilmar required approval from the Commonwealth Treasurer (via the FIRB).
As part of the approval process, and as further evidence of CSR’s commitment to responsibly managing its asbestos related liabilities, CSR has put in place a process for the external oversight of any repatriation of capital by CSR to its shareholders during the period of seven years following the sale of Sucrogen (subject to limited earlier termination provisions).
As part of this process, CSR has entered into an agreement with an independent body, The Trust Company (TTC) which was acquired by Perpetual Limited in 2013, pursuant to which CSR must demonstrate that CSR has fulfilled certain requirements prior to any repatriation of funds to its shareholders other than half yearly or annual dividends paid by CSR in accordance with its usual practice and its dividend policy in force from time to time.
These requirements include that:
• CSR’s asbestos liabilities have been reviewed by an additional independent expert;• CSR intends to retain its ‘investment grade’ credit rating following any repatriation; and• an approved accounting firm has expressed an opinion that the decision of CSR’s directors that a particular repatriation of capital would not
materially prejudice creditors, including current and reasonably foreseeable future asbestos claimants, was formed on a reasonable basis.
In accordance with the agreement with TTC, documentation was provided by CSR to TTC to demonstrate that the above requirements were fulfilled in relation to the special dividend and the capital return which were paid to CSR shareholders on 2 February 2011 and 3 March 2011 respectively.
39. SUBSEQUENT EVENTSWith the exception of the items disclosed below, there has not arisen in the interval between 31 March 2015 and the date of this report, any other matter or circumstance that has significantly affected or may significantly affect the operations of the CSR group, the results of those operations or the state of affairs of the CSR group in subsequent financial years.
(i) Formation of east coast bricks joint ventureOn 4 April 2014, CSR and Boral Limited announced an intention to combine each Company’s brick operations on the east coast of Australia. The purpose of the transaction is to drive efficiencies across the combined network of operations.
The Australian Competition and Consumer Commission announced on 18 December 2014 it would not oppose the proposed transaction. Subsequently, on 1 May 2015, CSR and Boral announced the completion of the transaction and formation of the combined venture. The venture is owned 60% by CSR and 40% by Boral, reflecting the valuation of the two businesses. There was no cash consideration as part of the transaction except for typical working capital and closing adjustments.
The structure of the transaction will see CSR group consolidating the newly formed company. The transaction has not had an effect on the financial statements for the year ended 31 March 2015 and operating results and assets and liabilities of the new company will be consolidated from 1 May 2015. Preliminary acquisition accounting for the transaction will be disclosed in the financial report for the half year ending 30 September 2015.
(ii) DividendsFor dividends resolved to be paid after 31 March 2015, refer to Note 26.
40. DEED OF CROSS GUARANTEECSR Limited, CSR Building Products Limited, CSR Finance Limited, CSR Investments Pty Limited, CSR Viridian Finance Pty Limited, CSR Viridian Holdings Limited, CSR Viridian Limited, CSR Structural Systems Pty Limited and Rivarol Pty Limited are parties to a deed of cross guarantee under which each company guarantees the debts of the others. By entering into the deed, the wholly owned entities have been relieved from the requirement to prepare a financial report and directors’ report under Class Order 98/1418 (as amended) issued by the ASIC.
(i) Consolidated statement of financial performance, consolidated statement of comprehensive income and summary of movements in consolidated retained profitsThe above companies represent a ‘closed group’ for the purposes of the Class Order, and as there are no other parties to the deed of cross guarantee that are controlled by CSR Limited, they also represent the ‘extended closed group’.
Set out below is a consolidated statement of financial performance, a consolidated statement of comprehensive income and a summary of movements in consolidated retained profits for the years ended 31 March 2015 and 31 March 2014 of the closed group consisting of CSR Limited, CSR Building Products Limited, CSR Finance Limited, CSR Investments Pty Limited, CSR Viridian Finance Pty Limited, CSR Viridian Holdings Limited, CSR Viridian Limited, CSR Structural Systems Pty Limited and Rivarol Pty Limited.
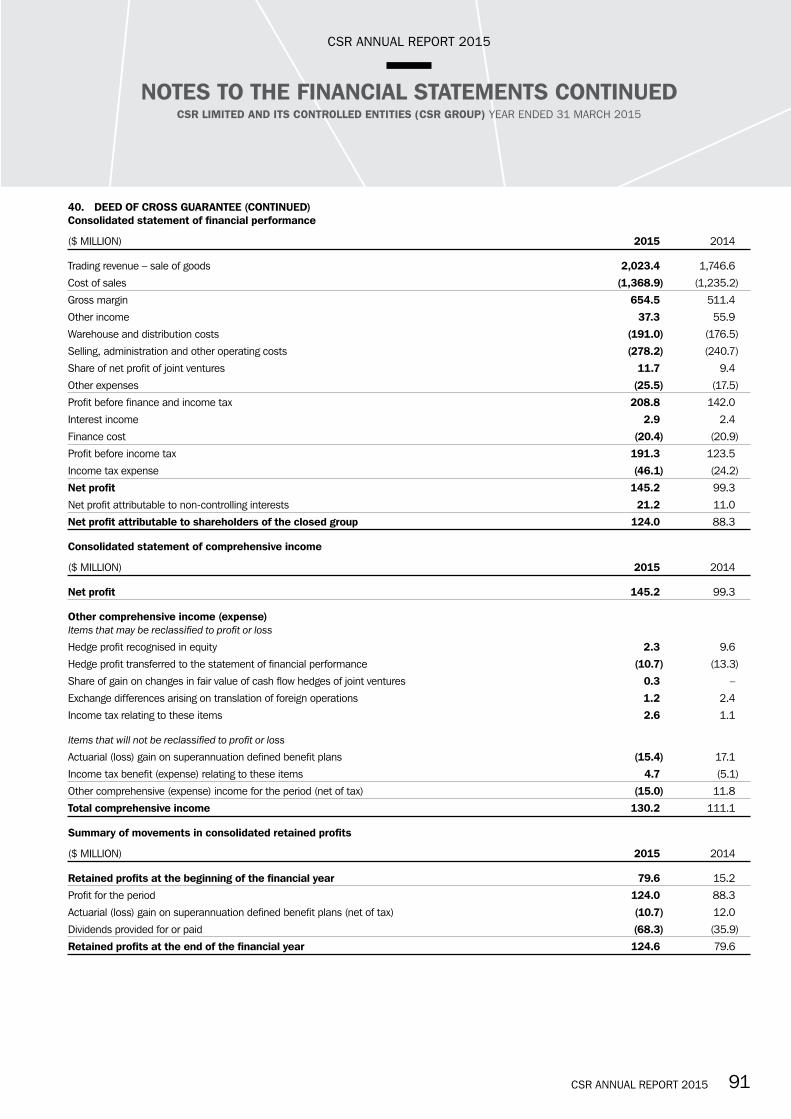
CSR ANNUAL REPORT 2015 9190 CSR ANNUAL REPORT 2015
CSR ANNUAL REPORT 2015
NOTES TO THE FINANCIAL STATEMENTS CONTINUEDCSR LIMITED AND ITS CONTROLLED ENTITIES (CSR GROUP) YEAR ENDED 31 MARCH 2015
40. DEED OF CROSS GUARANTEE (CONTINUED)Consolidated statement of financial performance
($ MILLION) 2015 2014
Trading revenue – sale of goods 2,023.4 1,746.6
Cost of sales (1,368.9) (1,235.2)
Gross margin 654.5 511.4
Other income 37.3 55.9
Warehouse and distribution costs (191.0) (176.5)
Selling, administration and other operating costs (278.2) (240.7)
Share of net profit of joint ventures 11.7 9.4
Other expenses (25.5) (17.5)
Profit before finance and income tax 208.8 142.0
Interest income 2.9 2.4
Finance cost (20.4) (20.9)
Profit before income tax 191.3 123.5
Income tax expense (46.1) (24.2)
Net profit 145.2 99.3
Net profit attributable to non-controlling interests 21.2 11.0
Net profit attributable to shareholders of the closed group 124.0 88.3
Consolidated statement of comprehensive income
($ MILLION) 2015 2014
Net profit 145.2 99.3
Other comprehensive income (expense)Items that may be reclassified to profit or lossHedge profit recognised in equity 2.3 9.6
Hedge profit transferred to the statement of financial performance (10.7) (13.3)
Share of gain on changes in fair value of cash flow hedges of joint ventures 0.3 –
Exchange differences arising on translation of foreign operations 1.2 2.4
Income tax relating to these items 2.6 1.1
Items that will not be reclassified to profit or lossActuarial (loss) gain on superannuation defined benefit plans (15.4) 17.1
Income tax benefit (expense) relating to these items 4.7 (5.1)
Other comprehensive (expense) income for the period (net of tax) (15.0) 11.8
Total comprehensive income 130.2 111.1
Summary of movements in consolidated retained profits
($ MILLION) 2015 2014
Retained profits at the beginning of the financial year 79.6 15.2
Profit for the period 124.0 88.3
Actuarial (loss) gain on superannuation defined benefit plans (net of tax) (10.7) 12.0
Dividends provided for or paid (68.3) (35.9)
Retained profits at the end of the financial year 124.6 79.6
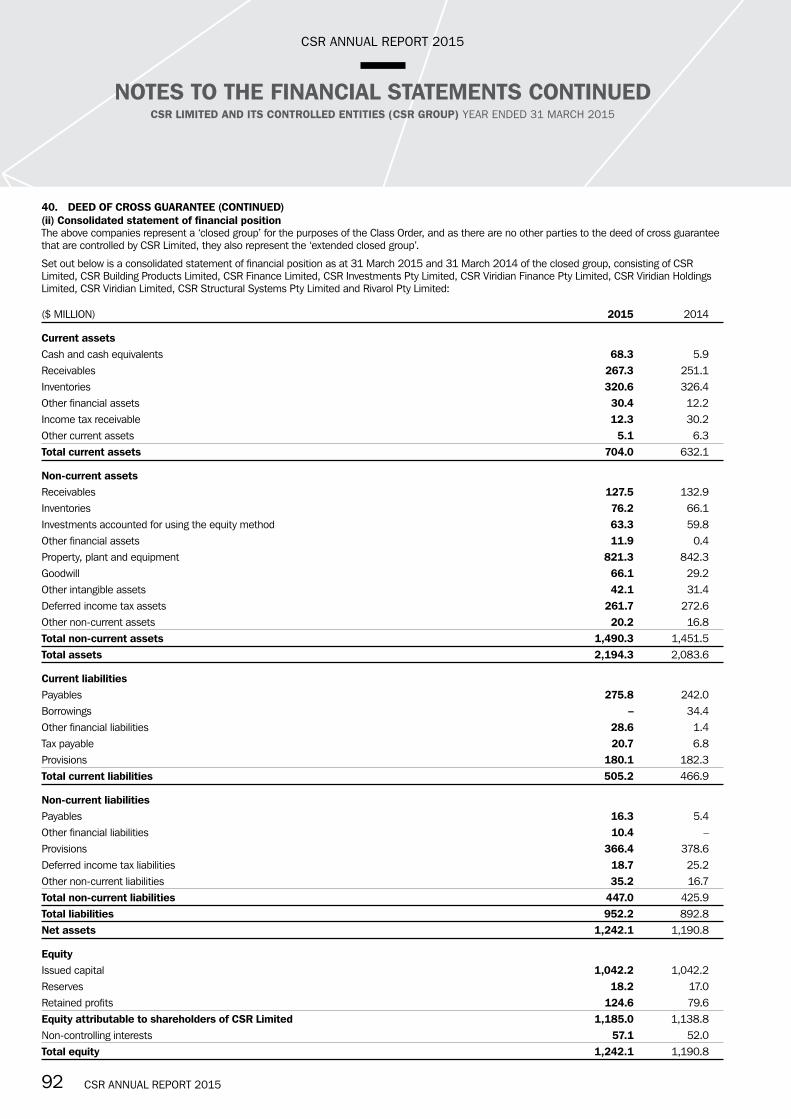
CSR ANNUAL REPORT 2015 9392 CSR ANNUAL REPORT 2015
CSR ANNUAL REPORT 2015
NOTES TO THE FINANCIAL STATEMENTS CONTINUEDCSR LIMITED AND ITS CONTROLLED ENTITIES (CSR GROUP) YEAR ENDED 31 MARCH 2015
40. DEED OF CROSS GUARANTEE (CONTINUED)(ii) Consolidated statement of financial positionThe above companies represent a ‘closed group’ for the purposes of the Class Order, and as there are no other parties to the deed of cross guarantee that are controlled by CSR Limited, they also represent the ‘extended closed group’.
Set out below is a consolidated statement of financial position as at 31 March 2015 and 31 March 2014 of the closed group, consisting of CSR Limited, CSR Building Products Limited, CSR Finance Limited, CSR Investments Pty Limited, CSR Viridian Finance Pty Limited, CSR Viridian Holdings Limited, CSR Viridian Limited, CSR Structural Systems Pty Limited and Rivarol Pty Limited:
($ MILLION) 2015 2014
Current assetsCash and cash equivalents 68.3 5.9 Receivables 267.3 251.1 Inventories 320.6 326.4 Other financial assets 30.4 12.2 Income tax receivable 12.3 30.2 Other current assets 5.1 6.3 Total current assets 704.0 632.1
Non-current assetsReceivables 127.5 132.9 Inventories 76.2 66.1 Investments accounted for using the equity method 63.3 59.8 Other financial assets 11.9 0.4 Property, plant and equipment 821.3 842.3 Goodwill 66.1 29.2 Other intangible assets 42.1 31.4 Deferred income tax assets 261.7 272.6 Other non-current assets 20.2 16.8 Total non-current assets 1,490.3 1,451.5 Total assets 2,194.3 2,083.6
Current liabilitiesPayables 275.8 242.0 Borrowings – 34.4 Other financial liabilities 28.6 1.4 Tax payable 20.7 6.8 Provisions 180.1 182.3 Total current liabilities 505.2 466.9
Non-current liabilitiesPayables 16.3 5.4 Other financial liabilities 10.4 – Provisions 366.4 378.6 Deferred income tax liabilities 18.7 25.2 Other non-current liabilities 35.2 16.7 Total non-current liabilities 447.0 425.9 Total liabilities 952.2 892.8 Net assets 1,242.1 1,190.8
EquityIssued capital 1,042.2 1,042.2 Reserves 18.2 17.0 Retained profits 124.6 79.6 Equity attributable to shareholders of CSR Limited 1,185.0 1,138.8 Non-controlling interests 57.1 52.0 Total equity 1,242.1 1,190.8
CSR ANNUAL REPORT 2015 9392 CSR ANNUAL REPORT 2015
CSR ANNUAL REPORT 2015
DIRECTORS’ DECLARATIONCSR LIMITED AND ITS CONTROLLED ENTITIES (CSR GROUP) YEAR ENDED 31 MARCH 2015
The directors declare that:
a) in the directors’ opinion, there are reasonable grounds to believe that CSR Limited will be able to pay its debts as and when they become due and payable;
b) in the directors’ opinion, the attached financial statements are in compliance with International Financial Reporting Standards, as disclosed in the significant accounting policies;
c) in the directors’ opinion, the attached financial statements and notes thereto are in accordance with the Corporations Act 2001, including compliance with accounting standards and giving a true and fair view of the financial position and performance of the CSR group;
d) the directors have been given the declarations required by section 295A of the Corporations Act 2001 from the managing director and chief financial officer for the financial year ended 31 March 2015; and
e) there are reasonable grounds to believe that CSR Limited and the group entities identified in Note 40 will be able to meet any obligations or liabilities to which they are or may become subject to by virtue of the deed of cross guarantee between CSR Limited and those group entities pursuant to ASIC Class Order 98/1418.
Signed in accordance with a resolution of the directors made pursuant to section 295(5) of the Corporations Act 2001.
Jeremy Sutcliffe Chairman
12 May 2015
Rob Sindel Managing Director
12 May 2015

CSR ANNUAL REPORT 2015 9594 CSR ANNUAL REPORT 2015
CSR ANNUAL REPORT 2015
INDEPENDENT AUDITOR’S REPORT TO THE MEMBERS OF CSR LIMITED
CSR LIMITED AND ITS CONTROLLED ENTITIES (CSR GROUP) YEAR ENDED 31 MARCH 2015
REPORT ON THE FINANCIAL REPORTWe have audited the accompanying financial report of CSR Limited, which comprises the statement of financial position as at 31 March 2015, the statement of financial performance, the statement of comprehensive income, the statement of cash flows and the statement of changes in equity for the year ended on that date, notes comprising a summary of significant accounting policies and other explanatory information, and the directors’ declaration of the consolidated entity comprising the company and the entities it controlled at the year’s end or from time to time during the financial year as set out on pages 43 to 93.
Directors’ Responsibility for the Financial ReportThe directors of the company are responsible for the preparation of the financial report that gives a true and fair view in accordance with Australian Accounting Standards and the Corporations Act 2001 and for such internal control as the directors determine is necessary to enable the preparation of the financial report that gives a true and fair view and is free from material misstatement, whether due to fraud or error. In “Significant accounting policies” the directors also state, in accordance with Accounting Standard AASB 101 Presentation of Financial Statements, that the consolidated financial statements comply with International Financial Reporting Standards.
Auditor’s ResponsibilityOur responsibility is to express an opinion on the financial report based on our audit. We conducted our audit in accordance with Australian Auditing Standards. Those standards require that we comply with relevant ethical requirements relating to audit engagements and plan and perform the audit to obtain reasonable assurance whether the financial report is free from material misstatement.
An audit involves performing procedures to obtain audit evidence about the amounts and disclosures in the financial report. The procedures selected depend on the auditor’s judgement, including the assessment of the risks of material misstatement of the financial report, whether due to fraud or error. In making those risk assessments, the auditor considers internal control, relevant to the entity’s preparation of the financial report that gives a true and fair view, in order to design audit procedures that are appropriate in the circumstances, but not for the purpose of expressing an opinion on the effectiveness of the entity’s internal control. An audit also includes evaluating the appropriateness of accounting policies used and the reasonableness of accounting estimates made by the directors, as well as evaluating the overall presentation of the financial report.
We believe that the audit evidence we have obtained is sufficient and appropriate to provide a basis for our audit opinion.
Auditor’s Independence DeclarationIn conducting our audit, we have complied with the independence requirements of the Corporations Act 2001. We confirm that the independence declaration required by the Corporations Act 2001, which has been given to the directors of CSR Limited, would be in the same terms if given to the directors as at the time of this auditor’s report.
OpinionIn our opinion:
(a) the financial report of CSR Limited is in accordance with the Corporations Act 2001, including: (i) giving a true and fair view of the consolidated entity’s financial position as at 31 March 2015 and of its performance for the year ended
on that date; and (ii) complying with Australian Accounting Standards and the Corporations Regulations 2001; and(b) the consolidated financial statements also comply with International Financial Reporting Standards as disclosed in significant accounting policies.
REPORT ON THE REMUNERATION REPORTWe have audited the Remuneration Report included in pages 23 to 39 of the directors’ report for the year ended 31 March 2015. The directors of the company are responsible for the preparation and presentation of the Remuneration Report in accordance with section 300A of the Corporations Act 2001. Our responsibility is to express an opinion on the Remuneration Report, based on our audit conducted in accordance with Australian Auditing Standards.
OpinionIn our opinion the Remuneration Report of CSR Limited for the year ended 31 March 2015, complies with section 300A of the Corporations Act 2001.
DELOITTE TOUCHE TOHMATSU J A Leotta Partner Chartered Accountants Sydney, 12 May 2015
Liability limited by a scheme approved under Professional Standards Legislation.Member of Deloitte Touche Tohmatsu Limited
CSR ANNUAL REPORT 2015 9594 CSR ANNUAL REPORT 2015
CSR ANNUAL REPORT 2015
AUDITOR’S INDEPENDENCE DECLARATION TO THE DIRECTORS OF CSR LIMITED
CSR LIMITED AND ITS CONTROLLED ENTITIES (CSR GROUP) YEAR ENDED 31 MARCH 2015
The DirectorsCSR LimitedTriniti 339 Delhi RoadNORTH RYDE NSW 2113
12 May 2015
Dear Directors,
CSR LimitedIn accordance with section 307C of the Corporations Act 2001, I am pleased to provide the following declaration of independence to the directors of CSR Limited.
As lead audit partner for the audit of the financial statements of CSR Limited for the financial year ended 31 March 2015, I declare that to the best of my knowledge and belief, there have been no contraventions of:
(i) the auditor independence requirements of the Corporations Act 2001 in relation to the audit; and
(ii) any applicable code of professional conduct in relation to the audit.
Yours sincerely
DELOITTE TOUCHE TOHMATSU J A Leotta Partner Chartered Accountants
Liability limited by a scheme approved under Professional Standards Legislation. Member of Deloitte Touche Tohmatsu Limited.

CSR ANNUAL REPORT 201596
CSR ANNUAL REPORT 2015
20 LARGEST HOLDERS OF ORDINARY SHARESAs at 12 May 2015
RANK NAME UNITS % OF UNITS
1. J P MORGAN NOMINEES AUSTRALIA LIMITED 97,741,430 19.32
2. HSBC CUSTODY NOMINEES (AUSTRALIA) LIMITED 76,512,875 15.12
3. CITICORP NOMINEES PTY LIMITED 61,367,947 12.13
4. NATIONAL NOMINEES LIMITED 60,986,832 12.05
5. CITICORP NOMINEES PTY LIMITED 15,123,708 2.99
6. BNP PARIBAS NOMS PTY LTD 14,309,531 2.83
7. RBC INVESTOR SERVICES AUSTRALIA NOMINEES PTY LIMITED 4,526,212 0.89
8. HSBC CUSTODY NOMINEES (AUSTRALIA) LIMITED 3,980,287 0.79
9. NATIONAL NOMINEES LIMITED 3,979,406 0.79
10. RBC INVESTOR SERVICES AUSTRALIA NOMINEES P/L 2,900,000 0.57
11. PRUDENTIAL NOMINEES PTY LTD 2,500,000 0.49
12. AUSTRALIAN FOUNDATION INVESTMENT COMPANY LIMITED 2,492,240 0.49
13. QIC LIMITED 2,157,508 0.43
14. BOND STREET CUSTODIANS LIMITED 1,972,188 0.39
15. AMP LIFE LIMITED 1,907,825 0.38
16. CSR SHARE PLAN PTY LIMITED 1,457,775 0.29
17. SBN NOMINEES PTY LIMITED 1,287,500 0.25
18. BRISPOT NOMINEES PTY LTD 1,153,790 0.23
19. MR ALLAN ERNEST ORMES 1,066,667 0.21
20. GWYNVILL TRADING PTY LIMITED 1,060,000 0.21
Top 20 holders of issued capital 358,483,721 70.85
Total remaining holders balance 147,516,594 29.15
SUBSTANTIAL SHAREHOLDERS OF CSR LIMITED
Commonwealth Bank of Australia advised that as at 10 March 2015, it and its associates had an interest in 26.5 million shares, which represented 5.24% of CSR’s issued capital at that time.
Vinva Investment Management and its subsidiaries advised that as at 5 June 2014, it and its associates had an interest in 25.3 million shares, which represented 5.01% of CSR’s issued capital at that time.
DISTRIBUTION OF SHAREHOLDERS AND SHAREHOLDING
LOCATION UNITS UNITS % HOLDERS HOLDERS %
AUSTRALIA 501,286,760 99.07 51,463 96.49
NEW ZEALAND 3,046,839 0.60 1,348 2.53
HONG KONG 673,458 0.13 43 0.08
UNITED KINGDOM 338,570 0.07 261 0.49
SINGAPORE 158,774 0.03 54 0.10
Other 495,914 0.10 166 0.31
Total 506,000,315 100.00 53,335 100.00
% OF ISSUED RANGE HOLDERS UNITS CAPITAL
1 – 1,000 26,480 13,337,707 2.64
1,001 – 5,000 21,727 48,473,359 9.58
5,001 – 10,000 3,175 22,555,568 4.46
10,001 – 100,000 1,863 41,251,649 8.15
100,001 and over 90 380,382,032 75.17
Total 53,335 506,000,315 100.00
SHAREHOLDER INFORMATION

CSR ANNUAL REPORT 2015
UNMARKETABLE PARCELS
MINIMUM PARCEL SIZE HOLDERS UNITS
Minimum $500.00 parcel at $4.04 per unit 124 1,418 62,210
RECENT CSR DIVIDENDS
FRANKED AMOUNT TYPE OF DIVIDEND PER SHARE DATE PAID DIVIDEND PER SHARE FRANKING AT 30% TAX
December 2010 Interim 3.0 cents 100% 3.0 cents
February 2011 Special 9.1 cents 100% 9.1 cents
July 2011 Final 5.3 cents 100% 5.3 cents
December 2011 Interim 6.0 cents 100% 6.0 cents
July 2012 Final 7.0 cents 100% 7.0 cents
December 2012 Interim 3.0 cents 0% NA
July 2013 Final 2.1 cents 0% NA
December 2013 Interim 5.0 cents 0% NA
July 2014 Final 5.0 cents 0% NA
December 2014 Interim 8.5 cents 0% NA
SHAREHOLDER INFORMATION CONTINUED
This report has been printed on Pacesetter Laser Pro + and is FSC® Mix Certified, which ensures that all virgin pulp is derived from well-managed forests and controlled sources. It is manufactured by an ISO 14001 certified mill. sd
irect
.c om
.au
The CSR Annual Report and Sustainability Report are available to view online or download, visit ww w.csr.c om.au
ANNUAL GENERAL MEETINGAnnual General Meeting11:00amTuesday 14 July 2015Civic Pavilion, The Concourse,409 Victoria Avenue,Chatswood NSW 2067
CORPORATE REPORTSThe CSR Annual Report and Sustainability Report are available to view online or download, visit ww w.csr.c om.au
REGISTRY INFORMATIONAll inquiries and correspondence regarding shareholdings should be directed to CSR’s share registry:Computershare Investor Services Pty LimitedLevel 4, 60 Carrington StreetSydney NSW 2000 AustraliaGPO Box 2975, Melbourne VIC 3001 AustraliaTelephone 1800 676 061International +61 3 9415 4033Facsimile (03) 9473 2500International +61 3 9473 2500E-mail [email protected] om.auww w.computershare.c om/au
CSR LIMITEDABN 90 000 001 276Triniti 3, Level 5, 39 Delhi RoadNorth Ryde NSW 2113 AustraliaLocked Bag 1345, North Ryde BC 1670Telephone (02) 9235 8000International +61 2 9235 8000Facsimile (02) 8362 9013International +61 2 8362 9013E-mail [email protected] om.auww w.csr.c om.au

CS
R LIM
ITED AN
NU
AL REPO
RT 2015