cstdm09 - california statewide travel demand … · cstdm09 - california statewide travel demand...
TRANSCRIPT

CSTDM09 - California Statewide Travel Demand Model
Model Development
School Enrollment
Final System Documentation: Technical Note
ULTRANS Institute of Transportation Studies, UC Davis Davis, California
HBA Specto Incorporated Calgary, Alberta
May 2011

CSTDM09: School Enrollment System Documentation Technical Note 5/15/2011 CSTDM_SchoolEnrollment_ Final.pdf Page 2
Final
Table of Contents
1. Introduction ................................................................................................................ 5
2. Grade schools ............................................................................................................ 5
2.1 Tabular data ........................................................................................................... 5
2.1.1 CBEDS ............................................................................................................ 5
2.1.2 DataQuest ....................................................................................................... 6
2.2 GIS data ................................................................................................................. 7
2.3 Data processing ..................................................................................................... 8
3. Post-Secondary education ..................................................................................... 18
3.1.Tabular data ......................................................................................................... 18
3.1.1 Public institutions ........................................................................................... 18
3.1.2 Private institutions ......................................................................................... 21
3.2 Data processing ................................................................................................... 22
CSTDM09: School Enrollment System Documentation Technical Note 5/15/2011 CSTDM_SchoolEnrollment_ Final.pdf Page 3
Final
Tables:
Table 1: Data Sources ................................................................................................. 11
Table 2: Public Schools Database/GIS Data.............................................................. 12
Table 3. File Structure: School Enrollment by Grade ............................................... 17
Table 4. Enrollment Data Sources .............................................................................. 23
Table 5. GIS Data and Campus Location Sources .................................................... 24

CSTDM09: School Enrollment System Documentation Technical Note 5/15/2011 CSTDM_SchoolEnrollment_ Final.pdf Page 4
Final
Figures:
Figure 1: Joined School Enrollment Data ................................................................... 9
Figure 2: School Enrollment by TAZ .......................................................................... 10

CSTDM09: School Enrollment System Documentation Technical Note 5/15/2011 CSTDM_SchoolEnrollment_ Final.pdf Page 5
Final
1. Introduction
This document provides background information and a description of the school
enrollment data development for the California Statewide Travel Demand Model
(CSTDM09).
2. Grade schools
This technical note describes the assembly of grade school education inputs for
CSTDM09. The number of enrolled students at each school is associated with a
location within a TAZ and contributes to the modeling of origin and destination trips.
Enrollment is considered at the school end.
The number of students was identified or calculated for the base year 2000 and for the
target year of 2008. If 2008 data were unavailable we used the closest available year
data that were available. All public schools with attendance reported to the state for
2008 are included. School locations are obtained from the California Department of
education Public Schools Database (http://www.cde.ca.gov/ds/si/ds/pubschls.asp)
Enrollment figures that could not be identified for schools were given a value of 0.
Students were grouped into two categories: elementary school (K-8) and high school (9-
12).
2.1 Tabular data
2.1.1 CBEDS
Enrollment figures were collected through the California Basic Educational Data System
(CBEDS). The purpose of CBEDS is to collect information on student and staff
demographics. Data are collected annually. There are two separate forms used to
collect these data. The County/District Information Form is used to collect data specific
to district and county offices on the number of classified staff, estimated number of
teacher hires, and high school graduation requirements. The School Information Form is
used to collect data specific to schools on the number of classified staff, select
CSTDM09: School Enrollment System Documentation Technical Note 5/15/2011 CSTDM_SchoolEnrollment_ Final.pdf Page 6
Final
educational options, enrollment, technology, education calendars, parental exception
waivers, and bilingual paraprofessionals.1
Enrollment is the number of kindergarten through grade twelve public students enrolled
on "Information Day," a Wednesday in early October of the indicated school year.
(CBEDS-SIF)2
2.1.2 DataQuest
School enrollment data for the year 2000 and 2008 were obtained using the DataQuest
query tool from the CDE. DataQuest is a dynamic system that provides reports about
California’s schools and school districts. It contains a wide variety of information
including school performance indicators, student and staff demographics, expulsion,
suspension, and truancy information and a variety of test results. Data are presented so
that users can easily compare schools, districts and counties.3 To create the tables for
the years 2000 and 2008 using DataQuest, the level and subject must be selected from
a drop-down menu before submitting the query.
1. Select the Level. The available levels include:
State
County
District
School
Other Choices
SELPA
“Other Choices” was chosen to retrieve a record for each school with enrollment data for the state of California.
2. Select the Subject. The available subjects include 6 categories each with several subcategories:
1 http://www.cde.ca.gov/ds/sd/cb/materials.asp 2 http://www.cde.ca.gov/ds/sd/cb/glossary.asp#e 3 http://www.cde.ca.gov/ds/sd/cb/dataquest.asp

CSTDM09: School Enrollment System Documentation Technical Note 5/15/2011 CSTDM_SchoolEnrollment_ Final.pdf Page 7
Final
School Performance:
Test Scores:
Student Demographics:
School Staffing:
Student Misconduct & Intervention:
Subject Area/courses:
Technology
Create your own report
“Enrollment” under Student Demographics was selected.
3. Submit.
4. Select Criteria
a. Display Results for: Schools
b. District/School Type: All Districts
c. County: All California
d. Year of Data: 2000-01
5. Select Report: Enrollment by Grade
6. Submit
7. Download Data as a semicolon delimited file
The same process was repeated for the school year 2008-2009 and 2007-2008.
2.2 GIS data
Geographic locations of schools were compiled using data files containing the school
addresses. The data files were obtained from the California Department of Education
website (http://www.cde.ca.gov/ds/si/ds/pubschls.asp) in December, 20106 (see Table
6.1). From this table, schools were geocoded using school addresses and the ESRI
North American Geocoding Service Version 10.. If schools could not be geocoded they
were located using internet resources, mapping software or phone research. Removed
from this database were district offices, juvenile halls and closed schools. All GIS work
was performed by staff at ULTRNS in 2010. 10,548 schools were identified for this
dataset.
CSTDM09: School Enrollment System Documentation Technical Note 5/15/2011 CSTDM_SchoolEnrollment_ Final.pdf Page 8
Final
2.3 Data processing
Tabular data and GIS data were joined using the county/district/school (CDS) code as
the primary key. The CDS code is a 14-digit code that is used as the official
identification for a school within California. The first two digits identify the county, the
next five digits identify the school district, and the last seven digits identify the school.4
The GIS data already contained a field with the CDS code and was left unchanged. The
tabular data had a district code and a school code that were combined to create the
CDS code. The tabular data was also altered to create two new fields for each year: (1)
Total Enrollment K-8 and (2) Total Enrollment 9-12. For the K-8 field, the fields
representing enrollment for Kindergarten through eighth grade were summed and for
the 9-12 field, grades 9-12 were summed.
For 376 of the total 10,092 schools, no enrollment data were available for the 2008 to
2009 school year. Consequently, data from the 2007 to 2008 school year were used
instead. An additional field was created to identify where 2007 to 2008 data were used
instead of 2008 to 2009 data, “2007_8data” and a value of 1 was given to those records
using the older data.
Once spatial data contained the enrollment data for the base year and recent year, the
enrollment data could then be associated with the TAZ layer. A spatial join using ArcGIS
allows two spatial layers to be joined based on spatial location. A new spatial output
point layer is created which assigns the TAZ attributes to all school location points
which fall inside of the TAZ boundary.
4 http://www.cde.ca.gov/ds/si/ds/
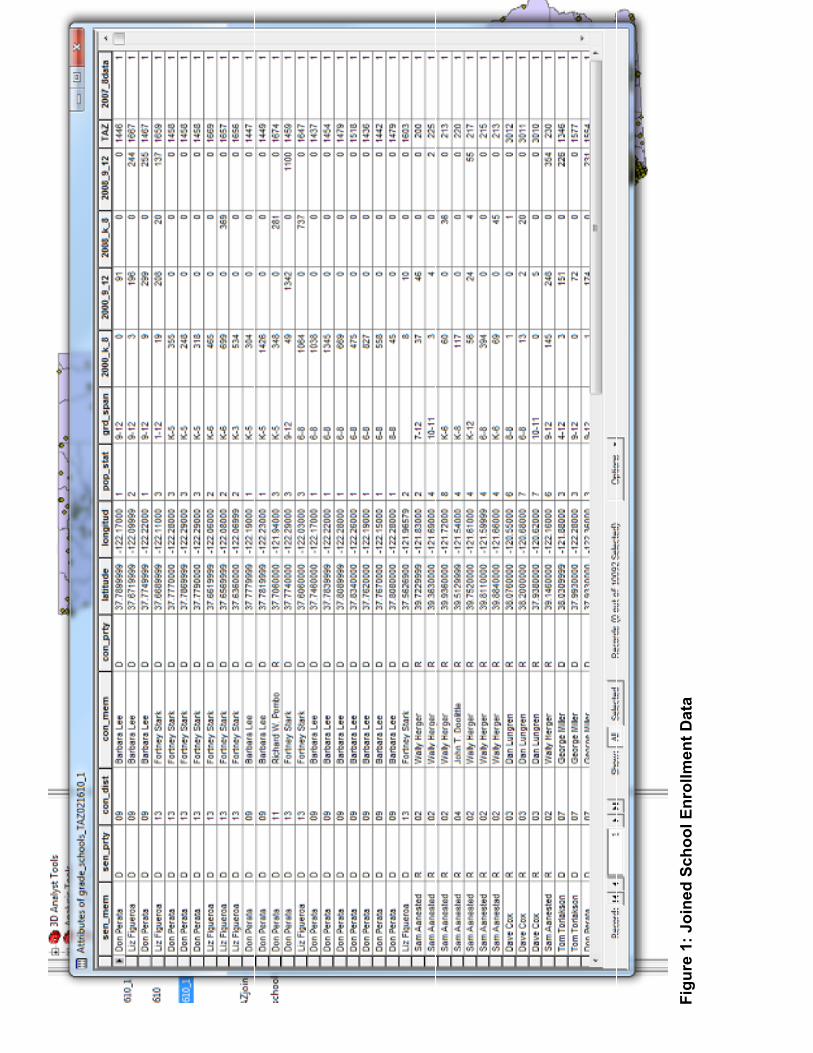
Figure 1: Joined School Enrollment Data
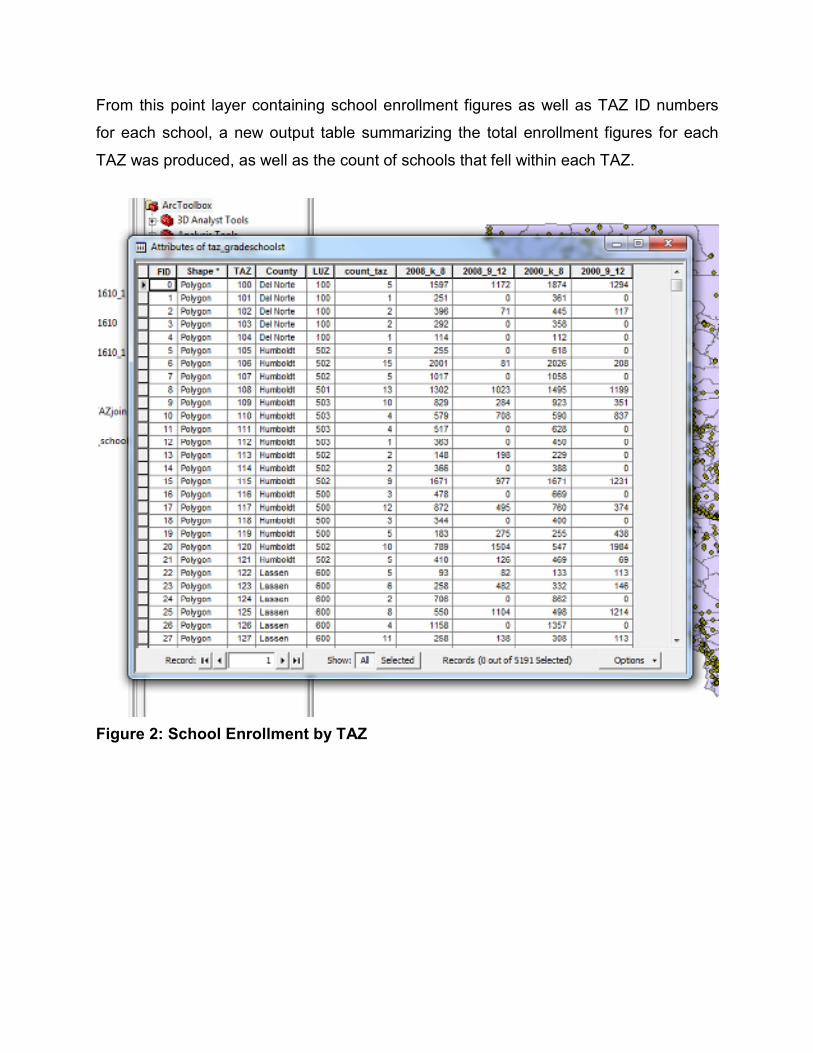
From this point layer containing school enrollment figures as well as TAZ ID numbers
for each school, a new output table summarizing the total enrollment figures for each
TAZ was produced, as well as the count of schools that fell within each TAZ.
Figure 2: School Enrollment by TAZ

Table 1: Data Sources
5 2007-2008 enrollment figures were only used if no data exist for 2008-2009 enrollment figures; in GIS layer, refer
to column schools.2007_08data for information on which dataset was used – 1 indicates 2007-2008 enrollment
figures were used in place of 2008-2009.
Data type Source Website Dataquest inputs Year
GIS, point layer
• CA Dept. of Education
• Address Locators (GDT)
• CBEDS (US Census)
• Caltrans
www.dot.ca.gov/hq/tsip/TSIPGSC/library/libdatalist.htm
2006
Table CA Dept. of Education
http://dq.cde.ca.gov/dataquest/
Level: Other choices Subject: Enrollment Display: all schools, enrollment by grade
2008-2009
Table5
CA Dept. of Education
http://dq.cde.ca.gov/dataquest/
Level: Other choices Subject: Enrollment Display: all schools, enrollment by grade
2007-2008
Table CA Dept. of Education
http://www.cde.ca.gov/ds/sd/cb/filese
nrsch.asp
2000-2001

CSTDM09: School Enrollment System Documentation Technical Note 5/15/2011 CSTDM_SchoolEnrollment_Final.pdf Page 12
Final
Table 2: Public Schools Database/GIS Data
Field Name Field
Type Width Description
CDS_CODE Character 14 This 14-digit code is the official, unique identification of a school within California. The
first two digits identify the county, the next five digits identify the school district, and the
last seven digits identify the school.
Please note that a CDS code ending in '0000000' indicates a district record not a school.
STAT_TYP Character 7 This field identifies the status of the school or district. Definitions of the valid status types
are listed below:
Open: The district or school is in operation and providing instructional services.
Closed: The district or school is not in operation and no longer providing
instructional services.
Merged: The district has combined with another district, and the schools within
the merged district have closed and re-opened in the newly formed district.
Pending: The district or school has not opened yet, but plans to open within
the next 9-12 months.
COUNTY Character 15 County name.
DISTRICT Character 50 District name.
SCHOOL Character 50 School name.
STR_ADDR Character 60 The street address (physical address) of this school. Note: Some schools (primarily
closed or retired schools) may not have data in this field.
STR_CITY Character 25 The city for the street address of this school. Note: Some schools (primarily closed or
retired schools) may not have data in this field.
STR_ZIP Character 10 The zip code for the street address of this school. Note: Some schools (primarily closed
or retired schools) may not have data in this field.
STR_ST Character 2 The state in which the school is located.
MAIL_ADR Character 60 The mailing address of this school (i.e., P.O. Box). Note: Many schools have not provided
a mailing address that is distinct from the street address. If you are using this file to
create mailing labels, we advise that you replace missing data in this field with data from
the STR_ADDR field. For your convenience we have filled the previously unpopulated
mail_adr cells with str_addr data.
MAIL_CTY Character 25 The city for the mailing address of this school. Note: Many schools have not provided the
city for the mailing address that is distinct from the city of the street address. If you are
using this file to create mailing labels, we advise that you replace missing data in this field
with data from the STR_CITY field. For your convenience we have filled the previously
unpopulated mail_city cells with str_city data.
MAIL_ZIP Character 10 The zip code for the mailing address of this school. Note: Many schools have not
provided the zip code for the mailing address that is distinct from the zip code of the
street address. For your convenience we have filled the previously unpopulated mail_zip

CSTDM09: School Enrollment System Documentation Technical Note 5/15/2011 CSTDM_SchoolEnrollment_Final.pdf Page 13
Final
cells with str_zip data.
MAIL_ST Character 2 The state within the mailing address.
DST_TYPE Character 20 The type of school district. A brief description of the different types of school districts are
listed below:
A unified school district includes both elementary and high school educational
levels.
An elementary school district usually includes kindergarten and grades one
through six or eight.
A high school district usually includes grade nine and above but may include
grade seven and above.
The word union in the name of an elementary school district indicates that it
was formed from two or more districts.
The word joint in a district's name indicates that it includes territory from more
than one county.
State special refers to California State Special Schools.
SCH_TYPE Character 20 The type of school. Types of public schools include:
Special Education School
County Community School
Youth Authority Facility
Opportunity School
Juvenile Court School
Other County-Wide Programs
Elementary School
Single Elementary School in District
Intermediate/Middle School
Alternative schools of choice
Junior High School
K-12 School
High School
Single High School in District
Continuation High School
Community Day School
State Special School
Adult Education Center.
START_DT Date 8 This field identifies the start date of schools. An empty cell indicates that the start date
precedes the date in which the California Department of Education began to maintain this
information. The Department began to maintain this information on July 1, 1980.
END_DT Date 8 This field identifies the end date of schools. An empty cell indicates that the school is not
closed.
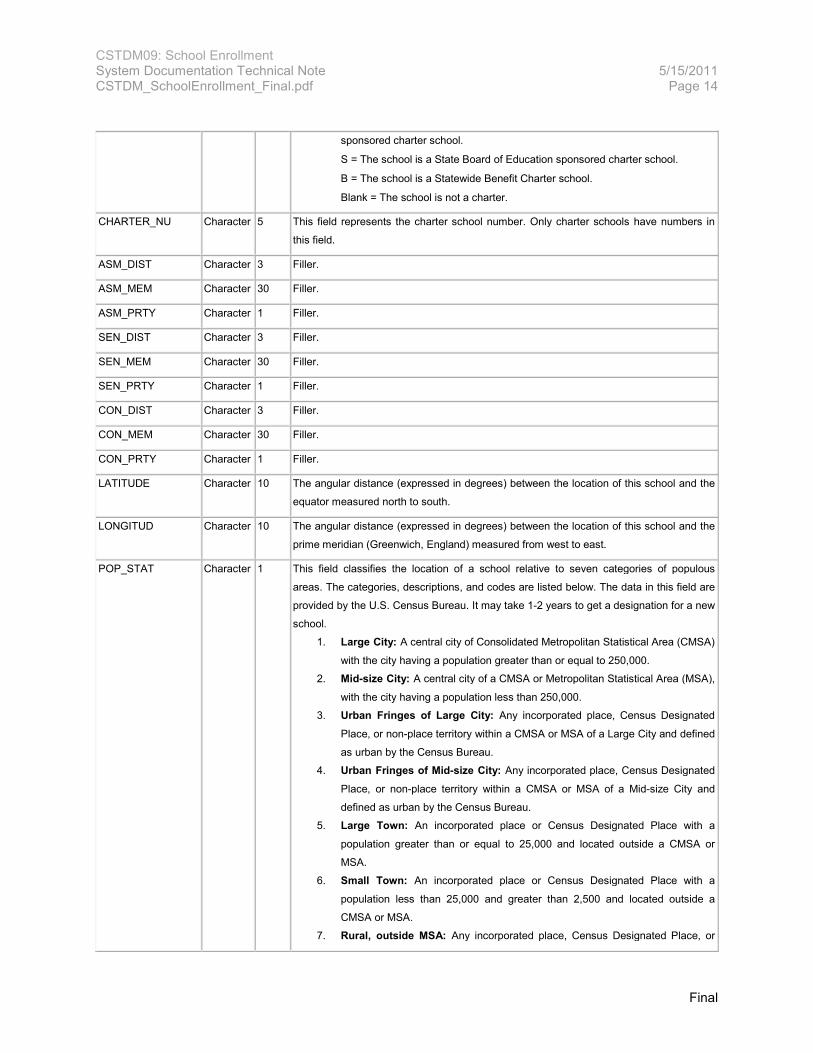
CHARTER Character 1 This field identifies charter schools. The field is coded as follows:
Y = The school is a charter school, but not a State Board of Education
CSTDM09: School Enrollment System Documentation Technical Note 5/15/2011 CSTDM_SchoolEnrollment_Final.pdf Page 14
Final
sponsored charter school.
S = The school is a State Board of Education sponsored charter school.
B = The school is a Statewide Benefit Charter school.
Blank = The school is not a charter.
CHARTER_NU Character 5 This field represents the charter school number. Only charter schools have numbers in
this field.
ASM_DIST Character 3 Filler.
ASM_MEM Character 30 Filler.
ASM_PRTY Character 1 Filler.
SEN_DIST Character 3 Filler.
SEN_MEM Character 30 Filler.
SEN_PRTY Character 1 Filler.
CON_DIST Character 3 Filler.
CON_MEM Character 30 Filler.
CON_PRTY Character 1 Filler.
LATITUDE Character 10 The angular distance (expressed in degrees) between the location of this school and the
equator measured north to south.
LONGITUD Character 10 The angular distance (expressed in degrees) between the location of this school and the
prime meridian (Greenwich, England) measured from west to east.
POP_STAT Character 1 This field classifies the location of a school relative to seven categories of populous
areas. The categories, descriptions, and codes are listed below. The data in this field are
provided by the U.S. Census Bureau. It may take 1-2 years to get a designation for a new
school.
1. Large City: A central city of Consolidated Metropolitan Statistical Area (CMSA)
with the city having a population greater than or equal to 250,000.
2. Mid-size City: A central city of a CMSA or Metropolitan Statistical Area (MSA),
with the city having a population less than 250,000.
3. Urban Fringes of Large City: Any incorporated place, Census Designated
Place, or non-place territory within a CMSA or MSA of a Large City and defined
as urban by the Census Bureau.
4. Urban Fringes of Mid-size City: Any incorporated place, Census Designated
Place, or non-place territory within a CMSA or MSA of a Mid-size City and
defined as urban by the Census Bureau.
5. Large Town: An incorporated place or Census Designated Place with a
population greater than or equal to 25,000 and located outside a CMSA or
MSA.
6. Small Town: An incorporated place or Census Designated Place with a
population less than 25,000 and greater than 2,500 and located outside a
CMSA or MSA.
7. Rural, outside MSA: Any incorporated place, Census Designated Place, or

CSTDM09: School Enrollment System Documentation Technical Note 5/15/2011 CSTDM_SchoolEnrollment_Final.pdf Page 15
Final
non-place territory designated as rural by the Census Bureau.
8. Rural, inside MSA: Any incorporated place, Census Designated Place, or non-
place territory within a CMSA or MSA of a Large or Mid-Size City and defined
as rural by the Census Bureau.
Blank (Data Not Available): New school not yet assigned a population status code by
the Census Bureau, or where there has been a change in the CDS Code, or a school not
reporting on the California Basic Educational Data System (CBEDS) collection.
CSIS_CON Character 25 The California School Information System (CSIS) Consortium to which the district
belongs. CSIS is a program to facilitate the transfer of information within the kindergarten
through grade twelve public school system. For more information about CSIS please visit
their Web site at http://www.csis.k12.ca.us/ (Outside Source). Each CSIS consortium is
composed of districts using the same student information system, so these groupings of
districts may not be regional. Populated cells represent schools that are participating in
any of the current CSIS data collections.
CSISAGNT Character 7 The 7-digit county-district code for the district or county office that serves as the fiscal
agent for the CSIS consortium to which this district belongs. Populated cells represent
schools that are participating in any of the current CSIS data collections.
CSIS_CBEDS Character 1 The status of how local educational agencies (LEAs) and/or charter schools submit their
fall California Basic Educational Data System (CBEDS) data.
0 = Not expected to submit CBEDS data for the fall submission cycle.
1 = School is not within a CSIS-participating LEA and therefore is expected to
submit CBEDS data ONLY through traditional means for the fall submission
cycle.
2 = Charter school within a CSIS parallel LEA that has elected not to
participate in CSIS and therefore is expected to submit CBEDS data ONLY
through traditional means for the fall submission cycle.
3 = Charter school within a CSIS state reporting LEA that has elected not to
participate in CSIS and therefore is expected to submit CBEDS data ONLY
through traditional means for the fall submission cycle.
4 = Expected to submit CBEDS data through traditional means AND through
CSIS for the fall submission cycle (i.e. the school is in a CSIS parallel LEA).
5 = Expected to submit CBEDS data ONLY through CSIS for the fall
submission cycle (i.e. the school is in a CSIS state reporting LEA).
CSIS_LCEN Character 1 The status of how LEAs and/or charter schools submit their spring Language Census
(R30-LC) data.
0 = Not expected to submit Language Census data for the spring submission
cycle.
1 = School is not within a CSIS-participating LEA and therefore is expected to
submit Language Census data ONLY through traditional means for the spring
submission cycle.
2 = Charter school within a CSIS parallel LEA that has elected not to
participate in CSIS and therefore is expected to submit Language Census data
ONLY through traditional means for the spring submission cycle.

CSTDM09: School Enrollment System Documentation Technical Note 5/15/2011 CSTDM_SchoolEnrollment_Final.pdf Page 16
Final
3 = Charter school within a CSIS state reporting LEA that has elected not to
participate in CSIS and therefore is expected to submit Language Census data
ONLY through traditional means for the spring submission cycle.
4 = Expected to submit Language Census data through traditional means AND
through CSIS for the spring submission cycle (i.e. the school is in a CSIS
parallel LEA).
5 = Expected to submit Language Census data ONLY through CSIS for the
spring submission cycle (i.e. the school is in a CSIS state reporting LEA).
GRD_SPAN Character 5 The lowest grade and the highest grade in which student enrollment was reported in the
most recent certified CBEDS data collection. This field may not represent the actual
range of grades that a school supports.
Note: Special programs at schools such as independent study, alternative education, and
special education will often expand the grade span beyond that which is typically
considered the grade span for schools of that type (i.e. high schools may have a grade
span of grade three through twelve).
LASTUPDT Date 8 This field identifies the last time that the school record was updated. This field was
created on June 24, 1999.
LONG_STR Character 50 The unabbreviated street (physical) address of this school. Note: Some schools (primarily
closed or retired schools) may not have data in this field.
LONG_MAI Character 50 The unabbreviated mailing address of this school (i.e., P.O. Box). Note: Many schools
have not provided a mailing address that is distinct from the street address. If you are
using this file to create mailing labels, we advise that you replace missing data in this field
with data from the street address field.

CSTDM09: School Enrollment System Documentation Technical Note 5/15/2011 CSTDM_SchoolEnrollment_Final.pdf Page 17
Final
Table 3: File Structure: School Enrollment by Grade
Field Name
Field Type
Width Description
Dist. Code
Character 7 County-District code.
Dist. Name
Character 50 District name.
Agency Character 50 School name.
Code Character 7 School code.
Kdgn. Numeric 4 Enrollment for kindergarten.
Grade 1 Numeric 4 Enrollment for grade one.
Grade 2 Numeric 4 Enrollment for grade two.
Grade 3 Numeric 4 Enrollment for grade three.
Grade 4 Numeric 4 Enrollment for grade four.
Grade 5 Numeric 4 Enrollment for grade five.
Grade 6 Numeric 4 Enrollment for grade six.
Grade 7 Numeric 4 Enrollment for grade seven.
Grade 8 Numeric 4 Enrollment for grade eight.
Ungr. Elem.
Numeric 4 Enrollment for ungraded elementary.
Grade 9 Numeric 4 Enrollment for grade nine.
Grade 10 Numeric 4 Enrollment for grade ten.
Grade 11 Numeric 4 Enrollment for grade eleven.
Grade 12 Numeric 4 Enrollment for grade twelve.
Ungr. Sec
Numeric 4 Enrollment for ungraded secondary.
Total Enr.
Numeric 4 Total enrollment.

CSTDM09: School Enrollment System Documentation Technical Note 5/15/2011 CSTDM_SchoolEnrollment_Final.pdf Page 18
Final
3. Post-Secondary Education
This part of the technical note describes the assembly of post-secondary education
inputs for the California Statewide Travel Model (CSTM09). The number of enrolled
students at each school is associated with a location within a TAZ and contributes to the
modeling of origin and destination trips.
The number of students was identified or calculated for the base year 2000 and for
2008, or the most recent year for which data were available. Two sources were used
and are listed below. Enrollment figures that could not be identified for schools were
given a value of 0.
Student enrollment can be aggregated and presented in several different ways.
Students can be classified as graduate, undergraduate, part-time and full-time. For the
purposes of this model, total full-time equivalent enrollment was sought. If full-time
equivalent enrollment totals were provided for a school, those figures were used. If not,
then full-time equivalent totals were calculated.
Two main data sources were used: California Post-secondary Education
Commission (CPEC) and the National Center for Education Statistics (NCES).
3.1 Tabular Data
3.1.1 Public Institutions
Enrollment data for public colleges and universities, including the University of California
system, the California State University system and the California Community College
system, were provided by the California Postsecondary Education Commission (CPEC).
The University of California, the California State University, and the California
Community Colleges system offices submit a record for each student enrolled and for
each degree or certificate completed. The Commission aggregates these data to
CSTDM09: School Enrollment System Documentation Technical Note 5/15/2011 CSTDM_SchoolEnrollment_Final.pdf Page 19
Final
generate the number of first-time freshmen, the number transferred, the enrollments by
level and discipline, and the degrees awarded. 6
University of California and California State University Systems
For the UC and CSU systems, full-time equivalent undergraduate and graduate
enrollment figures were provided for the year 2000 by CPEC, and the graduate and
undergraduate figures were summed to deliver the 2000 FTE total enrollment. The most
recent complete dataset for FTE enrollment at the time of data assembly was for the
year 2007, and similarly the graduate and undergraduate FTE enrollment figures were
summed for the 2007 FTE total enrollment.
At the California State University (CSU) and University of California (UC), a course load
with 15 or more semester units is considered Full-time for undergraduate. At CSU and
UC, a course load with 12 or more units is considered full-time for graduate students. At
CSU and UC, fewer than 15 semester credit units is considered Part-time for under-
graduate students, and a course load of fewer than 12 credit units is considered Part-
time for graduate students. The acronym FTE refers to the term "full-time-equivalent"
enrollment, a calculation used by the state to determine funding levels per student. The
California State University and the University of California use FTE, to describe units of
student workload measure for funding purposes for the systems. For the California
State University, the term FTE enrollment is defined to be 15 semester or quarter units.
Variations in the academic calendars of the campuses of the CSU are taken into
consideration in the definition of the annual FTES, which is equivalent to 30 semester or
45 quarter units. With these definitions, the number of individual students on campus is
difficult to determine, but the total volume of instructional activity is more accurately
reflected. For the University of California, one undergraduate FTE in the semester
system is student enrollment in 15 semester units for two semesters. One graduate FTE
in the semester system is student enrollment in 12 semester units for two semesters. In
the quarter system, the totals are 45 undergraduate credit units and 36 graduate credit
6 http://www.cpec.ca.gov/OnLineData/OnLineData.asp
CSTDM09: School Enrollment System Documentation Technical Note 5/15/2011 CSTDM_SchoolEnrollment_Final.pdf Page 20
Final
units per academic year, respectively. Though the terms FTE and FTES are often used
interchangeably, it is important to note that FTE enrollment and FTES are determined
through entirely different methodologies. 7
California Community College System
CPEC also provided enrollment data for community colleges, with no separation for
undergraduate or graduate level. Full-time equivalent student enrollment (FTES) figures
were also provided by CPEC. However, due to enrollment figures swaying widely from
year to year, 3-year averages were taken to represent the base year and recent year.
The average of 1999, 2000 and 2001 FTE enrollment figures were taken to represent
the year 2000, and the average of 2005, 2006 and 2007 FTE enrollment figures were
taken to represent the most recent year.
Full-time for Community College students is 12 or more units, and less than 12 credit
units is considered Part-time. The acronym FTES refers to the term "full-time-equivalent
student" enrollment, a calculation used by the state to determine funding levels per
student. For the California Community College, one FTES represents 525 class (contact)
hours of student instruction/activity in credit and noncredit courses. The number, 525, is
derived from the fact that 175 days of instruction are required each year and a student
attending three hours per day for 175 days will be in attendance for 525 hours.8
7 http://www.cpec.ca.gov/SecondPages/Glossary.asp?ListType=15 8 http://www.cpec.ca.gov/SecondPages/Glossary.asp?ListType=15

CSTDM09: School Enrollment System Documentation Technical Note 5/15/2011 CSTDM_SchoolEnrollment_Final.pdf Page 21
Final
3.1.2 Private Institutions
The National Center for Education Statistics provides enrollment data for non-public
institutions, using the latest data from the Integrated Postsecondary Education Data
System (IPEDS), the core postsecondary education data collection program for NCES.
At the time of data collection, data was sourced from IPEDS 2007-2008.
The Commission collects data from the Integrated Postsecondary Education Data
System (IPEDS) at the U.S. Department of Education. The information at IPEDS does
not include transfers from community colleges or first-time freshmen. These data are
gathered using a separate, voluntary reporting system.9
Data are provided by NCES as total undergraduate and graduate enrollment figures for
Fall 2008. The percentages of students that are part-time and full-time are also provided
for undergraduate and graduate students. Full-time equivalent enrollment was
estimated to be 100% of total full-time students plus 50% of total part-time students.
FTE = (FT) + .5 (PT)
FTE = Full-time Equivalent
FT = Full-time enrollment
PT = Part-time enrollment
If graduate and undergraduate enrollments were presented as a percentage of the total
enrollment, the number of graduate and undergraduate students was first calculated,
and then full-time equivalent enrollment was calculated.
FTE = ((UE)(%FT) + .5(UE)(%PT)) + ((GE)(%FT) + .5(GE)(%PT))
FTE = Full-time Equivalent
FT = Full-time enrollment
9 http://www.cpec.ca.gov/OnLineData/OnLineData.asp

CSTDM09: School Enrollment System Documentation Technical Note 5/15/2011 CSTDM_SchoolEnrollment_Final.pdf Page 22
Final
PT = Part-time enrollment
UE = Undergraduate enrollment
GE = Graduate enrollment
To calculate the same figures for the year 2000, the following equation was applied:
FTE2000 = FTE2008 – (FTE2008*.16)
FTE2000 = Full-time Equivalent enrollment for 2000
FTE2008 = Full-time Equivalent enrollment for 2008
This assumes that enrollment has increased by 16% between the years 2000 and 2008,
a percentage estimated from data obtained for public colleges and universities for the
same time period.
3.2 Data Processing
The GIS point layer representing the locations of college and university campuses in
California was created using the addresses of the campuses and geocoding them using
the GDT street database and ArcGIS geoprocessing tools. Addresses were visually
verified using Google Earth, and campuses with incorrect addresses were corrected by
replacing the X,Y coordinates with those attained through the satellite imagery on
Google Earth.
Enrollment data for the base year and recent year were entered manually using the
school name as the common key. Many schools have multiple campus locations that
did not have detailed enrollment figures but instead had one general enrollment figure
representing all campuses. In those instances, the total enrollment figure was applied to
the main campus location with all other campuses receiving an enrollment figure of zero.
Similarly, campus locations where no enrollment figure could be ascertained were also
given a value of zero.

Table 4: Enrollment Data Sources
School System
Source website Aggrega-tion
2000 enrollment data
Recent enrollment data
Table name
Univer-sity of Cali-fornia
California Postse-condary Educa-tion
Commis-sion
http://www.cpec.ca.gov
FTE for 1998-2007
2000 Sum of graduate and undergraduate
2007, grad/undergrad sum
Enrollment_Full_Time_Equivalent.csv
CSU
California Postse-condary Educa-tion
Commis-sion
http://www.cpec.ca.gov
FTE for 1998-2007
2000 Sum of graduate and undergraduate
2007, grad/undergrad sum
Enrollment_Full_Time_Equivalent.csv
Com-munity Colleges
California Postse-condary Educa-tion
Commis-sion
http://www.cpec.ca.gov
FTE for 1998-2007
Average of 1999, 2000 and 2001 figures
Average of 2005,
2006 and 2007 figures
Enrollment_Full_Time_Equivalent.xls
x, sheet1
Non-public, WASC-accre-dited insti-tutions
National Center for
Educa-tion
Statistics
http://nces.ed.gov/collegenavigator
Total Enrollment for Fall 2008
FTE = ((UE * %FT) + .5(UE * %PT)) + ((GE * %FT) + .5 (GE * %PT))
FTE = FTE2008 – (16%* FTE2008)
CA colleges and universities_JB_020110, “non-public”
sheet
State-ap-
proved and
exempt insti-tutions
National Center for
Educa-tion
Statistics
http://nces.ed.gov/collegenavigator
Total Enrollment for Fall 2008
FTE = ((UE * %FT) + .5(UE * %PT)) + ((GE * %FT) + .5 (GE * %PT))
FTE = FTE2008 – (16%* FTE2008)
CA colleges and universities_JB_02
0110, “state_approv”
sheet
CSTDM09: School Enrollment System Documentation Technical Note 5/15/2011
CSTDM_SchoolEnrollment_Final.pdf Page 24
Final
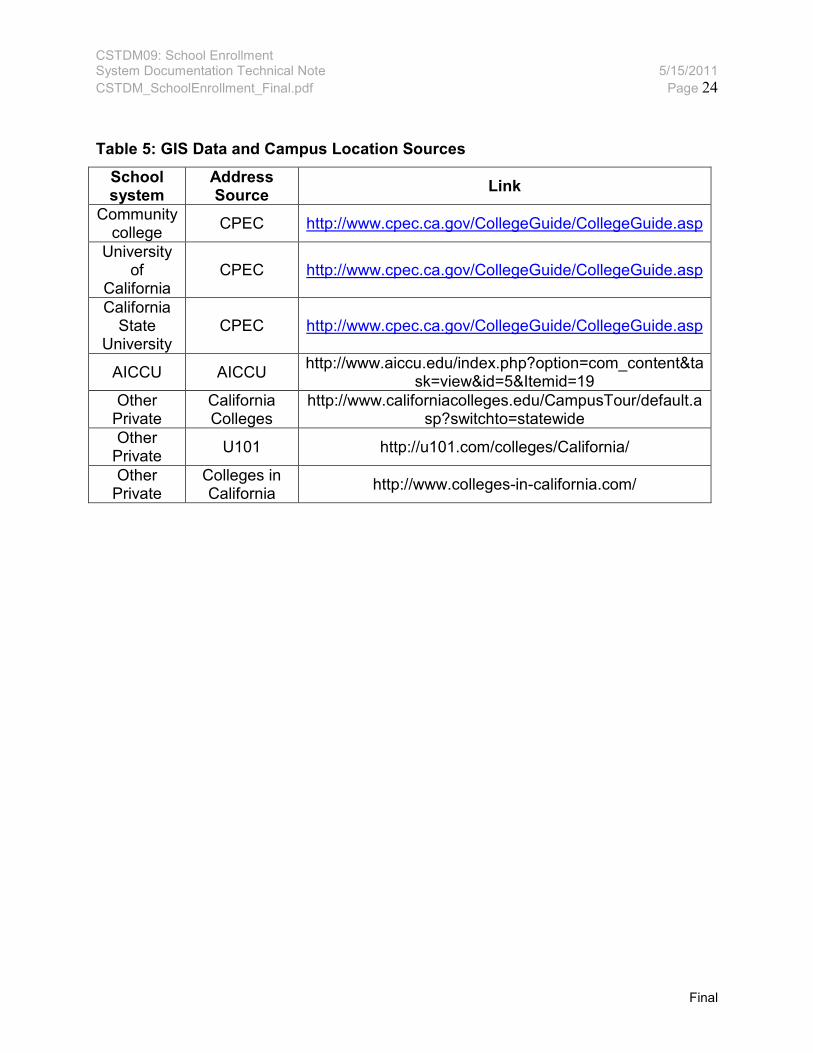
Table 5: GIS Data and Campus Location Sources
School system
Address Source
Link
Community college
CPEC http://www.cpec.ca.gov/CollegeGuide/CollegeGuide.asp
University of
California CPEC http://www.cpec.ca.gov/CollegeGuide/CollegeGuide.asp
California State
University CPEC http://www.cpec.ca.gov/CollegeGuide/CollegeGuide.asp
AICCU AICCU http://www.aiccu.edu/index.php?option=com_content&ta
sk=view&id=5&Itemid=19
Other Private
California Colleges
http://www.californiacolleges.edu/CampusTour/default.asp?switchto=statewide
Other Private
U101 http://u101.com/colleges/California/
Other Private
Colleges in California
http://www.colleges-in-california.com/