csu annual library statistics 2009-2010 - california … annual library statistics 2009-2010 2009 -...
TRANSCRIPT

CSU Annual Library Statistics 2009-2010
2009 - 2010 California State University Office of the Chancellor Page 1
Branch and independent libraries - exclude main library
Number of tenants in library (do not count in 1; branch & independent libraries)
Number of study rooms in library (do not count in 1; branch & independent libraries)
Number of meeting rooms in library (do not count in 1; branch & independent libraries)
Number of classrooms and/or computer labs in library (do not count in 1;
Librarians and other professional staff (sum of 2a-2d)
Librarians (FTE)
MPP (FTE) - Librarians
MPP (FTE) - NON-Librarians
Other professional staff
State University (1) (1a) (1b) (1c) (1d) (2) (2a) (2b) (2c) 3Bakersfield 1 4 39 2 2 10.82 7.82 0.00 3.00 0.00Channel Islands 0 6 22 4 15 9.00 8.00 1.00 0.00 0.00Chico 0 9 9 2 5 12.00 10.00 1.00 1.00 0.00Dominguez Hills 0 0 11 6 6 11.50 8.50 0.00 3.00 0.00East Bay 1 4 12 2 5 14.13 13.13 1.00 0.00 0.00Fresno 0 4 44 6 7 23.00 18.00 2.00 2.00 1.00Fullerton 1 7 28 1 6 24.23 20.23 4.00 0.00 0.00Humboldt 0 10 9 1 4 11.00 9.00 1.00 1.00 0.00Long Beach 1 5 0 3 4 24.28 15.95 4.33 4.00 0.00Los Angeles 0 21 39 2 2 17.90 14.90 2.00 1.00 0.00Maritime Academy 1 0 1 1 1 4.00 3.00 1.00 0.00 0.00Monterey Bay 0 5 12 5 7 7.84 6.84 1.00 0.00 0.00Northridge 0 0 0 0 1 32.00 28.00 2.00 2.00 0.00Pomona 0 3 37 2 6 12.50 11.50 0.00 1.00 0.00Sacramento 0 7 79 4 14 26.51 24.51 2.00 0.00 0.00San Bernardino 0 3 11 7 0 14.00 13.00 1.00 0.00 0.00San Diego 1 7 42 9 8 31.09 27.34 2.00 1.75 0.00San Francisco 0 N/A 2 N/A 1 24.70 23.70 1.00 0.00 0.00San Jose 0 6 36 8 4 33.18 25.77 3.00 4.41 0.00San Luis Obispo 0 8 18 2 13 14.50 9.50 3.00 2.00 0.00San Marcos 0 8 35 6 11 14.10 12.10 2.00 0.00 0.00Sonoma 1 6 12 5 3 12.50 8.50 2.00 2.00 0.00Stanislaus 1 0 8 0 3 9.50 8.50 0.50 0.50 16.00
CSU Elec. Core Coll N/A N/A N/A N/A N/A N/A N/A N/A N/A N/ATotal 8 123 506 78 128 394 328 37 29 17
N/A = Not AvailableUNK = Unknowndash (-) = 0 data
Part A - NUMBER OF PUBLIC SERVICE OUTLETS, FISCAL YEAR
CSU Annual Library Statistics 2009-2010
2009 - 2010 California State University Office of the Chancellor Page 2
State UniversityBakersfieldChannel IslandsChicoDominguez HillsEast BayFresnoFullertonHumboldtLong BeachLos AngelesMaritime AcademyMonterey BayNorthridgePomonaSacramentoSan BernardinoSan DiegoSan FranciscoSan JoseSan Luis ObispoSan MarcosSonomaStanislaus
CSU Elec. Core Coll
TotalN/A = Not AvailableUNK = Unknowndash (-) = 0 data
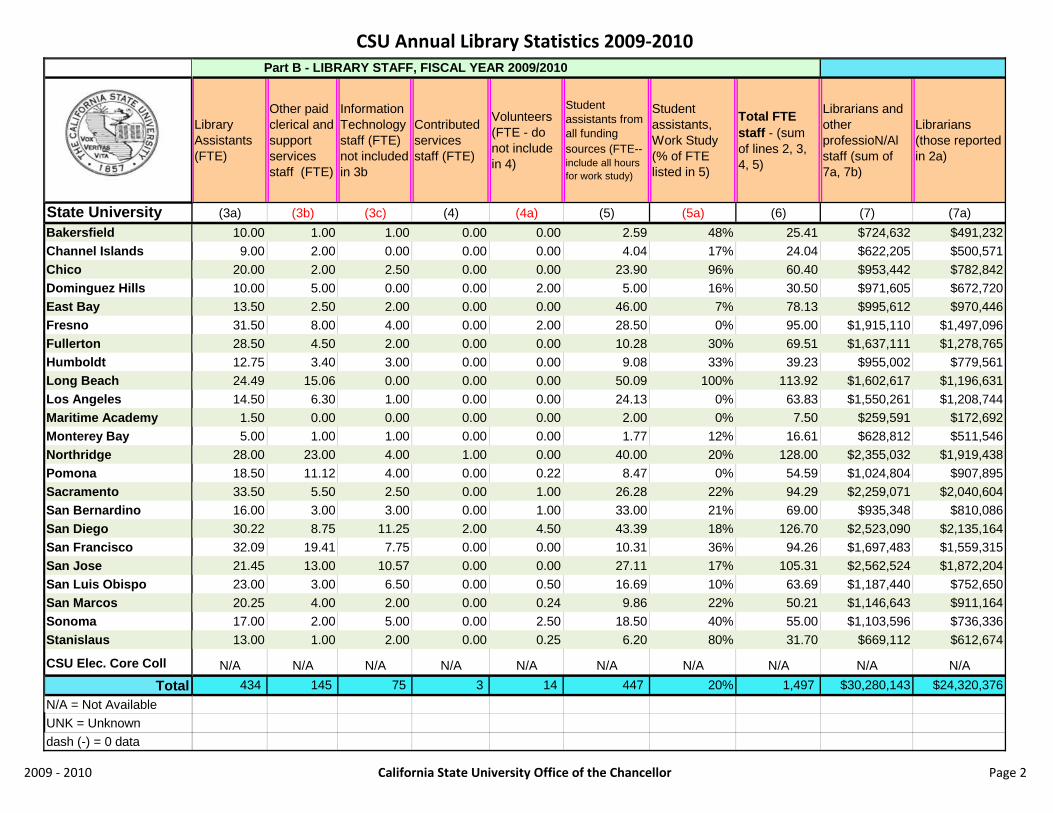
Library Assistants (FTE)
Other paid clerical and support services staff (FTE)
Information Technology staff (FTE) not included in 3b
Contributed services staff (FTE)
Volunteers (FTE - do not include in 4)
Student assistants from all funding sources (FTE-- include all hours for work study)
Student assistants, Work Study (% of FTE listed in 5)
Total FTE staff - (sum of lines 2, 3, 4, 5)
Librarians and other professioN/Al staff (sum of 7a, 7b)
Librarians (those reported in 2a)
(3a) (3b) (3c) (4) (4a) (5) (5a) (6) (7) (7a)10.00 1.00 1.00 0.00 0.00 2.59 48% 25.41 $724,632 $491,2329.00 2.00 0.00 0.00 0.00 4.04 17% 24.04 $622,205 $500,571
20.00 2.00 2.50 0.00 0.00 23.90 96% 60.40 $953,442 $782,84210.00 5.00 0.00 0.00 2.00 5.00 16% 30.50 $971,605 $672,72013.50 2.50 2.00 0.00 0.00 46.00 7% 78.13 $995,612 $970,44631.50 8.00 4.00 0.00 2.00 28.50 0% 95.00 $1,915,110 $1,497,09628.50 4.50 2.00 0.00 0.00 10.28 30% 69.51 $1,637,111 $1,278,76512.75 3.40 3.00 0.00 0.00 9.08 33% 39.23 $955,002 $779,56124.49 15.06 0.00 0.00 0.00 50.09 100% 113.92 $1,602,617 $1,196,63114.50 6.30 1.00 0.00 0.00 24.13 0% 63.83 $1,550,261 $1,208,7441.50 0.00 0.00 0.00 0.00 2.00 0% 7.50 $259,591 $172,6925.00 1.00 1.00 0.00 0.00 1.77 12% 16.61 $628,812 $511,546
28.00 23.00 4.00 1.00 0.00 40.00 20% 128.00 $2,355,032 $1,919,43818.50 11.12 4.00 0.00 0.22 8.47 0% 54.59 $1,024,804 $907,89533.50 5.50 2.50 0.00 1.00 26.28 22% 94.29 $2,259,071 $2,040,60416.00 3.00 3.00 0.00 1.00 33.00 21% 69.00 $935,348 $810,08630.22 8.75 11.25 2.00 4.50 43.39 18% 126.70 $2,523,090 $2,135,16432.09 19.41 7.75 0.00 0.00 10.31 36% 94.26 $1,697,483 $1,559,31521.45 13.00 10.57 0.00 0.00 27.11 17% 105.31 $2,562,524 $1,872,20423.00 3.00 6.50 0.00 0.50 16.69 10% 63.69 $1,187,440 $752,65020.25 4.00 2.00 0.00 0.24 9.86 22% 50.21 $1,146,643 $911,16417.00 2.00 5.00 0.00 2.50 18.50 40% 55.00 $1,103,596 $736,33613.00 1.00 2.00 0.00 0.25 6.20 80% 31.70 $669,112 $612,674
N/A N/A N/A N/A N/A N/A N/A N/A N/A N/A434 145 75 3 14 447 20% 1,497 $30,280,143 $24,320,376
Part B - LIBRARY STAFF, FISCAL YEAR 2009/2010

CSU Annual Library Statistics 2009-2010
2009 - 2010 California State University Office of the Chancellor Page 3
State UniversityBakersfieldChannel IslandsChicoDominguez HillsEast BayFresnoFullertonHumboldtLong BeachLos AngelesMaritime AcademyMonterey BayNorthridgePomonaSacramentoSan BernardinoSan DiegoSan FranciscoSan JoseSan Luis ObispoSan MarcosSonomaStanislaus
CSU Elec. Core Coll
TotalN/A = Not AvailableUNK = Unknowndash (-) = 0 data
MPP (those reported in 2b, 2c)
Other professional staff (those reported in 2d)
All other paid staff (except student assistants) (sum of 8a-8c)
Library Assistants (those reported in 3a)
Other paid clerical and support services staff (those reported in 3b)
Information Technology staff (those reported in 3c)
Total salaries and wages (except stdt. asst.) (sum of 7, 8)
Student assistants-all funding sources (from L 5, include $ paid by Work Study Program)
Total Salaries and Wages (sum of Lines 7, 8, 9)
(7b) (7c) (8) (8a) (8b) (8c) (9) (10)$233,400 $0 $512,149 $400,634 $41,630 $69,885 $1,236,781 $43,162 $1,279,943$121,634 $0 $420,328 $331,798 $88,530 $0 $1,042,533 $73,421 $1,115,954$170,600 $0 $1,056,044 $848,054 $76,549 $131,441 $2,009,486 $295,511 $2,304,997$298,885 $0 $639,988 $424,186 $215,202 $0 $1,611,593 $81,313 $1,692,906$25,166 $0 $779,984 $561,003 $105,113 $113,868 $1,775,596 $209,899 $1,985,495
$342,574 $75,440 $1,830,928 $1,222,802 $387,346 $220,780 $3,746,038 $519,576 $4,265,614$358,346 $0 $1,410,148 $1,126,479 $177,806 $105,863 $3,047,259 $194,865 $3,242,124$175,441 $0 $799,813 $515,906 $132,575 $151,332 $1,754,815 $105,674 $1,860,489$405,986 $0 $1,462,127 $882,074 $580,053 $0 $3,064,744 $359,356 $3,424,100$341,517 $0 $890,654 $562,349 $250,305 $78,000 $2,440,915 $209,195 $2,650,110$86,899 $0 $50,496 $50,496 $0 $0 $310,087 $21,754 $331,841
$117,266 $0 $297,963 $205,737 $43,330 $48,896 $926,775 $24,380 $951,155$435,594 $0 $2,056,644 $1,172,056 $684,486 $200,102 $4,411,676 $764,898 $5,176,574$116,909 $0 $1,440,598 $741,748 $499,542 $199,308 $2,465,402 $188,860 $2,654,262$218,467 $0 $1,769,464 $1,370,641 $248,041 $150,782 $4,028,535 $506,234 $4,534,769$125,261 $0 $928,936 $658,127 $117,361 $153,448 $1,864,284 $172,991 $2,037,275$387,926 $0 $2,279,957 $1,251,544 $374,166 $654,247 $4,803,047 $710,948 $5,513,995$138,169 $0 $2,295,940 $1,121,097 $785,421 $389,422 $3,993,424 $455,058 $4,448,482$690,320 $0 $2,350,375 $992,487 $714,400 $643,488 $4,912,899 $573,258 $5,486,157$434,790 $0 $1,581,765 $1,031,468 $136,363 $413,934 $2,769,205 $323,755 $3,092,960$235,479 $0 $996,114 $747,887 $149,260 $98,967 $2,142,757 $215,041 $2,357,798$367,260 $0 $1,041,829 $668,998 $77,823 $295,008 $2,145,425 $159,459 $2,304,884$56,438 $0 $672,297 $516,531 $41,454 $114,312 $1,341,409 $102,947 $1,444,356
N/A N/A N/A N/A N/A N/A $0 N/A $0$5,884,328 $75,440 $27,564,541 $17,404,102 $5,926,756 $4,233,083 $57,844,684 $6,311,555 $64,156,239

CSU Annual Library Statistics 2009-2010
2009 - 2010 California State University Office of the Chancellor Page 4
State UniversityBakersfieldChannel IslandsChicoDominguez HillsEast BayFresnoFullertonHumboldtLong BeachLos AngelesMaritime AcademyMonterey BayNorthridgePomonaSacramentoSan BernardinoSan DiegoSan FranciscoSan JoseSan Luis ObispoSan MarcosSonomaStanislaus
CSU Elec. Core Coll
TotalN/A = Not AvailableUNK = Unknowndash (-) = 0 data
One-time purchases of books, serial backfiles, and other materials (sum of 11a-11c)
Books - Print
Books - Electronic (e-books - Record Access fees in 11d)
Serial backfiles - Print and electronic (one-time purchases)
Ongoing commitments to serial subscriptions (e.g. subscriptions, annual license fees) (sum of 12a-12e, not including 12b(1))
Current serials - Print
Current serials - Databases, E-serials, Search Services
Current serials - Electronic
(11) (11a) (11b) (11c) (12) (12a) (12b) (12b(1))$69,231 $69,231 $0 $0 $247,690 $36,247 $207,824 $51,983$71,779 $71,779 $0 $0 $204,449 $3,070 $201,379 $0
$288,279 $190,646 $0 $97,633 $840,541 $212,848 $602,404 $597,328$22,329 $22,329 $0 $0 $462,036 $209,575 $252,461 $252,461$78,967 $78,967 N/A N/A $713,108 $368,230 $321,423 $169,008
$352,992 $303,138 $49,854 N/A $1,579,306 $385,986 $1,175,659 $744,763$358,537 $243,505 $17,649 $97,383 $1,626,053 $462,217 $1,134,239 $758,263$92,668 $92,668 N/A N/A $643,307 $218,059 $405,261 n/a
$264,677 $229,372 $33,464 $1,841 $1,828,512 $750,523 $1,075,196 $229,820$102,882 $102,882 $0 $0 $860,082 $110,099 $749,982 $0$37,893 $37,893 $0 $0 $70,367 $49,694 $20,673 $0$81,278 $80,181 $1,097 $0 $152,925 $49,304 $101,936 $40,713
$490,110 $97,394 $147,661 $245,055 $1,504,735 $367,937 $1,104,387 $277,918$150,475 $119,584 $18,310 $12,581 $1,043,311 $226,972 $815,784 $309,097$495,922 $473,081 $22,841 $0 $1,622,459 $350,087 $1,156,552 $378,231$181,341 $78,192 $6,892 $96,257 $603,507 $251,914 $328,832 $35,694$575,828 $427,770 $3,743 $144,315 $1,865,382 $256,751 $1,577,587 $209,183$357,293 $258,768 $98,525 $0 $2,056,208 $577,706 $1,177,406 $1,059,106$507,906 $368,933 $138,165 $808 $1,808,893 $149,180 $1,617,462 $153,868$208,976 $201,809 $7,055 $112 $1,336,963 $295,024 $1,023,582 $237,350$182,396 $120,879 $17,065 $44,452 $550,459 $207,147 $336,367 $13,480$146,739 $76,200 $539 $70,000 $506,427 $30,678 $439,016 $439,016$43,636 $43,636 $0 $0 $660,107 $214,696 $434,672 $85,976
$0 N/A N/A N/A $4,910,000 N/A $4,150,809 $529,798 $5,162,133 $3,788,837 $562,860 $810,437 $27,103,106 $5,783,944 $20,410,894 $6,573,056

CSU Annual Library Statistics 2009-2010
2009 - 2010 California State University Office of the Chancellor Page 5
State UniversityBakersfieldChannel IslandsChicoDominguez HillsEast BayFresnoFullertonHumboldtLong BeachLos AngelesMaritime AcademyMonterey BayNorthridgePomonaSacramentoSan BernardinoSan DiegoSan FranciscoSan JoseSan Luis ObispoSan MarcosSonomaStanislaus
CSU Elec. Core Coll
TotalN/A = Not AvailableUNK = Unknowndash (-) = 0 data
Current serials - Microform
Access Fees for Serials/DBs/Aggregators/e-Books
Access Fees to Multimedia Services (i.e. streaming video, audio, etc.)
Audiovisual Materials (sum of 13a-13b)
Sound Materials
Films/ Videos/ DVDs
Other expenditures for information resources (sum of 14a-14e)
Cartographic materials
Graphic Materials Manuscripts
(12c) (12d) (12e) (13) (13a) (13b) (14) (14a) (14b) (14c)$154 $3,465 $0 $349 $0 $349 $0 $0 $0 $0
$0 $0 $0 $9,944 $0 $9,944 $0 $0 $0 $0$23,372 $1,917 $0 $6,214 $286 $5,928 $789 $473 $0 $0
$0 $0 $0 $0 $0 $0 $0 $0 $0 $0$5,794 $17,661 $0 $6,296 $0 $6,296 $0 $0 $0 $0
$17,661 $0 $0 $38,115 $14,149 $23,966 $1,808 $1,808 $0 $0$1,367 $28,230 $0 $5,607 $126 $5,481 $227 $227 $0 $0
$19,987 $0 $0 $18,696 $1,025 $17,671 $265 $265 $0 $0$1,243 $0 $1,550 $55,899 $34,172 $21,727 $0 $0 $0 $0
$0 $0 $0 $0 $0 $0 $0 $0 $0 $0$0 $0 $0 $1,859 $0 $1,859 $200 $200 $0 $0$0 $1,685 $0 $5,156 $0 $5,156 $0 $0 $0 $0
$26,934 $4,977 $500 $34,773 $9,145 $25,628 $0 $0 $0 $0$328 $227 $0 $7,858 $358 $7,500 $486 $486 $0 $0
$67,877 $47,943 $0 $36,349 $435 $35,914 $3,433 $0 $3,263 $0$20,896 $870 $995 $7,744 $2,398 $5,346 $0 $0 $0 $0$23,712 $7,332 $0 $30,397 $136 $30,261 $0 $0 $0 $0
$118,300 $174,778 $8,018 $690 $690 $0 $741 $0 $0 $741$11,342 $28,739 $2,170 $16,710 $329 $16,381 $0 $0 $0 $0$2,673 $14,330 $1,354 $6,856 $0 $6,856 $1,878 $0 $0 $0$6,325 $620 $0 $9,519 $0 $9,519 $0 $0 $0 $0$6,675 $29,884 $175 $15,840 $128 $15,712 $3,759 $0 $0 $0$7,992 $691 $2,056 $18,158 $21 $18,137 $0 $0 $0 $0
N/A $165,470 N/A $0 N/A N/A $0 N/A N/A N/A$362,632 $528,819 $16,818 $333,028 $63,398 $269,631 $13,586 $3,459 $3,263 $741
Part C - LIBRARY OPERATING EXPENDITURES, FISCAL YEAR 2009/2010

CSU Annual Library Statistics 2009-2010
2009 - 2010 California State University Office of the Chancellor Page 6
State UniversityBakersfieldChannel IslandsChicoDominguez HillsEast BayFresnoFullertonHumboldtLong BeachLos AngelesMaritime AcademyMonterey BayNorthridgePomonaSacramentoSan BernardinoSan DiegoSan FranciscoSan JoseSan Luis ObispoSan MarcosSonomaStanislaus
CSU Elec. Core Coll
TotalN/A = Not AvailableUNK = Unknowndash (-) = 0 data
Non-serial microforms
Other library materials
Total Information Resources (sum of Lines 11,12,13,14)
Document delivery/interlibrary loan (sum of 16a-16e)
Consortial Resource Sharing Agreements (including Link+, Circuit, Amigos, etc…)
Shipping & Labels (including Link+ labels Tricor for non-CSU deliveries, USPS Mail, UPS, etc...)
Charges incurred - Borrowing (invoices from lenders)
Charges accrued - Lending (Invoices sent to borrowing libraries)
Copyright & Royalty Fees
(14d) (14e) (15) (16) (16A) (16B) (16C) (16D) (16E)$0 $0 $317,270 $8,110 $0 $4,426 $137 $100 $3,447$0 $0 $286,172 $14,342 $6,371 $4,422 $3,192 $0 $357$0 $316 $1,135,823 $15,585 $6,096 $7,824 $364 $99 $1,202$0 $0 $484,365 $1,186 $0 $941 $0 $245 $0$0 $0 $798,371 $39,539 $24,400 $8,641 UNK UNK $6,498$0 $0 $1,972,221 $28,779 $24,000 $0 $4,779 $0 $0$0 $0 $1,990,424 $182,158 $110,137 $36,062 $30,886 $231 $4,842$0 $0 $754,936 $11,017 $0 $8,532 $494 $323 $1,669$0 $0 $2,149,088 $61,908 $24,400 $19,589 $480 $820 $16,619$0 $0 $962,963 $37,637 $0 $19,800 $337 $2,500 $15,000$0 $0 $110,319 $0 $0 $0 $0 $0 $0$0 $0 $239,359 $13,149 $2,345 $1,955 $5,987 $2,273 $589$0 $0 $2,029,618 $14,538 $0 $11,218 $2,912 $408 $0$0 $0 $1,202,130 $96,503 $24,400 $19,709 $34,171 $14,333 $3,890$0 $170 $2,158,163 $8,618 $0 NA $931 $295 $7,392$0 $0 $792,592 $5,758 $3,000 $40 $160 $0 $2,558$0 $0 $2,471,608 $223,125 $38,669 $54,655 $98,953 $0 $30,848$0 $0 $2,414,932 $84,771 $31,086 $27,720 $1,110 $955 $23,900$0 $0 $2,333,509 $80,205 $21,280 $22,925 $1,329 $0 $34,671
$1,878 $0 $1,554,673 $53,402 $24,400 $22,797 $1,031 $470 $4,704$0 $0 $742,374 $39,799 $13,080 $12,586 $583 $4,553 $8,997$0 $3,759 $672,764 $28,400 $24,400 $4,000 $0 $0 $0$0 $0 $721,901 $18,732 $18,563 NA $169 $0 $0
N/A N/A $4,910,000 $175,000 N/A $175,000 N/A N/A N/A$1,878 $4,245 $32,611,854 $1,242,261 $396,627 $462,842 $188,004 $27,605 $167,184
CSU Annual Library Statistics 2009-2010
2009 - 2010 California State University Office of the Chancellor Page 7
State UniversityBakersfieldChannel IslandsChicoDominguez HillsEast BayFresnoFullertonHumboldtLong BeachLos AngelesMaritime AcademyMonterey BayNorthridgePomonaSacramentoSan BernardinoSan DiegoSan FranciscoSan JoseSan Luis ObispoSan MarcosSonomaStanislaus
CSU Elec. Core Coll
TotalN/A = Not AvailableUNK = Unknowndash (-) = 0 data
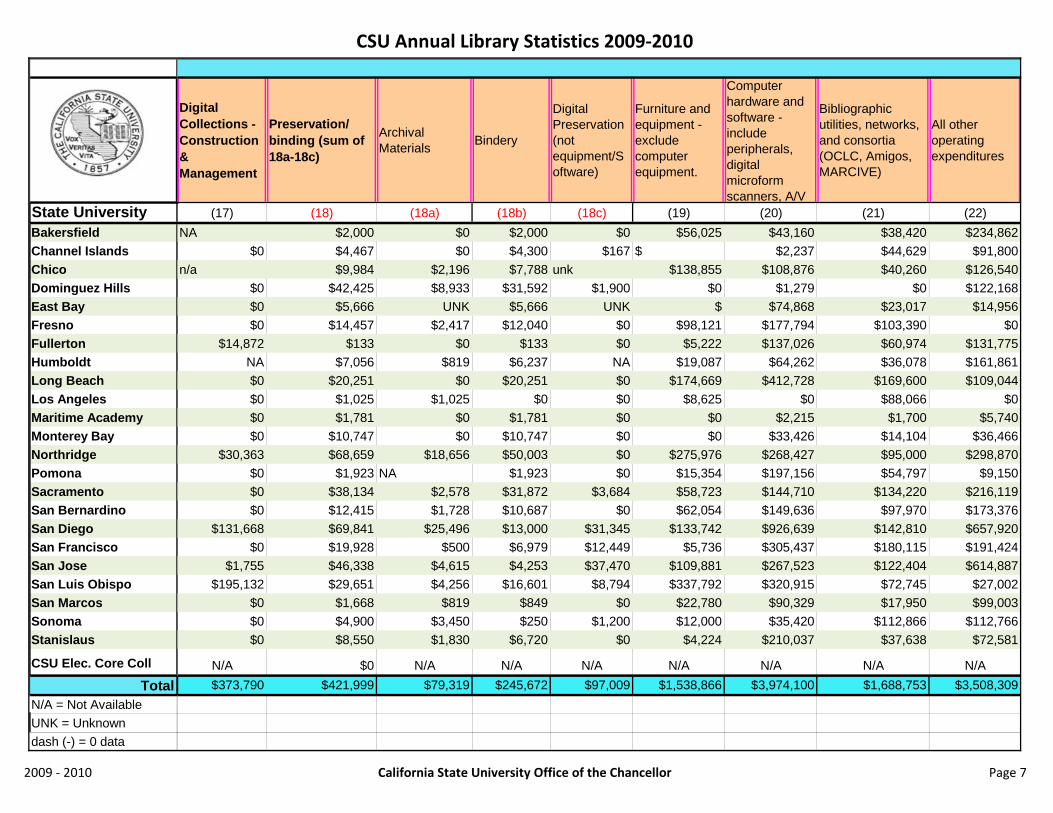
Digital Collections - Construction & Management
Preservation/ binding (sum of 18a-18c)
Archival Materials Bindery
Digital Preservation (not equipment/Software)
Furniture and equipment - exclude computer equipment.
Computer hardware and software - include peripherals, digital microform scanners, A/V
Bibliographic utilities, networks, and consortia (OCLC, Amigos, MARCIVE)
All other operating expenditures
(17) (18) (18a) (18b) (18c) (19) (20) (21) (22)NA $2,000 $0 $2,000 $0 $56,025 $43,160 $38,420 $234,862
$0 $4,467 $0 $4,300 $167 $ $2,237 $44,629 $91,800n/a $9,984 $2,196 $7,788 unk $138,855 $108,876 $40,260 $126,540
$0 $42,425 $8,933 $31,592 $1,900 $0 $1,279 $0 $122,168$0 $5,666 UNK $5,666 UNK $ $74,868 $23,017 $14,956$0 $14,457 $2,417 $12,040 $0 $98,121 $177,794 $103,390 $0
$14,872 $133 $0 $133 $0 $5,222 $137,026 $60,974 $131,775NA $7,056 $819 $6,237 NA $19,087 $64,262 $36,078 $161,861$0 $20,251 $0 $20,251 $0 $174,669 $412,728 $169,600 $109,044$0 $1,025 $1,025 $0 $0 $8,625 $0 $88,066 $0$0 $1,781 $0 $1,781 $0 $0 $2,215 $1,700 $5,740$0 $10,747 $0 $10,747 $0 $0 $33,426 $14,104 $36,466
$30,363 $68,659 $18,656 $50,003 $0 $275,976 $268,427 $95,000 $298,870$0 $1,923 NA $1,923 $0 $15,354 $197,156 $54,797 $9,150$0 $38,134 $2,578 $31,872 $3,684 $58,723 $144,710 $134,220 $216,119$0 $12,415 $1,728 $10,687 $0 $62,054 $149,636 $97,970 $173,376
$131,668 $69,841 $25,496 $13,000 $31,345 $133,742 $926,639 $142,810 $657,920$0 $19,928 $500 $6,979 $12,449 $5,736 $305,437 $180,115 $191,424
$1,755 $46,338 $4,615 $4,253 $37,470 $109,881 $267,523 $122,404 $614,887$195,132 $29,651 $4,256 $16,601 $8,794 $337,792 $320,915 $72,745 $27,002
$0 $1,668 $819 $849 $0 $22,780 $90,329 $17,950 $99,003$0 $4,900 $3,450 $250 $1,200 $12,000 $35,420 $112,866 $112,766$0 $8,550 $1,830 $6,720 $0 $4,224 $210,037 $37,638 $72,581
N/A $0 N/A N/A N/A N/A N/A N/A N/A$373,790 $421,999 $79,319 $245,672 $97,009 $1,538,866 $3,974,100 $1,688,753 $3,508,309
CSU Annual Library Statistics 2009-2010
2009 - 2010 California State University Office of the Chancellor Page 8
State UniversityBakersfieldChannel IslandsChicoDominguez HillsEast BayFresnoFullertonHumboldtLong BeachLos AngelesMaritime AcademyMonterey BayNorthridgePomonaSacramentoSan BernardinoSan DiegoSan FranciscoSan JoseSan Luis ObispoSan MarcosSonomaStanislaus
CSU Elec. Core Coll
TotalN/A = Not AvailableUNK = Unknowndash (-) = 0 data
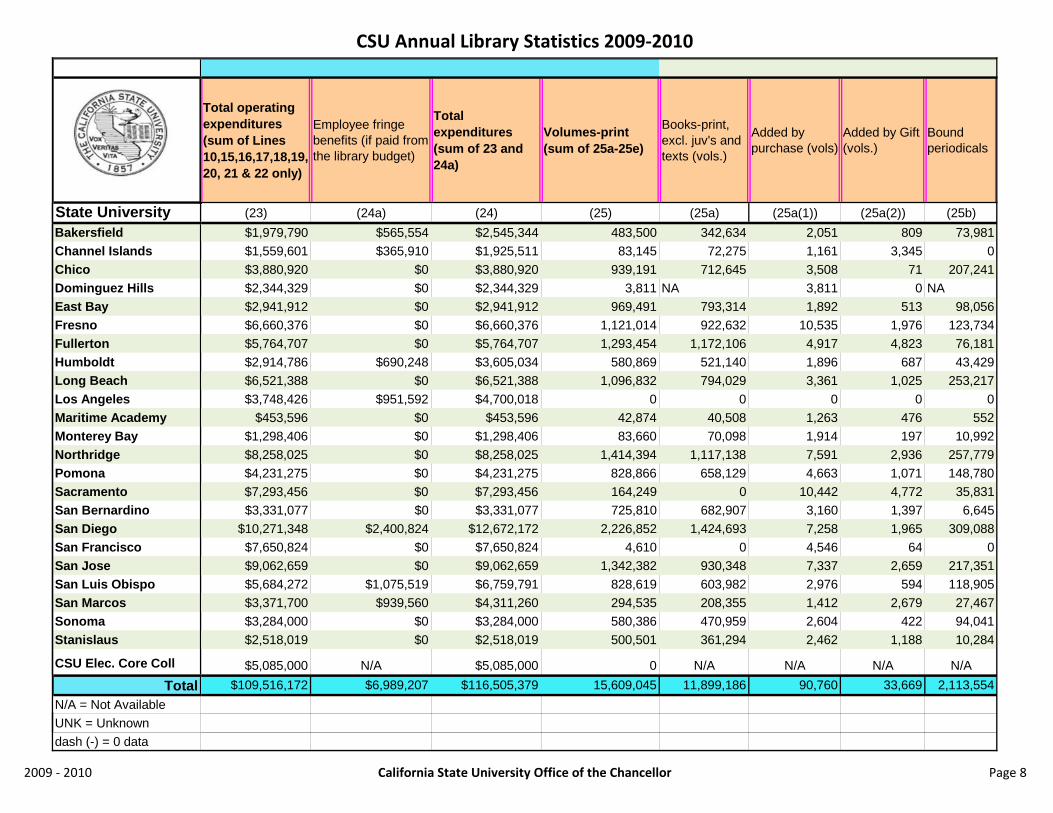
Total operating expenditures (sum of Lines 10,15,16,17,18,19, 20, 21 & 22 only)
Employee fringe benefits (if paid from the library budget)
Total expenditures (sum of 23 and 24a)
Volumes-print (sum of 25a-25e)
Books-print, excl. juv's and texts (vols.)
Added by purchase (vols)
Added by Gift (vols.)
Bound periodicals
(23) (24a) (24) (25) (25a) (25a(1)) (25a(2)) (25b)$1,979,790 $565,554 $2,545,344 483,500 342,634 2,051 809 73,981$1,559,601 $365,910 $1,925,511 83,145 72,275 1,161 3,345 0$3,880,920 $0 $3,880,920 939,191 712,645 3,508 71 207,241$2,344,329 $0 $2,344,329 3,811 NA 3,811 0 NA$2,941,912 $0 $2,941,912 969,491 793,314 1,892 513 98,056$6,660,376 $0 $6,660,376 1,121,014 922,632 10,535 1,976 123,734$5,764,707 $0 $5,764,707 1,293,454 1,172,106 4,917 4,823 76,181$2,914,786 $690,248 $3,605,034 580,869 521,140 1,896 687 43,429$6,521,388 $0 $6,521,388 1,096,832 794,029 3,361 1,025 253,217$3,748,426 $951,592 $4,700,018 0 0 0 0 0
$453,596 $0 $453,596 42,874 40,508 1,263 476 552$1,298,406 $0 $1,298,406 83,660 70,098 1,914 197 10,992$8,258,025 $0 $8,258,025 1,414,394 1,117,138 7,591 2,936 257,779$4,231,275 $0 $4,231,275 828,866 658,129 4,663 1,071 148,780$7,293,456 $0 $7,293,456 164,249 0 10,442 4,772 35,831$3,331,077 $0 $3,331,077 725,810 682,907 3,160 1,397 6,645
$10,271,348 $2,400,824 $12,672,172 2,226,852 1,424,693 7,258 1,965 309,088$7,650,824 $0 $7,650,824 4,610 0 4,546 64 0$9,062,659 $0 $9,062,659 1,342,382 930,348 7,337 2,659 217,351$5,684,272 $1,075,519 $6,759,791 828,619 603,982 2,976 594 118,905$3,371,700 $939,560 $4,311,260 294,535 208,355 1,412 2,679 27,467$3,284,000 $0 $3,284,000 580,386 470,959 2,604 422 94,041$2,518,019 $0 $2,518,019 500,501 361,294 2,462 1,188 10,284
$5,085,000 N/A $5,085,000 0 N/A N/A N/A N/A$109,516,172 $6,989,207 $116,505,379 15,609,045 11,899,186 90,760 33,669 2,113,554
CSU Annual Library Statistics 2009-2010
2009 - 2010 California State University Office of the Chancellor Page 9
State UniversityBakersfieldChannel IslandsChicoDominguez HillsEast BayFresnoFullertonHumboldtLong BeachLos AngelesMaritime AcademyMonterey BayNorthridgePomonaSacramentoSan BernardinoSan DiegoSan FranciscoSan JoseSan Luis ObispoSan MarcosSonomaStanislaus
CSU Elec. Core Coll
TotalN/A = Not AvailableUNK = Unknowndash (-) = 0 data
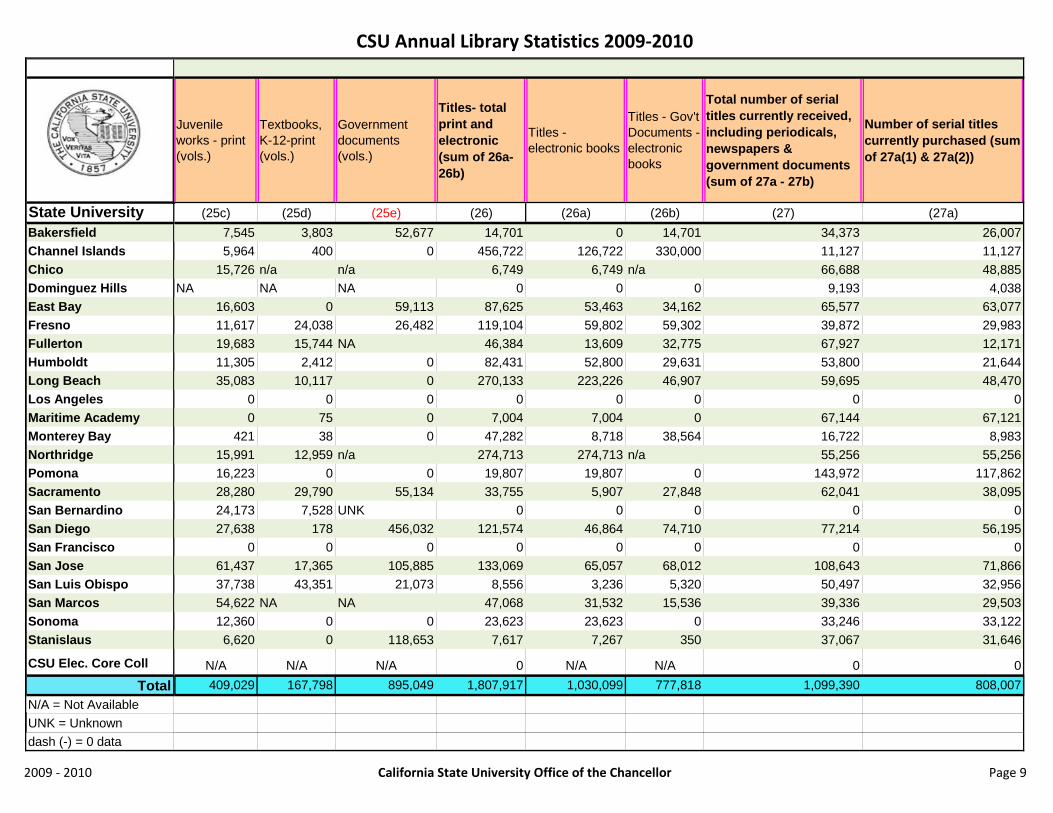
Juvenile works - print (vols.)
Textbooks, K-12-print (vols.)
Government documents (vols.)
Titles- total print and electronic (sum of 26a-26b)
Titles - electronic books
Titles - Gov't Documents - electronic books
Total number of serial titles currently received, including periodicals, newspapers & government documents (sum of 27a - 27b)
Number of serial titles currently purchased (sum of 27a(1) & 27a(2))
(25c) (25d) (25e) (26) (26a) (26b) (27) (27a)7,545 3,803 52,677 14,701 0 14,701 34,373 26,0075,964 400 0 456,722 126,722 330,000 11,127 11,127
15,726 n/a n/a 6,749 6,749 n/a 66,688 48,885NA NA NA 0 0 0 9,193 4,038
16,603 0 59,113 87,625 53,463 34,162 65,577 63,07711,617 24,038 26,482 119,104 59,802 59,302 39,872 29,98319,683 15,744 NA 46,384 13,609 32,775 67,927 12,17111,305 2,412 0 82,431 52,800 29,631 53,800 21,64435,083 10,117 0 270,133 223,226 46,907 59,695 48,470
0 0 0 0 0 0 0 00 75 0 7,004 7,004 0 67,144 67,121
421 38 0 47,282 8,718 38,564 16,722 8,98315,991 12,959 n/a 274,713 274,713 n/a 55,256 55,25616,223 0 0 19,807 19,807 0 143,972 117,86228,280 29,790 55,134 33,755 5,907 27,848 62,041 38,09524,173 7,528 UNK 0 0 0 0 027,638 178 456,032 121,574 46,864 74,710 77,214 56,195
0 0 0 0 0 0 0 061,437 17,365 105,885 133,069 65,057 68,012 108,643 71,86637,738 43,351 21,073 8,556 3,236 5,320 50,497 32,95654,622 NA NA 47,068 31,532 15,536 39,336 29,50312,360 0 0 23,623 23,623 0 33,246 33,1226,620 0 118,653 7,617 7,267 350 37,067 31,646
N/A N/A N/A 0 N/A N/A 0 0409,029 167,798 895,049 1,807,917 1,030,099 777,818 1,099,390 808,007

CSU Annual Library Statistics 2009-2010
2009 - 2010 California State University Office of the Chancellor Page 10
State UniversityBakersfieldChannel IslandsChicoDominguez HillsEast BayFresnoFullertonHumboldtLong BeachLos AngelesMaritime AcademyMonterey BayNorthridgePomonaSacramentoSan BernardinoSan DiegoSan FranciscoSan JoseSan Luis ObispoSan MarcosSonomaStanislaus
CSU Elec. Core Coll
TotalN/A = Not AvailableUNK = Unknowndash (-) = 0 data
Print (and other non-electronic format) periodical/serial subscriptions
Electronic periodical/ serial subscriptions (deduplicated)
Number of serial titles currently received but not purchased (sum of 27b(1) - 27b(3))
Print (and other non-electronic format) - Exchanges, gifts, etc.
Freely accessible Elec periodicals/ serials (de-duped)
Government documents (electronic and print)
Audiovisual Materials (sum of 28a-28b) - UNITS
Sound Materials
(27a(1)) (27a(2)) (27b) (27b(1)) (27b(2)) (27b(3)) (28) (28a)3,541 22,466 8,366 0 7,942 424 8,240 2,902
60 11,067 0 0 UNK 0 2,464 894647 48,238 17,803 84 17,719 n/a 20,174 9,971673 3,365 5,155 50 5,105 NA 0 0
0 63,077 2,500 0 UNK 2,500 31,320 24,4461,057 28,926 9,889 67 unk 9,822 90,631 82,319
844 11,327 55,756 100 52,818 2,838 31,410 23,134461 21,183 32,156 172 24,786 7,198 20,331 11,713
2,124 46,346 11,225 unknown unknown 11,225 39,229 20,3750 0 0 0 0 0 0 0
367 66,754 23 23 0 0 1,104 6158 8,825 7,739 0 6,006 1,733 2,796 249
2,342 52,914 0 n/a n/a n/a 28,265 14,2192,834 115,028 26,110 97 26,013 0 10,886 2,9841,053 37,042 23,946 194 23,752 NA 29,661 12,264
0 0 0 0 0 0 17,273 10,9321,279 54,916 21,019 162 9,171 11,686 36,043 22,462
0 0 0 0 0 0 0 0361 71,505 36,777 39 28,012 8,726 36,542 24,570737 32,219 17,541 76 15,632 1,833 4,141 2,308381 29,122 9,833 0 5,707 4,126 11,990 3,798765 32,357 124 124 0 0 38,727 26,133669 30,977 5,421 167 4,793 461 5,527 2,236
N/A N/A 0 N/A N/A N/A 0 N/A20,353 787,654 291,383 1,355 227,456 62,572 466,754 297,915
Part D - LIBRARY COLLECTIONS, FISCAL YEAR 2009/2010

CSU Annual Library Statistics 2009-2010
2009 - 2010 California State University Office of the Chancellor Page 11
State UniversityBakersfieldChannel IslandsChicoDominguez HillsEast BayFresnoFullertonHumboldtLong BeachLos AngelesMaritime AcademyMonterey BayNorthridgePomonaSacramentoSan BernardinoSan DiegoSan FranciscoSan JoseSan Luis ObispoSan MarcosSonomaStanislaus
CSU Elec. Core Coll
TotalN/A = Not AvailableUNK = Unknowndash (-) = 0 data
Films/ Videos/ DVDs
Other information resources ( A-K counted each as separate lines)
Cartographic Materials
Graphic Materials
Manuscripts and print archives - (in Linear feet) (Physical)
Non-serial & Serial microforms - Units (sum of 29d(1) & 29d(2))
Non-serial microforms - Units (Physical)
Serial microforms - Units (Physical)
(28b) (29) (29a) (29b) (29c) (29d) (29d1) (29d2)5,338 184,323 2,470 150 NA 87,848 8,673 79,1751,570 37,388 1,750 0 0 0 0 0
10,203 3,833,764 69,973 163,713 994 1,154,018 n/a 1,154,0180 0 0 0 0 0 0 0
6,874 1,724,372 365 29 1,024 860,853 860,853 08,312 3,612,406 143,312 1,896 756 1,588,973 325,070 1,263,9038,276 37,655 10,089 15,522 984 0 NA NA8,618 2,178,013 31,051 8,275 9,865 606,178 2,783 603,395
18,854 194,285 51,355 13,884 129,046 0 unknown unknown0 0 0 0 0 0 0 0
1,098 102,573 151 29 566 20,862 20,862 02,547 1,884 1 0 1,190 0 0 0
14,046 6,454,826 n/a 59,780 4,427 3,182,339 2,098,162 1,084,1777,902 2,860,411 1,149 24 1,633 1,428,459 17,223 1,411,236
17,397 241,861 23,400 119,490 6,339 0 0 06,341 19,038 16,274 435 0 0 UNK UNK
13,581 9,651,746 142,241 11,785 6,978 4,645,583 4,640,164 5,4190 0 0 0 0 0 0 0
11,972 397,546 10,897 3,315 0 0 UNK UNK1,833 4,434,919 24,584 37,053 0 2,157,256 2,133,505 23,7518,192 1,986,616 984 19,415 693 982,268 0 982,268
12,594 1,890 1,890 0 0 0 0 03,291 2,113,854 4,793 4,793 4,793 1,042,776 NA 1,042,776
N/A 0 N/A N/A N/A 0 N/A N/A168,839 40,069,369 536,729 459,588 169,288 17,757,413 10,107,295 7,650,118

CSU Annual Library Statistics 2009-2010
2009 - 2010 California State University Office of the Chancellor Page 12
State UniversityBakersfieldChannel IslandsChicoDominguez HillsEast BayFresnoFullertonHumboldtLong BeachLos AngelesMaritime AcademyMonterey BayNorthridgePomonaSacramentoSan BernardinoSan DiegoSan FranciscoSan JoseSan Luis ObispoSan MarcosSonomaStanislaus
CSU Elec. Core Coll
TotalN/A = Not AvailableUNK = Unknowndash (-) = 0 data
Government documents not reported elsewhere - Units (Physical)
Digital Collections - Number of individual collections
Digital Collections - Number of items
Digital Collections - Size (in Gigabytes)
Digital Collections - Use - number of times collections accessed
Computer Files - Units (Physical units)
Other library materials - Units (Include a comment)
Number of virtual visits (sum of 30a-30b)
No. of virtual visits Homepage
(29e) (29f) (29g) (29h) (29i) (29j) (29k) 30 (30a)0 12 3,378 NA *** 2,519 98 5,849,719 NA0 UNK 35,322 316 *** 0 0 309,085 264,5790 8 17,000 n/a *** 2,136 1,271,904 714,696 567,5150 0 0 0 0 0 0 246,511 246,5110 3 8 60 *** 1,167 10 951,440 unk
270,958 9 2,036 unk *** 15,493 0 1,844,297 1,109,3050 1 1,737 4 NA 3,318 6,000 496,126 302,508
389,426 7 5,406 6.5 GB 178,764 3,308 339,555 1,164,454 852,8300 0 0 0 *** 0 0 0 unknown0 0 0 0 0 0 0 0 00 3 60,000 100 *** 0 0 65,136 63,268
187 1 107 0 *** 129 269 184,347 NAn/a 11 23,857 900 n/a 1,173 n/a 12,984,169 12,984,169
0 0 0 0 *** 325 362 12,158,231 419,5510 6 2,680 107 85,677 3,719 443 3,098,774 1,782,093
NA 0 0 0 *** 2,329 0 669,980 590,989159,019 9 34,000 750 *** 4,859 939 4,315,466 2,091,678
0 0 0 0 *** 0 0 1,255,700 1,255,700249,249 10 6,067 UNK 63,048 1,817 63,143 9,288,329 5,798,16839,772 84 14,409 78 *** 4,427 0 1,489,611 840,370
NA NA NA NA *** 988 NA 241,294 200,4630 0 0 0 *** 0 0 1,493,232 869,945
4,793 1 260 8,321 *** 199 349 593,470 593,470
N/A N/A N/A N/A N/A N/A N/A 0 N/A1,113,404 165 206,267 10,635 327,489 47,906 1,683,072 59,414,067 30,833,112

CSU Annual Library Statistics 2009-2010
2009 - 2010 California State University Office of the Chancellor Page 13
State UniversityBakersfieldChannel IslandsChicoDominguez HillsEast BayFresnoFullertonHumboldtLong BeachLos AngelesMaritime AcademyMonterey BayNorthridgePomonaSacramentoSan BernardinoSan DiegoSan FranciscoSan JoseSan Luis ObispoSan MarcosSonomaStanislaus
CSU Elec. Core Coll
TotalN/A = Not AvailableUNK = Unknowndash (-) = 0 data
No. of virtual Catalog
No. of visits to databases or services (31a & 31b counted each as separate lines)
Number of sessions (logins) to databases or services
Number of searches (queries) in databases or services
Recorded Circulation of Collection (sum of 32a, 32b & 35)
Circulation Initial charges
Circulation renewals
Total In House Use-Reshelving
(30b) (31) (31a) (31b) (32) (32a) (32b) (33)5,849,719 0 NA NA 58,169 26,198 7,708 27,381
44,506 1,288,125 462,295 825,830 40,472 35,243 UNK UNK147,181 8,232,010 1,924,176 6,307,834 141,578 101,586 10,918 126,964
UNK 1,653,649 192,298 1,461,351 34,780 28,521 6,259 21,534951,440 2,159,991 unk 2,159,991 104,325 38,819 19,390 23,641734,992 1,008,384 324,605 683,779 382,148 350,388 unk 32,706193,618 210,688 107,492 103,196 171,597 119,072 16,552 39,865311,624 229,163 229,163 N/A 203,189 63,770 15,656 67,241
unknown 1,253,760 1,253,760 unknown 263,287 164,836 76,592 68,4110 0 0 0 203,335 88,058 24,099 142,437
1,868 13,306 761 12,545 8,018 3,878 193 1,467184,347 69,566 69,566 NA 56,467 53,448 1,773 28,594
n/a 591,308 591,308 n/a 375,958 159,867 78,197 170,64511,738,680 1,356,244 368,573 987,671 85,804 62,098 5,609 30,0881,316,681 0 NA NA 306,594 135,070 76,985 81,451
78,991 2,528,376 629,367 1,899,009 127,529 54,511 17,284 31,3712,223,788 2,465,338 793,198 1,672,140 488,802 197,447 62,095 152,918
n/a 0 n/a n/a 184,111 102,739 71,512 3643,490,161 3,390,015 UNK 3,390,015 439,682 236,788 149,704 197,207
649,241 97,568 97,568 NA 148,493 66,753 41,813 20,27440,831 295,621 295,621 UNK 93,364 33,865 10,336 14,888
623,287 886,273 333,491 552,782 243,182 177,853 39,041 19,767NA 778,066 225,083 552,983 66,887 53,029 NA 7,198
N/A 0 N/A N/A 0 N/A N/A N/A28,580,955 28,507,451 7,898,325 20,609,126 4,227,771 2,353,837 731,716 1,306,412

CSU Annual Library Statistics 2009-2010
2009 - 2010 California State University Office of the Chancellor Page 14
State UniversityBakersfieldChannel IslandsChicoDominguez HillsEast BayFresnoFullertonHumboldtLong BeachLos AngelesMaritime AcademyMonterey BayNorthridgePomonaSacramentoSan BernardinoSan DiegoSan FranciscoSan JoseSan Luis ObispoSan MarcosSonomaStanislaus
CSU Elec. Core Coll
TotalN/A = Not AvailableUNK = Unknowndash (-) = 0 data
Mutual use transactions (sum of 34a - 34c)
CSU borrowers
All community borrowers
Renewals both CSU & Community borrowers
Reserve collection - recorded circulation (sum of 35a - 35c)
Print Materials E-reserve Materials
Renewals of Print Reserve Materials
(34) (34a) (34b) (34c) (35) (35a) (35b) (35c)500 200 300 NA 24,263 5,783 18,480 NA
0 UNK UNK UNK 5,229 5,229 0 UNK5,249 404 3,331 1,514 29,074 17,684 11,390 0
886 107 563 216 0 UNK UNK UNK784 9 498 277 46,116 45,048 n/a 1,068
6,994 329 6,665 unk 31,760 4,928 26,832 unk4,826 1,215 1,583 2,028 35,973 8,051 27,922 0
59 53 0 6 123,763 16,210 107,553 NA8,423 457 4,368 3,598 21,859 21,859 unknown unknown
646 646 0 0 91,178 0 71,658 19,52032 0 32 0 3,947 3,947 0 00 NA NA 0 1,246 1,246 NA NA0 n/a n/a n/a 137,894 20,214 117,407 273
2,001 306 844 851 18,097 6,893 11,152 522,565 150 1,336 1,079 94,539 59,206 34,558 7751,459 141 811 507 55,734 26,150 29,209 3752,150 220 1,925 5 229,260 38,375 181,267 9,6183,577 50 1,626 1,901 9,860 7,445 289,013 2,136
212,174 0 109,138 103,036 53,190 10,986 42,204 02,658 108 1,171 1,379 39,927 39,485 382 601,009 300 394 315 49,163 6,305 42,802 565,809 5,809 unk unk 26,288 26,288 unk unk1,295 NA 1,295 NA 13,858 13,858 0 NA
0 N/A N/A N/A 0 N/A N/A N/A263,096 10,504 135,880 116,712 1,142,218 385,190 723,095 33,933

CSU Annual Library Statistics 2009-2010
2009 - 2010 California State University Office of the Chancellor Page 15
State UniversityBakersfieldChannel IslandsChicoDominguez HillsEast BayFresnoFullertonHumboldtLong BeachLos AngelesMaritime AcademyMonterey BayNorthridgePomonaSacramentoSan BernardinoSan DiegoSan FranciscoSan JoseSan Luis ObispoSan MarcosSonomaStanislaus
CSU Elec. Core Coll
TotalN/A = Not AvailableUNK = Unknowndash (-) = 0 data
Document Delivery/ Interlibrary Loans provided/ lent to other libraries (sum of 36-37)
Returnable Non-returnable
ILL provided/ lent to other libraries (sum of 38a-38c)
Provided to CSU libraries
Provided to UC libraries
Provided to "Other" Libraries
Un-mediated Lending (sum of 39a-39c)
(36) (37) (38) (38a) (38b) (37c) (39)5,462 1,709 3,753 5,462 3,547 348 1,567 01,347 1,084 263 1,347 697 46 604 06,634 3,045 3,589 6,634 4,021 654 1,959 06,311 2,371 3,940 6,311 4,745 503 1,063 05,027 2,849 2,178 4,686 2,702 725 1,259 10,7646,331 3,943 2,388 6,083 2,415 202 3,466 17,483
15,479 7,274 8,205 15,479 5,605 1,128 8,746 04,679 2,417 2,262 4,679 2,200 365 2,114 0
37,927 28,176 9,751 9,990 5,931 631 3,428 27,9377,425 3,409 4,016 7,425 4,120 815 2,490 0
187 177 10 187 83 29 75 01,523 429 1,094 1,523 697 194 632 07,330 2,501 4,829 7,330 4,950 536 1,844 05,860 2,889 2,971 5,743 2,978 700 2,065 14,295
15,467 4,903 10,564 15,269 6,001 587 8,681 05,326 3,290 2,036 5,326 2,437 337 2,552 0
15,301 8,082 7,219 15,301 7,121 1,399 6,781 28,9406,631 2,737 3,894 11,328 3,991 706 6,631 23,4968,260 3,245 5,015 8,260 3,906 543 3,811 18,4935,347 2,734 2,613 5,347 564 2,292 2,491 13,0144,822 2,265 2,557 4,822 1,983 372 2,467 6,6396,193 4,243 1,950 6,193 2,614 403 3,176 7,0314,821 1,624 3,197 4,821 2,367 243 2,211 3,215
0 N/A N/A 0 N/A N/A N/A 0183,690 95,396 88,294 159,546 75,675 13,758 70,113 171,307

CSU Annual Library Statistics 2009-2010
2009 - 2010 California State University Office of the Chancellor Page 16
State UniversityBakersfieldChannel IslandsChicoDominguez HillsEast BayFresnoFullertonHumboldtLong BeachLos AngelesMaritime AcademyMonterey BayNorthridgePomonaSacramentoSan BernardinoSan DiegoSan FranciscoSan JoseSan Luis ObispoSan MarcosSonomaStanislaus
CSU Elec. Core Coll
TotalN/A = Not AvailableUNK = Unknowndash (-) = 0 data
CSU UC Other
Document Delivery - Interlibrary Loans received - borrowed from other libraries (sum of 40-41)
Returnable Non-returnable
Document Delivery - Interlibrary Loans received - borrowed from other libraries (sum of 42a-42c)
(39a) (39b) (39c) (40) (41) (42)0 0 0 3,822 1,711 2,111 3,822
UNK UNK UNK 3,579 1,780 1,799 3,5790 0 0 8,203 3,845 4,358 8,2030 0 0 4,641 1,426 3,215 4,641
2,675 5 8,084 6,428 498 5,930 4,6714,094 19 13,370 2,591 345 2,246 2,591
0 0 0 28,073 12,893 15,180 28,0730 0 0 6,696 3,002 3,694 3,709
3,584 43 24,310 48,455 31,491 16,964 8,6790 0 0 8,892 4,446 4,446 8,8920 0 0 535 515 20 5350 0 0 3,795 1,284 2,511 3,795
n/a n/a n/a 6,883 4,453 2,430 6,8834,289 28 9,978 7,053 1,140 5,913 6,628
NA NA NA 10,870 5,506 5,364 10,6730 0 0 5,607 1,960 3,647 5,607
6,041 4,159 18,740 13,927 1,492 12,435 13,9275,206 8 18,282 8,571 1,461 7,110 17,5294,753 8 13,732 13,401 1,425 11,976 13,4013,063 11 9,940 11,465 1,531 9,934 11,465
985 2,669 2,985 6,586 869 5,717 6,5862,200 5 4,826 2,697 393 2,304 2,697
888 1 2,326 3,553 1,008 2,545 3,553
N/A N/A N/A 0 N/A N/A 037,778 6,956 126,573 216,323 84,474 131,849 180,139

CSU Annual Library Statistics 2009-2010
2009 - 2010 California State University Office of the Chancellor Page 17
State UniversityBakersfieldChannel IslandsChicoDominguez HillsEast BayFresnoFullertonHumboldtLong BeachLos AngelesMaritime AcademyMonterey BayNorthridgePomonaSacramentoSan BernardinoSan DiegoSan FranciscoSan JoseSan Luis ObispoSan MarcosSonomaStanislaus
CSU Elec. Core Coll
TotalN/A = Not AvailableUNK = Unknowndash (-) = 0 data
Received from CSU Libraries
Received from UC Libraries
Received from Other Libraries
Un-mediated borrowing (sum of 43a-43c)
CSU UC Other
Number of presentations (sum of 44a-44c)
(42a) (42b) (42c) (43) (43a) (43b) (43c) (44)2,447 323 1,052 0 0 0 0 3072,775 45 759 0 UNK UNK UNK 1405,075 1,741 1,387 152 0 0 152 2102,840 359 1,442 0 0 0 0 502,438 61 2,172 8,109 2,441 40 5,628 90
994 91 1,506 6,986 2,083 67 4,836 15610,872 1,278 15,923 1,800 0 0 1,800 4992,985 234 490 0 0 0 0 1222,378 579 5,722 39,776 7,515 252 32,009 6634,967 805 3,120 0 0 0 0 683
312 35 188 0 0 0 0 621,636 379 1,780 0 0 0 0 1553,659 419 2,805 0 n/a n/a n/a 2,5752,564 1,088 2,976 8,918 3,056 48 5,814 2694,153 701 5,819 0 NA NA NA 5382,791 143 2,673 0 0 0 0 1304,098 947 8,882 13,942 2,739 3,864 7,339 6056,551 2,407 8,571 17,742 5,735 76 11,931 3541,266 201 11,934 12,602 4,428 101 8,073 5433,197 1,784 6,484 10,012 2,788 45 7,179 3523,684 242 2,660 4,273 919 2,127 1,227 2321,241 55 1,401 9,057 3,369 51 5,637 2751,770 127 1,656 3,730 252 9 3,469 145
N/A N/A N/A 0 N/A N/A N/A 074,693 14,044 91,402 137,099 35,325 6,680 95,094 9,155
Part E - LIBRARY SERVICES, END OF THE YEAR AN

CSU Annual Library Statistics 2009-2010
2009 - 2010 California State University Office of the Chancellor Page 18
State UniversityBakersfieldChannel IslandsChicoDominguez HillsEast BayFresnoFullertonHumboldtLong BeachLos AngelesMaritime AcademyMonterey BayNorthridgePomonaSacramentoSan BernardinoSan DiegoSan FranciscoSan JoseSan Luis ObispoSan MarcosSonomaStanislaus
CSU Elec. Core Coll
TotalN/A = Not AvailableUNK = Unknowndash (-) = 0 data
Info Lit Instruction - Students Non Credit bearing
Info Lit Instruction Non-student Non credit bearing
Library Programming - Cultural, Rec.
Number of persons served in presentations (sum of 45a-45c)
Info Lit Instruction Students
Info Lit Instruction - Non Students
Library Programming - Cultural, Rec.
Contact hours of librarian-taught library courses for credit
(44a) (44b) (44c) (45) (45a) (45b) (45c) (46)303 4 NA 8,575 8,505 70 NA 1,450135 5 0 2,872 2,808 64 0 90208 2 0 5,747 5,728 19 0 2050 0 0 1,366 1,366 0 0 081 9 0 2,966 2,801 165 0 780
154 0 2 3,767 3,675 0 92 0485 14 UNK 14,542 14,192 350 UNK 098 1 23 4,329 2,204 5 2,120 0
637 0 26 13,025 12,500 480 45 0679 4 0 19,025 18,964 61 0 4444 17 1 1,009 1,009 0 0 112
154 1 0 2,670 2,648 22 0 36761 1,814 n/a 22,836 21,022 1,814 n/a 0242 5 22 7,788 7,329 129 330 0444 34 60 13,711 11,396 1,115 1,200 099 0 31 3,385 2,705 0 680 0
280 268 57 10,961 8,528 38 2,395 0348 6 0 10,564 10,406 158 0 0543 0 UNK 12,843 12,843 0 UNK 0332 4 16 11,627 9,167 100 2,360 0218 14 NA 6,567 6,413 154 NA 228251 0 24 8,299 4,499 0 3,800 0141 0 4 3,915 3,710 0 205 54
N/A N/A N/A 0 N/A N/A N/A N/A6,687 2,202 266 192,389 174,418 4,744 13,227 2,814
NUAL COUNT

CSU Annual Library Statistics 2009-2010
2009 - 2010 California State University Office of the Chancellor Page 19
State UniversityBakersfieldChannel IslandsChicoDominguez HillsEast BayFresnoFullertonHumboldtLong BeachLos AngelesMaritime AcademyMonterey BayNorthridgePomonaSacramentoSan BernardinoSan DiegoSan FranciscoSan JoseSan Luis ObispoSan MarcosSonomaStanislaus
CSU Elec. Core Coll
TotalN/A = Not AvailableUNK = Unknowndash (-) = 0 data
No. of Persons Served in Lib.- Taught Library Courses for Credit
Number of Orientations - Tours
No. of Persons served in Lib Orientation / Tours
Outreach - On and Off campus
Library Equipment Inventory (sum of 51a-51h only)
Public Service Workstations - Total
Public Service Workstations NOT purchased by the library (within 51a)
(47) (48) (49) (50) (51) (51a) (51a(1))175 105 465 495 180 81 5435 3 50 UNK 277 119 028 4 38 0 145 70 00 8 457 UNK 276 64 0
722 0 0 0 399 184 960 67 500 0 884 134 00 14 350 UNK 1,169 570 4610 4 26 0 329 147 870 5 107 1 360 0 330
41 2 85 0 0 0 084 0 0 0 48 24 13
326 7 139 0 196 81 0 79 2,124 n/a 554 465 00 97 3,294 NA 376 344 00 871 2,673 89 530 271 890 10 3,300 34 188 79 00 7 53 725 1,485 812 00 0 5,725 0 284 129 00 66 1,794 14 379 253 UNK0 16 862 145 753 275 260
1,346 11 292 NA 688 284 820 60 240 20 226 148 0
51 4 133 33 163 59 46
N/A N/A N/A N/A 0 N/A N/A2,808 1,440 22,707 1,556 9,889 4,593 1,518

CSU Annual Library Statistics 2009-2010
2009 - 2010 California State University Office of the Chancellor Page 20
State UniversityBakersfieldChannel IslandsChicoDominguez HillsEast BayFresnoFullertonHumboldtLong BeachLos AngelesMaritime AcademyMonterey BayNorthridgePomonaSacramentoSan BernardinoSan DiegoSan FranciscoSan JoseSan Luis ObispoSan MarcosSonomaStanislaus
CSU Elec. Core Coll
TotalN/A = Not AvailableUNK = Unknowndash (-) = 0 data
Laptops - Total
Laptops NOT purchased by the library (within 51b)
Self-check out machines - Total
Self-check out machines NOT purchased by the library (within 51c)
Headphones - Total
Headphones NOT purchased by the library (within 51d)
Printers & Photocopiers - Total
Printers & Photocopiers NOT purchased by the library (within 51e)
(51b) (51b(1)) (51c) (51c(1)) (51d) (51d(1)) (51e) (51e(1))0 0 0 0 23 0 11 11
65 0 4 0 25 0 7 024 0 0 0 31 6 5 561 59 NA 0 1 0 55 2960 0 0 0 7 0 12 9
377 304 5 0 50 0 0 1128 26 2 0 25 0 23 230 0 0 0 65 0 14 120 0 3 0 0 19 0 00 0 0 0 0 0 0 04 0 0 0 3 0 3 0
67 0 7 0 41 0 0 030 0 1 0 30 0 17 110 0 3 0 19 0 10 0
70 70 0 0 0 0 26 46 0 0 0 1 0 52 0
251 0 7 0 78 0 140 360 0 0 1 4 0 71 096 UNK 6 UNK 8 UNK 13 UNK40 40 1 0 20 0 23 2136 36 0 0 32 19 17 1545 0 0 0 10 0 18 014 14 0 0 12 0 9 3
N/A N/A N/A N/A N/A N/A N/A N/A1,334 549 39 1 485 44 526 157

CSU Annual Library Statistics 2009-2010
2009 - 2010 California State University Office of the Chancellor Page 21
State UniversityBakersfieldChannel IslandsChicoDominguez HillsEast BayFresnoFullertonHumboldtLong BeachLos AngelesMaritime AcademyMonterey BayNorthridgePomonaSacramentoSan BernardinoSan DiegoSan FranciscoSan JoseSan Luis ObispoSan MarcosSonomaStanislaus
CSU Elec. Core Coll
TotalN/A = Not AvailableUNK = Unknowndash (-) = 0 data
Digital Cameras - Total
Digital Cameras (NOT purchased by the library) (within 51f)
Flash / Thumb drives - Total
Flash/Thumb drives (NOT purchased by the library) (within 51g)
Other (Scanners, ebook readers, ipods) - Total
Other (Scanners, etc.) (NOT purchased by the library) (within 51h)
Study Rooms (number of times used) - Total
Study Rooms (NOT run by the library, i.e., run by tenants)
51f (51f(1)) (51g) (51g(1) ) (51h) (51h(1)) (51i) (51i(1))0 0 0 0 0 0 UNK NA
48 0 2 0 7 0 UNK UNK1 0 0 0 3 0 n/a 2,8521 NA 0 0 4 2 94 NA1 0 1 0 24 5 UNK UNK1 0 2 0 0 0 8,658 03 0 0 0 4 4 13,285 unk0 0 0 0 2 2 4,356 N/A8 0 0 0 0 0 1 10 0 0 0 0 0 23 01 0 0 0 0 0 300 00 0 0 0 0 0 12,899 NA0 0 0 0 0 0 11,698 n/a0 0 0 0 0 0 NA NA0 0 0 0 0 0 unk 01 0 48 0 1 0 UNK 0
13 0 74 0 107 0 217,806 02 0 N/A 0 17 0 N/A N/A0 UNK 0 UNK 3 UNK 60,301 UNK9 5 0 0 39 20 NA NA
52 52 30 30 3 0 NA NA0 0 0 0 5 0 3,120 00 0 0 0 6 0 25,234 0
N/A N/A N/A N/A N/A N/A N/A N/A141 57 157 30 225 33 357,775 2,853

CSU Annual Library Statistics 2009-2010
2009 - 2010 California State University Office of the Chancellor Page 22
State UniversityBakersfieldChannel IslandsChicoDominguez HillsEast BayFresnoFullertonHumboldtLong BeachLos AngelesMaritime AcademyMonterey BayNorthridgePomonaSacramentoSan BernardinoSan DiegoSan FranciscoSan JoseSan Luis ObispoSan MarcosSonomaStanislaus
CSU Elec. Core Coll
TotalN/A = Not AvailableUNK = Unknowndash (-) = 0 data
Meeting Rooms (number of times used) - Total
Meeting Rooms (NOT run by the library, i.e. run by tenants)
Classrooms (or Computer Labs) - Total
Classrooms (NOT run by the library, i.e. run by tenants)
Open Hours in a typical week
Gate count in a typical week
Person hours per typical week of professional reference service available
Reference Transactions in a Typical Week (sum of 55a-55f)
(51j) (51j(1)) (51k) (51k(1)) (52) (53) (54) (55)UNK NA UNK NA 68 22,520 102 844UNK UNK UNK UNK 74 9,000 74 0
230 346 290 179 91 24,548 62 647UNK NA 50 NA 61 13,541 61 1,129
UNK UNK 332 N/A 76 28,741 88 810590 0 156 0 82 59,864 62 1,985155 311 643 0 76 91,048 112 1,23723 N/A 89 N/A 94 20,284 65 2,466
unknown unknown 5 unknown 93 41,974 67 02 0 2 0 75 37,875 71 1,3140 0 0 0 79 3,600 65 2,768
NA NA NA NA 83 12,266 57 185526 n/a 761 n/a 85 42,403 269 0180 NA 570 NA 86 32,717 52 7,677unk 0 unk unk 97 NA 132 1,358
UNK 0 UNK 0 121 4,257 75 02,785 0 456 1,012 168 74,128 118 4,040
N/A N/A N/A N/A 168 8,995 114 01,592 UNK 856 UNK 84 66,429 89 5,082
309 NA 2,599 165 114 42,136 135 524NA NA NA NA 77 15,122 0 0
135 0 780 0 92 4,840 60 1,2270 0 31,012 0 76 8,732 59 680
N/A N/A N/A N/A N/A N/A N/A 06,527 657 38,601 1,356 Median 84 23,534 71 844
Part F - L

CSU Annual Library Statistics 2009-2010
2009 - 2010 California State University Office of the Chancellor Page 23
State UniversityBakersfieldChannel IslandsChicoDominguez HillsEast BayFresnoFullertonHumboldtLong BeachLos AngelesMaritime AcademyMonterey BayNorthridgePomonaSacramentoSan BernardinoSan DiegoSan FranciscoSan JoseSan Luis ObispoSan MarcosSonomaStanislaus
CSU Elec. Core Coll
TotalN/A = Not AvailableUNK = Unknowndash (-) = 0 data
In-Person reference transactions
On-call reference transactions
Email reference transactions
Phone reference transactions
Virtual reference (OCLC 24/7, IM) transactions
Staff transactions (Levels 1 & 2 questions-e.g. circulation, info. desk, docents, etc.)
(55a) (55b) (55c) (55d) (55e) (55f)388 0 55 60 39 302
UNK UNK UNK UNK UNK UNK438 3 5 150 51 0404 0 40 66 0 619727 0 15 UNK 68 UNK
1,570 29 66 212 108 unk816 276 2 17 126 NA79 N/A 134 120 48 2,0850 0 0 0 0 0
1,206 0 37 46 25 02,768 0 0 0 0 0
170 0 6 4 5 na0 0 0 0 0 0
434 0 31 37 4 7,171695 29 23 156 25 430
0 0 0 0 0 01,129 50 82 169 12 2,598
0 0 0 0 0 0408 0 145 67 53 4,409242 0 15 29 92 146
0 0 0 0 0 0273 13 14 9 9 909174 0 6 9 2 489
N/A N/A N/A N/A N/A N/A396 0 14 29 11 224
* for 2009-10 reference transactions include in-person, email, phone, and virtual
IBRARY SERVICES, TYPICAL WEEK