cultural superstitions and residential real estate prices: transaction ... · residential real...
TRANSCRIPT

Department of Economics Working Paper Series
Cultural Superstitions and Residential Real Estate Prices: Transaction-level Evidence from the US Housing Market Brad R. Humphreys
Adam Nowak
Yang Zhou
Working Paper No. 16-27
This paper can be found at the College of Business and Economics Working Paper Series homepage: http://business.wvu.edu/graduate-degrees/phd-economics/working-papers

Cultural Superstitions and Residential Real Estate Prices:
Transaction-level Evidence from the US Housing Market
Brad R. Humphreys ∗
West Virginia University
Adam Nowak†
West Virginia University
Yang Zhou ‡
West Virginia University
December 17, 2016
Abstract
In Chinese culture, the number 8 is considered lucky and 4 is considered unlucky. Weanalyze the relationship between the presence of 8 s and 4 s in addresses and transaction pricespaid by Chinese home buyers and sellers in a novel setting, Seattle, Washington, from 1990 to2015. In the absence of explicit identifiers for Chinese individuals, we develop a probabilisticmodel for identifying ethnicity based on name alone. The results indicate Chinese buyers paya 1-2% premium for addresses that include an 8 and 1% less for properties with a 4 in theaddress. These results are not related to unobserved property quality as there is no premiumwhen Chinese sell properties with an 8 in the address. These results suggest that some Chinesehome buyers in Seattle retain their Chinese cultural superstitions.
JEL Codes: D03, R21, R30Key words: Superstition; property value; supervised learning; hedonic price model
∗College of Business & Economics, Department of Economics, 1601 University Ave., PO Box 6025, Morgantown,WV 26506-6025, USA; Email: [email protected]†College of Business & Economics, Department of Economics, 1601 University Ave., PO Box 6025, Morgantown,
WV 26506-6025, USA; Email: [email protected]‡College of Business & Economics, Department of Economics, 1601 University Ave., PO Box 6025, Morgantown,
WV 26506-6025, USA; Email: [email protected] are very grateful to Crocker Liu and George Chen who provided useful comments on this paper.

The students assimilated too well into American society. The elders back home felt that
they were beginning to lose a lot of the traditional Chinese culture, getting too far away
from the Confucian Analects
— Shawn Wong, Becoming American: The Chinese Experience
1 Introduction
There is anecdotal and empirical evidence that some economic outcomes reflect superstitions held
by economic agents. Of course, these superstitions — cultural preferences or norms related to
specific numbers, actions, or events — are incompatible with rational economic agents. The impact
of lucky and unlucky numbers is present in American culture. For example, less than 5% of condo
buildings in New York City have a 13th floor as 13 is considered an unlucky number.1 Conversely,
a Lucky Seven Road can be found in Wisconsin, Pennsylvania, Idaho and Texas. This study
investigates the relationship between lucky or unlucky numbers in Chinese culture in the context
of the American real estate market. In particular, we are interested in whether or not residential
real estate purchase prices by paid by ethnic Chinese living in America reflect these superstitions.
In Chinese, the word for 8 and the words for weath / prosperity are homophones. It is not
surprising that in the Chinese culture, the number 8 is widely believed to be the most lucky of all
single digits. In contrast, the number 4 is considered unlucky as the words for 4 and death are
homophones. Therefore, it is possible that individuals whose beliefs are rooted in Chinese culture
— hereafter Chinese — react differently to these numbers than those individuals from different
cultural backgrounds. It is also possible that Chinese have completely or partially assimilated into
American culture and no longer retain these superstitions. We test this assimilation hypothesis
using addresses for single-family homes in the Seattle, Washington metro area during the period
1990 to 2015. Seattle is an ideal setting for research on Chinese cultural preferences and real estate
prices as it has been a prime destination for Chinese immigrants since the 1860s and contains a
relatively large number of Chinese home buyers and sellers.
This study is not the first to investigate the effect of Chinese numerology on real estate markets.
Shum et al. (2014) and Agarwal et al. (2016) find evidence supporting superstitions in Chinese and
1Sanette Tanaka, A 13th Floor Condo? No Such Luck, Wall Street Journal, September 5, 2013
1

Singaporean condominium markets. Fortin et al. (2014) analyze data from the Vancouver real
estate market and find significance effects of superstitions on residential property prices in census
tracts with above average fractions of ethnic Chinese. This study extends this line of research to
an American real estate market with a large percentage of Chinese residents and therefore builds
on the work of Fortin et al. (2014). However, this study differs from Fortin et al. (2014) in that
we identify whether or not the buyers and sellers are Chinese whereas Fortin et al. (2014) analyze
prices paid for properties in census tracts with many Chinese residents. In this manner, our study
builds on the work of Agarwal et al. (2016)
In order to determine if Chinese pay more or less for properties based on the presence of specific
numbers in the address, it is first necessary to identify whether or not the buyer or seller is Chinese.
Despite myriad housing attributes available in data provided by county assessor offices, to the best
of the authors knowledge there, does not exist any assessor data set that identifies the ethnicity of
the buyer or seller.2 However, a large number of assessor office data sets include the names of the
buyers and sellers. We capitalize on availability of buyer and seller names and develop a supervised
learning algorithm that classifies individuals based on name. In order to train our algorithm, we use
a labeled data set of Chinese and American participants in the Summer Olympic Games from 1948
to 2012. Intuitively, the algorithm is based on the frequency of a given name in the Chinese roster
relative to the frequency of that name in the US roster. Similar procedures have previously been
employed in Agarwal et al. (2016) and in the biomedical fields in a process known as name-ethnicity
matching. In contrast to other classification methods, including those in Agarwal et al. (2016), our
procedure is developed using publicly available data sources and programs.3
The results indicate that Chinese buyers pay a 1.7% premium for properties that include an
8 in the address. In addition, we provide evidence that this premium does not reflect unobserved
quality of the underlying property as Chinese sellers do not command a premium for properties
with an 8 in the address. On the other hand, we find mild evidence that Chinese buyers pay 1.2%
less for addresses that end in a 4. These results provide the first evidence that Chinese numerology
2The authors have examined assessor data sets from Seattle, Washington; Phoenix, Arizona; Richmond, Vir-ginia; Denver, Colorado; Boulder, Colorado; Spokane, Washington; Charlotte, North Carolina; and Oklahoma City,Oklahoma.
3A copy of the data and classification program is available from the authors upon request and atProgram: https://dl.dropboxusercontent.com/u/62967289/olympic%20names%20china.R
Auxiliary Program: https://dl.dropboxusercontent.com/u/62967289/fastTDM.R
Olympic Roster Data: https://dl.dropboxusercontent.com/u/62967289/olympicRosters.csv
2

impacts transaction prices in an American real estate market. A falsification test finds no evidence
that Korean Americans pay a premium for homes with addresses containing an 8. In the context
of cultural assimilation in America, we find evidence that Chinese preferences for specific numbers
are durable and long-lived, even for minority residents in a city where a majority of the population
has different cultural preferences.
2 Literature Review
2.1 Superstition and Real Estate
Previous research has examined the role of numerology in the market for apartments in the Chinese
administrative region of Hong Kong and mainland China. Chau et al. (2001) examine the Hong
Kong market from 1993 to 1999 and find apartments on floor 8 sell for a 2.5% premium, while
apartments on floor 4 do not have a significant discount. Shum et al. (2014) analyze in Chengdu, a
provincial capital city in Western China, during the period 2004 to 2006. They find that apartments
located on floors ending with an 8 sell in the secondary market at a 235 RMB per square meter
(about 7%) premium. No price effects are found in the primary market due to a uniform pricing
policy. In addition, apartments on floors ending in an 8 sold 6.9 days sooner than apartments on
other floors, on average. Shum et al. (2014) also exploit individual-level information and identify
individuals with phone numbers that contain multiple 8 s as superstitious individuals, and find that
these superstitious individuals were more likely to buy an apartment on a floor ending with an 8.
Despite evidence for the number 8, the presence of the number 4 is not associated with any price
discount.
Of course, Chinese culture is not relegated to China. Other researchers have investigated pricing
in countries other than China. In order to identify price effects, some researchers compare property
prices in census units with a large concentration of Chinese to property prices in other census units.
Bourassa and Peng (1999) examine census units in New Zealand and find positive price effects for
properties with lucky numbers in the address in census units with a large percentage of Chinese;
no such effects are found for similar properties in census units with few Chinese. Fortin et al.
(2014) examine the North American real estate market using 117,000 single-family home sales from
2000 to 2005 in the greater Vancouver area. Similar to Bourassa and Peng (1999), they compare
3

property prices in census units with a large numbers of Chinese to property prices in other census
units and find houses with addresses ending in an 8 sell at a 2.5% premium in the Chinese census
units; in the same units, addresses that end in a 4 sell at a 2.2% discount. No price effects are
found for non-Chinese census units.
Although Bourassa and Peng (1999) and Fortin et al. (2014) provide evidence of Chinese nu-
merology outside of China, their results indicate a time-invariant treatment effect for properties
in Chinese census units. Absent any information on the ethnicity of the buyer and seller, these
studies can not identify any time-varying treatment effect, i.e., effects attributable to Chinese buy-
ers or sellers. In contrast, Agarwal et al. (2016) examines a time-varying treatment effect in the
Singapore apartment market whereby Chinese buyers and sellers are identified using name and a
linear classifier trained using a proprietary data set. Our procedure uses a publicly available data
set. Agarwal et al. (2016) find Chinese buyers pay a 0.9% premium for apartments with numbers
ending in 8 and 1.1% discount for apartments with numbers ending in 4.
In addition to real estate, empirical research has also found Chinese numerology effects in other
markets. Woo et al. (2008) and Ng et al. (2010) find evidence using winning bids for license plate
auctions in Hong Kong. Yang (2011) document that retailers in China manipulate patterns of
numbers appearing on price tags in order to exploit preferences for lucky and unlucky numbers.
Morevoer, Yang (2011) conclude that Chinese consumers pay more for retail goods because of this
manipulation.
2.2 Name-Ethnicity Matching
In addition to testing for evidence that cultural preferences affect real estate prices, this study also
develops a novel supervised learning approach for classifying individuals’ ethnicity based on name
alone. The need for a name-ethnicity classification scheme is more practical than ideal, based on
both observable and unobservable data available to most researchers in the social and biomedical
sciences. As Treeratpituk and Giles (2012) point out, “unlike names, ethnic information is often
unavailable due to practical, political or legal reasons. (page 1142)” This point is important as our
study uses data from the King County Assessor that does not include ethnic identifiers but does
include both buyer and seller names. Motivated by genetic commonalities within ethnic groups,
name-based ethnic matching has been used extensively in biomedical research (Coldman et al.,
4
1988; Burchard et al., 2003; Fiscella and Fremont, 2006). A typical approach taken in name-ethnic
classification is to identify strong predictors of ethnicity using a labeled data set that includes both
ethnicity and name. For example, Coldman et al. (1988) use death certificates that include name
and ethnicity, Gill et al. (2005) use surnames and country of origin, and Ambekar et al. (2009) use
famous natives obtained from the web site Wikipedia. In this study, we use Olympic Games rosters
for both the United States and China from 1948 to 2012 as a representative list of names from each
country.
As names are a specific form of textual data, our method is related to other studies that view
text as data. Gentzkow and Shapiro (2010) and Taddy (2013) identify separate Republican and
Democrat vocabularies using speeches given in the US Congress. Text has recently been used in real
estate settings as well. Using a pre-specified dictionary of positive and negative words, Goodwin
et al. (2014) find the length and tone of written property descriptions significantly impact market
outcomes, while Nowak and Smith (2016) identify which words in property descriptions are relevant
when pricing real estate.
The purpose of the classification procedure is not to predict the ethnicity of buyers and sellers
in the assessor data, so the performance of the classifier should not be evaluated based on the in-
sample mis-classification rate for the Olympic Games rosters; rather, performance should be based
on the out-of-sample mis-classification rate for the assessor data. Given the number of unique
names in the Olympic Games roster data is comparable to the number of Olympians, overfitting
is likely a problem. Because of this, we use an `1 regularized logistic regression commonly used
in the statistical learning literature (Hastie et al., 2015). Regularizing the coefficients using the `1
norm yields coefficient estimates that have lower out-of-sample mis-classification errors compared
to un-regularized estimators or alternative coefficient regularizations (Ng, 2004).
3 Empirical Analysis
We estimate hedonic price models explaining variation in residential real estate transaction prices
in King County, Washington to assess the relationship between the presence of lucky or unlucky
numbers in addresses and transaction prices. The hedonic models contain indicator variables for
individual buyers and sellers who we classify as Chinese. We classify based on name using the
5

rosters of the athletes on the Chinese and US Summer Olympic Games over a 60 year period. The
data sources and estimation methods used are described in detail below.
3.1 Data
The data sets used in this study come from two sources. The first data set includes the rosters
of all Summer Olympic Games athletes from the United States and China beginning 1948 and
ending 2012. These data form the basis for the supervised learning procedure used to identify
individuals as Chinese; this procedure is described in detail below. The Summer Olympic national
team rosters were downloaded from the Sports Reference website.4 Figure 1 shows the 100 most
common names appearing on the US and China national Olympic teams over the 1948-2012 period.
On Figure 1, the larger the typeface for the name, the more frequently that name appeared on the
lists of Summer Olympic Games national teams. Olympic Games team rosters contain both males
and females, and the team members must meet specific residence and citizenship requirements in
order to appear on the national team for each country. These features makes Olympic Games team
roasters an ideal choice for developing representative lists of names by country.
The second data set comes from the King County Assessor’s Office.5 This data set includes
information on all real estate transactions occurring in King County beginning January 1, 1990
and ending December 31, 2015. The data set includes information about both the property (type
of property, type of transaction, address, etc.), the transaction price, the buyer name and the seller
name. We use data on the sale of single-family homes. After removing 1% of outlying observations
based on a preliminary hedonic regression, the final sample contains 508,916 single family home
sales in King County over the period 1990-2015.6
Summary statistics for commonly reported property attributes are reported in Table 2. The
King County Assessor’s Office records contain more than 500,000 residential single family home
real estate transactions with complete information on dwelling characteristics and buyer and seller
names. The average residential property transacted during the sample period was built in 1978,
had a price of $330,555, just under 2,000 square feet of living space, 3.3 bedrooms and about 1.5
4http://www.sports-reference.com/olympics/5http://www.kingcounty.gov/depts/assessor.aspx6Based on deed records available on the King County Assessor’s website, a significant portion of the outlying
observations were found to be non arms-length transactions including inter-family transfers.
6
bathrooms.
We identify individuals as having a Chinese cultural or ethnic background based on name alone
using a classification system based on the names of Summer Olympians on the national teams of
China and the US. Based on the classification system described in detail below, we calculate the
probability that a given buyer’s name comes from the set of Chinese Summer Olympians. Alter-
natively, the supervised learning procedure allows us to calculate, Pr (ChinaBuyer). Using this
probability, we create an indicator variable chinaBuy which is equal to 1 if 0.8 < Pr (ChinaBuyer)
and equal to zero otherwise. Alternative cutoff values for this indicator variable were considered,
but changing the threshold probability did not alter the empirical results in any meaningful man-
ner.7 The probability Pr (ChinaSeller) and indicator variable chinaSell are created in a similar
manner using seller names.
Summary statistics for the probabilities and indicator variables, and the appearance of 8 s and
4 s in addresses, are also shown on Table 2. 4.3% of all buyers are classified as having a name
suggesting a Chinese cultural background and 1.9% of all sellers are classified as such. About 33%
of the houses in the sample have an 8 in the address, and about 45% have a 4 in the address.
About 9% of the homes transacted in the sample have 4 or 8 as the final digit in the house price.
3.2 Classifying Buyer and Seller Ethnicity
For each n = 1, ..., N , define an indicator variable yn = 1 if the Olympic athlete is on China’s
national team and yn = 0 if the Olympic athlete is on the US national team. Using this binary
variable, the probability that an Olympic athlete will be from either China or the United States
is calculated using a logit function. Because of the binary nature of the dependent variable, we
consider this a binomial classifier.
The explanatory variables for the logit model are created from the full names present in the
Olympic team rosters. In doing so, we assume each full name on the Olympic team rosters can
be represented by an exchangeable collection chosen from P tokens. The exchangeable assumption
implies that we make no distinction between first and last names. Alternatively, each full name Fn
can be represented as a P × 1 vector Xn with elements Xnp. Here, Xnp = 1 if the pth token is in
Fn and Xnp = 0 otherwise. For instance, the associated vector Xn for Fn = {Michael, Phelps}7We investigated cutoff values in the set {0.2, 0.25, ..., 0.9, 0.95}
7
has a 1 in the element associated with Michael, a 1 in the element associated with Phelps, and
0 everywhere else. Using these explanatory variables, we then model the probability that yn = 1
using
Pr(yn = 1|Xn, φ) =eφ0+
∑pXnpφp
1 + eφ0+
∑pXnpφp
(1)
In Equation (1), when 0 < φp, the presence of token p increases the likelihood that Fn comes from
the Chinese Olympic team roster, and vice-versa for φ < 0. When φp = 0, token p does not help
to predict yn. The parameter φ0 controls the unconditional Pr(yn = 1).
For fixed P , the φp can be consistently estimated using the maximum likelihood estimator. In
the Olympic Roster setting at hand, the assumption of fixed P is difficult to defend as there are
6,502 unique names across 9,836 Olympic athletes from both the United States and China. For
explanatory variable sets of this dimension, maximum likelihood solutions are at worst degenerate
when N < P and at best unreliable when P ≈ N (Hastie and Qian, 2014). A practical approach
is to decrease P by using only names that occur some minimum number of times in the data. In
this case, modest filtering rules result in a large P while more aggressive filtering rules will remove
names with significant predictive power. We retain the P = 615 names that occur 5 or more times
in the data. In unreported results, we find that the results are not sensitive when using 10 or 20
as the cutoff value for the number of appearances of names on the team rosters.
Because P remains large even after filtering out the less common names, we utilize a penalized
likelihood procedure that prevents overfitting the logit model. In particular, we place an `1 penalty
on the individual φp parameters and minimize the following penalized likelihood function
−∑n
Pr(yn = 1|Xn, φ)yn [1− Pr(yn = 1|Xn, φ)]1−yn + λ∑p
|φp| (2)
The parameter λ is a tuning parameter.89 Define the solution to Equation (2) as φ∗. By using the
`1 penalty on φp, some entries of φ∗ are exactly equal to 0. As mentioned above, when φ∗p = 0,
token p cannot be used to classify yn. With this interpretation, minimizing Equation (2) performs
8In our analysis, we select λ using 5 fold cross-validation. The results are robust to λ near the cross-validatedchoice of λ
9We use the glmnet package in R to solve Equation 2. The solution is found by using a quadratic approximationto the true penalized likelihood.
8
both variable selection and coefficient estimation.
In any event, by including the penalty term λ∑p |φp|, φ∗ can be used to reliably classify names
out-of-sample as it is less likely to overfit the data in-sample, (Ng, 2004). For our application,
out-of-sample performance (mis-classification) is fundamental to our results. In particular, we
tokenize buyer names in a manner identical to the tokenization procedure applied to the names
in the Olympic Games team rosters; using the tokens in the buyer names, we then calculate
Pr (ChinaBuyer) using φ∗ and 1. A similar procedure is carried out using seller names in order to
calculate Pr (ChinaSeller).
3.3 Estimating Cultural Effects Using a Hedonic Price Model
In order to isolate the response of Chinese buyers and sellers to certain numbers, we use the property
address recorded in the King County Assessors Office real estate transactions database. In these
data, the property address includes both the building number and street number. For example,
108 Main Street has a single 8 in the address while 108 8th Street has two 8 s in the address. In the
transaction data, we convert all character representations of numbers to numerics. For instance,
108 Eighth Street is converted to 108 8th Street.
Indicator variables for the presence of 8 s and 4 s are created using the property address. The
variable any8 = 1 if there is any 8 in the property address and any8 = 0 otherwise. The variable
total8 is equal to the total number of 8 s in the property address. In order to determine if the
building number and street have different effects, we set building8 = 1 if the building number
contains an 8 and building8 = 0 otherwise. Likewise, we set street8 = 1 if the street has any 8 s
and street8 = 0 otherwise. Following Fortin et al. (2014), we also create buildingLast8 = 1 if the
last digit of the house number is equal to 8 and set buildingLast8 = 0 otherwise. Indicators for
the number 4 are created in a similar manner.
We estimate a hedonic model in order to determine if individuals with a Chinese cultural
background are willing to pay more or less for a single family home based on the numbers found in
the address. We estimate the following hedonic price model for house i in zip code z sold at time
period t
pizt = xiztβ + ψzizt + µzt + uizt. (3)
9
pizt is the log of the sale price, xict includes the log square footage of the property, zizt includes
the indicator variables for numbers appearing in the street address (any8, total8, buildingLast8,
chinaBuy, chinaSell) and the relevant interaction terms (any8 × chinaBuy, any8 × chinaSell,
etc.), µzt is a Zip Code - Year fixed-effect that captures time-varying unobservable neighborhood
heterogeneity, and uizt is an unobservable error term capturing other factors that affect residential
property transaction prices. We cluster-correct the estimated standard errors in Equation (3) at the
Zip Code-year level to account for unobservable factors affecting housing prices correlated across
single family homes in the same Zip Code in each year.
In Equation (3), the coefficients for chinaBuy and chinaSell indicate if individuals with Chinese
cultural preferences for specific numbers pay more or less for residential properties with those
numbers in the address. When the coefficient on chinaBuy is positive, Chinse buyers pay a premium
when purchasing a residential property. Of course, as the hedonic model will never fully capture the
true quality of a property, and a positive coefficient on chinaBuy can also indicate that individuals
with a Chinese background purchase properties with higher unobserved quality.
Our primary variable of interest are the interaction terms any8× chinaBuy and the like. The
coefficient on any8×chinaBuy indicates any premium or discount individuals identified as Chinese
by the ethnic-name matching procedure pay when purchasing properties with any 8 s in the property
address. This premium or discount is attributable solely to the actual numbers in the property
address and, by the inclusion of chinaBuy as a stand-alone coefficient, is in addition to any market
wide premium paid by individuals with a Chinese background. If Chinese buyers factor in Chinese
numerology when purchasing a property, we expect the coefficient on any8× chinaBuy and other
interaction terms that include chinaBuy to be positive.
Of course, if the properties that include 8 s and are purchased by Chinese are of higher quality,
a positive coefficient on any8 × chinaBuy will indicate unobserved quality and not the influence
of Chinese numerology. In order to rule this out, we are also interested in the coefficient on the
interaction term any8 × chinaSell. If the coefficient on any8 × chinaSell is not different from
0, there is no evidence that properties that are sold by Chinese and include an 8 in the address
are of higher or lower quality. Alternatively, a positive coefficient on any8 × chinaBuy and a 0
coefficient on any8 × chinaSell is indicative of Chinese buyers paying a premium for properties
paying a premium for properties based solely on the presence of an 8 in the address.
10

Using the ethnicity of the buyer and seller allows us to explicitly identify the effects of Chinese
buyers and sellers in the marketplace. This is in contrast to Bourassa and Peng (1999) and Fortin
et al. (2014) which interact an indicator variable for census units that include a large portion
of Chinese, chineseTract, and with indicators for 8 in the address, i.e., any8 × chineseTract.10
This subtle difference is important if non-Chinese recognize the effects of Chinese numerology and
purchase properties for speculative purposes. That is, a positive coefficient on any8×chineseTract
is indicative of the value of the number 8 for both Chinese and non-Chinese alike, while a positive
coefficient on any8× chinaBuy identifies an effect specific to Chinese buyers.
4 Results
4.1 Ethnic-Name Matching
Estimates of φ∗, the name matching parameter from Equation (1), with the largest estimated values
are displayed in Table 1. Names that most strongly predict being on the United States Olympic
team roster are kevin, amy, michael. Names that most strongly predict being on the Chinese
Olympic team roster are li, yin, xu. Using Equation 1, the implied Pr(yn = 1) for kevin, amy,
michael is equal to 0 when rounding to 6 digits; the implied Pr(yn = 1) for li, yin, xu is equal to 1.
Thus, the presence of any of these names alone in any buyer or seller name is a strong indication
of ethnicity.
Not surprisingly, the strongest predictors are names that are among the most frequent names
in Figure 1. However, there is not a direct correlation between frequency of name appearance on
team rosters and predictive power. For instance, dan, lou, lee, long are found on both Chinese
and United States Olympic team rosters; dan occurs 17 (39) times in the United States (Chinese)
Olympic rosters and is not a strong indicator of ethnicity. As mentioned above, the `1 penalty in
Equation 2 is such that φ∗ for weak predictors are set exactly to 0. Not surprisingly, the associated
φ∗ for the 15 names that occur in both the Chinese and United States rosters are equal to 0. These
coefficient values indicate that these 15 names cannot be used to predict ethnicity in the property
transaction data.
10Bourassa and Peng (1999) identify tracts based on immigration and Fortin et al. (2014) identify tracts based oncensus data.
11

Using φ∗, the probability that a buyer or seller has a Chinese cultural background can be
calculated using Equation 1. Figure 2 displays the empirical cumulative distribution for these
probabilities for the entire set of buyers and sellers. In the data, 3.5% of the transactions have a
buyer name with 0.95¡Pr(Chinese Buyer). A manual inspection of the names by several Chinese
nationals confirms this high predicted probability. As mentioned above, we create indicator vari-
ables for whether or not a Chinese individual buys or sells a property using a cutoff probability.
Based on Figure 2, our cutoff value of 0.8 appears to be appropriate. As indicated in Table 2, 4%
of transactions are classified as involving Chinese buyers, and 1.7% of transactions are classified as
involving Chinese buyers.
The number of transactions that involve an individual with Chinese ethnicity varies across time.
Figure 3 shows the fraction of transactions that included either a Chinese buyer or seller over the
sample period. The fraction of Chinese buyers increased at a steady rate beginning in 1990 through
2008. After 2008, the fraction of Chinese buyers increased more rapidly, peaking at more than 8%
of all buyers in 2013. In contrast, the percentage of Chinese sellers exhibits more steady growth
rate throughout the sample period.
The percentage of Chinese buyers and sellers also varies across location. Figure 4 shows the
fraction of Chinese buyers in King County by census tract. The fraction of Chinese buyers appears
to be highly concentrated in two locations with more than 20% of buyers being Chinese. Similarly
high home ownership rates and clustering patterns among Chinese is also reported by Painter et al.
(2004) in their study on the Los Angeles Consolidated Metropolitan Statistical Area.
The first cluster of Chinese buyers is in the Beacon Hill area of Seattle just east of I-5 and the
Seattle-Tacoma International Airport. It is interesting to note that the Chinatown International-
District is located 3 miles north of the Beacon Hill area.11 The second location is the Newcastle /
Cougar Hills area south of I-90 and east of I-405. Figure 5 displays the locations of the individual
properties where a buyer is Chinese. While transactions involving Chinese buyers are distributed
across King County, clusters of transactions involving Chinese buyers can also be seen on Figure
5. Graphs of Chinese sellers exhibit similar clustering.
In fact, residential clustering or agglomeration exists among Chinese and also among other ethic
groups. Haurin and Rosenthal (2009) find evidence of residential agglomeration among Hispanic
11http://www.visitseattle.org/visitor-information/
12

households and prior proximity to other Hispanic homeowners increases the propensity to own a
home.
4.2 Hedonic Results
We focus on whether or not individuals with a Chinese background are willing to pay more (less) for
single family homes with addresses that contain specific lucky (unlucky) numbers based on Chinese
cultural preferences for numbers. Preferences for specific numbers could depend on the position
of a number in an address or the frequency with which a number appears in an address. Fortin
et al. (2014) focus on the case where the last digit of the single family home address is a 4 or 8,
under the assumption that the final sound carries more importance. Shum et al. (2014) focus on
apartments on the fourth or eighth floor of high-rise buildings. Agarwal et al. (2016) focus on the
last digit of floor and unit numbers in Singapore where two digit floor (ff) and unit (uu) numbers
take the general form ff-uu.
We take a more general approach to identifying luck or unlucky addresses. We estimate hedonic
price models that include indicator variables four different measures of the number of lucky or
unlucky numbers in an address. The first, labeled Model 1 on the results tables, contains an
indicator variable (any8 and any4 ) for the presence of an 8 or 4 anywhere in the dwelling address.
The second, labeled Model 2 on the results tables, contains a variable (total8 and total4 ) reflecting
the total number of 8s and 4s in an address. The third, labeled Model 3 on the results tables,
contains an indicator variable (buildingAny8 and buildingAny4 ) for the presence of an 8 or 4 in
the house number. A single family home at 248 8th Street would have any8=1, buildingAny8=1,
and total8=2 ; a single family home at 81 Main Street would have any8=1, buildingAny8=1, and
total8=0.
The final model specification, labeled Model 4 on the results tables, contains an indicator
variable (buildingLast8 and buildingLast4 ) for the presence of an 8 or 4 as the last digit of the
house number. This specification matches the one used by Fortin et al. (2014). We interact all
these indicator variables with indicator variables for Chinese buyers and sellers, which allows for
the effect of cultural preferences to vary depending on which party in the transaction has these
preferences.
The results for the hedonic regression in Equation (3) are presented in Table 4. All models
13

contain indicator variables for transactions with Chinese buyers and sellers. The estimated pa-
rameters on these stand-alone indicator variables are all negative and statistically different from
zero; Chinese home buyers and sellers in King County tend to be involved in single family home
transactions associated with houses with relatively lower prices than other home buyers and sellers
in King County. This could reflect lower than average income among Chinese home buyers and
sellers, a preference for neighborhoods with relatively less expensive homes, a preference for lower
quality houses, or bargaining power, Harding et al. (2003).
The results from Model 1 indicate that there is no significant pricing difference for a property
address with an 8 in it across King County. The parameters of interest are the estimates on the
interaction of the presence of an 8 in the address and a Chinese buyer or seller. Chinese buyers are
willing to pay a 1.7% premium for a property addresses that includes an 8. Chinese sellers receive
a 1.4% premium when selling a property with an 8 in the address, no matter what the ethnicity
of the buyer is. The results from Model 1 confirm the results in (Fortin et al., 2014) that Chinese
individuals are willing to pay a premium for properties where the address contains a lucky number.
Columns 2 - 4 of Table 4 investigate alternative specifications for the presence of 8 s in addresses.
Model 2 includes a variable reflecting the total number of 8 s in the property address. Again, the
presence of an 8 in an address does not carry any premium in the overall sample. Chinese home
buyers are willing to pay a 1.4% premium for each 8 in a home’s address. Compared to the results
from Model 1, this suggests that the buyer premium for 8 s in an address does not decline much
with the number of 8 s in the address. Chinese home sellers receive a 0.9% premium for each 8 in
an address. The results from Model 3 indicate that the buyer and seller premium for 8 s appearing
in the house number are similar to the premium for an 8 anywhere in the address.
Model 4, in column 4 on Table 4 contains an indicator variable for houses where the final digit
of the house number is 8. The average single family home transaction in King County involving a
dwelling with an 8 as the final digit of the house number does not carry any premium compared
with other transactions. However, when the seller is Chinese, the house commands a 2.1% premium.
Table 5 repeats the same analysis for the case of 4 s appearing in addresses. Again, Chinese
buyers purchase single family homes for a price 2.0% to 2.4% below average and sell single family
homes at a price about 5.3% below average in King County. The evidence supporting a discount
associated with the presence of a 4 in the address when the buyers or sellers are Chinese is weaker
14
than the evidence that the presence of an 8 commands a premium. The results indicate no statis-
tically significant discount when any 4 appears, multiple 4 s appear, or the house number contains
a 4. The only evidence of a discount appears when the the last digit of the house number is a 4. In
this case, there is a 1.2% discount when the buyer of a house with 4 as the last digit of the house
number is Chinese.
4.3 Discussion
The results suggest that single family home transaction prices in Seattle, Washington reflect cul-
tural preference for lucky and unlucky numbers. King County has a diverse population that includes
about 15% of the population identifying themselves as Asian in the 2010 Census. This is a substan-
tially more diverse ethnic mix than the setting examined by Agarwal et al. (2016) and Shum et al.
(2014), who analyze the premium (discount) associated with the presence of 8 (4 ) in majority Chi-
nese settings. Chinese in Seattle interact more frequently with people from a western background
than residents of China or Singapore, and are also continually bombarded by media with a western
orientation. Some Seattle residents we identify as Chinese could be second, third forth or more
generation Chinese-Americans. These results suggest that Chinese cultural preferences for specific
numbers persist over time, and in the presence of significant interaction with non-Chinese cultural
preferences.
The estimated premia associated with the presence of 8 s in addresses, and the estimated dis-
count associated with the presence of 4 s in addresses, in this paper are smaller than those reported
in Fortin et al. (2014), and substantially smaller than those reported in Shum et al. (2014). The
data used by Shum et al. (2014) come from a city in China, where cultural preferences for numbers
should be substantially stronger than in Seattle. Fortin et al. (2014) have no information about
the ethnicity of buyers and sellers; instead, they exploit information about the demographic char-
acteristics of the Census Tracts where the houses are located in Vancouver. Because of this, their
estimates could reflect both the influence of cultural preferences and speculative purchases designed
to exploit known cultural preferences. Since we know the names of buyers and sellers, and can infer
the ethnic background of the buyers and sellers, our estimates do not reflect speculative purchases
effects which. Given the smaller coefficient estimates, it is possible that this speculative is much
larger than the pure effect attributable to Chinese buyers.
15
Our results reveal systematic differences in premia and discounts for Chinese buyers and sellers
of single family homes. Chinese sellers of dwellings with house numbers ending in 8 receive a 2.1%
premium relative to non-Chinese sellers of such dwellings. This could reflect a real estate markets
where sellers have greater relative bargaining power than buyers. These differences may reflect
different relative bargaining power in the Seattle real estate market. Harding et al. (2003) show
the conditions under which parameters from an hedonic model can be used to infer information
about bargaining power in real estate markets. Willingness to pay by Chinese buyers for a house
with an 8 in the address exceeds the seller’s premium. This could reflect a real estate market
where buyers generally have greater relative bargaining power than sellers. Chinese sellers may
sometimes face pools of buyers containing only non-Chinese prospective buyers; this would reduce
the average estimated premium for a house with an 8 in the address. Chinese buyers may also
face competing bids from non-Chinese bidders, forcing them to increase their bid on a house with
a desirable address.
Shum et al. (2014) find that apartments with preferred numbers in the address sell faster than
apartments with non-preferred numbers in the address. Unfortunately, we lack assess to data on
how long the single family homes in this sample were on the market. This is a possible avenue for
future research.
4.4 Falsification Test: Korean Buyers and Sellers
As a falsification test on the results above, we assess the validity of our classifier, and investigate
whether or not Korean buyers and sellers pay more for properties with an 8 in the address. Unlike
Chinese numerology, there does not exist any evidence that the number 8 is lucky or unlucky in
Korean numerology. Therefore, testing for price effects attributable to Korean buyers and sellers
in the assessor data provides an interesting counterfactual. That is, we do not expect to find any
significant price effects for Korean buyers and properties with an 8 in the address.
It is possible to perform the counterfactual experiment by estimating a binomial classifier using
Korean and US Olympians. However, we instead use a multinomial classifier that can simultane-
ously classify names into one of three groups.12 That is, we use the Summer Olympic rosters for
China, South Korea, and the US and estimate a multinomial version of Equation (1). Details of
12As described in the appendix, the multinomial classifier is not limited to three groups.
16

the multinomial classification procedure are described in the Appendix.
Using a multinomial classifier instead of a binomial classifier can also lead to a decrease in
classification error. For instance, chang is a common name in China. The coefficient for chang in
Equation 1 is positive and indicates the presence of chang increases the likelihood that an individual
is from China. However, chang is also an extremely common name in South Korea. Therefore, the
binomial classifier might erroneously classify Koreans as Chinese. As such, the resulting estimates
in Tables 4 and 5 include a measurement error. Extending the classification scheme by allowing
for a Korean class in the mutinomial classifier provides for an interesting counterfactual to validate
the results for Chinese and also mitigates the classification error of buyers and sellers due to the
limited number of possible types (2) in the binomial classifier.
Like the analysis above, we estimate a penalized multinomial likelihood, calculate probabilities
Pr (ChinaBuyer), Pr (KoreanBuyer), and create the indicators chinaBuy and koreaBuy using
the same 0.8 cutoff used in the binomial classifier. Indicators for sellers are created similarly. The
names with the largest coefficients for each country in the multinomial classifier are presented in
Table 7. The total number of buyers and sellers for each type are presented in Table 6. Next, we
include the indicators and the relevant interactions in a hedonic model and separately estimate the
models for Chinese and Korean buyers and sellers.
Results for the Chinese buyers are presented in Table 8. Results for the Korean buyers are
presented in Table 9. The results for the Chinese buyers and sellers are comparable to the re-
sults in Table 4. We find further evidence that Chinese buyers are willing to pay a slight pre-
mium for properties that include an 8 in the address. Interestingly, the significant results in for
buildingLast8×chinaSell in Table 4 are no longer significant in Table 8. Furthermore, as expected,
we find that Korean buyers do not pay a premium for properties that include an 8 in the address.
The null result for Koreans in Table 9 and the significance for Chinese in Table 8 provides us
with three important takeaways. First, there is further evidence that Chinese buyers are willing to
pay more for properties that include 8 s in the address. Second, including a similar but different
alternative classification procedure can be used to reduce mis-classification error. Third, the multi-
nomial classifier can be used as simple falsification test that validates conclusions from a binomial
classifier when using name-ethnicity procedures.
17

5 Conclusion
A growing body of evidence suggests that superstitious beliefs about numbers can affect economic
outcomes. We use a novel, supervised learning approach to identifying the ethnicity of single family
home buyers and sellers in King County, Washington over a fifteen year period. The results reveal
that the presence of the number 8 in an address has a expected premium for Chinese buyers of
1.7%. A similar premium also exists in other numeric formats, including the total number of 8 s in
the address and an 8 as the final digit of the house number. However, the presence of the number
4 in an address does not generate a substantial discount.
The results in this paper extend economists’ understanding of the extent to which superstitious
beliefs can affect economic outcomes. Our results come from a relatively heterogenous setting. The
city of Seattle is ethnically and culturally diversity, and many of the ethnic Chinese buying and
selling houses during the study period could have lived in the US for generations. The presence
of a statistically significant relationship between a proxy for the presence of cultural preferences
for specific numbers and single family home prices indicates that these preferences are relatively
durable, even in the presence of different cultural preferences for numbers in the majority of residents
of the area. The numbers 8 and 4 have no special significance in western culture as there is no
effect for property addresses that include 8, in general.
In addition, the supervised learning approach to identifying ethnicity based only on names
used here can be applied in a number of other settings where quantitative data on language is
used (Davis and Abdurazokzoda, 2015). Researchers often use data where names are available
but information on ethnicity is not. For example, government regulators, elected officials, political
candidates, CEOs, Corporate Board members, judges, and athletes on professional sports teams
are often identified by name. However, information about their ethnic background is often limited
but is of significant interest to researchers. The supervised learning approach used here can be
applied in all these settings in order to assess the likely ethnic background of individuals.
References
Agarwal, S., He, J., Liu, H., Png, I. P., Sing, T. F., and Wong, W.-K. (2016). Superstition,
conspicuous spending, and housing markets: Evidence from Singapore. IZA Discussion Paper,
18

No. 9899.
Ambekar, A., Ward, C., Mohammed, J., Male, S., and Skiena, S. (2009). Name-ethnicity classifi-
cation from open sources. In Proceedings of the 15th ACM SIGKDD International Conference
on Knowledge Discovery and Data Mining, pages 49–58. ACM.
Bourassa, S. C. and Peng, V. S. (1999). Hedonic prices and house numbers: The influence of feng
shui. International Real Estate Review, 2(1):79–93.
Burchard, E. G., Ziv, E., Coyle, N., Gomez, S. L., Tang, H., Karter, A. J., Mountain, J. L.,
Perez-Stable, E. J., Sheppard, D., and Risch, N. (2003). The importance of race and ethnic
background in biomedical research and clinical practice. New England Journal of Medicine,
348(12):1170–1175.
Chau, K. W., Ma, V. S. M., and Ho, D. C. W. (2001). The pricing of “luckiness” in the apartment
market. Journal of Real Estate Literature, 9(1):29–40.
Coldman, A. J., Braun, T., and Gallagher, R. P. (1988). The classification of ethnic status using
name information. Journal of Epidemiology and Community Health, 42(4):390–395.
Davis, L. S. and Abdurazokzoda, F. (2015). Language, culture and institutions: Evidence from a
new linguistic dataset. Journal of Comparative Economics, 44(3):541–561.
Fiscella, K. and Fremont, A. M. (2006). Use of geocoding and surname analysis to estimate race
and ethnicity. Health Services Research, 41(4p1):1482–1500.
Fortin, N. M., Hill, A. J., and Huang, J. (2014). Superstition in the housing market. Economic
Inquiry, 52(3):974–993.
Gentzkow, M. and Shapiro, J. M. (2010). What drives media slant? evidence from US daily
newspapers. Econometrica, 78(1):35–71.
Gill, P. S., Bhopal, R., Wild, S., and Kai, J. (2005). Limitations and potential of country of birth
as proxy for ethnic group. BMJ: British Medical Journal, 330(7484):196.
Goodwin, K., Waller, B., and Weeks, H. S. (2014). The impact of broker vernacular in residential
real estate. Journal of Housing Research, 23(2):143–161.
19

Harding, J. P., Rosenthal, S. S., and Sirmans, C. (2003). Estimating bargaining power in the
market for existing homes. Review of Economics and Statistics, 85(1):178–188.
Hastie, T. and Qian, J. (2014). Glmnet vignette.
Hastie, T., Tibshirani, R., and Wainwright, M. (2015). Statistical learning with sparsity: the lasso
and generalizations. CRC Press.
Haurin, D. R. and Rosenthal, S. S. (2009). Language, agglomeration and Hispanic homeownership.
Real Estate Economics, 37(2):155–183.
Ng, A. Y. (2004). Feature selection, l 1 vs. l 2 regularization, and rotational invariance. In
Proceedings of the twenty-first international conference on Machine learning, page 78. ACM.
Ng, T., Chong, T., and Du, X. (2010). The value of superstitions. Journal of Economic Psychology,
31(3):293–309.
Nowak, A. and Smith, P. (2016). Textual analysis in real estate. Journal of Applied Econometrics,
In press.
Painter, G., Yang, L., and Yu, Z. (2004). Homeownership determinants for Chinese Americans:
Assimilation, ethnic concentration and nativity. Real Estate Economics, 32(3):509–539.
Shum, M., Sun, W., and Ye, G. (2014). Superstition and “lucky” apartments: Evidence from
transaction-level data. Journal of Comparative Economics, 42(1):109–117.
Taddy, M. (2013). Multinomial inverse regression for text analysis. Journal of the American
Statistical Association, 108(503):755–770.
Treeratpituk, P. and Giles, C. L. (2012). Name-ethnicity classification and ethnicity-sensitive name
matching. In Proceedings of the Twenty-Sixth AAAI Conference on Artificial Intelligence.
Woo, C.-K., Horowitz, I., Luk, S., and Lai, A. (2008). Willingness to pay and nuanced cultural
cues: Evidence from hong kongs license-plate auction market. Journal of Economic Psychology,
29(1):35–53.
Yang, Z. (2011). “Lucky” numbers, unlucky consumers. The Journal of Socio-Economics,
40(5):692–699.
20

Tables and Figures
Table 1: Olympic Athlete Names and Logit Coefficients
PANEL A: 10 Strongest Predictors for United States Olympians
Name Count Relative Frequency φ∗
kevin 40 0.004 -6.593amy 29 0.003 -5.824
michael 67 0.007 -5.514mike 112 0.011 -5.460bob 91 0.009 -5.378jim 89 0.009 -5.327bill 95 0.010 -5.326tom 81 0.008 -5.285steve 72 0.007 -5.184mark 57 0.006 -5.145
PANEL B: 10 Strongest Predictors for Chinese Olympians
Name Count Relative Frequency φ∗
li 274 0.028 5.775yin 10 0.001 5.764xu 60 0.006 5.712liu 138 0.014 5.701sun 61 0.006 5.679lin 42 0.004 5.468
song 26 0.003 5.239guo 37 0.004 5.181yu 52 0.005 5.146zhu 42 0.004 5.111
Table 1 shows the 10 strongest predictors for Summer Olympic national team members (φ∗s) for the UnitedStates and China based on the penalized logit estimator defined by Equation 2. Count is the total numberof times the name appears on both rosters; Relative Frequency is the percentage of times the name appears
on both rosters. The strength of the predictor is based on the absolute value of φ∗. Coefficients with morenegative (positive) values are strong indicators of a name coming from the United States (Chinese) SummerOlympic team.
21

Table 2: Summary Statistics
Statistic Min Mean Median Max St. Dev.
Sale Price ($1,000s) 45.000 330.555 275.000 1,700.000 208.834Square Feet of Living Space 480 1,986.760 1,880 4,850 775.857Year Built 1900 1967.660 1972 2014 27.600Bedrooms 1 3.328 3 6 0.841Bathrooms 1 1.498 1 3 0.590Sale Year 1990 2002.143 2002 2015 6.621pr(Chinese Seller) 0.000 0.041 0.002 1.000 0.125pr(Chinese Buyer) 0.000 0.061 0.001 1.000 0.191chinaSell 0 0.019 0 1 0.136chinaBuy 0 0.043 0 1 0.203Any 8 in Address 0 0.332 0 1 0.471Last Digit 8 in Address 0 0.088 0 1 0.283Any 4 in Address 0 0.453 0 1 0.498Last Digit 4 in Address 0 0.096 0 1 0.295
Real estate transaction data comes from the King County Assessor’s Office.
22
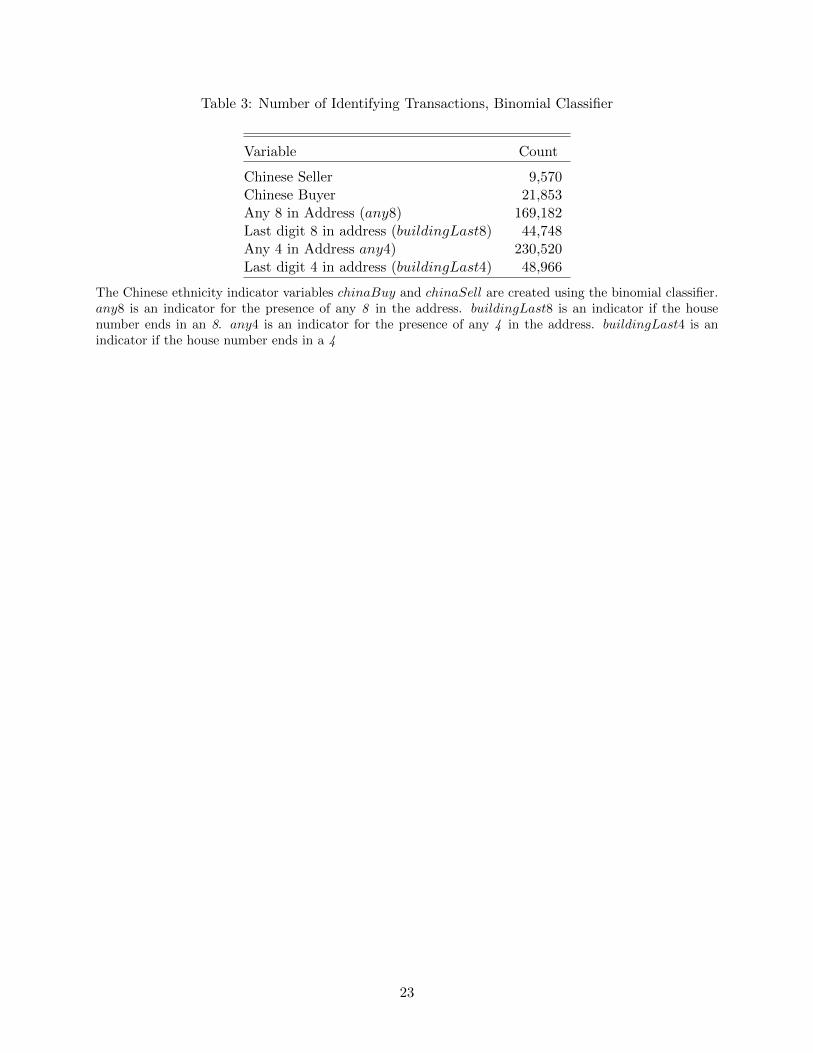
Table 3: Number of Identifying Transactions, Binomial Classifier
Variable Count
Chinese Seller 9,570Chinese Buyer 21,853Any 8 in Address (any8) 169,182Last digit 8 in address (buildingLast8) 44,748Any 4 in Address any4) 230,520Last digit 4 in address (buildingLast4) 48,966
The Chinese ethnicity indicator variables chinaBuy and chinaSell are created using the binomial classifier.any8 is an indicator for the presence of any 8 in the address. buildingLast8 is an indicator if the housenumber ends in an 8. any4 is an indicator for the presence of any 4 in the address. buildingLast4 is anindicator if the house number ends in a 4
23
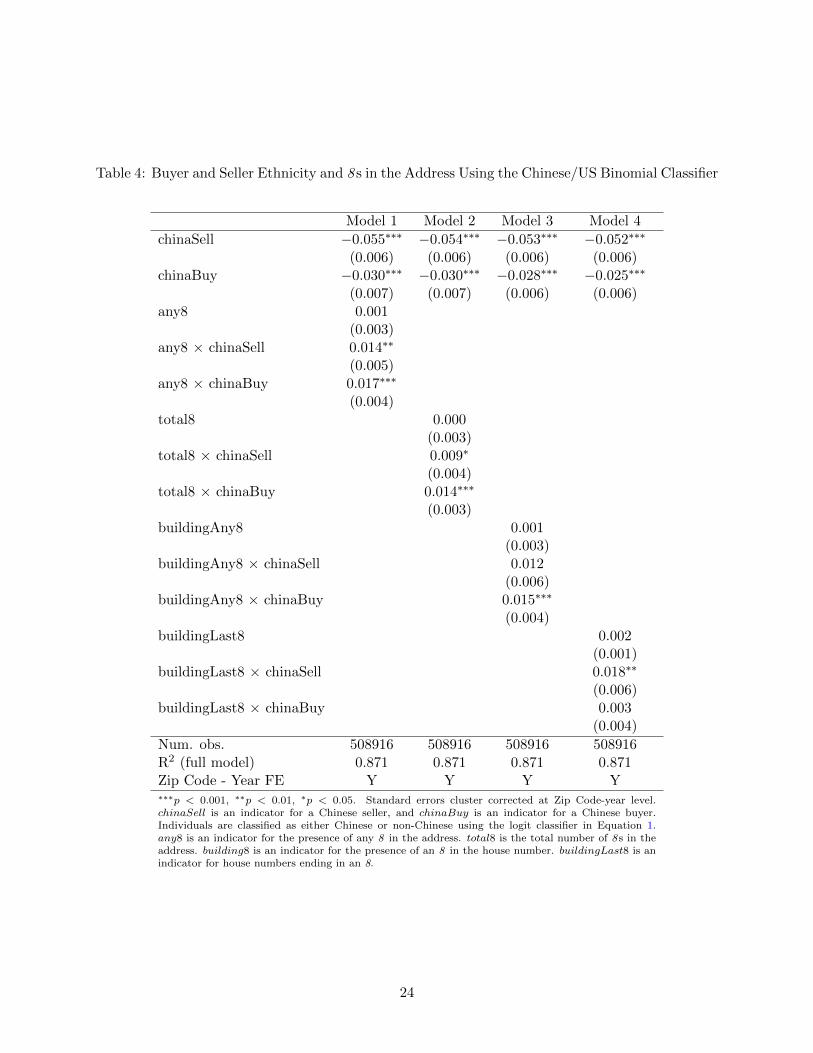
Table 4: Buyer and Seller Ethnicity and 8 s in the Address Using the Chinese/US Binomial Classifier
Model 1 Model 2 Model 3 Model 4
chinaSell −0.055∗∗∗ −0.054∗∗∗ −0.053∗∗∗ −0.052∗∗∗
(0.006) (0.006) (0.006) (0.006)chinaBuy −0.030∗∗∗ −0.030∗∗∗ −0.028∗∗∗ −0.025∗∗∗
(0.007) (0.007) (0.006) (0.006)any8 0.001
(0.003)any8 × chinaSell 0.014∗∗
(0.005)any8 × chinaBuy 0.017∗∗∗
(0.004)total8 0.000
(0.003)total8 × chinaSell 0.009∗
(0.004)total8 × chinaBuy 0.014∗∗∗
(0.003)buildingAny8 0.001
(0.003)buildingAny8 × chinaSell 0.012
(0.006)buildingAny8 × chinaBuy 0.015∗∗∗
(0.004)buildingLast8 0.002
(0.001)buildingLast8 × chinaSell 0.018∗∗
(0.006)buildingLast8 × chinaBuy 0.003
(0.004)
Num. obs. 508916 508916 508916 508916R2 (full model) 0.871 0.871 0.871 0.871Zip Code - Year FE Y Y Y Y∗∗∗p < 0.001, ∗∗p < 0.01, ∗p < 0.05. Standard errors cluster corrected at Zip Code-year level.chinaSell is an indicator for a Chinese seller, and chinaBuy is an indicator for a Chinese buyer.Individuals are classified as either Chinese or non-Chinese using the logit classifier in Equation 1.any8 is an indicator for the presence of any 8 in the address. total8 is the total number of 8 s in theaddress. building8 is an indicator for the presence of an 8 in the house number. buildingLast8 is anindicator for house numbers ending in an 8.
24

Table 5: Buyer and Seller Ethnicity and 4 s in the Address Using the Chinese/US Binomial Classifier
Model 1 Model 2 Model 3 Model 4
chinaSell −0.052∗∗∗ −0.053∗∗∗ −0.053∗∗∗ −0.051∗∗∗
(0.007) (0.007) (0.007) (0.006)chinaBuy −0.028∗∗∗ −0.028∗∗∗ −0.024∗∗∗ −0.024∗∗∗
(0.006) (0.006) (0.006) (0.007)any4 0.004
(0.003)any4 × chinaSell 0.004
(0.005)any4 × chinaBuy 0.007
(0.005)total4 0.003
(0.003)total4 × chinaSell 0.004
(0.004)total4 × chinaBuy 0.005
(0.003)buildingAny4 0.001
(0.002)buildingAny4 × chinaSell 0.006
(0.004)buildingAny4 × chinaBuy −0.001
(0.004)buildingLast4 −0.003
(0.001)buildingLast4 × chinaSell 0.006∗
(0.003)buildingLast4 × chinaBuy −0.012∗∗
(0.004)
Num. obs. 508916 508916 508916 508916R2 0.871 0.871 0.871 0.871Zip Code - Year FE Y Y Y Y∗∗∗p < 0.001, ∗∗p < 0.01, ∗p < 0.05. Standard errors cluster corrected at Zip Code-year level.chinaSell is an indicator for a Chinese seller, and chinaBuy is an indicator for a Chinese buyer.Individuals are classified as either Chinese or non-Chinese using the logit classifier in Equation 1.any4 is an indicator for the presence of any 4 in the address. total4 is the total number of 4 s in theaddress. building4 is an indicator for the presence of a 4 in the house number. buildingLast4 is anindicator if the house number ends in a 4.
25

Table 6: Multinomial Classifier Transaction Counts
Ethnicity Indicator Number of Transactions
chinaSell 7,464chinaBuy 19,287koreaSell 2,784koreaBuy 4,495
The ethnicity indicator variables chinaBuy and chinaSell, koreaBuy, and koreaSell are created using themultinomial classifier.
26

Table 7: Olympic Athlete Names and 10 Largest Multinomial Coefficients
China φ∗ Korea φ∗ United States φ∗
li 8.838 yeong 8.778 kevin 6.872liu 8.782 cheol 8.773 white 5.873xu 8.404 choi 8.702 michael 4.329zhu 8.313 ja 8.523 amy 3.777zhou 8.273 sin 8.487 david 3.215xie 8.190 hye 8.286 mike 3.091he 8.179 won 8.273 ann 3.070zhao 8.159 seung 8.248 bob 3.011guo 8.140 seong 8.022 bill 3.010shen 7.979 yeo 7.604 mary 2.992
Table 7 shows the 10 largest estimated regression coefficients associated with Chinese, Korean, and Americannames from the multinomial classifier.
27
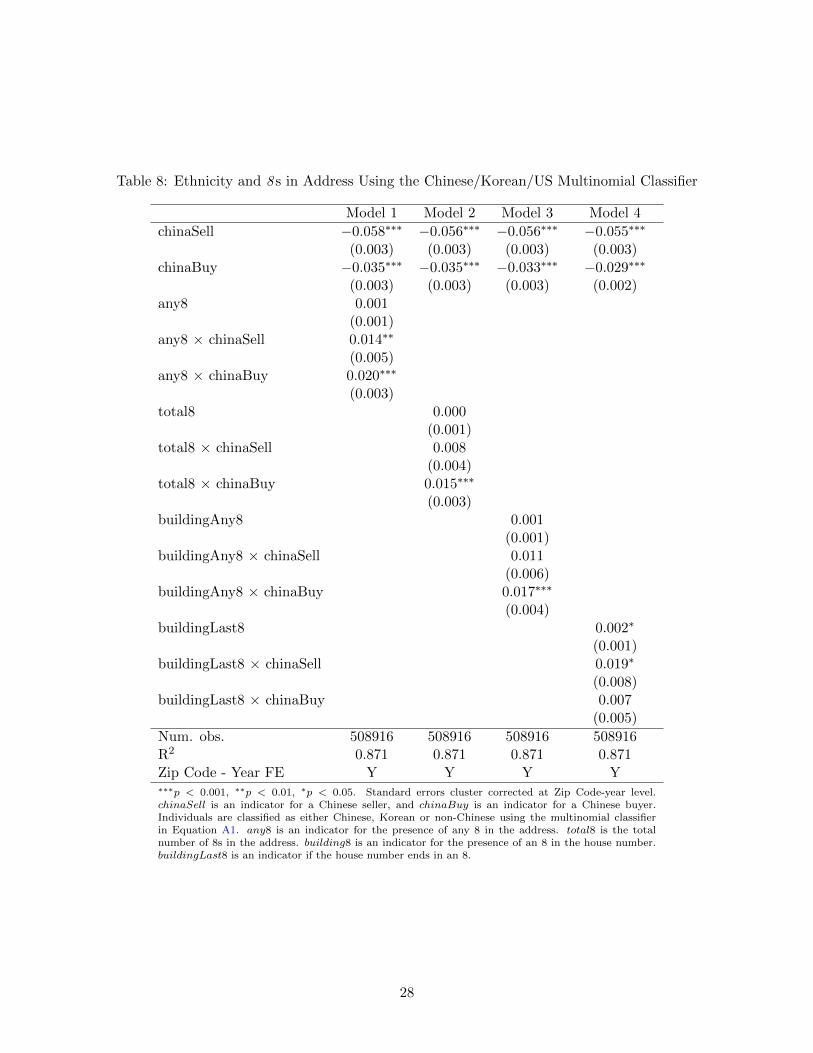
Table 8: Ethnicity and 8 s in Address Using the Chinese/Korean/US Multinomial Classifier
Model 1 Model 2 Model 3 Model 4
chinaSell −0.058∗∗∗ −0.056∗∗∗ −0.056∗∗∗ −0.055∗∗∗
(0.003) (0.003) (0.003) (0.003)chinaBuy −0.035∗∗∗ −0.035∗∗∗ −0.033∗∗∗ −0.029∗∗∗
(0.003) (0.003) (0.003) (0.002)any8 0.001
(0.001)any8 × chinaSell 0.014∗∗
(0.005)any8 × chinaBuy 0.020∗∗∗
(0.003)total8 0.000
(0.001)total8 × chinaSell 0.008
(0.004)total8 × chinaBuy 0.015∗∗∗
(0.003)buildingAny8 0.001
(0.001)buildingAny8 × chinaSell 0.011
(0.006)buildingAny8 × chinaBuy 0.017∗∗∗
(0.004)buildingLast8 0.002∗
(0.001)buildingLast8 × chinaSell 0.019∗
(0.008)buildingLast8 × chinaBuy 0.007
(0.005)
Num. obs. 508916 508916 508916 508916R2 0.871 0.871 0.871 0.871Zip Code - Year FE Y Y Y Y∗∗∗p < 0.001, ∗∗p < 0.01, ∗p < 0.05. Standard errors cluster corrected at Zip Code-year level.chinaSell is an indicator for a Chinese seller, and chinaBuy is an indicator for a Chinese buyer.Individuals are classified as either Chinese, Korean or non-Chinese using the multinomial classifierin Equation A1. any8 is an indicator for the presence of any 8 in the address. total8 is the totalnumber of 8s in the address. building8 is an indicator for the presence of an 8 in the house number.buildingLast8 is an indicator if the house number ends in an 8.
28

Table 9: Koreans and 8 s in the Address Using the Chinese/Korean/US Multinomial Classifier
Model 1 Model 2 Model 3 Model 4
koreaSell −0.029∗∗∗ −0.029∗∗∗ −0.030∗∗∗ −0.029∗∗∗
(0.004) (0.004) (0.004) (0.004)koreaBuy 0.007 0.006 0.006 0.008∗
(0.004) (0.004) (0.004) (0.003)any8 0.001
(0.001)any8 × koreaSell 0.001
(0.007)any8 × koreaBuy 0.007
(0.006)total8 0.001
(0.001)total8 × koreaSell −0.000
(0.006)total8 × koreaBuy 0.008
(0.005)buildingAny8 0.001
(0.001)buildingAny8 × koreaSell 0.005
(0.008)buildingAny8 × koreaBuy 0.012
(0.007)buildingLast8 0.003∗∗
(0.001)buildingLast8 × koreaSell 0.003
(0.013)buildingLast8 × koreaBuy 0.010
(0.010)
Num. obs. 508916 508916 508916 508916R2 0.871 0.871 0.871 0.871Zip Code - Year FE Y Y Y Y∗∗∗p < 0.001, ∗∗p < 0.01, ∗p < 0.05. Standard errors cluster corrected at Zip Code-year level.koreaSell is an indicator for a Chinese seller, and koreaBuy is an indicator for a Korean buyer.Individuals are classified as either Chinese, Korean or non-Chinese using the multinomial classifierin Equation A1. any8 is an indicator for the presence of any 8 in the address. total8 is the totalnumber of 8 s in the address. building8 is an indicator for the presence of an 8 in the house number.buildingLast8 is an indicator if the house number ends in an 8.
29

Figure 1: Olympic Athlete Names
Chinese National Team
ren
nan
xuying
gang
jing
bin
chentong
jie
haifeng
zheng
hou
wang shenpeng
du
wenxin
xie
zhou
yong
tang
ling
najin
gong
ye
liu deng
liang
xue
ning
guo
lu
hui
feng
yue
zhong
jiang
luo
qiang
cao
weifa
nzh
ao
linmin
sun
tan
hong
tian
zhu
qincheng
xia
qian
yu
boshi
sheng
liping
jun
matao
ji
huang
xiao
gao
gu
dong song
yipan
jian
heli
qing
yun
yuan
zhang
cai
jia
hua yao
dan
hao
meng
leihu
han
fu
yan
ping
qi
fei
yang
cui
wu
fang
United States National Team
henrywilliam
steve
toddken
billgary
bob
white
lewis
greg
david
crai
g
mattrichardmitchell
tim
taylor
dicksam
ryan
doug
mike
pete
larry
joe
paulkevin
charlie
johnson
smithcampbell
vandavejr
young
williams
amy
heather
jone
s
mary
cindy
jason
phil
adam
chris
anne
ed
geor
ge
thompson
don
al
bruce
charles
jeffkim
martin
moo
re
howard
allen
anderson
rick
ann
peter
karen
john
jackson
jack
nelson
rich
jennifer
hall
brown
james
danfrank
pat
lee
fred
eric
davis
terry
clark
jim
tony
michelle
scottbrian
ron
wilson
sarah
jon
tom
100 most frequent names appearing on the Summer Olympic Games rosters for each country. More frequentnames are indicated with a larger font.
30
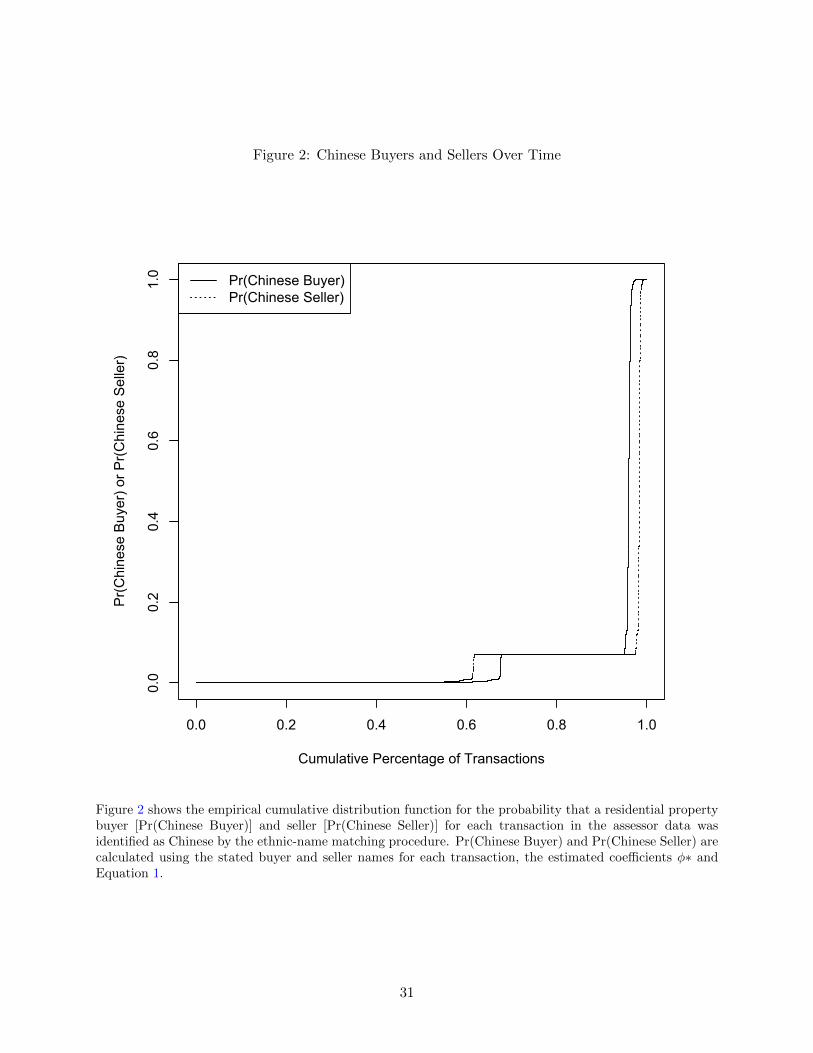
Figure 2: Chinese Buyers and Sellers Over Time
0.0 0.2 0.4 0.6 0.8 1.0
0.0
0.2
0.4
0.6
0.8
1.0
Cumulative Percentage of Transactions
Pr(
Chi
nese
Buy
er) o
r Pr(
Chi
nese
Sel
ler)
Pr(Chinese Buyer)Pr(Chinese Seller)
Figure 2 shows the empirical cumulative distribution function for the probability that a residential propertybuyer [Pr(Chinese Buyer)] and seller [Pr(Chinese Seller)] for each transaction in the assessor data wasidentified as Chinese by the ethnic-name matching procedure. Pr(Chinese Buyer) and Pr(Chinese Seller) arecalculated using the stated buyer and seller names for each transaction, the estimated coefficients φ∗ andEquation 1.
31

Figure 3: Chinese Buyers and Sellers Over Time
1990 1995 2000 2005 2010 2015
0.02
0.04
0.06
0.08
Year
Per
cent
Chi
nese
Buy
ers
and
Sel
lers
Percent Chinese BuyersPercent Chinese Sellers
Figure 3 displays the number of Chinese Buyers and Chinese Sellers as a percentage of total transactionsover time.
32

Figure 4: Fraction of Chinese Single Family Home Buyers by Census Tract
<5%5-10%10-15%15-20%20-25%
Figure 4 shows the number of Chinese single family home buyers in a given census tract as a percentage oftotal single family home transactions in the census tract. Total transactions begin January 1990 and endDecember 2015.
33

Figure 5: Location of Single Family Homes Purchased by Chinese Buyers
Figure 5 identifies the locations of single family homes bought by an individual identified as Chinese inSeattle over the period January 1990 to December 2015.
34

APPENDIX: Multinomial Classification Model
The multinomial classification model contains k = 1, ...,K types. Each individual n = 1, ..., N is
associated with a type yn ∈ {1, ...,K}. Given the vector of tokens Xn, the probability of being type
k is given by
Pr(yn = k|Xn, φ) =eφ0k+X′nφk∑k e
φ0k+X′nφk(A1)
In Equation (A1), φk = (φ1k, ..., φPk)′ is the P × 1 vector of parameters for type k. When 0 < φpk,
the presence of token p increases the likelihood that Fn is type k and vice-versa for φpk < 0. When
φpk = 0, token p does not help to predict type k. The parameter φ0k controls the unconditional
Pr(yn = k).
Line in Equation (2), we place an `1 penalty on the likelihood for the sample and minimize
−∑n
∏k
Pr(yn = k|Xn, φ)I(yn=k) + λ∑p
|φpk| (A2)
In Equation (A2), I(yn = k) = 1 if yn = k and I(yn = k) = 0 otherwise. As in Equation (2),
the shape of the penalty term λ∑p |φpk| induces a sparse solution that improves out-of-sample
performance.
35