currency thousand euros
TRANSCRIPT
1
2
Currency Thousand euros
Start of reporting period
End of reporting period
Address
Members of the Management Board
Commercial register number
Telephone
Fax E-mail
Website
Field of activity
1 January 2021
30 September 2021
Ädala Str 10, Tallinn, Estonia
Aleksandr Timofejev, Kristi Ojakäär
10257326
+372 62 62 200
+372 62 62 300
www.tallinnavesi.
ee
Production, treatment and distribution of water;
storm and wastewater disposal and treatment
Contents
Page
MANAGEMENT REPORT 3
MANAGEMENT CONFIRMATION
19
CONSOLIDATED STATEMENT OF FINANCIAL POSITION 20
CONSOLIDATED STATEMENT OF COMPREHENSIVE INCOME 21
CONSOLIDATED CASH FLOW STATEMENT 22
CONSOLIDATED STATEMENT OF CHANGES IN EQUITY 23
NOTES TO THE ACCOUNTS
NOTE 1. ACCOUNTING PRINCIPLES 23 NOTE 2. CRITICAL ACCOUNTING ESTIMATES 23 NOTE 3. CASH AND CASH EQUIVALENTS 24 NOTE 4. PROPERTY, PLANT AND EQUIPMENT 25 NOTE 5. INTANGIBLE ASSETS 26 NOTE 6. PROVISION FOR POSSIBLE THIRD-PARTY CLAIMS 26 NOTE 7. SEGMENT REPORTING 27 NOTE 8. STAFF COSTS 28 NOTE 9. COST OF GOODS/SERVICES SOLD, MARKETING AND ADMINISTRATIVE EXPENSES 29 NOTE 10. OTHER INCOME / EXPENSES 29 NOTE 11. FINANCIAL INCOME AND EXPENSES 30 NOTE 12. DIVIDENDS 30 NOTE 13. EARNINGS PER SHARE 30 NOTE 14. RELATED PARTIES 31 NOTE 15. LIST OF SUPERVISORY BOARD MEMBERS 32
3
MANAGEMENT REPORT
CEO’s Summary
In the 3rd quarter of 2021 AS Tallinna Vesi’s financial results were impacted by the changes in water consumption due to the spread of coronavirus. In the 3rd quarter, the company’s sales revenue increased, resulting mainly from the growth in consumption among commercial customers and higher sales of construction services. Given Estonia's macroeconomic forecast and developments of the pandemic, we expect a slight increase in the consumption of our water services during the next quarter.
Commercial customers’ consumption increased
AS Tallinna Vesi’s sales revenue in the 3rd quarter, were €13.61 million, being higher by 2.5% or €0.34 million compared to the same period in 2020. The increase in the sales revenue was driven by higher consumption in commercial customers and higher sales of construction services.
Sales to commercial customers increased by 3.0% to €3.83 million. The sales to commercial services were impacted by reopening Tallin’s hospitality businesses after the easing of coronavirus restrictions as well as an increase in the number of tourists visiting during the summer months.
Private customers’ sales were €4.89 million, showing a slight decline of 0.1%. Decrease was mainly caused by lower consumption volumes in apartment blocks, which is our biggest private customer group. Lower consumption of private customers was mainly related to the alleviation of coronavirus restrictions as people were returning to their offices after working from home. Also, a large number of Tallinn citizens being away from the capital during the summer months had its effect.
The company’s gross profit for the 3rd quarter of 2021 was €5.36 million, showing a decrease of 7.5% compared to the same period in 2020. The decrease in gross profit was related to higher cost of goods and services that were 10.3% more expensive than in the comparative period of last year.
AS Tallinna Vesi’s operating profit for the 3rd quarter of the year was €5.50 million, showing a decrease of €0.26 million compared to the same period in 2020. The operating profit both in the 3rd quarter of 2021 and of 2020 was impacted by a positive €1.20 million change in the provision formed for possible third-party claims.
Net profit for the 3rd quarter of 2021 was €5.34 million, showing a decrease of €0.30 million. The fall in net profit was mainly impacted by changes in operating profit.
Increasing investments in the networks
The quality of tap water remained good, both in the third quarter and throughout the nine months of the current year. A total of 2,243 water samples have been collected this year, of which 99.6% met all the quality requirements. The service reliability indicators also remain high. During the first nine months of 2021, the average water disruption lasted for 3 hours and 8 minutes. Compared to the same period last year, the leakage rate was somewhat higher, influenced by a few emergency incidents.
In the first nine months of 2021 the company reconstructed 6,600 m of water pipes and 5,800 m of sewerage pipes. Reconstruction works were done in cooperation with the City of Tallinn and energy group Utilitas. Large-diameter and strategically essential pipelines’ renovation has been completed on Kadaka Road and on-going on Kohila Street.
During the third quarter of 2021, 7% less blockages occurred in sewerage pipes than at the same time last year. Also, the number of collapses in sewerage pipelines have been positively satisfactory both during the nine months and in the third quarter of this year – in the last quarter, we had 26% less collapses in sewerage pipelines comparing to the same period last year. The reconstruction works on sewerage pipes have mainly been carried out by using environmental-friendly in no-dig methods, which allows to avoid excavating the roads.
The major project of reconstructing the mechanical treatment stage at Paljassaare Wastewater Treatment Plant was completed in September. With these large-scale construction works, the facilities and equipment of the first and most important stage of the wastewater treatment plant were renovated. It was the largest investment that the Company has made in the wastewater treatment plant during the past decade, with a
4
total cost of 7.8 million euros. This investment allows to maintain the excellent quality of effluent discharged to the sea, keeping the Baltic Sea clean, and ensuring resilient and efficient wastewater treatment for Tallinners. The renovation allows us to remove 20% more sand from the wastewater, already in the first treatment stage, which also has a positive effect on the efficiency for the rest of the treatment process.
Decreasing number of customer complaints
In addition to providing high-quality water and wastewater services, we also value the importance of maintaining a high level of customer service. We regularly measure the satisfaction of our customers and keep track of the promises made to them. Unfortunately, in the third quarter of 2021, we failed to keep two of the promises relating to informing customers. However, the number of customer complaints has decreased significantly both in the third quarter and during the first nine months of 2021. In the last nine months, the number of customer complaints has decreased 33% compared to the same period of last year.
In the first nine months of 2021, we responded to written requests within at least 2 working days in 98.9% of the time, which is a somewhat lower result than a year ago. Replies to written contacts have been delayed due to the construction activity that increased within the summer season. This increased the number of applications for technical specifications, project approvals and slowed down the speed of response time.
In the third quarter, we supported various events with our water tanks, helping to prevent unnecessary waste and improve environmental awareness among the community. In the 2021 summer season, the water tanks of AS Tallinna Vesi were present at about 40 events, including various sports, youth festivals and other public and community events, such as, Ironman Tallinn, weekly Stamina Health Run and lake runs. Also, The Investment festival, Gymnastics festival, musical production “Ocean”, Tallinn Old Town Days, Sail Tallinn, etc. We will continue providing water tanks also next year.
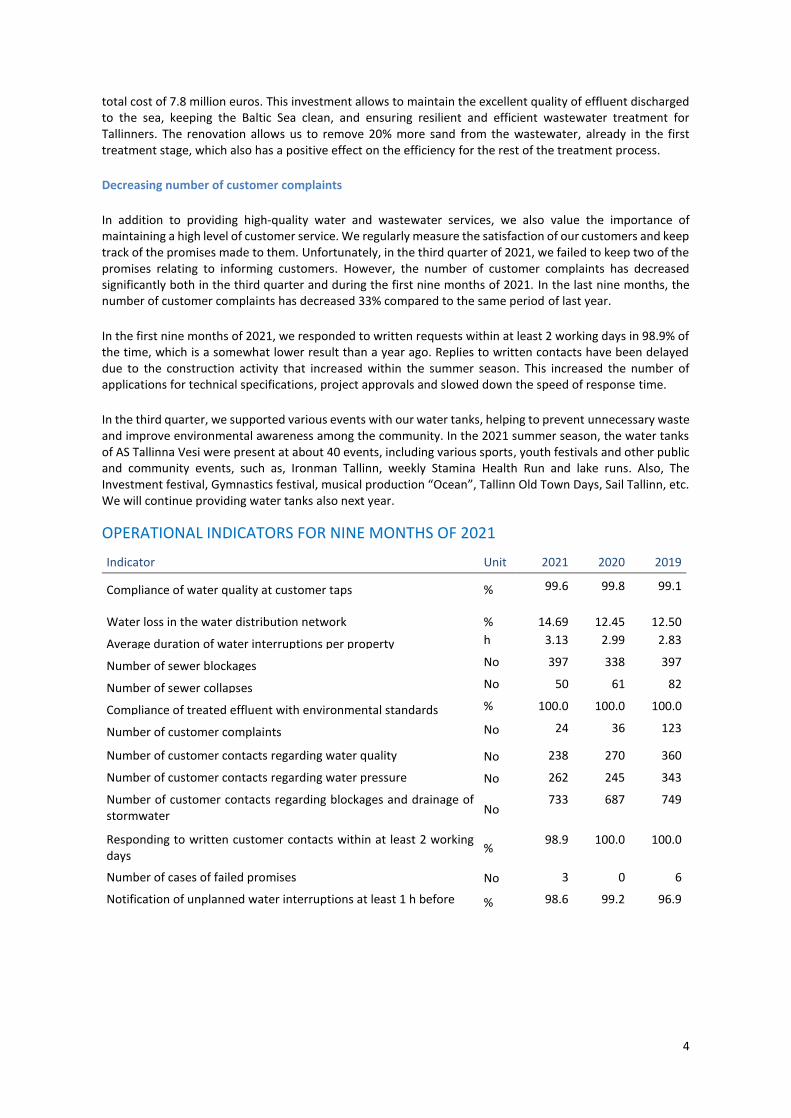
OPERATIONAL INDICATORS FOR NINE MONTHS OF 2021
Indicator Unit 2021 2020 2019
Compliance of water quality at customer taps % 99.6 99.8 99.1
Water loss in the water distribution network % 14.69 12.45 12.50
Average duration of water interruptions per property h 3.13 2.99 2.83
Number of sewer blockages No 397 338 397
Number of sewer collapses No 50 61 82
Compliance of treated effluent with environmental standards % 100.0 100.0 100.0
Number of customer complaints No 24 36 123
Number of customer contacts regarding water quality No 238 270 360
Number of customer contacts regarding water pressure No 262 245 343
Number of customer contacts regarding blockages and drainage of stormwater No
733 687 749
Responding to written customer contacts within at least 2 working days
% 98.9 100.0 100.0
Number of cases of failed promises No 3 0 6
Notification of unplanned water interruptions at least 1 h before % 98.6 99.2 96.9
5
Aleksandr Timofejev
Member of the Management Board Chief Executive Officer
6
FINANCIAL HIGHLIGHTS OF THE 3rd QUARTER OF 2021
The latest economic forecast from Eesti Pank finds that the Estonian economy has exited the crisis very
powerfully. Although some sectors have not recovered yet, the economy as a whole has clearly returned to
its pre-crisis level. The economy is forecasted to grow by 9.5% for the year as a whole. The total size of the
economy declined by around 3% last year, but by now it is clearly larger than it was before the pandemic. This
has been made possible because of very strong growth in the branches of the economy that coped best with
the difficulties, like information and communications, transport, construction and various services, while the
sectors that suffered most, like accommodation and food service, leisure, and administrative and support
activities, have not yet returned to where they were before the pandemic.
The recovery of economy has had a positive impact on AS Tallinna Vesi´s financial results, reflecting in slight
increase of revenues compared to the same period in 2020.
The Group’s sales revenues for the 3rd quarter of 2021 were €13.61 million, being higher by 2.5% or €0.34
million compared to the same period in 2020.
The gross profit in the 3rd quarter of 2021 was €5.36 million, showing a decrease of 7.5% or €0.44 million.
The decrease in gross profit was related to higher cost of goods and services sold that were 10.3% higher than
in the comparative period. The revenues were mainly impacted by increase in water and wastewater revenues
from commercial customers within the service area, which were mostly affected by the pandemic-related
restrictions cancellations and increased consumption of commercial customers.
The operating profit was €5.50 million, showing a decrease of 4.6% or €0.26 million. In addition to the above-
mentioned changes in gross profit, the operating profit both in the 3rd quarter of 2021 and in the 3rd quarter
of 2020 was impacted by €1.20 million positive change in the provision formed for possible third-party claims.
The operating profit for the 3rd quarter of 2021 before the impact resulting from the change of provision
formed for possible third-party claims was €4.30 million, compared to €4.56 million operating profit in the 3rd
quarter of 2021, being 5.8% or €0.27 million lower year-on-year.
The net profit for the 3rd quarter of 2021 was €5.34 million, showing a decrease of €0.30 million. The net
profit was mainly impacted by the above-mentioned changes in the revenue and operating profit and by lower
financial expense. The changes in the financial expenses were influenced by expiration of swap contracts in
the middle of the 4th quarter of 2020. The net profit for the 3rd quarter of 2021 without the impact resulting
from the change of provision for possible third-party claims was €4.13 million compared to €4.39 million net
profit in the 3rd quarter of 2020 without the impact resulting from the change of provision for possible third-
party claims and financial expense from swap contracts, being €0.26 million lower year-on-year.
7
MAIN FINANCIAL INDICATORS
€ million, except key ratios
3rd quarter Change
2021/ 2020
9 months Change
2021/ 2020 2021 2020 2019 2021 2020 2019
Sales 13.61 13.28 16.49 2.5% 38.36 38.55 47.30 -0.5%
Gross profit 5.36 5.80 8.92 -7.5% 15.78 16.59 25.97 -4.9%
Gross profit margin % 39.40 43.69 54.12 -9.8% 41.12 43.04 54.91 -4.5%
Operating profit before depreciation and amortisation 7.17 7.35 9.01 -2.4% 20.20 20.66 25.47 -2.3%
Operating profit before depreciation and amortisation margin % 52.67 55.33 54.63 -4.8% 52.64 53.60 53.85 -1.8%
Operating profit 5.50 5.77 7.52 -4.6% 15.36 16.03 21.01 -4.2%
Operating profit - main business 5.15 5.44 7.19 -5.2% 14.61 15.37 20.37 -4.9%
Operating profit margin % 40.42 43.43 45.60 -6.9% 40.04 41.58 44.42 -3.7%
Profit before taxes 5.41 5.64 7.33 -4.1% 15.09 15.70 20.35 -3.9%
Profit before taxes margin % 39.72 42.45 44.47 -6.4% 39.32 40.73 43.03 -3.4%
Net profit 5.34 5.64 7.33 -5.3% 12.96 11.34 16.81 14.3%
Net profit margin % 39.21 42.45 44.47 -7.6% 33.78 29.43 35.53 14.8%
ROA % 2.13 2.24 2.89 -5.0% 5.10 4.40 6.64 16.0%
Debt to total capital employed % 55,54 57,73 59,29 -3.8% 55,54 57,73 59,29 -3.8%
ROE % 4.87 5.42 7.27 -10.0% 11.55 10.20 16.21 13.2%
Current ratio 3,07 3,66 5,14 -16.1% 3,07 3,66 5,14 -16.1%
Quick ratio 3,01 3,62 5,10 -16.9% 3,01 3,62 5,10 -16.9%
Investments into fixed assets 4.32 5.91 4.65 -27.0% 9.95 13.77 10.76 -27.7%
Payout ratio % na 77.70 72.05 na 77.70 72.05
Gross profit margin – Gross profit / Net sales
Operating profit before depreciation and amortisation – Operating profit + depreciation and amortisation
Operating profit before depreciation and amortisation margin – Operating profit before depreciation and amortisation /
Net sales
Operating profit margin – Operating profit / Net sales
Net profit margin – Net profit / Net sales
ROA – Net profit / Average Total assets for the period
Debt to Total capital employed – Total liabilities / Total capital employed
ROE – Net profit / Average Total equity for the period
Current ratio – Current assets / Current liabilities
Quick ratio – (Current assets – Stocks) / Current liabilities
Payout ratio - Total Dividends per annum/ Total Net Income per annum
Main business – water services related activities, excl. connections profit and government grants, construction services,
doubtful receivables
8
FINANCIAL RESULTS FOR THE 3rd QUARTER OF 2021
Statement of comprehensive income
SALES The revenues from the main activities, i.e. sales of water and wastewater services, in the 3rd quarter of 2021 were impacted by changes in the consumption of water services resulting from the ongoing coronavirus outbreak. Given Estonia's macroeconomic forecast and developments of the pandemic, we expect a slight increase in the consumption of our water services during the next quarter. In the long run, we do not expect any significant changes in the use of water services.
In the 3rd quarter of 2021, the Group’s total sales were €13.61 million, showing an increase of 2.5% or €0.34
million year-on-year. 81.9% of sales comprise of water services within and outside the service area, 16.4%
from construction services and 1.7% from other services. The sale of construction services is more seasonal,
and the Company continues to seek possibilities to grow the revenues from these services.
9
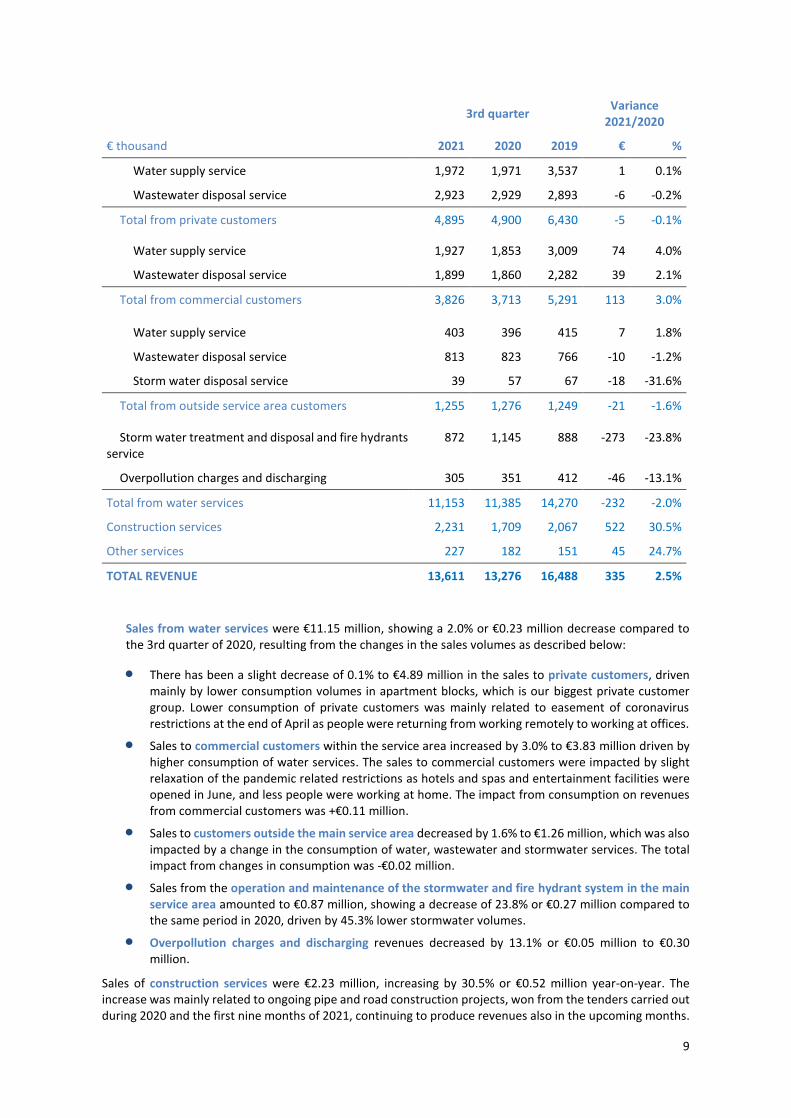
3rd quarter Variance
2021/2020
€ thousand 2021 2020 2019 € %
Water supply service 1,972 1,971 3,537 1 0.1%
Wastewater disposal service 2,923 2,929 2,893 -6 -0.2%
Total from private customers 4,895 4,900 6,430 -5 -0.1%
Water supply service 1,927 1,853 3,009 74 4.0%
Wastewater disposal service 1,899 1,860 2,282 39 2.1%
Total from commercial customers 3,826 3,713 5,291 113 3.0%
Water supply service 403 396 415 7 1.8%
Wastewater disposal service 813 823 766 -10 -1.2%
Storm water disposal service 39 57 67 -18 -31.6%
Total from outside service area customers 1,255 1,276 1,249 -21 -1.6%
Storm water treatment and disposal and fire hydrants service
872 1,145 888 -273 -23.8%
Overpollution charges and discharging 305 351 412 -46 -13.1%
Total from water services 11,153 11,385 14,270 -232 -2.0%
Construction services 2,231 1,709 2,067 522 30.5%
Other services 227 182 151 45 24.7%
TOTAL REVENUE 13,611 13,276 16,488 335 2.5%
Sales from water services were €11.15 million, showing a 2.0% or €0.23 million decrease compared to the 3rd quarter of 2020, resulting from the changes in the sales volumes as described below:
• There has been a slight decrease of 0.1% to €4.89 million in the sales to private customers, driven mainly by lower consumption volumes in apartment blocks, which is our biggest private customer group. Lower consumption of private customers was mainly related to easement of coronavirus restrictions at the end of April as people were returning from working remotely to working at offices.
• Sales to commercial customers within the service area increased by 3.0% to €3.83 million driven by higher consumption of water services. The sales to commercial customers were impacted by slight relaxation of the pandemic related restrictions as hotels and spas and entertainment facilities were opened in June, and less people were working at home. The impact from consumption on revenues from commercial customers was +€0.11 million.
• Sales to customers outside the main service area decreased by 1.6% to €1.26 million, which was also impacted by a change in the consumption of water, wastewater and stormwater services. The total impact from changes in consumption was -€0.02 million.
• Sales from the operation and maintenance of the stormwater and fire hydrant system in the main service area amounted to €0.87 million, showing a decrease of 23.8% or €0.27 million compared to the same period in 2020, driven by 45.3% lower stormwater volumes.
• Overpollution charges and discharging revenues decreased by 13.1% or €0.05 million to €0.30 million.
Sales of construction services were €2.23 million, increasing by 30.5% or €0.52 million year-on-year. The increase was mainly related to ongoing pipe and road construction projects, won from the tenders carried out during 2020 and the first nine months of 2021, continuing to produce revenues also in the upcoming months.
10
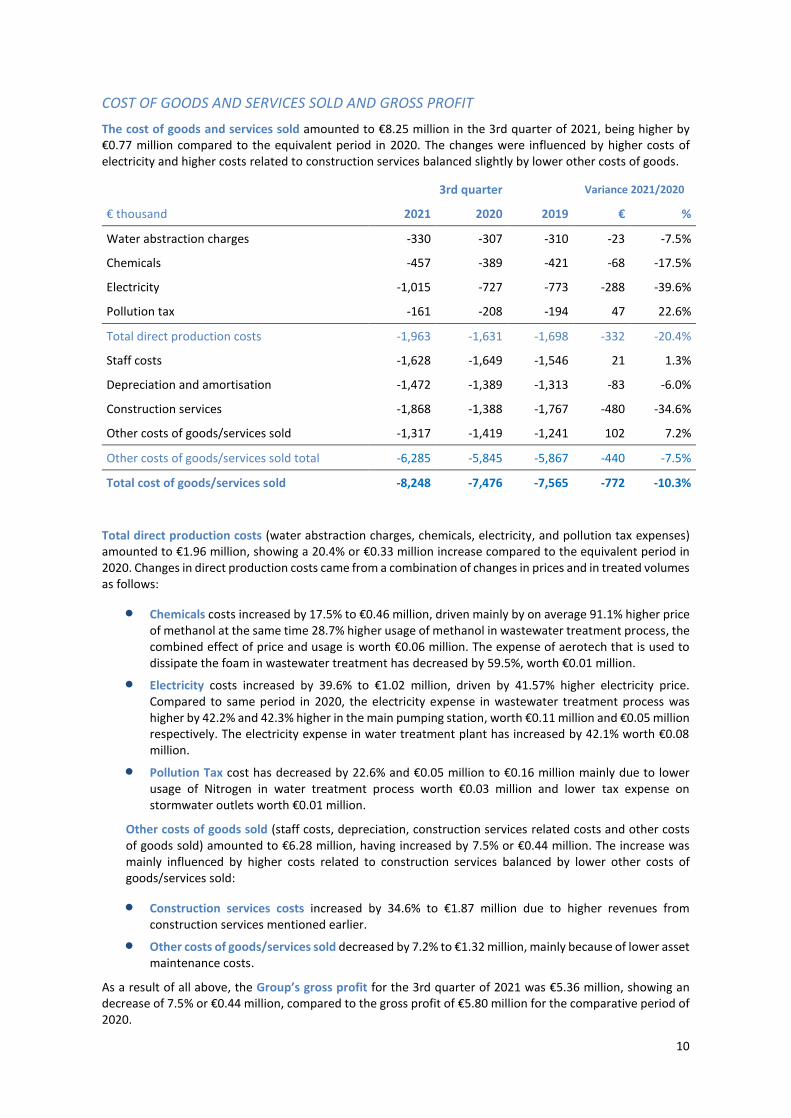
COST OF GOODS AND SERVICES SOLD AND GROSS PROFIT
The cost of goods and services sold amounted to €8.25 million in the 3rd quarter of 2021, being higher by €0.77 million compared to the equivalent period in 2020. The changes were influenced by higher costs of electricity and higher costs related to construction services balanced slightly by lower other costs of goods.
3rd quarter Variance 2021/2020
€ thousand 2021 2020 2019 € %
Water abstraction charges -330 -307 -310 -23 -7.5%
Chemicals -457 -389 -421 -68 -17.5%
Electricity -1,015 -727 -773 -288 -39.6%
Pollution tax -161 -208 -194 47 22.6%
Total direct production costs -1,963 -1,631 -1,698 -332 -20.4%
Staff costs -1,628 -1,649 -1,546 21 1.3%
Depreciation and amortisation -1,472 -1,389 -1,313 -83 -6.0%
Construction services -1,868 -1,388 -1,767 -480 -34.6%
Other costs of goods/services sold -1,317 -1,419 -1,241 102 7.2%
Other costs of goods/services sold total -6,285 -5,845 -5,867 -440 -7.5%
Total cost of goods/services sold -8,248 -7,476 -7,565 -772 -10.3%
Total direct production costs (water abstraction charges, chemicals, electricity, and pollution tax expenses) amounted to €1.96 million, showing a 20.4% or €0.33 million increase compared to the equivalent period in 2020. Changes in direct production costs came from a combination of changes in prices and in treated volumes as follows:
• Chemicals costs increased by 17.5% to €0.46 million, driven mainly by on average 91.1% higher price of methanol at the same time 28.7% higher usage of methanol in wastewater treatment process, the combined effect of price and usage is worth €0.06 million. The expense of aerotech that is used to dissipate the foam in wastewater treatment has decreased by 59.5%, worth €0.01 million.
• Electricity costs increased by 39.6% to €1.02 million, driven by 41.57% higher electricity price. Compared to same period in 2020, the electricity expense in wastewater treatment process was higher by 42.2% and 42.3% higher in the main pumping station, worth €0.11 million and €0.05 million respectively. The electricity expense in water treatment plant has increased by 42.1% worth €0.08 million.
• Pollution Tax cost has decreased by 22.6% and €0.05 million to €0.16 million mainly due to lower usage of Nitrogen in water treatment process worth €0.03 million and lower tax expense on stormwater outlets worth €0.01 million.
Other costs of goods sold (staff costs, depreciation, construction services related costs and other costs of goods sold) amounted to €6.28 million, having increased by 7.5% or €0.44 million. The increase was mainly influenced by higher costs related to construction services balanced by lower other costs of goods/services sold:
• Construction services costs increased by 34.6% to €1.87 million due to higher revenues from construction services mentioned earlier.
• Other costs of goods/services sold decreased by 7.2% to €1.32 million, mainly because of lower asset maintenance costs.
As a result of all above, the Group’s gross profit for the 3rd quarter of 2021 was €5.36 million, showing an decrease of 7.5% or €0.44 million, compared to the gross profit of €5.80 million for the comparative period of 2020.
11
ADMINISTRATIVE AND MARKETING EXPENSES, OTHER INCOME AND EXPENSES
Administrative and marketing expenses decreased by 21.5% or €0.26 million amounting to €0.95 million, compared to 3rd quarter of 2020, related to less services bought.
Other income and expenses amounted to net income of €1.09 million, compared to net income of €1.18 million in comparative period, derived from higher expense of doubtful receivables.
OPERATING PROFIT
As a result of the factors listed above the Group’s operating profit for the 3rd quarter of 2021 amounted to
€5.50 million, being 4.6% or €0.26 million lower than in the corresponding period of 2020. Eliminating the
effect of the change of provision for possible third-party claims, the operating profit for the 3rd quarter of
2021 and 2020 would have been €4.30 million and €4,56 million, being lower by 5.8% or €0.27 million year-
on-year.
FINANCIAL EXPENSES
The Group’s net financial income and expenses have resulted in a net expense of €0.09 million, compared to 27.5% lower expense in the 3rd quarter of 2020. The numbers derived from reduced interest costs due to a lower interest margin of 2019 Nordic Investment Bank and OP Corporate Bank loan agreements and expiry of SWAP agreements in the last quarter of 2020 that had positive fair value in 2020 3rd quarter.
The standalone swap agreements were signed to mitigate the long-term floating interest risk. The interest swap agreements were signed for €37.5 million and ended in November 2020, loans €50.22 million were with floating interest rate. In the 3rd quarter of 2021, the whole loan amount of €85.91 million was bearing a floating interest rate. The effective interest rate of loans in the 3rd quarter of 2021 was 0.39%, amounting to the interest costs of €0.09 million, compared to the effective interest rate of 0.77% (incl SWAP interests) and the interest costs of €0.12 million in the 3rd quarter of 2020.
NET PROFIT
The Group’s net profit for the 3rd quarter of 2021 was €5.34 million, being €0.30 million lower than for the comparative period of 2020. The decrease in net profit was mainly impacted by changes in operating profit and net financial expenses. Eliminating the effects of the change of the fair value of swap contracts in 2020 and the change of provision for possible third-party claims, the Group’s net profit for the 3rd quarter of 2021 would have been €4.13 million compared to net profit of €4.39 million in 2020, showing a decrease of €0.26 million year-on-year.
FINANCIAL RESULTS FOR THE NINE MONTHS OF 2021
Statement of comprehensive income
SALES During the nine months of 2021 the Group’s total sales were €38.36 million, showing a decrease by 0.5% or €0.18 million year-on-year. Sales from water services for nine months of 2021 were €33.16 million, decreasing by 2.9% or €0.99 million year-on-year. 86.4% of sales comprise of sales of water services within and outside of the service area, 11.9% from construction services and 1.7% from other services.
12
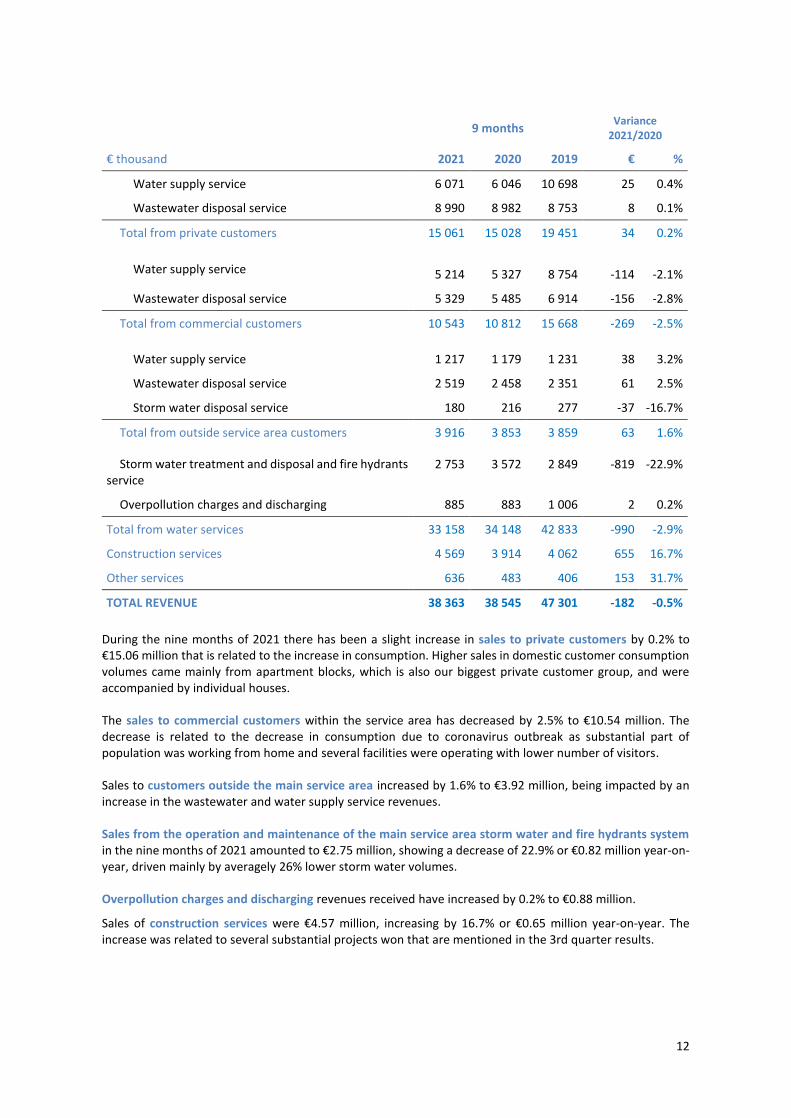
9 months Variance
2021/2020
€ thousand 2021 2020 2019 € %
Water supply service 6 071 6 046 10 698 25 0.4%
Wastewater disposal service 8 990 8 982 8 753 8 0.1%
Total from private customers 15 061 15 028 19 451 34 0.2%
Water supply service 5 214 5 327 8 754 -114 -2.1%
Wastewater disposal service 5 329 5 485 6 914 -156 -2.8%
Total from commercial customers 10 543 10 812 15 668 -269 -2.5%
Water supply service 1 217 1 179 1 231 38 3.2%
Wastewater disposal service 2 519 2 458 2 351 61 2.5%
Storm water disposal service 180 216 277 -37 -16.7%
Total from outside service area customers 3 916 3 853 3 859 63 1.6%
Storm water treatment and disposal and fire hydrants service
2 753 3 572 2 849 -819 -22.9%
Overpollution charges and discharging 885 883 1 006 2 0.2%
Total from water services 33 158 34 148 42 833 -990 -2.9%
Construction services 4 569 3 914 4 062 655 16.7%
Other services 636 483 406 153 31.7%
TOTAL REVENUE 38 363 38 545 47 301 -182 -0.5%
During the nine months of 2021 there has been a slight increase in sales to private customers by 0.2% to €15.06 million that is related to the increase in consumption. Higher sales in domestic customer consumption volumes came mainly from apartment blocks, which is also our biggest private customer group, and were accompanied by individual houses. The sales to commercial customers within the service area has decreased by 2.5% to €10.54 million. The decrease is related to the decrease in consumption due to coronavirus outbreak as substantial part of population was working from home and several facilities were operating with lower number of visitors. Sales to customers outside the main service area increased by 1.6% to €3.92 million, being impacted by an increase in the wastewater and water supply service revenues. Sales from the operation and maintenance of the main service area storm water and fire hydrants system in the nine months of 2021 amounted to €2.75 million, showing a decrease of 22.9% or €0.82 million year-on-year, driven mainly by averagely 26% lower storm water volumes. Overpollution charges and discharging revenues received have increased by 0.2% to €0.88 million.
Sales of construction services were €4.57 million, increasing by 16.7% or €0.65 million year-on-year. The increase was related to several substantial projects won that are mentioned in the 3rd quarter results.
13
COST OF GOODS AND SERVICES SOLD AND GROSS AND OPERATING PROFITS 9 months Variance 2021/2020
€ thousand 2021 2020 2019 € %
Water abstraction charges -954 -919 -904 -35 -3,8%
Chemicals -1 317 -1 152 -1 256 -165 -14,3%
Electricity -2 810 -2 502 -2 593 -308 -12,3%
Pollution tax -597 -792 -788 194 24,4%
Total direct production costs -5 678 -5 364 -5 541 -314 -5,9%
Staff costs -5 325 -5 314 -4 895 -11 -0,2%
Depreciation and amortisation -4 243 -4 065 -3 951 -179 -4,4%
Construction services -3 753 -3 189 -3 441 -565 -17,7%
Other costs of goods/services sold -3 589 -4 023 -3 499 433 10,8%
Other costs of goods/services sold total -16 910 -16 588 -15 786 -322 -1,9%
Total cost of goods/services sold -22 588 -21 954 -21 327 -634 -2,9%
During the nine months of 2021 the cost of goods and services sold amounted to €22.59 million, increasing by 2.9% or €0.63 million compared to the equivalent period in 2020. Total direct production costs (water abstraction charges, chemicals, electricity and pollution tax expenses) amounted to €5.68 million, showing a 5.9% or €0.31 million increase compared to the equivalent period in 2020. Changes in direct production costs came from a combination of changes in prices and in treated volumes that affected the cost of goods sold together with the following additional factors:
• Chemicals costs increased by 14.3% to €1.32 million, driven mainly by on average 66.7% higher price of methanol, accompanied by 4.4% higher expense of coagulant in water treatment, worth -€0.14 million and -€0.02 million respectively.
• Expenses for Electricity increased by 12.3% or €0.31 million resulting in costs worth of €2.81 million mainly due to averagely 14.1% higher price and 6.8% higher usage of electricity.
• Pollution Tax cost has decreased by 24.4% or €0.19 million mainly due to lower concentration of Nitrogen and BOD7 in wastewater treatment process, worth €0.11 million and €0.03 million accordingly.
Other costs of goods sold (staff costs, depreciation, construction and asphalting services costs and other costs of goods sold) amounted to €16.91 million, having increased by 1.9% or €0.32 million. The increase in other costs of goods sold were mainly driven by 17.7% or €0.56 million higher expenses related to construction services that were balanced by €0.43 million lower expense of other cost of goods and services derived from asset maintenance cost.
The Group’s gross profit for the nine months of 2021 was €15,78 million, showing a decrease of 4.9% or €0.82 million compared to the comparative period of 2020. The Group’s operating profit for the nine months of 2021 amounted to €15.36 million, being 4.2% or €0.67 million lower than in the corresponding period of 2020, being mainly impacted by lower water services revenues from main service area because of lower commercial customer consumption, change of provision for the possible third-party claims mentioned in the 3rd quarter results. Eliminating the effect of the change of provision for the possible third-party claims the operating profit for 2021 and 2020 would have been €11.75 million and €12.42 million, being lower by 5.4% or €0.67 million year-on-year.
FINANCIAL EXPENSES
The Group’s net financial income and expenses have resulted a net expense of €0.27 million, compared to net expense of €0.33 million in the nine months of 2020. The decrease was impacted by lower interest costs on loans taken and no expense on SWAP contracts that ended in November 2020.
14
PROFIT BEFORE TAXES AND NET PROFIT
The Group’s profit before taxes for the nine months of 2021 were €15.09 million, being 3.9% or €0.61 million higher than for the relevant period of 2020. The Group’s net profit for the nine months of 2021 were €12.96 million, being 14.3% or €1.62 million higher than for the equivalent period of 2020. Eliminating the effects of the change of the derivatives fair value in 2020 and the change of provision for the possible third-party claims the Group’s net profit for the nine months of 2021 would have been €9.35 million, showing an increase by 24.0% or €1.81 million year-on-year.
Statement of financial position
In the first nine months of 2021 the Group invested into fixed assets €9.95 million. As of 30/09/2021, non-current tangible assets amounted to €199.0 million, the majority of which in the amount of €162.7 was an investment in pipes (31/12/20 €162.6). Total non-current assets amounted to €208.53 million (31/12/2020: €203.43 million).
Compared to the year end of 2020 the trade receivables, accrued income and prepaid expenses have shown a slight decrease in the amount of €0.16 million to €6.86 million. Decrease mainly derives from lower trade receivables related to water services and lower other receivables, by €0.52 million and €0.31 million respectively. The collectability rate continues to be high at 99.73% compared to September 2020 when the collectability rate was 99.98%.
Current liabilities have decreased by €0.74 million to €14.29 million compared to the end of 2020, mainly deriving from investments related trade payables.
Deferred income from connection fees has increased compared to the end of 2020 by €1.66 million to €36.23 million.
Provision for possible third-party claims has decreased compared to the end of 2020 by €3.61 million to €6.02 million. More detailed information about the provision is presented in Note 6 to the financial statements.
The Group’s loan balance of €85.91 million has decreased by the amount of NIB loan repayment of €1.82 million compared to the end of 2020. In May 2019, the Company started to return the previous NIB loan in 11 equal semi-annual payments. The weighted average loan interest risk margin is 0.60%.
The Group has a total debt to assets level of 55.54%, in range of 54%-65%, reflecting the Group’s equity profile. In the comparative period of 2020, the total debt to assets ratio was at the same level, being 57.73%.
Cash flow
As of 30/09/2021, the cash position of the Group is rather good. At the end of September 2021, the cash balance of the Group stood at €36.14 million, which is 14.3% of the total assets (31/12/2020: €44.51 million, forming 17.4% of the total assets).
The largest contribution to the cash flows comes from the main activities. During the first nine months of 2021, the Group generated €16.77 million of cash flows from operating activities, an increase of €0.10 million compared to the corresponding period in 2020. Underlying operating profit continues to be the main contributor to operating cash flows.
In the nine months of 2021 the result of net cash flows from investing activities was a cash outflow of €7.55 million and decrease of €0.83 million compared to the cash outflow of €8.37 million in the first nine months of 2020. This is made up as follows:
• The cash outflows from investments in fixed assets have decreased by €0.56 million compared to 2020, amounting to €9.50 million.
• The compensations received for pipe construction were €1.93 million, showing an increase of €0.33 million compared to the same period of 2020.
In the nine months of 2021 cash outflow from financing activities amounted to €17.59 million, decreasing by €9.55 million compared to the same period in 2020. The change was mainly related to lower interest payments, and less dividends paid compared to 2020, €0.16 million and €7.04 million accordingly.
15
EMPLOYEES
We believe it is important to treat our employees equally, involve them in the decision-making process and to inform them regularly. We consider the involvement of our staff in the decision-making process instrumental for them to understand and be able to support the Company in its pursuits. Our staff can vary to a large degree in age, nationality, nature of work and in many other aspects. This requires us to be resourceful and flexible in our communication with the staff in order to involve, engage and listen to them. This is done using several means and channels of communication, such as regular staff meetings with the management, bulletin boards, intranet, informative letters, team events and a quarterly internal newsletter. Estonian is not the communication language for quite a number of our staff, therefore we provide the majority of important information also in Russian. Multiple locations have been installed digital screens that are constantly broadcasting the latest information in two languages about what takes place in our company.
We have described our human resource policies. We follow equality principles in selecting and managing people, which translates into providing, when feasible, everyone with equal opportunities. Understanding and appreciating the diversity of our staff, we ensure, that everyone is treated fairly and equally, and they have access to the same opportunities as is reasonable and practicable. We aim to ensure, that no employees are discriminated against due to, but not exclusive to age, gender, religion, cultural or ethnic origin, disability, sexual orientation or marital status.
Since the third quarter, we have almost fully returned to normal working arrangements. At the same time, we avoid larger get-togethers and continue to allow office staff to work remotely. It is important for us to protect the health of our staff, so we offer additional opportunities for vaccination, both against COVID-19 virus and against influenza, tick encephalitis, tetanus and hepatitis, in accordance with a risk analysis prepared by the company.
We consider it important to develop our staff, which is why we have organised a wide range of training courses for skilled workers, specialists and managers (for example, training on work involving an open flame, training on safe working in confined spaces, training for new managers, etc.).
In July, the company's summer days took place, with a large proportion of staff taking part in. In addition, we encouraged teams to organise their own team events to keep up the team spirit and motivation.
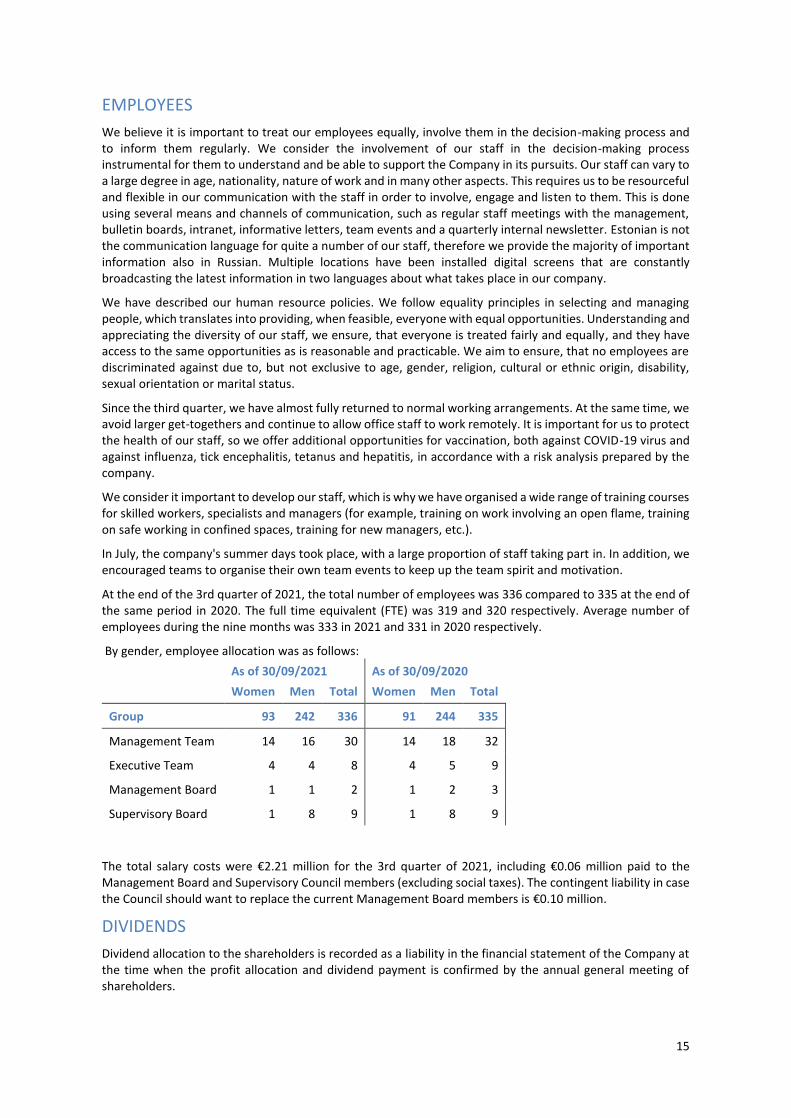
At the end of the 3rd quarter of 2021, the total number of employees was 336 compared to 335 at the end of the same period in 2020. The full time equivalent (FTE) was 319 and 320 respectively. Average number of employees during the nine months was 333 in 2021 and 331 in 2020 respectively.
By gender, employee allocation was as follows:
As of 30/09/2021 As of 30/09/2020
Women Men Total Women Men Total
Group 93 242 336 91 244 335
Management Team 14 16 30 14 18 32
Executive Team 4 4 8 4 5 9
Management Board 1 1 2 1 2 3
Supervisory Board 1 8 9 1 8 9
The total salary costs were €2.21 million for the 3rd quarter of 2021, including €0.06 million paid to the Management Board and Supervisory Council members (excluding social taxes). The contingent liability in case the Council should want to replace the current Management Board members is €0.10 million.
DIVIDENDS
Dividend allocation to the shareholders is recorded as a liability in the financial statement of the Company at the time when the profit allocation and dividend payment is confirmed by the annual general meeting of shareholders.
16
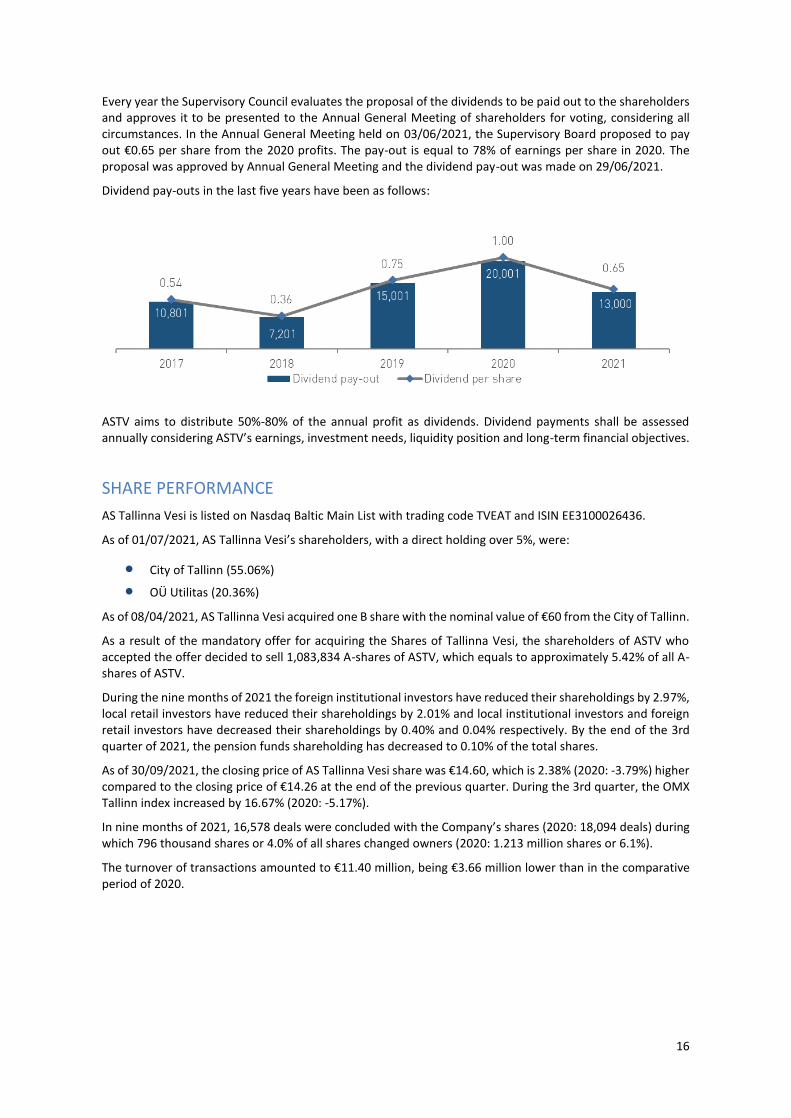
Every year the Supervisory Council evaluates the proposal of the dividends to be paid out to the shareholders and approves it to be presented to the Annual General Meeting of shareholders for voting, considering all circumstances. In the Annual General Meeting held on 03/06/2021, the Supervisory Board proposed to pay out €0.65 per share from the 2020 profits. The pay-out is equal to 78% of earnings per share in 2020. The proposal was approved by Annual General Meeting and the dividend pay-out was made on 29/06/2021.
Dividend pay-outs in the last five years have been as follows:
ASTV aims to distribute 50%-80% of the annual profit as dividends. Dividend payments shall be assessed annually considering ASTV’s earnings, investment needs, liquidity position and long-term financial objectives.
SHARE PERFORMANCE
AS Tallinna Vesi is listed on Nasdaq Baltic Main List with trading code TVEAT and ISIN EE3100026436.
As of 01/07/2021, AS Tallinna Vesi’s shareholders, with a direct holding over 5%, were:
• City of Tallinn (55.06%)
• OÜ Utilitas (20.36%)
As of 08/04/2021, AS Tallinna Vesi acquired one B share with the nominal value of €60 from the City of Tallinn.
As a result of the mandatory offer for acquiring the Shares of Tallinna Vesi, the shareholders of ASTV who accepted the offer decided to sell 1,083,834 A-shares of ASTV, which equals to approximately 5.42% of all A-shares of ASTV.
During the nine months of 2021 the foreign institutional investors have reduced their shareholdings by 2.97%, local retail investors have reduced their shareholdings by 2.01% and local institutional investors and foreign retail investors have decreased their shareholdings by 0.40% and 0.04% respectively. By the end of the 3rd quarter of 2021, the pension funds shareholding has decreased to 0.10% of the total shares.
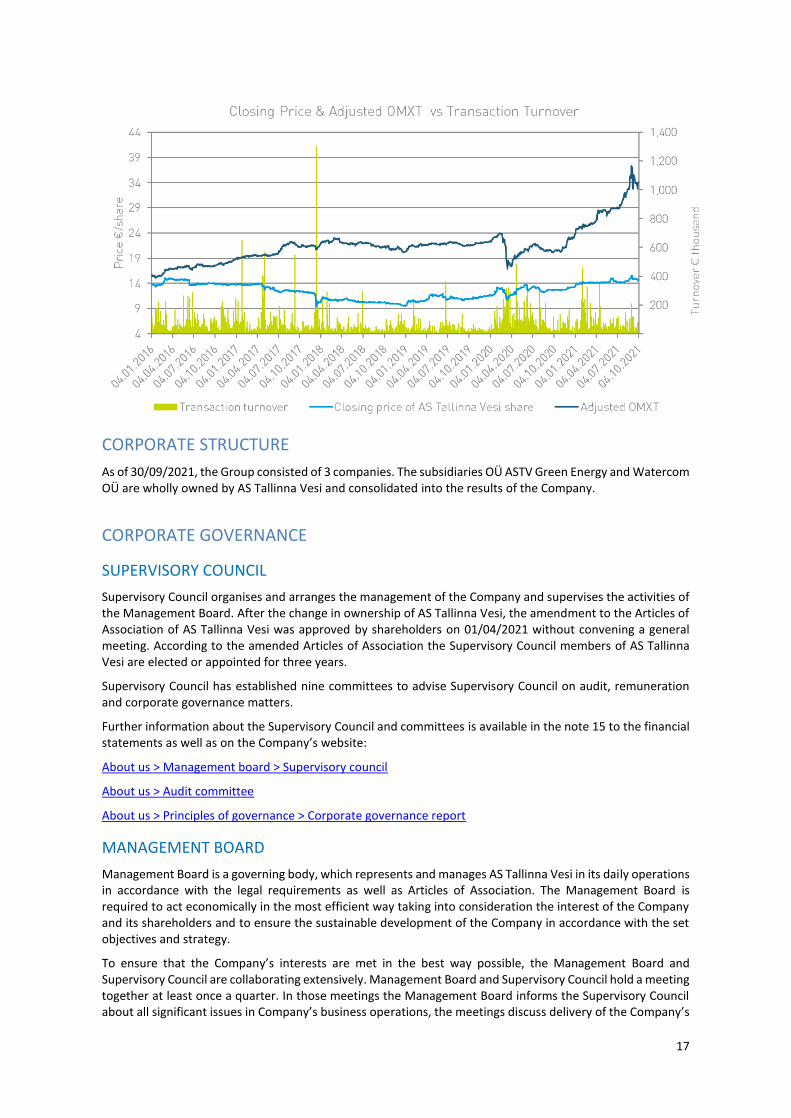
As of 30/09/2021, the closing price of AS Tallinna Vesi share was €14.60, which is 2.38% (2020: -3.79%) higher compared to the closing price of €14.26 at the end of the previous quarter. During the 3rd quarter, the OMX Tallinn index increased by 16.67% (2020: -5.17%).
In nine months of 2021, 16,578 deals were concluded with the Company’s shares (2020: 18,094 deals) during which 796 thousand shares or 4.0% of all shares changed owners (2020: 1.213 million shares or 6.1%).
The turnover of transactions amounted to €11.40 million, being €3.66 million lower than in the comparative period of 2020.
17
CORPORATE STRUCTURE
As of 30/09/2021, the Group consisted of 3 companies. The subsidiaries OÜ ASTV Green Energy and Watercom OÜ are wholly owned by AS Tallinna Vesi and consolidated into the results of the Company.
CORPORATE GOVERNANCE
SUPERVISORY COUNCIL
Supervisory Council organises and arranges the management of the Company and supervises the activities of the Management Board. After the change in ownership of AS Tallinna Vesi, the amendment to the Articles of Association of AS Tallinna Vesi was approved by shareholders on 01/04/2021 without convening a general meeting. According to the amended Articles of Association the Supervisory Council members of AS Tallinna Vesi are elected or appointed for three years.
Supervisory Council has established nine committees to advise Supervisory Council on audit, remuneration and corporate governance matters.
Further information about the Supervisory Council and committees is available in the note 15 to the financial statements as well as on the Company’s website:
About us > Management board > Supervisory council
About us > Audit committee
About us > Principles of governance > Corporate governance report
MANAGEMENT BOARD
Management Board is a governing body, which represents and manages AS Tallinna Vesi in its daily operations in accordance with the legal requirements as well as Articles of Association. The Management Board is required to act economically in the most efficient way taking into consideration the interest of the Company and its shareholders and to ensure the sustainable development of the Company in accordance with the set objectives and strategy.
To ensure that the Company’s interests are met in the best way possible, the Management Board and Supervisory Council are collaborating extensively. Management Board and Supervisory Council hold a meeting together at least once a quarter. In those meetings the Management Board informs the Supervisory Council about all significant issues in Company’s business operations, the meetings discuss delivery of the Company’s
18
short and long-term goals as well as the risks that may impact the delivery. Management Board prepares a management report for every Supervisory Council meeting and submits it in advance with sufficient time for the Supervisory Council to study it.
According to the amended Articles of Association the Management Board consists of 2 or 3 members, who are elected for 5 years.
Starting from 01/04/2020, there are 2 members in the Management Board of AS Tallinna Vesi: Aleksandr Timofejev (with the powers of a Management Board member until 30/10/2026) and Kristi Ojakäär (with the powers of a Management Board Member until 01/01/2023).
On 17 May 2021, the Supervisory Council of AS Tallinna Vesi appointed Aleksandr Timofejev as the new Chief Executive Officer of the company. Mr Timofejev has been a member of the Management Board since 2012, serving as the Chief Operating Officer of AS Tallinna Vesi.
Further information on the members of the Management Board is available on the Company’s website:
About us > Management board
Additional information:
Aleksandr Timofejev Kristi Ojakäär Member of the Management Board Member of the Management Board +372 62 62 200 +372 62 62 200
19
MANAGEMENT CONFIRMATION
The Management Board has prepared the consolidated interim accounts of AS Tallinna Vesi (the Company) and its subsidiaries OÜ Watercom and OÜ ASTV Green Energy (together the Group) in the form of consolidated condensed financial statements for the 9 months period of financial year 2021 ended 30 September 2021. The interim accounts have not been reviewed by the auditors.
The condensed financial statements for the period ended 30 September 2021 have been prepared following the accounting policies and the manner of presenting the information in line with the International Financial Reporting Standards as adopted by the EU. The condensed financial statements provide a fair presentation of the assets, liabilities, financial position and result of the operations and the cash flows of the Group.
The interim report gives a fair presentation of the main events that occurred during the 9 months of the financial year and of their effect on the condensed financial statements. It includes the description of the main risks and unclear aspects that can, based on the sensible judgement of the Management Board, have an impact on the Company during the remaining 9 months of the financial year.
The significant transactions with related parties are disclosed in the interim accounts.
Any subsequent events that materially affect the valuation of assets and liabilities and have occurred until the completion of the consolidated financial statements on 29 October 2021 have been considered in preparing the financial statements.
The Management Board considers AS Tallinna Vesi and its subsidiaries to be going concern entities.
Aleksandr Timofejev
Member of the Management Board
Chief Executive Officer
Kristi Ojakäär
Member of the Management Board
Chief Financial Officer
29 October 2021
Introduction and photos of the Management Board members are published at company’s web page https://tallinnavesi.ee/en/ettevote/management-board/.
CONSOLIDATED STATEMENT OF FINANCIAL POSITION
20
€ thousand as of 30 September as of 31 December
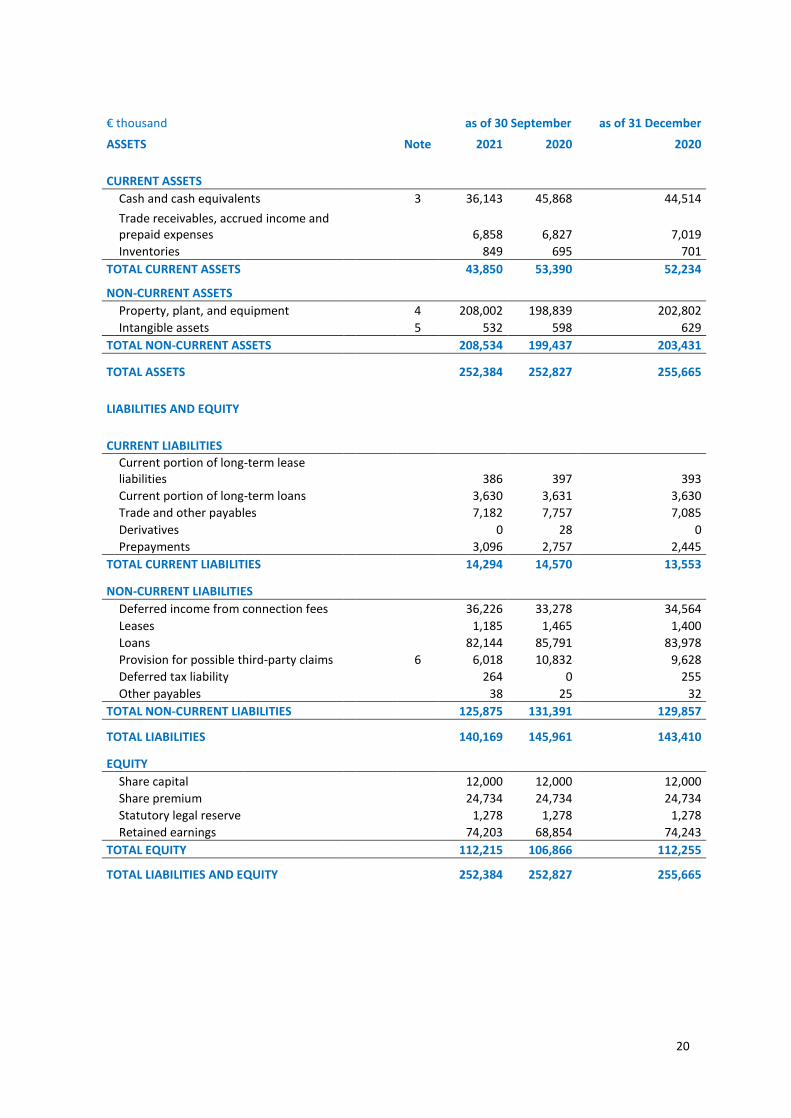
ASSETS Note 2021 2020 2020
CURRENT ASSETS
Cash and cash equivalents 3 36,143 45,868 44,514
Trade receivables, accrued income and prepaid expenses 6,858 6,827 7,019
Inventories 849 695 701
TOTAL CURRENT ASSETS 43,850 53,390 52,234
NON-CURRENT ASSETS
Property, plant, and equipment 4 208,002 198,839 202,802
Intangible assets 5 532 598 629
TOTAL NON-CURRENT ASSETS 208,534 199,437 203,431
TOTAL ASSETS 252,384 252,827 255,665
LIABILITIES AND EQUITY
CURRENT LIABILITIES
Current portion of long-term lease liabilities 386 397 393
Current portion of long-term loans 3,630 3,631 3,630
Trade and other payables 7,182 7,757 7,085
Derivatives 0 28 0
Prepayments 3,096 2,757 2,445
TOTAL CURRENT LIABILITIES 14,294 14,570 13,553
NON-CURRENT LIABILITIES
Deferred income from connection fees 36,226 33,278 34,564
Leases 1,185 1,465 1,400
Loans 82,144 85,791 83,978
Provision for possible third-party claims 6 6,018 10,832 9,628
Deferred tax liability 264 0 255
Other payables 38 25 32
TOTAL NON-CURRENT LIABILITIES 125,875 131,391 129,857
TOTAL LIABILITIES 140,169 145,961 143,410
EQUITY
Share capital 12,000 12,000 12,000
Share premium 24,734 24,734 24,734
Statutory legal reserve 1,278 1,278 1,278
Retained earnings 74,203 68,854 74,243
TOTAL EQUITY 112,215 106,866 112,255
TOTAL LIABILITIES AND EQUITY 252,384 252,827 255,665
21
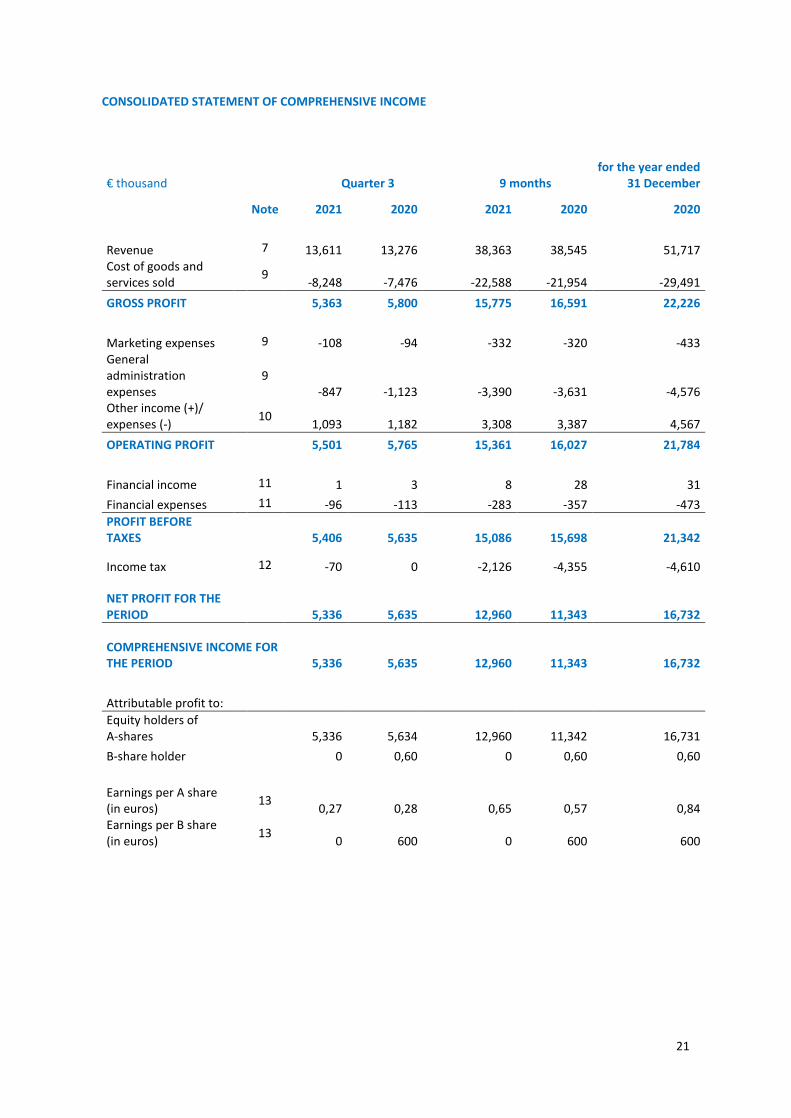
CONSOLIDATED STATEMENT OF COMPREHENSIVE INCOME
€ thousand Quarter 3 9 months for the year ended
31 December
Note 2021 2020 2021 2020 2020
Revenue 7 13,611 13,276 38,363 38,545 51,717 Cost of goods and services sold
9 -8,248 -7,476 -22,588 -21,954 -29,491
GROSS PROFIT 5,363 5,800 15,775 16,591 22,226
Marketing expenses 9 -108 -94 -332 -320 -433 General administration expenses
9 -847 -1,123 -3,390 -3,631 -4,576
Other income (+)/ expenses (-)
10 1,093 1,182 3,308 3,387 4,567
OPERATING PROFIT 5,501 5,765 15,361 16,027 21,784
Financial income 11 1 3 8 28 31
Financial expenses 11 -96 -113 -283 -357 -473
PROFIT BEFORE TAXES 5,406 5,635 15,086 15,698 21,342
Income tax 12 -70 0 -2,126 -4,355 -4,610
NET PROFIT FOR THE PERIOD 5,336 5,635 12,960 11,343 16,732
COMPREHENSIVE INCOME FOR THE PERIOD 5,336 5,635 12,960 11,343 16,732
Attributable profit to:
Equity holders of A-shares 5,336 5,634 12,960 11,342 16,731
B-share holder 0 0,60 0 0,60 0,60
Earnings per A share (in euros)
13 0,27 0,28 0,65 0,57 0,84
Earnings per B share (in euros)
13 0 600 0 600 600
22
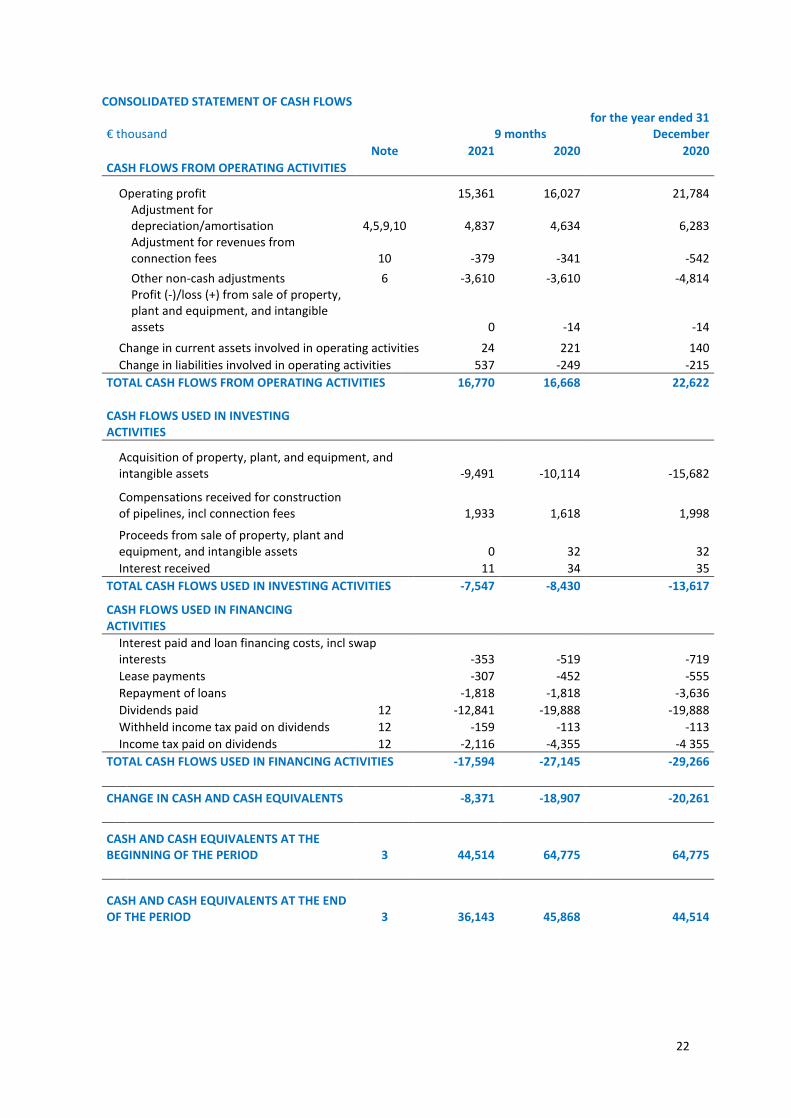
CONSOLIDATED STATEMENT OF CASH FLOWS
€ thousand 9 months for the year ended 31
December
Note 2021 2020 2020
CASH FLOWS FROM OPERATING ACTIVITIES
Operating profit 15,361 16,027 21,784
Adjustment for depreciation/amortisation 4,5,9,10 4,837 4,634 6,283
Adjustment for revenues from connection fees 10 -379 -341 -542
Other non-cash adjustments 6 -3,610 -3,610 -4,814
Profit (-)/loss (+) from sale of property, plant and equipment, and intangible assets 0 -14 -14
Change in current assets involved in operating activities 24 221 140
Change in liabilities involved in operating activities 537 -249 -215
TOTAL CASH FLOWS FROM OPERATING ACTIVITIES 16,770 16,668 22,622
CASH FLOWS USED IN INVESTING ACTIVITIES
Acquisition of property, plant, and equipment, and intangible assets -9,491 -10,114 -15,682
Compensations received for construction of pipelines, incl connection fees 1,933 1,618 1,998
Proceeds from sale of property, plant and equipment, and intangible assets 0 32 32
Interest received 11 34 35
TOTAL CASH FLOWS USED IN INVESTING ACTIVITIES -7,547 -8,430 -13,617
CASH FLOWS USED IN FINANCING ACTIVITIES
Interest paid and loan financing costs, incl swap interests -353 -519 -719
Lease payments -307 -452 -555
Repayment of loans -1,818 -1,818 -3,636
Dividends paid 12 -12,841 -19,888 -19,888
Withheld income tax paid on dividends 12 -159 -113 -113
Income tax paid on dividends 12 -2,116 -4,355 -4 355
TOTAL CASH FLOWS USED IN FINANCING ACTIVITIES -17,594 -27,145 -29,266
CHANGE IN CASH AND CASH EQUIVALENTS -8,371 -18,907 -20,261
CASH AND CASH EQUIVALENTS AT THE BEGINNING OF THE PERIOD 3 44,514 64,775 64,775
CASH AND CASH EQUIVALENTS AT THE END OF THE PERIOD 3 36,143 45,868 44,514
23
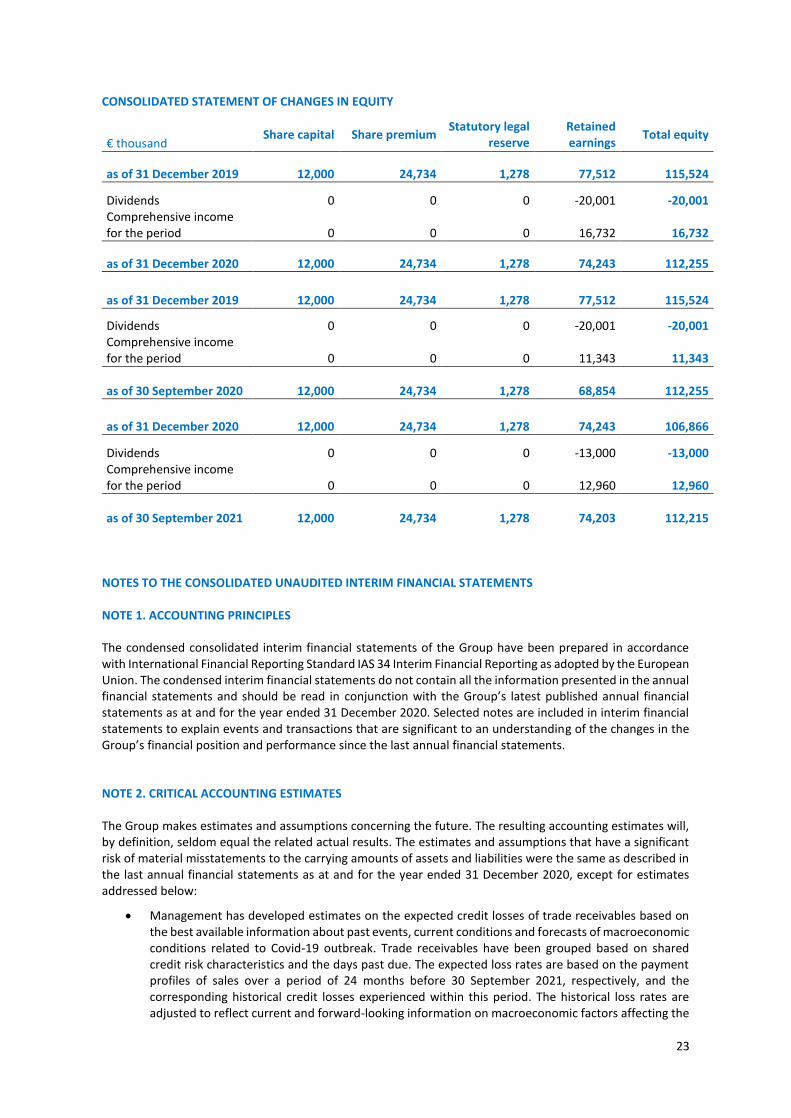
CONSOLIDATED STATEMENT OF CHANGES IN EQUITY
€ thousand Share capital Share premium
Statutory legal reserve
Retained earnings
Total equity
as of 31 December 2019 12,000 24,734 1,278 77,512 115,524
Dividends 0 0 0 -20,001 -20,001 Comprehensive income for the period 0 0 0 16,732 16,732
as of 31 December 2020 12,000 24,734 1,278 74,243 112,255
as of 31 December 2019 12,000 24,734 1,278 77,512 115,524
Dividends 0 0 0 -20,001 -20,001 Comprehensive income for the period 0 0 0 11,343 11,343
as of 30 September 2020 12,000 24,734 1,278 68,854 112,255
as of 31 December 2020 12,000 24,734 1,278 74,243 106,866
Dividends 0 0 0 -13,000 -13,000 Comprehensive income for the period 0 0 0 12,960 12,960
as of 30 September 2021 12,000 24,734 1,278 74,203 112,215
NOTES TO THE CONSOLIDATED UNAUDITED INTERIM FINANCIAL STATEMENTS NOTE 1. ACCOUNTING PRINCIPLES
The condensed consolidated interim financial statements of the Group have been prepared in accordance with International Financial Reporting Standard IAS 34 Interim Financial Reporting as adopted by the European Union. The condensed interim financial statements do not contain all the information presented in the annual financial statements and should be read in conjunction with the Group’s latest published annual financial statements as at and for the year ended 31 December 2020. Selected notes are included in interim financial statements to explain events and transactions that are significant to an understanding of the changes in the Group’s financial position and performance since the last annual financial statements.
NOTE 2. CRITICAL ACCOUNTING ESTIMATES
The Group makes estimates and assumptions concerning the future. The resulting accounting estimates will, by definition, seldom equal the related actual results. The estimates and assumptions that have a significant risk of material misstatements to the carrying amounts of assets and liabilities were the same as described in the last annual financial statements as at and for the year ended 31 December 2020, except for estimates addressed below:
• Management has developed estimates on the expected credit losses of trade receivables based on the best available information about past events, current conditions and forecasts of macroeconomic conditions related to Covid-19 outbreak. Trade receivables have been grouped based on shared credit risk characteristics and the days past due. The expected loss rates are based on the payment profiles of sales over a period of 24 months before 30 September 2021, respectively, and the corresponding historical credit losses experienced within this period. The historical loss rates are adjusted to reflect current and forward-looking information on macroeconomic factors affecting the
24
ability of the customers to settle the receivables. The Group has identified the GDP and the unemployment rate of Estonia in which it sells its goods and services to be the most relevant factors, and has accordingly adjusted the historical loss rates based on expected changes in these factors. As at 30 September 2021, Management of the Group has assessed the expected credit loss related to Covid-19 outbreak to be €134 thousand. Estimated credit loss is being revised according to further developments.
• Management has made an estimate with regards to possible third-party claims based on the maximum difference between revenues calculated with tariffs established based on the Services Agreement and the tariffs based on the Company's estimation, with the reservation to the possible fluctuation. According to the law, the tariffs established based on the Services Agreement were in force until the Competition Authority approved the new tariffs and the Company implemented these tariffs in line with the law. The Company has acted in good faith and in reliance to the applicable legal acts. Thus, the Company does not consider itself liable to the customers for any claims related to the tariffs applied until the new tariffs approved by the Competition Authority were duly implemented. The potential undiscounted payments by the Company in the future, if potential claims from customers were recognised by the courts, would amount to €15.1 million (as of 31 December 2020: €24.1 million). This estimate marks the maximum difference in between the tariffs approved based on the Services Agreement and the tariffs based on the Company's estimation, with the reservation to the possible fluctuation, regarding past 15 months (as of 31 December 2020: 24 months), being the approximate remaining unexpired term of potential claims. The Management Board of the Company has assessed the potential liability resulting from such claims, if successful, to be €6.0 million (as of 31 December 2020: €9.6 million). As of 30 September 2020, claims totalling €1.5 million have been filed within two applications. The Company does not admit any liability and fully rejects it.
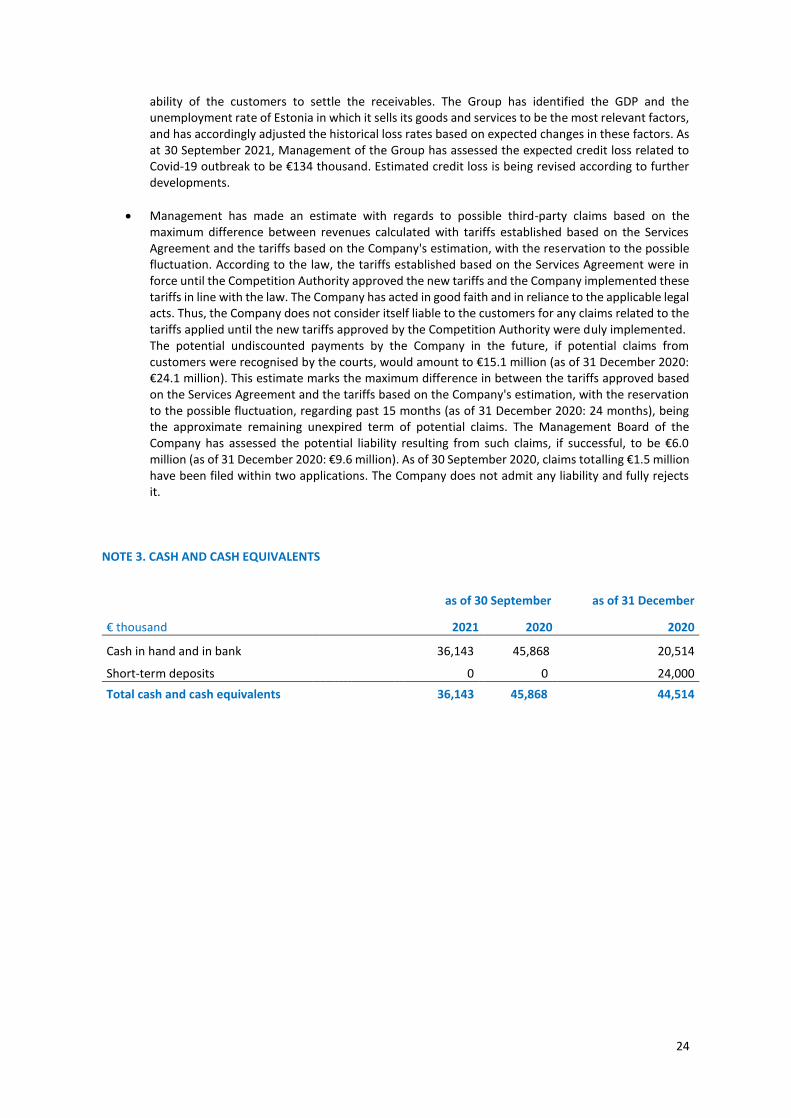
NOTE 3. CASH AND CASH EQUIVALENTS
as of 30 September as of 31 December
€ thousand 2021 2020 2020
Cash in hand and in bank 36,143 45,868 20,514
Short-term deposits 0 0 24,000
Total cash and cash equivalents 36,143 45,868 44,514
25
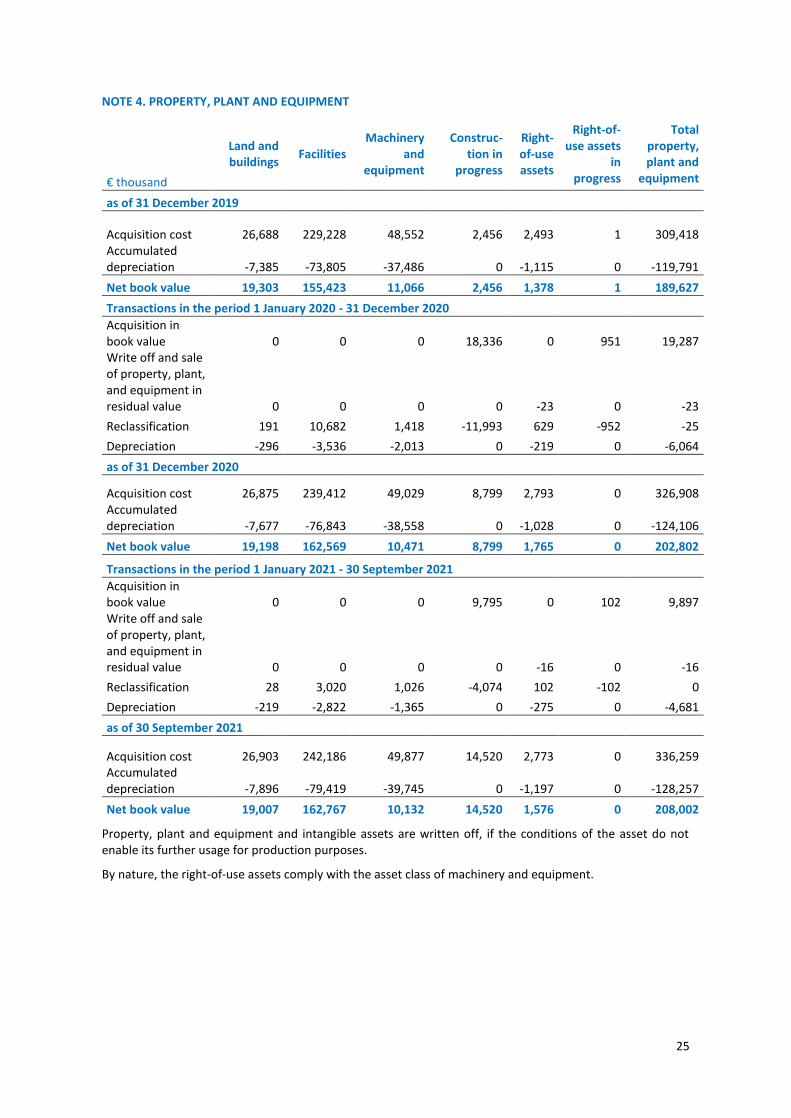
NOTE 4. PROPERTY, PLANT AND EQUIPMENT
€ thousand
Land and buildings
Facilities Machinery
and equipment
Construc-tion in
progress
Right-of-use assets
Right-of-use assets
in progress
Total property, plant and
equipment
as of 31 December 2019
Acquisition cost 26,688 229,228 48,552 2,456 2,493 1 309,418 Accumulated depreciation -7,385 -73,805 -37,486 0 -1,115 0 -119,791
Net book value 19,303 155,423 11,066 2,456 1,378 1 189,627
Transactions in the period 1 January 2020 - 31 December 2020
Acquisition in book value 0 0 0 18,336 0 951 19,287 Write off and sale of property, plant, and equipment in residual value 0 0 0 0 -23 0 -23
Reclassification 191 10,682 1,418 -11,993 629 -952 -25
Depreciation -296 -3,536 -2,013 0 -219 0 -6,064
as of 31 December 2020
Acquisition cost 26,875 239,412 49,029 8,799 2,793 0 326,908 Accumulated depreciation -7,677 -76,843 -38,558 0 -1,028 0 -124,106
Net book value 19,198 162,569 10,471 8,799 1,765 0 202,802
Transactions in the period 1 January 2021 - 30 September 2021
Acquisition in book value 0 0 0 9,795 0 102 9,897 Write off and sale of property, plant, and equipment in residual value 0 0 0 0 -16 0 -16
Reclassification 28 3,020 1,026 -4,074 102 -102 0
Depreciation -219 -2,822 -1,365 0 -275 0 -4,681
as of 30 September 2021
Acquisition cost 26,903 242,186 49,877 14,520 2,773 0 336,259 Accumulated depreciation -7,896 -79,419 -39,745 0 -1,197 0 -128,257
Net book value 19,007 162,767 10,132 14,520 1,576 0 208,002
Property, plant and equipment and intangible assets are written off, if the conditions of the asset do not enable its further usage for production purposes.
By nature, the right-of-use assets comply with the asset class of machinery and equipment.
26
NOTE 5. INTANGIBLE ASSETS
€ thousand
Acquired licenses
and other intangible
assets
Unfinished intangible
assets
Total intangible
assets
as of 31 December 2019
Acquisition cost 4,463 11 4,474
Accumulated depreciation -3,764 0 -3,764
Net book value 699 11 710
Transactions in the period 1 January 2020 - 31 December 2020
Acquisition in book value 0 138 138
Reclassification 119 -119 0
Depreciation -219 0 -219
as of 31 December 2020
Acquisition cost 4,582 30 4,612
Accumulated depreciation -3,983 0 -3,983
Net book value 599 30 629
Transactions in the period 1 January 2021 - 30 September 2021
Acquisition in book value 0 59 59
Depreciation -156 0 -156
as of 30 September 2021
Acquisition cost 4,581 89 4,670
Accumulated depreciation -4,137 0 -4,138
Net book value 443 89 532
NOTE 6. PROVISION FOR POSSIBLE THIRD-PARTY CLAIMS
On 12 December 2017, the Supreme Court made a decision on AS Tallinna Vesi’s cassation in the tariff dispute with the Estonian Competition Authority. The court stated that the Competition Authority is not bound by the agreement on the water tariffs contained in the Services Agreement, which was executed upon privatisation of the company. From now on, the tariffs will be regulated by the Competition Authority in line with the methodology.
According to the law the tariffs established based on the Services Agreement were in force until the Competition Authority approved the new tariffs and the Company implemented these tariffs in line with the law. The Company has acted in good faith and in reliance to the applicable legal acts. Thus, the Company does not consider itself liable to the customers for any claims related to the tariffs applied until the new tariffs approved by the Competition Authority were duly implemented.
On 18 October 2019 the Competition Authority approved the tariffs that the Company had applied for in September of that year. The new tariffs for water services came into force on 1 December 2019. In the Company’s main service area, the private customer tariffs reduced by 27% and commercial customer tariffs dropped by 15%, on average.
The potential undiscounted payments by the Company in the future, if potential claims from customers were recognised by the courts, would amount to €15.1 million (as of 31 December 2020: €24.1 million). This estimate marks the maximum difference in between the tariffs approved based on the Services Agreement and the tariffs based on the Company's estimation, with the reservation to the possible fluctuation, regarding
27
past 15 months (as of 31 December 2020: 24 months), being the approximate remaining unexpired term of potential claims.
The Management Board of the Company has assessed the potential liability resulting from such claims, if successful, to be €6.0 million (as of 31 December 2020: €9.6 million). As of 30 September 2021, claims totalling €1.5 million have been filed within two applications. The Company does not admit any liability and fully rejects it.
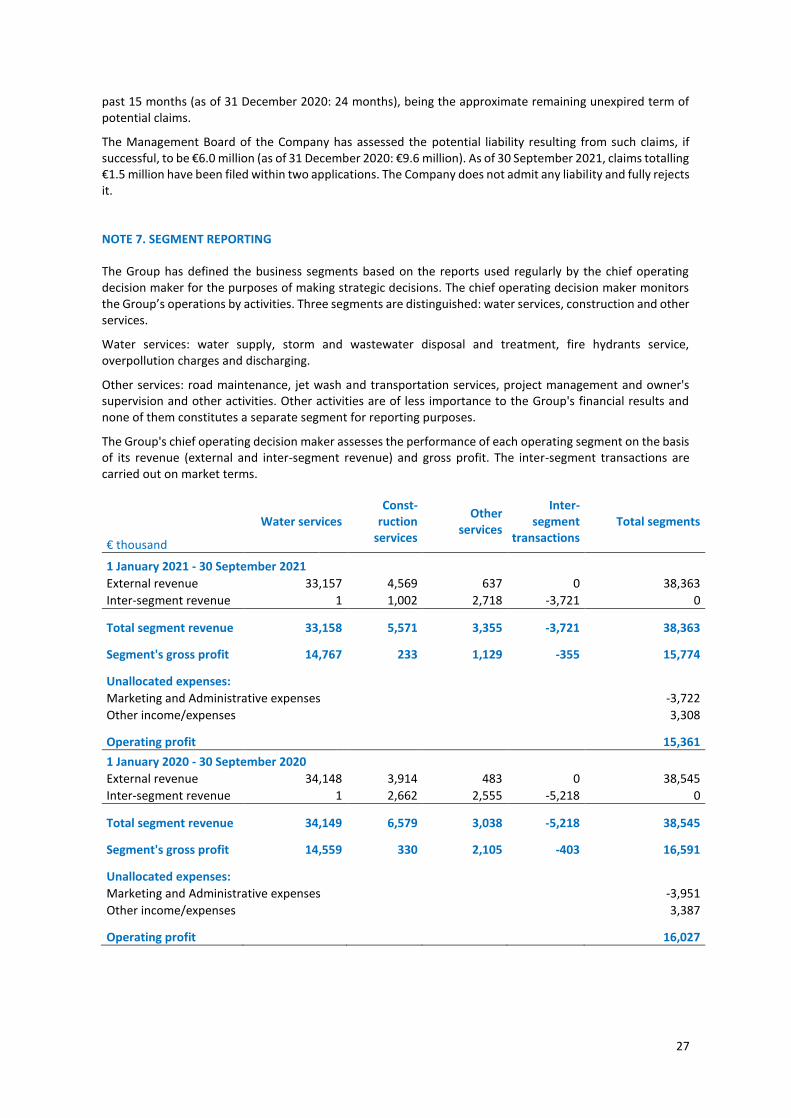
NOTE 7. SEGMENT REPORTING
The Group has defined the business segments based on the reports used regularly by the chief operating decision maker for the purposes of making strategic decisions. The chief operating decision maker monitors the Group’s operations by activities. Three segments are distinguished: water services, construction and other services.
Water services: water supply, storm and wastewater disposal and treatment, fire hydrants service, overpollution charges and discharging.
Other services: road maintenance, jet wash and transportation services, project management and owner's supervision and other activities. Other activities are of less importance to the Group's financial results and none of them constitutes a separate segment for reporting purposes.
The Group's chief operating decision maker assesses the performance of each operating segment on the basis of its revenue (external and inter-segment revenue) and gross profit. The inter-segment transactions are carried out on market terms.
€ thousand
Water services Const-
ruction services
Other services
Inter- segment
transactions Total segments
1 January 2021 - 30 September 2021 External revenue 33,157 4,569 637 0 38,363
Inter-segment revenue 1 1,002 2,718 -3,721 0
Total segment revenue 33,158 5,571 3,355 -3,721 38,363
Segment's gross profit 14,767 233 1,129 -355 15,774
Unallocated expenses: Marketing and Administrative expenses -3,722
Other income/expenses 3,308
Operating profit 15,361
1 January 2020 - 30 September 2020 External revenue 34,148 3,914 483 0 38,545
Inter-segment revenue 1 2,662 2,555 -5,218 0
Total segment revenue 34,149 6,579 3,038 -5,218 38,545
Segment's gross profit 14,559 330 2,105 -403 16,591
Unallocated expenses: Marketing and Administrative expenses -3,951
Other income/expenses 3,387
Operating profit 16,027
28
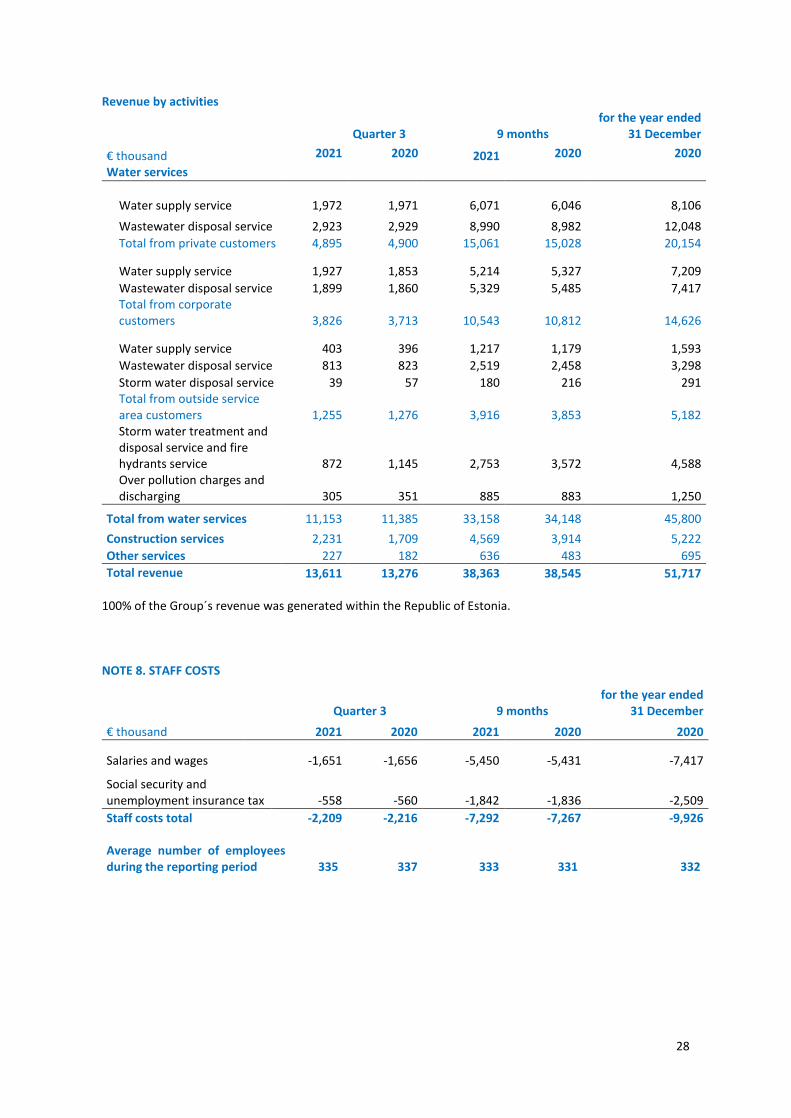
Revenue by activities
Quarter 3 9 months for the year ended
31 December
€ thousand 2021 2020 2021 2020 2020
Water services
Water supply service 1,972 1,971 6,071 6,046 8,106
Wastewater disposal service 2,923 2,929 8,990 8,982 12,048
Total from private customers 4,895 4,900 15,061 15,028 20,154
Water supply service 1,927 1,853 5,214 5,327 7,209
Wastewater disposal service 1,899 1,860 5,329 5,485 7,417
Total from corporate customers 3,826 3,713 10,543 10,812 14,626
Water supply service 403 396 1,217 1,179 1,593
Wastewater disposal service 813 823 2,519 2,458 3,298
Storm water disposal service 39 57 180 216 291
Total from outside service area customers 1,255 1,276 3,916 3,853 5,182
Storm water treatment and disposal service and fire hydrants service 872 1,145 2,753 3,572 4,588
Over pollution charges and discharging 305 351 885 883 1,250
Total from water services 11,153 11,385 33,158 34,148 45,800
Construction services 2,231 1,709 4,569 3,914 5,222
Other services 227 182 636 483 695
Total revenue 13,611 13,276 38,363 38,545 51,717 100% of the Group´s revenue was generated within the Republic of Estonia.
NOTE 8. STAFF COSTS
Quarter 3 9 months for the year ended
31 December
€ thousand 2021 2020 2021 2020 2020
Salaries and wages -1,651 -1,656 -5,450 -5,431 -7,417
Social security and unemployment insurance tax -558 -560 -1,842 -1,836 -2,509
Staff costs total -2,209 -2,216 -7,292 -7,267 -9,926 Average number of employees during the reporting period 335 337 333 331 332
29
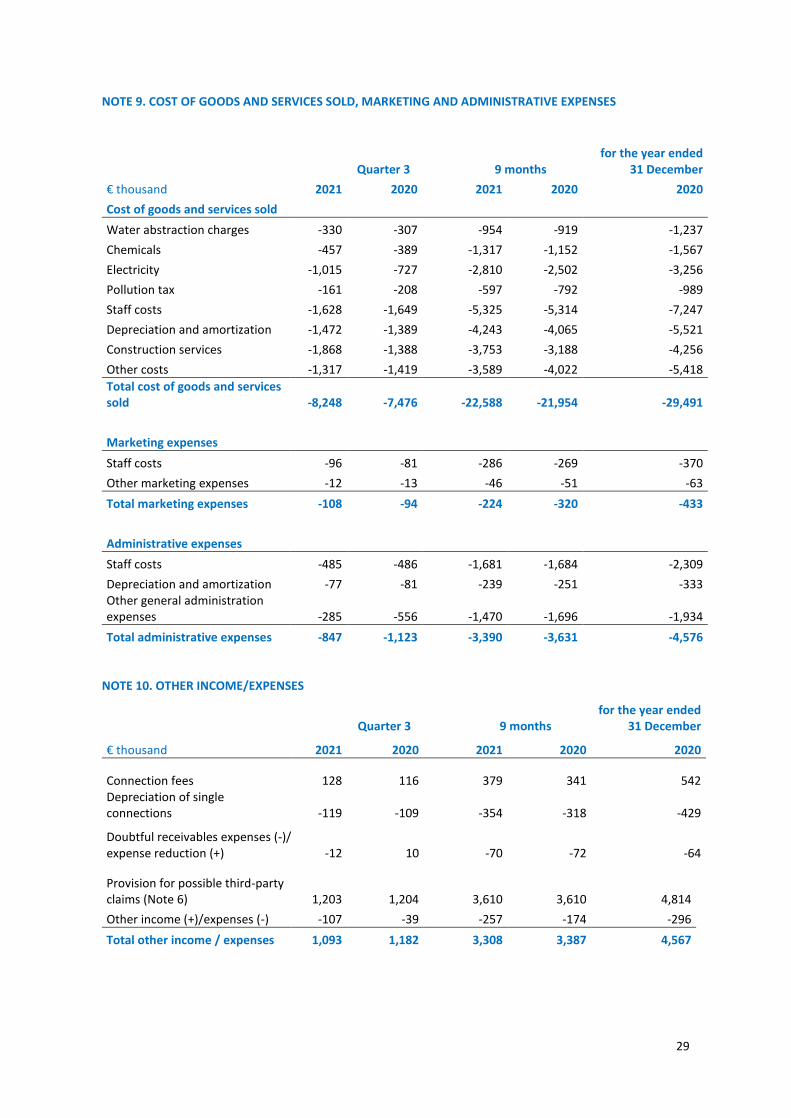
NOTE 9. COST OF GOODS AND SERVICES SOLD, MARKETING AND ADMINISTRATIVE EXPENSES
Quarter 3 9 months for the year ended
31 December
€ thousand 2021 2020 2021 2020 2020
Cost of goods and services sold
Water abstraction charges -330 -307 -954 -919 -1,237
Chemicals -457 -389 -1,317 -1,152 -1,567
Electricity -1,015 -727 -2,810 -2,502 -3,256
Pollution tax -161 -208 -597 -792 -989
Staff costs -1,628 -1,649 -5,325 -5,314 -7,247
Depreciation and amortization -1,472 -1,389 -4,243 -4,065 -5,521
Construction services -1,868 -1,388 -3,753 -3,188 -4,256
Other costs -1,317 -1,419 -3,589 -4,022 -5,418
Total cost of goods and services sold -8,248 -7,476 -22,588 -21,954 -29,491
Marketing expenses
Staff costs -96 -81 -286 -269 -370
Other marketing expenses -12 -13 -46 -51 -63
Total marketing expenses -108 -94 -224 -320 -433
Administrative expenses
Staff costs -485 -486 -1,681 -1,684 -2,309
Depreciation and amortization -77 -81 -239 -251 -333 Other general administration expenses -285 -556 -1,470 -1,696 -1,934
Total administrative expenses -847 -1,123 -3,390 -3,631 -4,576
NOTE 10. OTHER INCOME/EXPENSES
Quarter 3 9 months for the year ended
31 December
€ thousand 2021 2020 2021 2020 2020
Connection fees 128 116 379 341 542 Depreciation of single connections -119 -109 -354 -318 -429
Doubtful receivables expenses (-)/ expense reduction (+) -12 10 -70 -72 -64
Provision for possible third-party claims (Note 6) 1,203 1,204 3,610 3,610 4,814
Other income (+)/expenses (-) -107 -39 -257 -174 -296
Total other income / expenses 1,093 1,182 3,308 3,387 4,567
30
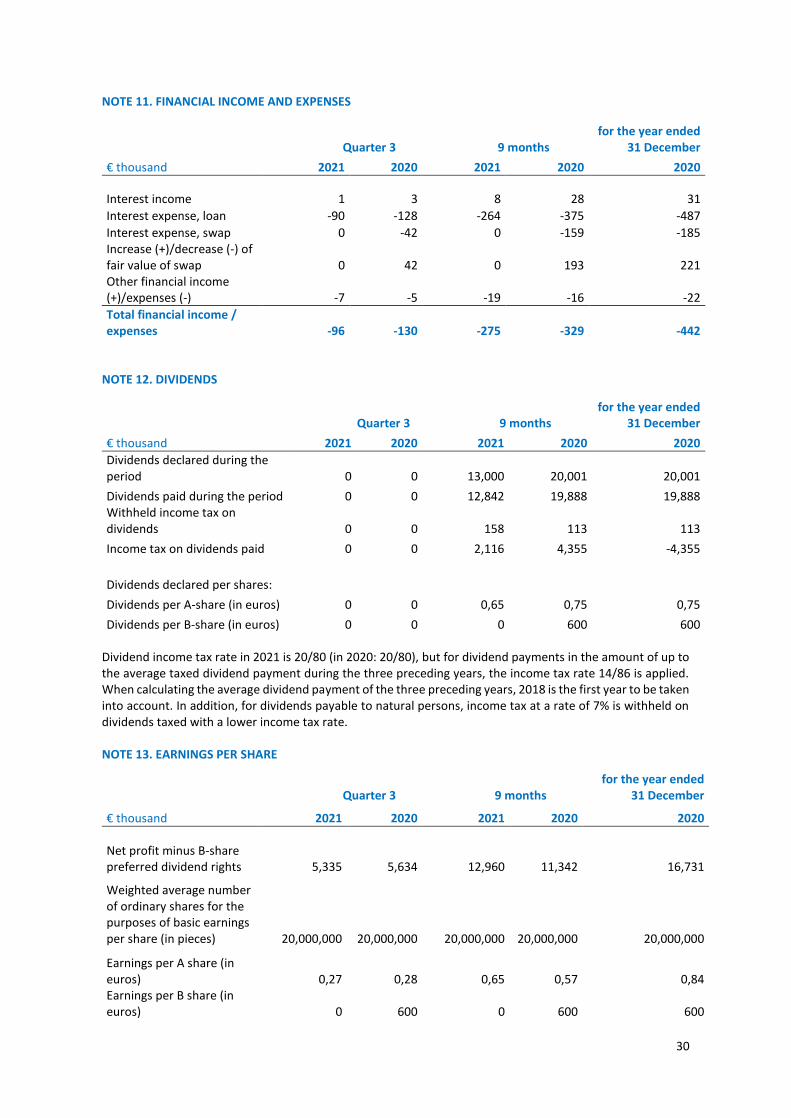
NOTE 11. FINANCIAL INCOME AND EXPENSES
Quarter 3 9 months for the year ended
31 December
€ thousand 2021 2020 2021 2020 2020
Interest income 1 3 8 28 31
Interest expense, loan -90 -128 -264 -375 -487
Interest expense, swap 0 -42 0 -159 -185 Increase (+)/decrease (-) of fair value of swap 0 42 0 193 221 Other financial income (+)/expenses (-) -7 -5 -19 -16 -22
Total financial income / expenses -96 -130 -275 -329 -442
NOTE 12. DIVIDENDS
Quarter 3 9 months for the year ended
31 December
€ thousand 2021 2020 2021 2020 2020
Dividends declared during the period 0 0 13,000 20,001 20,001
Dividends paid during the period 0 0 12,842 19,888 19,888 Withheld income tax on dividends 0 0 158 113 113
Income tax on dividends paid 0 0 2,116 4,355 -4,355
Dividends declared per shares: Dividends per A-share (in euros) 0 0 0,65 0,75 0,75
Dividends per B-share (in euros) 0 0 0 600 600 Dividend income tax rate in 2021 is 20/80 (in 2020: 20/80), but for dividend payments in the amount of up to the average taxed dividend payment during the three preceding years, the income tax rate 14/86 is applied. When calculating the average dividend payment of the three preceding years, 2018 is the first year to be taken into account. In addition, for dividends payable to natural persons, income tax at a rate of 7% is withheld on dividends taxed with a lower income tax rate. NOTE 13. EARNINGS PER SHARE
Quarter 3 9 months for the year ended
31 December
€ thousand 2021 2020 2021 2020 2020
Net profit minus B-share preferred dividend rights 5,335 5,634 12,960 11,342 16,731
Weighted average number of ordinary shares for the purposes of basic earnings per share (in pieces) 20,000,000 20,000,000 20,000,000 20,000,000 20,000,000
Earnings per A share (in euros) 0,27 0,28 0,65 0,57 0,84 Earnings per B share (in euros) 0 600 0 600 600
31
Diluted earnings per share for the periods ended 30 September 2021 and 2020 and 31 December 2020 was equal to earnings per share figures stated above.
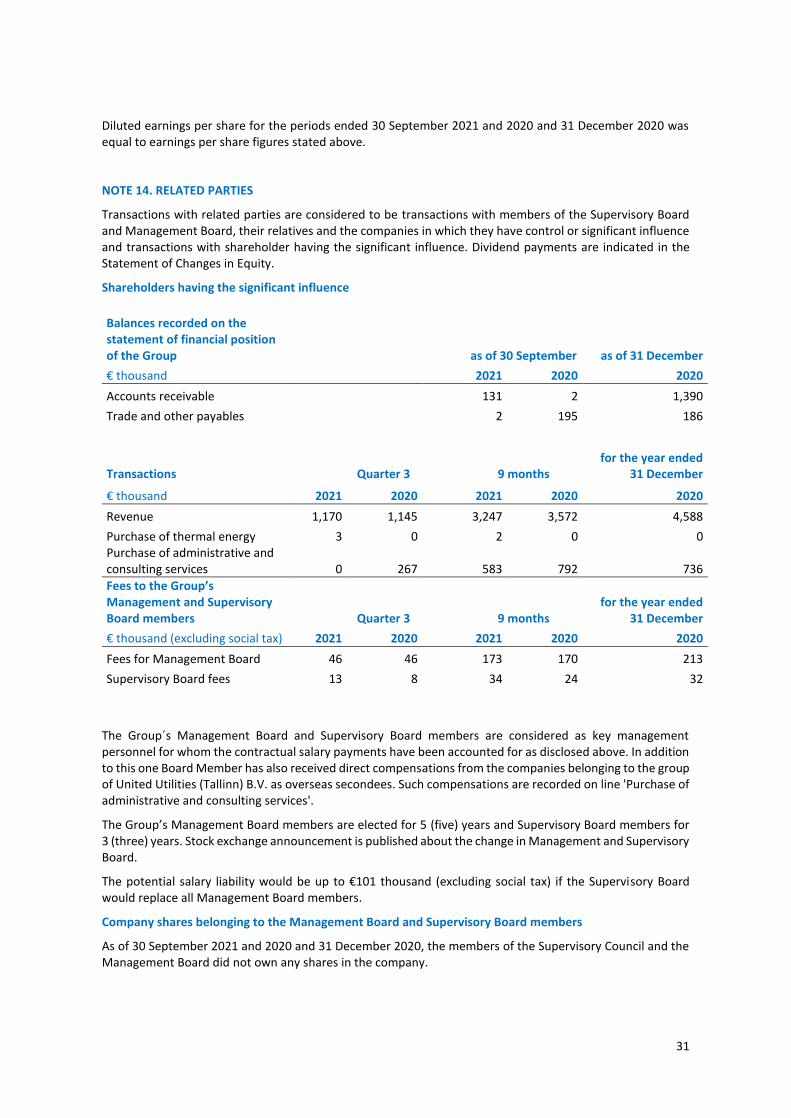
NOTE 14. RELATED PARTIES
Transactions with related parties are considered to be transactions with members of the Supervisory Board and Management Board, their relatives and the companies in which they have control or significant influence and transactions with shareholder having the significant influence. Dividend payments are indicated in the Statement of Changes in Equity.
Shareholders having the significant influence
Balances recorded on the statement of financial position of the Group as of 30 September as of 31 December
€ thousand 2021 2020 2020
Accounts receivable 131 2 1,390
Trade and other payables 2 195 186
Transactions Quarter 3 9 months for the year ended
31 December
€ thousand 2021 2020 2021 2020 2020
Revenue 1,170 1,145 3,247 3,572 4,588
Purchase of thermal energy 3 0 2 0 0 Purchase of administrative and consulting services 0 267 583 792 736
Fees to the Group’s Management and Supervisory Board members Quarter 3 9 months
for the year ended 31 December
€ thousand (excluding social tax) 2021 2020 2021 2020 2020
Fees for Management Board 46 46 173 170 213
Supervisory Board fees 13 8 34 24 32
The Group´s Management Board and Supervisory Board members are considered as key management personnel for whom the contractual salary payments have been accounted for as disclosed above. In addition to this one Board Member has also received direct compensations from the companies belonging to the group of United Utilities (Tallinn) B.V. as overseas secondees. Such compensations are recorded on line 'Purchase of administrative and consulting services'.
The Group’s Management Board members are elected for 5 (five) years and Supervisory Board members for 3 (three) years. Stock exchange announcement is published about the change in Management and Supervisory Board.
The potential salary liability would be up to €101 thousand (excluding social tax) if the Supervisory Board would replace all Management Board members.
Company shares belonging to the Management Board and Supervisory Board members
As of 30 September 2021 and 2020 and 31 December 2020, the members of the Supervisory Council and the Management Board did not own any shares in the company.
32
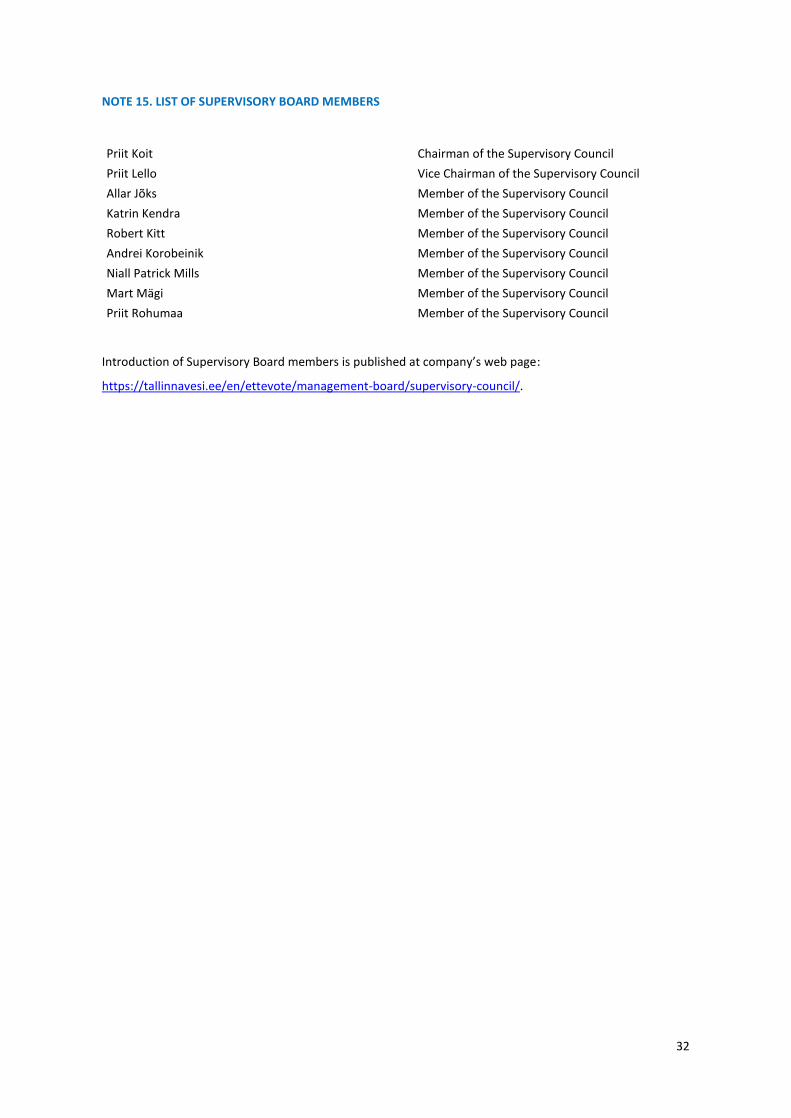
NOTE 15. LIST OF SUPERVISORY BOARD MEMBERS
Priit Koit Chairman of the Supervisory Council
Priit Lello Vice Chairman of the Supervisory Council
Allar Jõks Member of the Supervisory Council
Katrin Kendra Member of the Supervisory Council
Robert Kitt Member of the Supervisory Council
Andrei Korobeinik Member of the Supervisory Council
Niall Patrick Mills Member of the Supervisory Council
Mart Mägi Member of the Supervisory Council
Priit Rohumaa Member of the Supervisory Council
Introduction of Supervisory Board members is published at company’s web page:
https://tallinnavesi.ee/en/ettevote/management-board/supervisory-council/.