current government policies towards health, education and
TRANSCRIPT

1
Current Government Policies Towards Health, Education and Poverty Alleviation in India:
An Evaluation
PRAVEEN JHA∗ Introduction
The fact that substantial sections of Indian population suffer from serious
deprivations vis-a-vis a set of commonly acknowledged basic needs, such as adequate
food, shelter, clothing, basic health care, primary education, clean drinking water and
basic sanitation - is well known. In this regard, one may recall some sentences from the
address to the country by the President of India on the occasion of the Independence
Day 2000:
“Fifty years into the life of our Republic we find that justice - social, economic and political - remains an unrealized dream for millions of our fellow citizens. The benefits of our economic growth are yet to reach them. We have one of the world’s largest reservoirs of technical personnel, but also the world’s largest number of illiterates, the world’s largest middle class, but also the largest number of people below the poverty line, and the largest number of children suffering from malnutrition. Our giant factories rise out of squalor, our satellites shoot up from the midst of the hovels of the poor. Not surprisingly, there is sullen resentment among the masses against their condition erupting often in violent forms in several parts of the country. Tragically, the growth in our economy has not been uniform. It has been accompanied by great regional and social inequalities. Many a social upheaval can be traced to the neglect of the lowest of society, whose discontent moves towards the path of violence”.
Such an acknowledgement by the former President of the multidimensional
deprivations afflicting millions of citizens is a damning indictment of the key failures of
India’s development experience, and highlights some of crucial challenges confronting
∗ Centre for Economic Studies and Planning, Jawaharlal Nehru University, New Delhi. The
author gratefully acknowledges the most valuable research assistance for this paper provided by Subrat Das, Sibasankar Mohanty and Vineet Kohli. This paper draws substantially on two of the author’s earlier writings: (1) Country Input for the SAARC Social Charter: A Concept Note, and (2) Rhetoric and Reality - Policy Watch; the first paper was written on behalf of the Council for Social Development, New Delhi, and the second was a contribution to the Citizens Report on Governance and Development of the National Social Watch Coalition, 2003.
2
the Indian society. Indeed, the major shortcoming of the State-led economic
transformation in India after independence is not the lack of economic growth or
industrialization (as is often portrayed in some quarters), - on the contrary, in these
respects Indian performance has been atleast respectable - but it is in the realm of
policies and processes that could have facilitated the fulfillment of the above noted basic
needs. Moreover, there is some concern that with reference to some of these basic needs
the prospects may have worsened relatively during what is commonly described as the
period of economic reforms (i.e. the period since July 1991 onwards).
This essay attempts to evaluate the current policy commitments of government
with respect to health, education and poverty alleviation, mainly with reference to 2002,
although obviously locating these in the context of the framework of economic reforms
unfolding for well over a decade now. For reasons of information availability, it is largely
the central government’s policies which form the basis of discussions. Core features of
the relevant policy pronouncements and their implications are outlined, and to the extent
possible, the facts and figures are looked at. As is well-known often there are significant
time lags between a policy pronouncement and its implementation, and such lags are
even larger when it comes to the data availability relating to implementation and its
outcomes. Thus, at this point, tracking down what happened in the year 2002 due to the
relevant policies can only be a quick assessment keeping in mind the limitations
mentioned in the foregoing, and a more substantive analysis can be undertaken only at a
later date. It may also be noted here that the important concern of the paper is to
explore specific connections between the relevant policies and the possible consequences
for the relatively marginalised social and economic groups.
3
The three themes chosen for this paper are absolutely central for the general well-
being in any society and there is a substantial literature on their treatment in the
discourses on public policy in India. It may be in order here to begin with a discussion
of the salient features of the avowedly stated commitments of the state to the fulfillment
of these basic needs. In particular, it is worth emphasizing the argument that the public
provisioning of these basic needs may be considered inalienable rights of all citizens, and
the case for such an argument emerges from the official pronouncements itself. In the
next section, an attempt is made to outline such a perspective, and the subsequent
sections look at the current policies and their consequences with respect to the core
themes chosen for this paper.
Should Public Provisioning of Basic Needs be Considered Rights to Development in India’s Constitutional Context? India’s Constitution, through its Preamble and the chapters on the Fundamental
Rights and the Directive Principles of State Policy, provides an useful starting point to
situate and analyse the rights to development in the Indian context. As is well-known,
the Indian Constitution, as it came into being in 1950, was interpreted to have a clear
distinction between a set of fundamental rights (essentially consisting of some basic civil
and political rights) vis-a-vis which an individual is guaranteed against coercive or
arbitrary state action, and a set of directive principles (i.e. a set of economic, social and
cultural rights) which should be the guiding principles, or the goals and aspirations, for
State’s actions in the interest of the citizens’ welfare. From a legal point of view, the
sharp distinction between the two sets of rights was that the former (i.e. the set of
fundamental rights) was justiciable whereas the latter (i.e. the set of directive principles)
was not. Thus in terms of legality, the directive principles, (henceforth DP), which
essentially consist of what the contemporary discourse views as preeminent rights to

4
development such as the rights to food, shelter, health, basic education etc., are inferior
to the fundamental rights (henceforth FR). It was hoped by the framers of Indian
Constitution that inspite of DP being ranked lower than FR, the seriousness of the
former would not be undermined. As Dr. Ambedkar put it: “It is the intention of the
Assembly that in future both the legislature and the executive should not merely pay lip-
service to these principles .... but they should be made the basis of all executive and
legislative action that may be taken thereafter in the matter of governance of the country”
(emphasis added). Ostensibly, one of the primary reasons for DP being kept non-
justiciable was the financial weakness of the newly independent state. Again to quote Dr.
Ambedkar: “A State just awakened from freedom from its many preoccupations might
be crushed under the (financial) burden unless it was free to decide the order, the time,
the place and the mode of fulfilling them (i.e. the Directive Principles)”. Thus, by
implication, fulfillment of entitlements mapped under the DP was made contingent on
the State’s economic capacity. The other major reason for keeping the DP non-
justiciable was presumably the inherent difficulties in specifying the duties (of the State)
in a rigorous and precise manner, vis-a-vis the economic social and cultural rights
covered under the DP.
Both these ostensible reasons for keeping the DP non-justiciable are contentious
and merit closer scrutiny. But before we do that, it may be worth recalling some of the
major commitments made internationally by India. In this regard, the first point to note
is that the FR and the DP between them cover almost the entire ground laid out by the
Universal Declaration of Human Rights (henceforth UDHR). Three years after the
United Nations came into being, its General Assembly put into place a most significant
instrument in the form of the UDHR, in the hands of the emerging human rights
discourse. Through its 30 articles, which spell out basic civil, political, economic, social

5
and cultural rights that should be available to all human beings in every member country,
the UDHR of 1948 began a process of defining a broad range of rights, that would have
international acceptability, and to explore and establish mechanisms to promote and
defend those rights. As regards the overlap between UDHR and the Indian Constitution
mentioned above, articles 3 to 21 of the UDHR, listing a set of civil and political rights,
are incorporated in Part III, i.e. the Fundamental Rights as articles 12-35 of the
constitution, and the articles 22 to 27 of the UDHR focusing on the economic, social and
cultural rights to which all human beings are entitled, cover the same ground as the Part
IV, i.e. the Directive Principles through articles 36 to 51 of the constitution.
The UDHR, along with the two International Covenants on Human Rights, India
being a party to both, comprise what is generally described as the International Bill of
Human Rights. The International Covenant on Economic, Social and Cultural Rights
came into force in January 1976 and by 1998 it had 137 state parties. Briefly, as put by a
UN document, (UN, 1998) the rights that this Covenant seeks to promote are:
* The right to work in just and favourable conditions; * The right to social protection, to an adequate standard of living and to the
highest attainable standards of physical and mental well-being; * The right to education and the enjoyment of benefits of cultural freedom and
scientific progress. Source: Reproduced from Basic Facts About the United Nations, page 220, UN (1998).
The State parties to this Covenant are supposed to submit periodic reports to the
committee on Economic, Social and Cultural Rights as regards the implementation of the
provision of the Covenant. In turn the committee, after deliberating on the report with
6
the representatives of the government concerned, is supposed to help State parties in
better implementation of the rights enshrined in the Covenant.
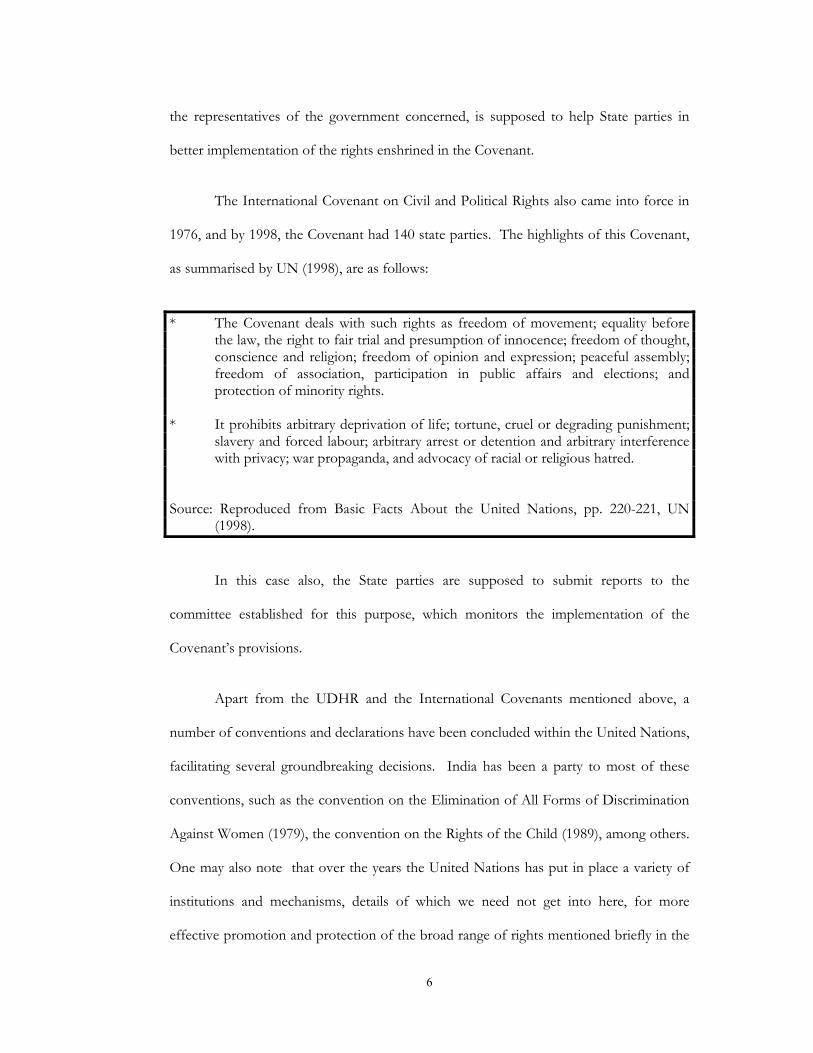
The International Covenant on Civil and Political Rights also came into force in
1976, and by 1998, the Covenant had 140 state parties. The highlights of this Covenant,
as summarised by UN (1998), are as follows:
* The Covenant deals with such rights as freedom of movement; equality before
the law, the right to fair trial and presumption of innocence; freedom of thought, conscience and religion; freedom of opinion and expression; peaceful assembly; freedom of association, participation in public affairs and elections; and protection of minority rights.
* It prohibits arbitrary deprivation of life; tortune, cruel or degrading punishment;
slavery and forced labour; arbitrary arrest or detention and arbitrary interference with privacy; war propaganda, and advocacy of racial or religious hatred.
Source: Reproduced from Basic Facts About the United Nations, pp. 220-221, UN (1998).
In this case also, the State parties are supposed to submit reports to the
committee established for this purpose, which monitors the implementation of the
Covenant’s provisions.
Apart from the UDHR and the International Covenants mentioned above, a
number of conventions and declarations have been concluded within the United Nations,
facilitating several groundbreaking decisions. India has been a party to most of these
conventions, such as the convention on the Elimination of All Forms of Discrimination
Against Women (1979), the convention on the Rights of the Child (1989), among others.
One may also note that over the years the United Nations has put in place a variety of
institutions and mechanisms, details of which we need not get into here, for more
effective promotion and protection of the broad range of rights mentioned briefly in the
7
foregoing. Through periodic summits and declarations, majority of the governments
across the globe have repeatedly affirmed their support to such rights. One such well-
known occasion was the Summit for Social Development of 1995 (held in Copenhagen,
Denmark), convened by the General Assembly, in which the government representatives
from 117 countries (including India), pledged themselves to address the ‘profound social
problems’ confronting, in particular, the marginalised and disadvantaged groups.
Through the Summit’s Declaration and Programme of Action, world leaders again
committed themselves to universal access to education and primary health care, full
employment as a basic policy goal, eradication of poverty, promotion of social
integration particularly of the vulnerable and disadvantaged groups, and many other
desirable goals.
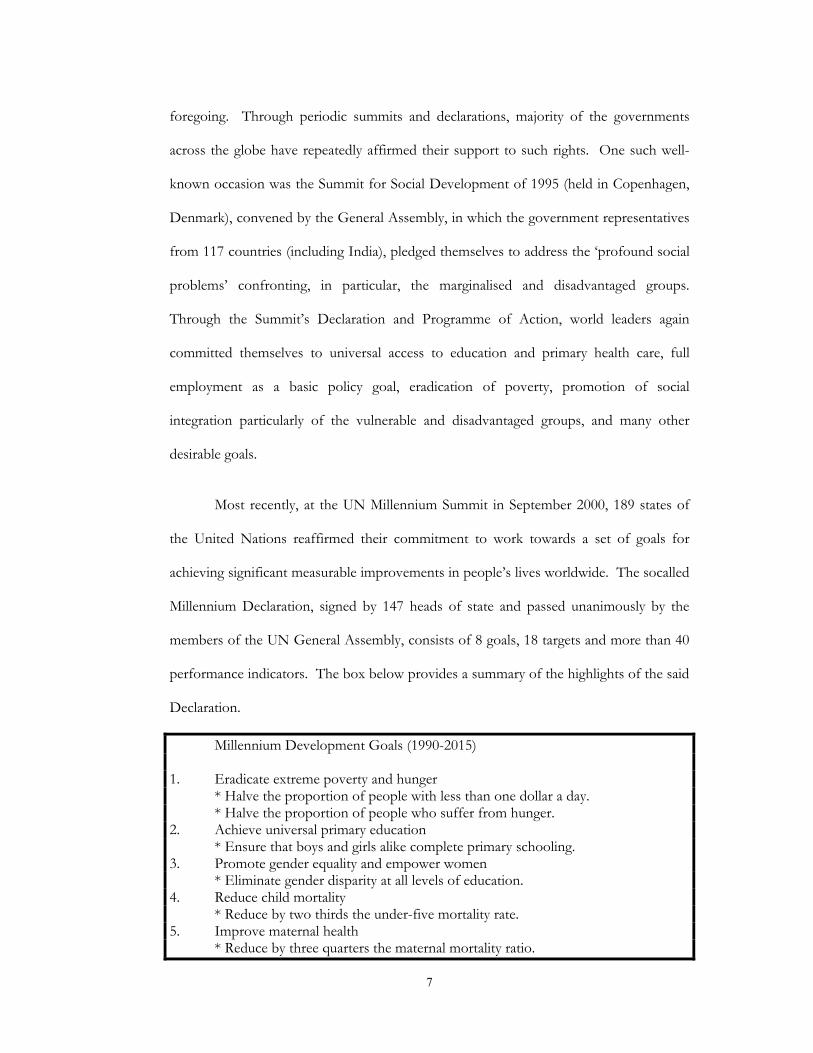
Most recently, at the UN Millennium Summit in September 2000, 189 states of
the United Nations reaffirmed their commitment to work towards a set of goals for
achieving significant measurable improvements in people’s lives worldwide. The socalled
Millennium Declaration, signed by 147 heads of state and passed unanimously by the
members of the UN General Assembly, consists of 8 goals, 18 targets and more than 40
performance indicators. The box below provides a summary of the highlights of the said
Declaration.
Millennium Development Goals (1990-2015) 1. Eradicate extreme poverty and hunger * Halve the proportion of people with less than one dollar a day. * Halve the proportion of people who suffer from hunger. 2. Achieve universal primary education * Ensure that boys and girls alike complete primary schooling. 3. Promote gender equality and empower women * Eliminate gender disparity at all levels of education. 4. Reduce child mortality * Reduce by two thirds the under-five mortality rate. 5. Improve maternal health * Reduce by three quarters the maternal mortality ratio.

8
6. Combat HIV/AIDS, malaria and other diseases. * Reverse the spread of HIV/AIDS. 7. Ensure environmental sustainability * Integrate sustainable development into country policies and reverse loss of
environmental resources. * Halve the proportion of people without access to potable water. * Significantly improve the lives of at least 100 million slum dwellers. 8. Develop a global partnership for development * Raise official development assistance * Expand market access. * Encourage debt sustainability. Source: The Costs of Attaining the Millennium Development-Goals, World Bank, 2003.
In brief, the problems associated with grossly inadequate - even in an absolute
sense - economic and social development in different parts of the world have been at the
centre stage of several UN conventions, declarations etc. and repeated commitments
have been made by the member states, including India, to take effective measures to
address the same. Thus, it is hardly the case that the broad range of economic and social
rights - broadly coterminous with what is often described as rights to development - are
not acknowledged as being critically important; the substantive issue is: are there
compelling reasons for them not to be taken seriously inspite of official repeated
endorsement as their ostensibly being central to socio-economic policies?
It was mentioned earlier that the articles enshrished in the DP of India’s
constitution, although considered most desirable, were treated as being inferior to FR
and there was no guarantee that they will be executed. One of the presumed major
reasons for it was that the fulfillment of DP was made contigent on the State’s economic
capacity. Whatever may have been the weight of such an argument soon after
independence, it may be possible to argue today that it does not appear quite convincing.
With appropriate policies of taxation and a reordering of expenditure priorities, there is
no reason why substantial progress can not be achieved vis-a-vis a set of chosen
9
entitlements, such as basic food and nutrition drinking water, sanitation, shelter, basic
education and primary health care. Although figures relating to the aggregate nuclear
military expenditure by India are not available in the public domain, it may not be
unrealistic to surmise that the quantum of expenditure on this head alone since
independence, if committed to the entitlements mentioned above, would have gone a
long way towards their fulfillment. Ofcourse, a detailed calculus is required to estimate
the potential resource mobilisation for meeting these basic needs - and there are
estimates generated by concerned scholars periodically - there is no reason to believe
that, with appropriate reorientations in fiscal policies of the central and the state
governments, the task is beyond the economic capacity of the Indian nation.
In this context it may also be noted that the impression generated sometimes that
in terms of resource requirements, there is a huge gap between facilitating FR and
enabling DP may be misleading. Garagantum paraphernalia of judicial, internal security
and prison systems prevalent in India is an enormous resource guzzler by any reckoning,
and hence the argument that the required commitment of resources and efforts involved
in the case of defending civil and political rights - the socalled ‘negative’ rights - is any
less strenuous for the State’s capacity to pay, in comparison with what may be required
for the fulfillment of the basic economic and social rights, or the socalled ‘positive’
rights. Moreover, it is reasonable to suggest that the neglect of the ‘positive’ rights
generally leads to increased resource burden for the state to maintain ‘negative’ rights.
To put it bluntly, spending on schools, hospitals, poverty eradication etc. may be a
desirable option for any society to enable it to spend less on police and prisons.
The other argument against giving more teeth to the provisions under the DP has
to do with the presumed near-insurmountable difficulties in unambiguous specification
10
of the duties and obligations, which correspond to the said provisions. Extreme version
of the argument is: it is impossible to fix responsibilities and mechanisms for the rights
claimed under the DP and hence they can not be made justiciable. Sure enough, there
are inherent difficulties in rigorous specification of the obligations and mechanisms with
reference to many provisions covered by the DP, but the extreme version of the
argument just stated is akin to throwing the baby with the bathwater. It is certainly
possible to establish a minimum agenda covering what is generally accepted as basic
needs. In this respect there may be useful lessons to learn from the perspectives from
the other countries (i.g. the commitment shown by several low income countries to their
social sector), our own experience (e.g. the Employment Guarantee Scheme in
Maharashtra) and other initiatives. For instance, the UN Committee on Economic,
Social and Cultural rights, undertook the task of delineating and defining minimum ‘core’
under each right, which should be guaranteed to all human beings by their respective
governments, in the absence of which the concerned State party is to be considered
violating its obligation. This Committee’s efforts at establishing the core norms and
setting up the monitoring procedures related to them has led to the formulation of a
minimum agenda, which is roughly same as the generally accepted package of basic
needs: the right to food, to shelter, to clothing, to basic sanitation and clean water, to
basic health care and at least primary education. The UN Committee took the view that
the provision of such rights provide, together with the crucial principle of non-
discriminatory access, the absolute basic foundation of human existence.
Putting in place the agenda of minimum rights of the kind must be considered a
matter of highest priority; the argument against it on the grounds of financial
implications ignores the huge human costs in the present as well as overtime, and must
be rejected. Ofcourse, it is not being suggested here that financial considerations ought

11
to be treated in a cavalier fashion. Sure enough, it is very important that for the
provisioning of several of these rights, with a well-defined floor level, appropriate and
cost - effctive technologies and strategies must be harnessed. However, the crux of our
argument is that we ought to move away from a conventional approach rooted in desirability of a set of
basic needs, which smacks of charity, to a rights-based approach that starts with the position that all
citizens must have a set of core entitlements, which are justiciable, and in whose provisioning the State
must be held primarily accountable. Obstacles in the way of the fulfillment of such entitlements must be
confronted, and the most efficient ways of meeting the necessary obligations must be explored on an
ongoing basis. It must also be emphasized that in such a perspective, citizens must not be viewed as
passive beneficiaries of handouts but active participants and claim-holders. Thus the core policy
concern ought to be to devise instruments, mechanisms and institutions which enable
people to realize their entitlements.
It is indeed heartening to note that the advocacy for rights based approach has
become quite prominent in the recent years. The social scientific literature on this – such
as contributions by Rawls, Dworkin, Amartya Sen, among others – are well-known. In
the Indian context, one of the most significant development has been that the apex
court, during the last couple of decades, has displayed lot of creativity and activism in
support of making many of the economic and social rights as important as the FR.
Possibly the Kesavanand Bharati vs. State of Kerala (1973) was the turning point
in this respect when a full bench of the Supreme Court deliberated on the relationship of
DP and FR, and took the view that there was a need for a harmonious relationship
between the two. However, the case for a most powerful endorsement of economic and
social rights was made by the Supreme Court in the Francis Coralie Mullan’s Case (1981),
when the court held that the expression right to life (i.e. article 21 of FR), must include
12
‘the right to live with human dignity and all that goes along with it, the bare necessities
of life such as adequate nutrition, clothing and shelter over the head’. While
acknowledging the potential economic constraints, the court ruled that the right to ‘life’
must include the right to a minimum wherewithal so as to carry on functions and
activities that may be considered at least the bare minimum expression of human life. In
effect, the apex court in India through this case has rendered the fundamental right to life
as a repository of some basic economic and social rights. Moreover, in a number of
subsequent cases, the apex court has continued to interpret Article 21 in a broad sense to
facilitate inclusion of a number of economic and social rights. Some of the major
landmarks in this respect include the following
a) Olge Tellis Case (1985), in which the court held that the right to livelihood is
included in the right to life.
b) Bandhua Mukiti Morcha Case (1984), in which the court ruled that it was
fundamental right of all citizens to live with human dignity, and bondage was
antithetical to the requirements under Article 21.
c) M.C. Mehta vs. Union of India, in which the court ordered the closure of some
tanneries, whole effluents were being discharged into the Ganges, on the ground
that the right to healthy environment is consistent with the meaning of life in the
Article 21.
d) J.P. Unikrishnan vs. State of Andhra Pradesh (1993), in which the court ruled
that free education upto 14 years of age is a right in accordance with the Article
21. In an earlier case also, Mohini Jain vs. State of Karnataka (1992), the judges
said that “the right to education flows directly from the right to life”.
e) Vellore Citizens Welfare Forum vs. Union of India (1996), and B.L. Wadhera vs
Union of India (1996), in which protection against hazardous industries and the
13
provision of pollution free air and water were decreed as inclusive elements of
the meaning of life in the Article 21.
f) Paschim Bangal Khet Mazdoor Sabha vs. State of West Bengal (1996), in which
the court ruled that providing timely medical facility to its citizens is an essential
obligation of the State.
These are only a few among several judgements by the Supreme Court in
India to widen the meaning of life in Article 21, compared to its narrow and
conservative interpretations in the 1950s and '60s. Going by the relevant verdicts of
the apex court during the last couple of decades, it is eminently clear that the rights to
education, health, food, shelter etc. have been included within the ambit of Article
21, and thus have been, in principle, made justiciable. Justice K. Ramaswamy, in a
1997 judgement, citing the UN declaration of the Right to Development, to which
India was a party, as being the foundation for obligating and enforcing such sights,
said:
“India being a signatory of the UN declaration of the Right to Development means
that it is the duty of the Indian State to formulate its policies legislative or executive,
accord equal attention to the promotion of, and to protect the right to social,
economic, civil and cultural rights of the people, in particular, the poor, the Dalits
and Tribes as enjoined in Article 46 read with Articles 38, 39 and all other related
articles read with the right to life guaranteed by Article 21 of the Constitution of
India” (emphasis added).
We may also note that in several of its verdict, as should also be evident
from the preceding quote, the apex court has been proactive in acknowledging the
discrimination suffered by the vulnerable economic and social groups and has
14
displayed its commitment towards the redressal of the same. To cite just one such
verdict where the judges stood for the equal rights of women and said: ‘equality,
dignity of person and the right to development are inherent rights in every human
being’, [Samatha vs. State of Andhra Pradesh (1997)]. Glaring discriminations on
account of gender, caste and along several other lines are very well-documented not
only in the countries of South Asia, but the developing world as a whole, (and also in
muted forms in the developed countries as well). Problem assumes almost a tragic
dimension when such discrimination is rampant with reference to even the most
basic requirements such as food. As Susan George put it quite pithily in her ‘How
the Other Half Dies’: “Could anyone be more undernourished and forlorn than a
poor man at the bottom of the pile in a UDC? Yes – his wife and usually his
children”.
Coming back to India’s apex court position through its several verdicts now, on
the basic rights to development such as the rights to food, shelter, primary education,
basic health, sanitation etc., there is no ambiguity whatsoever that these rights have been
interpreted as being enforceable without any discrimination along the social or economic
lines. The questions, however, relating to enforcement mechanism still appear to be
shrouded in ambiguities. Sure enough, the apex court appears to have been engaged in
exploring process and norm clarifications regarding the enforcibilities of these rights.
Illustrative of such efforts, just to take one example, is its recent pronouncements
relating to the right to food. In one of its interim orders passed in November 201, in
response to the PIL filed by PUCL, the SC said that where people were unable to feed
themselves adequately, the State was obliged to make provisions. Towards that, it was
suggested that:
15
(i) benefits of all nutrition - related programmes be converted into legal
entitlements;
(ii) all state governments and the central government were given the direction to
ensure awareness and transparency of these programmes; and
(iii) all state governments were directed to introduce cooked mid-day meals in
primary schools within six months.
More recently, in October 2002, the apex court has decreed that chief secretaries
of the state governments shall be held answerable for starvation deaths in their respective
states.
Such decisions of the apex court have ofcourse been important towards
establishing norms and processes towards ensuring enforceability of the right to
development, but there is still a long way to go. One may also suggest here that making
the rights to developmen justiciable and establishing clear legal mechanisms for them is
only half the battle won. The other half, and the more difficult one is to ensure vibrant
social and political processes committed to the realization of these rights. This is where
there is a long and arduous struggle ahead, which appears to have been made even more
difficult by the currently ascendant and accelerated processes of liberalization and
globalization in the recent years.
Now we move on to take a close look at the current policies towards the three
core themes mentioned at the beginning of this paper, and track the implications of the
same.
16
II
Health Care Scenario: A Background
Under the Constitution of India, in terms of distribution of sectoral
responsibilities in the federal set up, health is a state subject. However, a number of
items related to health are listed in the concurrent list, and thus the Central Government
has had enough scope to influence the context and the prospects in the health sector
through its policies, budgetary allocation etc.
By any reckoning the health care facilities for overwhelming majority of people in
India are poor, both quantitatively and qualitatively. As per the most recent available
estimates, urban areas have only 4.48 hospitals, 6.16 dispensaries and 308 beds per one
lakh of (urban) population and these figures are far from adequate by any acceptable
standard but seem to be much better than the corresponding figures for rural areas. For
the rural areas the situation is much worse with 0.77 hospitals, 1.37 dispensaries, 3.2
PHCs and just 44 beds per one lakh of (rural) population (Duggal, 2002). Not only the
progress of the country in the health sector in the 55 years after Independence has been
grossly inadequate but it may well be the case that there has been a slowing down in
many respects in the recent years. Numerous indicators can be cited, apart from those
mentioned above, to drive home this point. For instance, for the country as a whole,
number of beds per lakh of population, which had increased from 32 in 1951 to 83 in
1982 , was only 93 in 1998. Similarly the number of doctors per lakh of populaton
increased from 17 in 1951 to 47 in 1991, but stood at 52 in 1998.
Also, as is well-known, the curative services are primarily located in urban areas
whereas the rural institutions mainly provide preventive and promotive services. It
17
would not be an exaggeration to say that the curative care facilities are almost non-
existent in rural areas, which has contributed to a massive proliferation of quacks in
many parts of the country. It is on account of both the very poor spread and lamentable
quality of preventive as well as curative health care system that the morbidity and
mortality levels are still at unacceptably high levels in the country. Communicable disease
like Malaria and TB continue to haunt substantial sections of population. Even common
water-borne diseases like Gastroenteritis and Cholera are still contributing to the high
levels of morbidity.
One of the main reasons underlying the poor state of health care facilities in
India happens to be the very low levels of public expenditure in health sector, which
happens to be among the lowest in the world as may be seen from Table 2.1 in the
appendix. During the decade of the 1990s, it became even worse as the public
investment on health as a percentage of GDP declined from 1.3% in 1990 to 0.6 % in
1999.
Currently the aggregate annual expenditure on health is 5.2 % of GDP. Out of
this, about 17 % of aggregate spending is coming from the State, the rest being out-of-
pocket expenditure borne by the citizens directly. While the budgetary allocation on
health sector by the Central Government over the last decade has been stagnant at 1.3 %
of the total Central Budget, that in the states it has declined from 7 % to 5.5 %( Draft
National Health Policy, 2001). The following tables give us yet other approximate
indicators of the huge deficiency and inadequate progress in the health sector (see Table
2.2), and whittling down of government’s commitment (see Table 2.3).
Also, it is quite an irony that in a context of widespread deprivations vis-a-vis the
most basic needs, the system of medical care in the country is one of the most privatised

18
systems anywhere in the world (See Table 2.4). In 1997, an estimated 68 % of the
hospitals, 56 % of dispensaries, 37 % of beds and 75 % of the allopathic doctors were in
the private sector (Duggal, 2002). The major squeeze on the fiscal resources of almost all
the state governments in the last decade has meant that public investment in the health
sector, instead of rising, has been stagnant at best in most cases. As mentioned earlier,
health being primarily a state subject as per the Constitution, the contribution of Central
Government to the overall public health funding has been limited; moreover, the
successive Governments at the Centre have unfortunately shown an accelerated
tendency of withdrawing from their responsibilities towards the socalled social sectors.
In this regard we may also note that in any case, in terms of resource allocations,
almost throughout the post-independence period, the governments at the centre treated
the Social Sectors- like health, education, housing, and water and sanitation as being
inferior to the Economic Sectors as may be seen from Table 2.5. What may have
worsened the scenario since the beginning of 1990s is a fundamental shift in the Central
Government’s. As a result of which the approach towards the social sectors, the crux of
which is that giving a greater role and all kinds of concessions to private players in the
social sectors would lead to an adequate response from them that would go a long way
towards filling up the existing gaps in these sectors. An obvious consequence of such a
shift in approach has been the slow process of privatization and deregulation of the
health sector, that had become evident in the 1980s, got accelerated significantly during
the 1990s.
In the 1990s, a number of corporate hospitals sprung up on land allotted to them
by the Central and State Government in prime urban locations, in exchange for their
promise to provide a reasonable proportion of their services free to the poor (Baru,
19
2000); however, there is increasing evidence of non-fulfillment of such promises by
major private hospitals, and yet such policies have been pursued vigorously. The 1990s
also saw the privatisation of public health institutions and specific involvement of private
providers in the public health system (Sen, Iyer and George, 2002). As as has been
argued by several researchers, such developments have contributed to the increases in
health costs that are clearly evident in the mid-1990s NSS Survey. Ofcourse a major
culprit in pushing up costs has been the systematic deregulation of the pricing of drugs
which gathered momentum in the recent years. At the time of the introduction of Drug
Price Control Order, in 1970, all drugs were kept under price control. In 1979, only 347
of the drugs were kept under price control. This number was almost halved to 163 by
1987, and subsequently it was brought down to 76 in 1995. Now, the Pharmaceutical
Policy of 2002 has reduced this number further to 35 drugs.
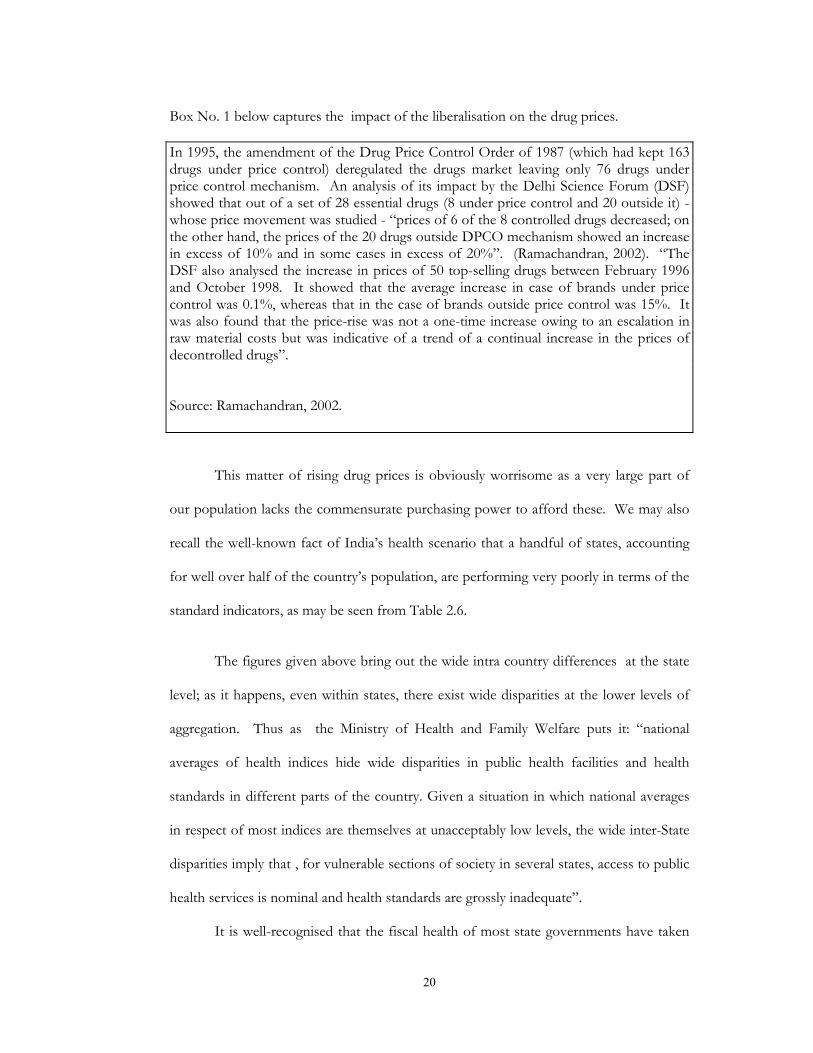
20
Box No. 1 below captures the impact of the liberalisation on the drug prices. In 1995, the amendment of the Drug Price Control Order of 1987 (which had kept 163 drugs under price control) deregulated the drugs market leaving only 76 drugs under price control mechanism. An analysis of its impact by the Delhi Science Forum (DSF) showed that out of a set of 28 essential drugs (8 under price control and 20 outside it) - whose price movement was studied - “prices of 6 of the 8 controlled drugs decreased; on the other hand, the prices of the 20 drugs outside DPCO mechanism showed an increase in excess of 10% and in some cases in excess of 20%”. (Ramachandran, 2002). “The DSF also analysed the increase in prices of 50 top-selling drugs between February 1996 and October 1998. It showed that the average increase in case of brands under price control was 0.1%, whereas that in the case of brands outside price control was 15%. It was also found that the price-rise was not a one-time increase owing to an escalation in raw material costs but was indicative of a trend of a continual increase in the prices of decontrolled drugs”.
Source: Ramachandran, 2002.
This matter of rising drug prices is obviously worrisome as a very large part of
our population lacks the commensurate purchasing power to afford these. We may also
recall the well-known fact of India’s health scenario that a handful of states, accounting
for well over half of the country’s population, are performing very poorly in terms of the
standard indicators, as may be seen from Table 2.6.
The figures given above bring out the wide intra country differences at the state
level; as it happens, even within states, there exist wide disparities at the lower levels of
aggregation. Thus as the Ministry of Health and Family Welfare puts it: “national
averages of health indices hide wide disparities in public health facilities and health
standards in different parts of the country. Given a situation in which national averages
in respect of most indices are themselves at unacceptably low levels, the wide inter-State
disparities imply that , for vulnerable sections of society in several states, access to public
health services is nominal and health standards are grossly inadequate”.
It is well-recognised that the fiscal health of most state governments have taken
21
quite a beating in recent years, the low buoyancy of central transfers and the spillover of
the central pay revisions being important culprits in this regard, and consequently the
spending ability of many of the states has been significantly constrained. Since it is very
difficult for the states to cut-down their fixed expenditures (like interest payment,
payment of salaries etc.), such a situation might have forced the states to cut-down their
variable expenses which include developmental expenditures like that on the health
sector. Under the circumstances, the Central Government ought to have done more,
particularly to help the low-performing states. However, a look at the Central
Government’s budgetary allocations under health sector, during 1992-93 to 1999-2000
shows that it rose during this period for the relatively better performing states such as
Andhra Pradesh, Gujarat, Karnataka, West Bengal and Delhi, whereas already laggards
including Bihar, Madhya Pradesh and Rajasthan were neglected in this respect, (see
Table 2.5 and 2.6) thus accentuating interstate differences.
There is another well-known dimension of inequality that may be recalled here.
Given the narrow reach and poor quality of the public health system in the country, it is
no surprise that the most vulnerable socio-economic groups have benefited the least
from the public health system. The following table gives some indication of such an
inequality as reflected through some of the major indicators of the health status among
different socio-economic groups in the country.
It is common knowledge, and Table 2.10 is illustrative of it, that private health
care system is many times more expensive compared to its public counterpart and hence
a shrinking of the latter not only pushes up the per unit cost but is also socially very
regressive.
The accelerated phase of privatization and deregulation of the health sector in the
22
recent years has resulted in a situation where 83 % of the aggregate expenditure on health
in our country is private spending. It is worth recalling here that the public expenditure
on health, as a percentage of total public expenditure, in India is among the lowest in the
world (see Box 2 below). In such a scenario it is inevitable that the socially and
economically vulnerable sections would have found it increasingly difficult even to meet
the minimal health needs and a reasonable guess would suggest that the sum total of such
sections may come close to half of the country’s population.
In sum, the health care system of India is beset with many serious problems the
solution of which needs nothing less than a major commitment of the Governments at
all levels to this sector.
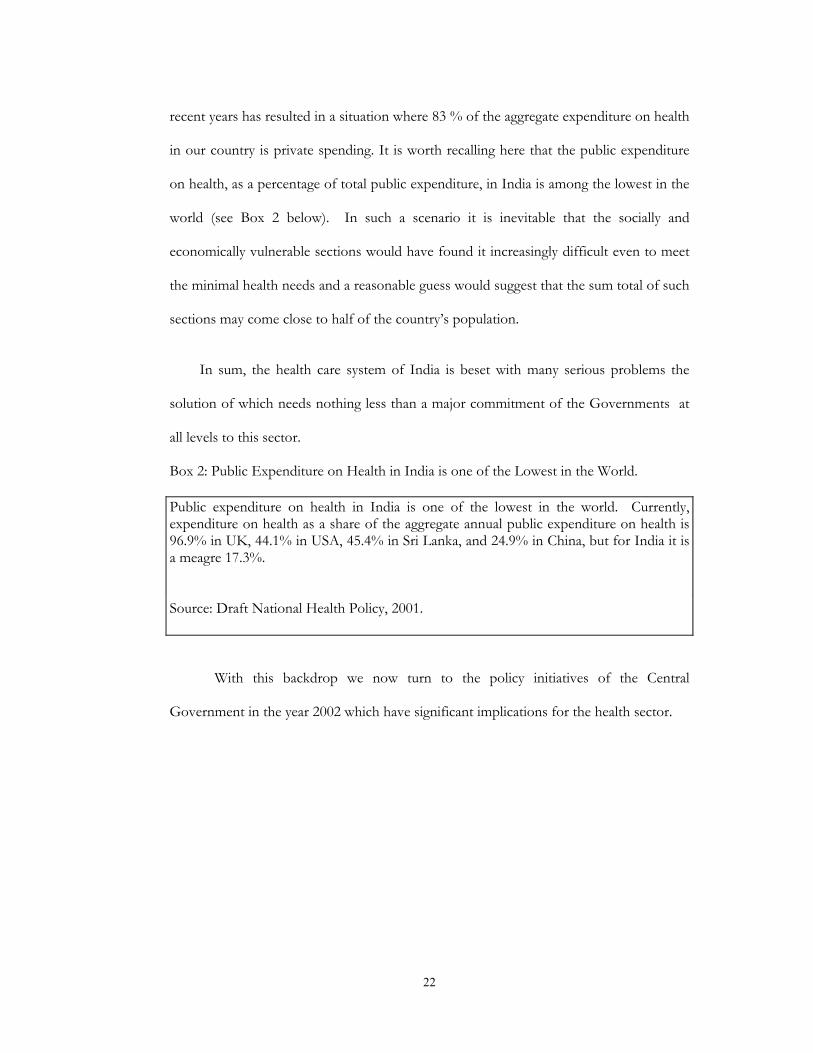
Box 2: Public Expenditure on Health in India is one of the Lowest in the World. Public expenditure on health in India is one of the lowest in the world. Currently, expenditure on health as a share of the aggregate annual public expenditure on health is 96.9% in UK, 44.1% in USA, 45.4% in Sri Lanka, and 24.9% in China, but for India it is a meagre 17.3%.
Source: Draft National Health Policy, 2001.
With this backdrop we now turn to the policy initiatives of the Central
Government in the year 2002 which have significant implications for the health sector.

23
National Health Policy 2002
In 1983, the Government for the first time adopted a National Health Policy,
(prior to that the actions of the Government in the health sector were guided by the Five
Year Plans and recommendations of various committees), and its major
recommendations was: “universal, comprehensive primary health care services which are
relevant to the actual needs and priorities of the community at a cost which people can
afford”. Then after a period of eighteen years, the Draft National Health Policy 2001 was
announced towards the end of 2001 and was adopted by the Central Government in the
year 2002. This new National Health Policy (henceforth NHP) candidly acknowledges
that India’s public health care system is grossly short of defined requirements,
functioning is far from satisfactory, that morbidity and mortality due to diseases that are
curable continues to be unacceptably high, and resource allocations are generally
insufficient. However, the 1983 NHP’s goal “of providing universal, comprehensive
primary health care services” does not even find a mention in this new policy document.
It has been strongly argued by many that this new NHP is riddled with confusions and
contradictions as it only proposes numerous impressive principles and goals but does
nothing to ensure that these are realized on the ground. On the other hand it can also be
argued that this new NHP is an attempt towards legitimizing the ongoing privatization of
the health care system of the country.
The avowedly stated objective of the new NHP is to achieve an acceptable
standard of good health amongst the general population of the country. As mentioned
earlier, NHP 2002 is quite explicit in its acknowledgement of the poor state of affairs in
the health sector; it also recognises globalisation as a concern with a critical view of
TRIPS and its impacts, envisages regulation of the private health care sector, and
24
proposed to increase the expenditure on primary health care. Also, the new policy
recommends an increase in public health expenditure from the present below 1% of
GDP to 2 % of GDP by 2010. Moreover, the policy projects that public expenditure on
health by 2010 will be 33 % of total health expenditure – up from the present 17%.
However, the mechanisms of how these eminently desirable objectives are to be achieved
are not spelt out. Further, there is no analysis of why the goals of NHP-1983 remain
unfulfilled, and there is no attempt to explore the linkages between what is happening to
some of the major determinants of health-like food, water, and sanitation etc. and the
important indicators (of health status) in the emerging scenario. Above all, the NHP
2002 remains blissfully innocent as to what can be done to ensure that the commercial
vested interest in the private health care sector do not succeed in overshadowing peoples’
needs and patients’ rights.
Although a new Drug Policy (Pharmaceutical Policy, 2002) was adopted by the
same Government in the same year as this NHP-2002, it is more or less silent about the
impact of this Policy on the health sector and does not discuss the consequences of
further deregulation of the pharmaceutical sector which it advocates. The new policy has
ignored the pressing needs of primary health care, and shows a strong bias towards
urban specialist-based health care. It is true that this policy recommends an increase in
public expenditure on health from the present level of less than 1% of GDP to 2 % of
GDP by 2010. But the quantum of increase suggested is grossly inadequate even today,
keeping in mind the huge gaps in this sector, and it well below 5% of GDP
recommended by the World Health Organization long back. Although the policy is
critical of the states for not increasing their investment on health, it does not address the
causes behind their inability to do so. We may also note the valid concern expressed by
NHP-2002 regarding resource use inefficiencies of various kinds in the running of the
25
programmes sponsored by Central Government, e.g. the wastage on account of vertical
disease control programmes, (as the ‘vertical’ implementation structure for the major
disease control programmes requires independent manpower for each disease
programme which makes these programmes extremely expensive and difficult to sustain),
but the document does not have concrete and worthwhile policy suggestions to improve
the situation.
As one may expect, the new NHP proposes to strenthened the provision of user
fees in public hospitals, with the qualification that it will target those who can pay. In the
1980s, a few states like Rajasthan and West Bengal had introduced charges for diagnostic
facilities and other services. In the 1990s, several other states followed suit. However, a
recent study of user fees in Gujarat, Madhya Pradesh, Orissa, Rajasthan and West Bengal
show that they do not contribute more than 2 % to the hospital budgets (Sen, Iyer and
George, 2002). On the other hand there is a mounting body of evidence which shows
that user fees can be highly regressive. Identification of those ‘who can pay’ is an
exceedingly difficult task and often large sections of the vulnerable sections may get left
out of the count of those who cannot pay. Andhra Pradesh’s experiment with white
cards is an example of this failure (Qadeer,2002), and there is genuine fear that the
further strengthening of user fees will inevitably result in driving out substantial sections
of the poor from the public health care system in India.
Another notable feature of the new NHP is that it plans to encourage the use of
India’s health facilities, particularly in the private sector, to attract patients from other
countries. It also suggests that such incomes can be termed “deemed exports” and
should be exempt from taxes. The concern has been raised by several observers that
such a policy would strengthen a climate subservient to the interests of the rich and
26
powerful in the global health market and create islands of brain and resource drain within
the country. Finally, the NHP-2002 proposal regarding privatization of secondary and
tertiary level care, ignores the simple fact that 45 % of the poorest of the country
continue to depend on the public sector hospitals for critical indoor care (Qadeer, 2002),
and such a proposal is bound to push the unit cost of such health care by many times.
Union Budget 2002-03
One of the very few positive prescriptions of the NHP-2002 was its
recommendation of a significant increase in the public investment on health. But this too
was ignored by the Union Budget for 2002-03.The NHP 2002 had stated that there has
to be “injection of substantial resources into the health sector from the Central
Government Budget” due to the growing constraints on states’ resources and the
consequent shrinkage of their allocations to the health sector. The contribution of the
Central Government to the total public health expenditure is just 15 % at the present.
The NHP-2002 proposes that this should be increased at least to the level of 25 % of
total public health spending by 2010.However, in the budget proposals for 2002-2003,
the total allocation for health (both plan and non-plan) was only marginally higher at Rs.
2427.14 crores compared to the allocation in the 2001-2002 budget, which was
Rs.2354.25 Crores.
In terms of specific initiatives the NHP-2002 identified availability of medicines
at the primary care level as being crucial in the relatively better utilization of public health
centres in the southern states. The policy infact envisaged the “kick starting of the revival
of the primary health care system by providing some essential drugs under Central
Government funding through the decentralized system”. But there was no budgetary
allocation for this purpose for the year 2002-03. As far as disease control programmes
are concerned, many of the budget proposals seemed arbitrary and on the whole there

27
was lack of a coherent perspective. For instance, proposed budgetary allocations in
2002-03 are higher than those of the previous year for National Anti-Malaria
Programme, Kalazar Control Programme and Leprosy Control Programme whereas they
are lower than those of the previous year for T.B. Control Programme, National Filaria
Control Programme, and Trachoma and Blindness Control Programme; the rationale for
reduced allocations for these programmes is not quite clear.
Similarly, a welcome feature of the budget proposals 2002-03 is the higher
allocation on the National Mental Health Programme (at Rs. 27.00 Crores) compared to
that of the previous budget (Rs. 4.48 Crores). However, it is difficult to comprehend why
the allocation on ‘assistance towards expenditure on hospitalisation of the poor’ (at Rs.
2.80 Crores) is lower than that of the previous budget (Rs. 4.2 Crores).
The Finance Minister, during his presentation of the budget for 2002-03 rightly
acknowledged that “access to good and responsive health care is still a distant dream for
the majority of the rural population”. But strengthening the public health care system and
expanding curative health services in the rural areas, which is undoubtedly the best
solution of this problem, did not find any firm footing in the budget. The proposed
insurance scheme by him, called ‘Janraksha’, for providing health insurance in the rural
areas through the public sector insurance companies is also questionable. Under this
scheme, with a payment of Re. 1 per day as insurance premium, a person will be entitled
to indoor treatment up to Rs. 30,000 per year, and out patient treatment up to Rs. 2,000
per year, at designated hospitals and clinics which, apart from civil hospitals and medical
colleges, include private trust hospitals and other NGO run institutions. Given the
resource-starved scenario at the public hospitals, it may well mean that the Government
will be subsidizing health services provided by some private health institutions. It is

28
obvious that this subsidy would have been better spent if directed towards the
strengthening of the public health care system, especially in the rural areas.
Pharmaceutical Policy, 2002
The Pharmaceutical Policy, 2002 is the new drug policy adopted by the Central
Government, which has been criticized strongly for being a one-sided policy echoing
mostly the interests of the business class at the cost of neglecting the health needs of the
poor masses of the country. As has already been mentioned, the Drug Price Control
Order (DPCO) mechanism was put in place in 1970 with all drugs being kept under price
control. Subsequently, with the successive Drug Policies, the number of drugs under
price control has been progressively reduced from 347 to 35 in the present; these 35
drugs and their formulations constitute only about 22 % of the total market
(Ramachandran, 2002). It must be mentioned here that there are as many as 279 drugs
listed in the National Essential Drug List (1996) of the Ministry of Health and Family
Welfare. Thus, it seems obvious that the commercial interests of the pharmaceutical
companies have been given overriding importance in the Pharmaceutical Policy, 2002 in
complete disregard to its consequences for the poor people of the country.
The standard argument advanced for deregulating drug prices is that market
mechanism and competition will help check and stabilize drug prices. Such a dubious
argument seems to be originating from the failure of the Government to evolve an
effective mechanism to monitor the pharmaceutical industry’s adherence to the DPCO,
and, more importantly, the process of liberalization being pursued by the Government.
As has often been argued, the pharmaceutical sector is peculiar in the sense that it is a
seller’s market; the consumer, the public, has no choice in the matter because the
interface between the product and the patient is through the doctor for whom the issues

29
of price and affordability are secondary or the chemist who has no interest in selling
cheaper drugs (Ramachandran, 2002). As mentioned earlier, the deregulation of the drugs
market in 1995 was soon followed by prices of drugs going up (See Box No.1), and similar
consequences may be expected as a result of the Pharmaceutical Policy 2002. Indian
Government seems to forget that even in the developed countries like the United States
and the U.K. there are effective price control mechanisms and bodies to monitor drug
prices. In a developing country like India, what is most disturbing about this policy is
that it does away with the control over the prices of a large proportion of the drugs just
when the country is moving towards a stricter or patent regime which, it is feared, will
further promote monopolistic practices in the pharmaceutical sector.
The Patents (Amendment) Bill, 2002
India’s Patents Act of 1970 had exempted food, medicines and drugs(chemicals)
from product patenting and had provided for a protection period of only 7 years for the
process patents. However, in 1994, India signed the WTO-TRIPS Agreement and was
given 10 years to bring its patent laws into compliance with the provisions mandated in
the TRIPS Agreement. Subsequently the Central Government introduced the Patents
(Amendment) Bill,2002 which became an Act in June, 2002. Thus India has fallen in line
with what many have considered socially regressive TRIPS Agreement; moreover, it has
been argued that the Amended Patents Act has not even exploited the scope that is
provided to the developing countries (in the TRIPS Agreement) to ensure that these
countries can give preference to the concerns of public health over the interests of the
patent holder. As Chaudhuri puts it: “While deciding on the inventions eligible for
patents, the terms ‘new’ and ‘inventive’ could have been defined in such a way as to
exclude lower level innovations such as new dosage forms or new formulations from the

30
grant of patents. This would have restricted the number of patents. Also, Article 30 of
the TRIPS Agreement could have been used to permit non-patentees in India to produce
and export patented medicines to the least developed countries, which cannot produce
these themselves. But the most glaring failure relates to compulsory licensing . In a
product patent regime, a proper compulsory licensing system is of fundamental
importance to ensure competition and competitive prices. But the process in the Indian
case has been made much more legalistic than what is required by the TRIPS Agreement.
As a result it provides enough opportunities to the powerful patent holders to manipulate
the process by litigation to prevent others from producing their patented products. Thus,
if the bias in the Patents Act of 1970 was in favour of the non-patentees, the bias in this
Amended Act is clearly in favour of the patent holders” (Chaudhuri, 2002). In short, the
new patent regime is likely to have made it quite difficult for the Indian Government to
control monopolistic practices of the big pharmaceutical companies which is likely to
worsen the already very poor access of the essential drugs (see Boxes 3 and 4 below), for
the vulnerable groups.
Box 3: Access to Essential Drugs in India (2000). Based on the statistical estimates received from WHO’s country and regional offices and through the World Drug Situation Survey carried out in 1998-1999, the Department of Essential Drugs and Medicines Policy of the WHO divided countries into four categories. 1. Good Access to Essential Drugs - Countries in which 95-100% of the Population had access to essential drugs. 2. Medium Access to Essential Drugs - Countries in which 80-94% of the Population had access to essential drugs. 3. Low Access to Essential Drugs - Countries in which 50-79% of the Population had access to essential drugs. 4. Very Low Access to Essential Drugs - Countries in which 0-49% of the Population had access to essential drugs.
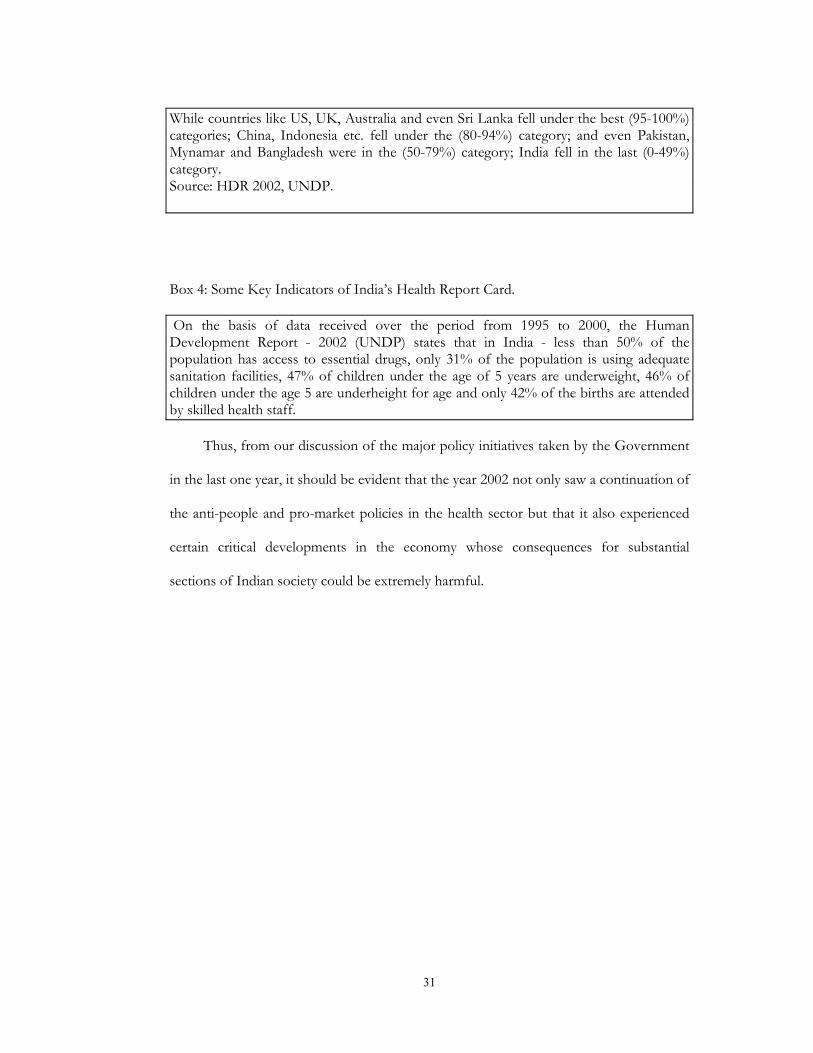
31
While countries like US, UK, Australia and even Sri Lanka fell under the best (95-100%) categories; China, Indonesia etc. fell under the (80-94%) category; and even Pakistan, Mynamar and Bangladesh were in the (50-79%) category; India fell in the last (0-49%) category. Source: HDR 2002, UNDP.
Box 4: Some Key Indicators of India’s Health Report Card. On the basis of data received over the period from 1995 to 2000, the Human Development Report - 2002 (UNDP) states that in India - less than 50% of the population has access to essential drugs, only 31% of the population is using adequate sanitation facilities, 47% of children under the age of 5 years are underweight, 46% of children under the age 5 are underheight for age and only 42% of the births are attended by skilled health staff. Thus, from our discussion of the major policy initiatives taken by the Government
in the last one year, it should be evident that the year 2002 not only saw a continuation of
the anti-people and pro-market policies in the health sector but that it also experienced
certain critical developments in the economy whose consequences for substantial
sections of Indian society could be extremely harmful.

32
III
State of Education in India: Some Major Indicators India’s performance in the field of education, as in the case of health, has been
among the most disappointing aspects of its post-independence scenario as the country
currently houses the largest number of illiterates and has the dubious distinction that
every third illiterate in the world is an Indian. Out of approximately 200 million children
in the age group 6-14 years, only 120 million are enrolled and the net attendance figure is
just over 60 percent (which may be an overestimate) of enrollment. In short, the
prospects of even minimal literacy appear to be bleak. Ofcourse, it is not the case that
there has been no progress at all; during the last half-a-century, educational facilities have
expanded substantially and the percentage of literate population has risen from 18 in
1951 to 65 in 2001 (see Table 3.1). However, the simple point is that the deficit is still a
huge one even in terms of crude quantitative indicators and quite a few countries in Asia
such as Srilanka, Indonesia or China, among others, have done much better than India
during roughly the same period.
Not surprisingly, the school dropout rates are also very high in India (see Table -
3.2), mainly because the conditions of schools in our country are dismal, especially in the
rural areas. It is not the case that the high dropout rates are largely due to lack of demand
for schooling from the relatively poorer households, as is sometimes fallaciously
assumed, but the problems are mainly on the supply side. Even the minimal
infrastructure, such as proper rooms, desks, drinking water facility, toilets etc. are distant
dream in a large number of schools. It is well-acknowledged by now that even with small
incentives - such as a meal - attendence at school tends to improve substantially. Clearly,
basic infrastructure and decent physical environment can go a long way in retaining
33
children at school. Also, the overall social climate plays a critical role in this respect; for
instance, it is well-documented that the attitude towards the students from low caste
families by their teachers and fellow students sometimes forces them to drop out.
Similarly, entrenched gender biases result in girl children either not being sent to school
or for their dropping out earlier.
Thus, due to a range of reasons, a large number of children of school going age
have remained out of school, their proportion being highest in states like Bihar and Uttar
Pradesh (see Table -3.3).
To tackle the problems of children not entering the school or dropping out early,
almost all the major states in India have tried to make primary education mandatory, and
a number of legislations have been passed to this effect. Table 3.4 lists such Acts which
are in force in States and Union Territories of India till November 1996 since
independence.
Mandating an act is obviously no guarantee that it would be translated on the
ground in the absence of appropriate infrastructure, requisite investments etc. Moreover,
many of these Acts were ambiguous along with having a very elastic time frame, and by
all accounts the respective governments did not show any serious commitment to them.
According to one recent study, over 90 percent of the officials dealing with the
administration of education were unaware that their state had any law for compulsory
education (Juneja’s study reported in Srivastava, 2002); it might be difficult to get a better
indicator of the ‘commitment’ of the government apparatus!
We may also recall here that to push up the literacy rate, a number of specialised
literacy and adult education programmes have also been experimented with. National
34
Adult Education Programme, Social Education Programme, Farmer’s Education and
Functional Literacy Programme, Shramik Vidyapiths, Total Literacy Campaigns and
many other such programmes have been a regular feature for over three decades now,
but serious and valid reservations about their efficacies have often been expressed by
researchers, (for details on these, see Reddy 2002), and we need not pursue these here.
However, it may not be unreasonable to hold the view, on the basis of available evidence,
that in terms of quantity as well as quality, these programmes have not achieved much.
It has already been emphasized earlier that public investment in post-
independence India on social sectors, including education, has fallen much short of what
may be considered a level to be commensurate with the basic requirements. Moreover, it
is well documented that in the recent years, all the rhetoric not withstanding, such
investments have come under further pressure. With respect to education, another
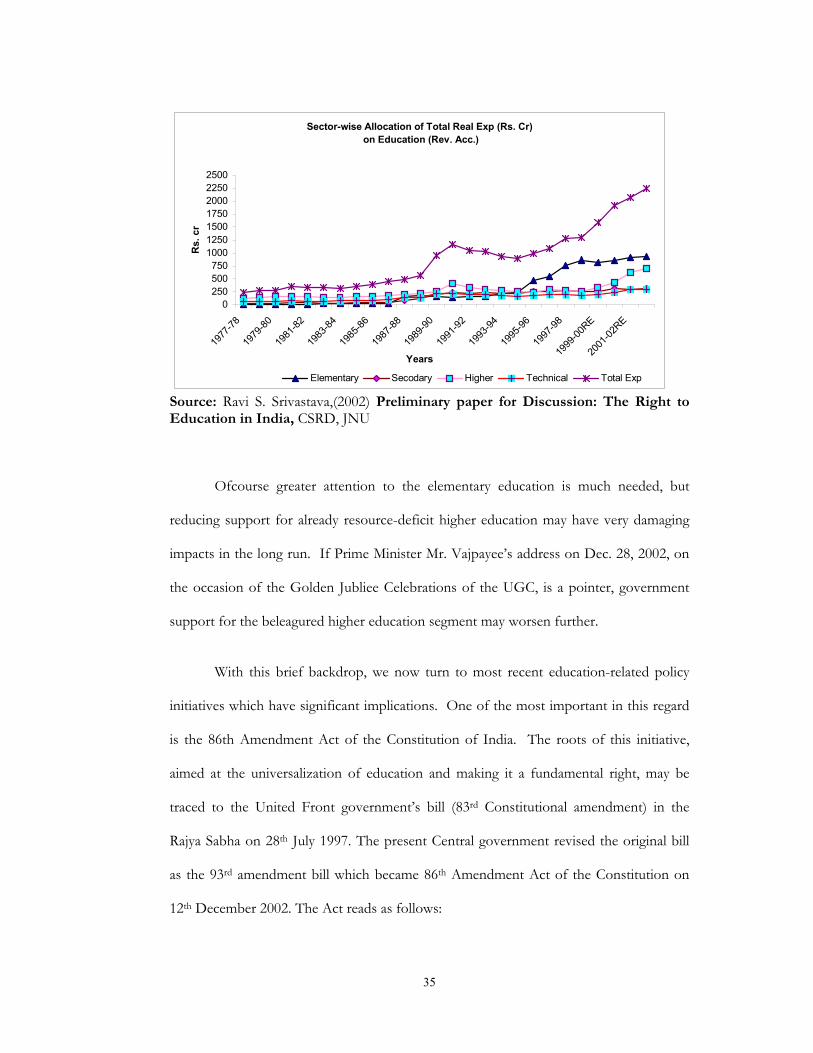
notable development during the last couple of decades has to do with the changing
resources allocation trends within it; essentially, share of spending on elementary has
been going up while the proportion on higher and technical education has been going
down, as may be seen from the graphs below.
35
Sector-wise Allocation of Total Real Exp (Rs. Cr) on Education (Rev. Acc.)
0250500750
1000125015001750200022502500
1977
-78
1979
-80
1981
-82
1983
-84
1985
-86
1987
-88
1989
-90
1991
-92
1993
-94
1995
-96
1997
-98
1999
-00RE
2001
-02RE
Years
Rs.
cr
Elementary Secodary Higher Technical Total Exp
Source: Ravi S. Srivastava,(2002) Preliminary paper for Discussion: The Right to Education in India, CSRD, JNU
Ofcourse greater attention to the elementary education is much needed, but
reducing support for already resource-deficit higher education may have very damaging
impacts in the long run. If Prime Minister Mr. Vajpayee’s address on Dec. 28, 2002, on
the occasion of the Golden Jubliee Celebrations of the UGC, is a pointer, government
support for the beleagured higher education segment may worsen further.
With this brief backdrop, we now turn to most recent education-related policy
initiatives which have significant implications. One of the most important in this regard
is the 86th Amendment Act of the Constitution of India. The roots of this initiative,
aimed at the universalization of education and making it a fundamental right, may be
traced to the United Front government’s bill (83rd Constitutional amendment) in the
Rajya Sabha on 28th July 1997. The present Central government revised the original bill
as the 93rd amendment bill which became 86th Amendment Act of the Constitution on
12th December 2002. The Act reads as follows:

36
“ Be it enacted by Parliament in the fifty third year of the Republic of India as follows
1. (1) This Act may be called the Constitution (Eighty Sixth Amendment) Act 2002. (2) It shall come into force on such date as the Central Government may, by notification in the Official Gazette, appoint.
2. After article 21 of the Constitution, the following article shall be inserted namely:- ‘21A The State shall provide free and compulsory education to all children of the age of six to fourteen years in such a manner as the State may by law, determine.’ 3. For article 45 of the Constitution, the following article shall be substituted, namely:- ‘45 The State shall endeavour to provide early childhood care and education for all until they complete the age of six years.’ 4. In article 51A of the Constitution, after clause (j) the following clause shall be added, namely:- ‘(k) Who is a parent or guardian to provide for education to his child or as the case may be, ward between the age of six and fourteen years’ ”(emphasis ours) (The Gazettee of India, Dec. 2002).
There are problems with this Act to which we shall come to in a moment, but
before that a few words on a major scheme, launched prior to this Act, which is
supposed to facilitate the realisation of the objective of universalization of literacy. The
scheme of Sarva Shiksha Abhiyan (SSA), or also known as the National Programme for
Universalisation of Elementary Education (NPUEE), was launched in November 2000.
This is a centrally sponsored scheme for universalisation of elementary education in the
‘Mission Mode’ and its ostensible effort is to incorporate all existing programmes of
elementary education in the central/centrally sponsored category under this new
framework in consultation and partnership with states.
Under this scheme a total of Rs. 500 crores had been allocated in the Central
Government’s Budget 2001-2002. Subsequently, in anticipation of the 86th Amendment
Act, allocation for this scheme was increased to Rs. 1512 crores in the budget of 2002-
2003. (Budget 2002-2003).

37
As mentioned earlier Sarva Siksha Abhiyan (SSA), envisions a partnership
between the Central and State Governments. The enunciated specific goals under the
Programme are:
(a) All children in school, Education Guarantee Centre/ Alternate Schools by 2003.
(b) All Children complete five years of primary schooling by 2007. (c) All children complete eight years of elementary schooling by 2010. (d) Focus on elementary education of satisfactory quality with emphasis on
education for life. (e) Bridging all gender and social category gaps at primary level by 2007 and at
elementary level by 2010. (f) Universal retention by 2010. Obviously all the above goals are most laudable; the question is; are there enough
indications that the same will be realized. India is a vast country and to provide
compulsory education to more than 19 crore children across 11 lakh habitations and
numerous social groups/ subgroups, requires not simply launching a modestly-funded
scheme and the enactment of a long pending bill with some revisions but a much more
serious and comprehensive programme of action. Given the huge shortfalls with respect
to the above objectives, current policies and programmes do not quite generate much
optimism. For instance, we are already in 2003 and it is not clear at all how the objective
of bringing all the children to the school by the end of the current year can be achieved.
As mentioned earlier, the 86th Amendment Act has certain ambiguities and
problems, and we now turn to the most obvious of these.
First, as per Para 1 Section 2 of the Act, it shall come in force on such date as the
Central Government may notify; the question is: why the delay in notification if the goal
of SSA is to have all children in school by 31st December 2003? Is such a notification
likely in the near future when the Central Government keeps telling the nation that there
is a serious paucity of funds for education, when attempts are on to privatize the

38
educational institutions run by government and reliance on market forces to fill up the
educational-deficit are on the rise, and when child labour is rampant with no credible
attempts to rehabilitate them in sight?
Second, Para 2 of the Act says that the State shall provide free and compulsory
education to all children of the age of six to fourteen years, in such a manner as the State
may determine. What does it mean to say: ‘such a manner as the State may determine’?
Which schools will the children go to? How does the government plan to strengthen the
school system when there is no money to augment the infrastructure or to recruit new
teachers? How helpful can the increased reliance on an army of para-teachers be who
do not have any incentive to go to schools for teaching due to non-payment of salaries
for months and due to the obvious insecurity of their jobs? Under the circumstances
how can one hope to get a credible response from the State that the promised
fundamental right to education for those who continue to remain illiterate has been
violated?
Third, Para 3 of the Act states that the State shall endeavour to provide early
childhood care and education for all children until they complete the age of six years. It is
difficult to imagine how the government can achieve this in an environment of resource
crunch for health, education etc. As it happens, this clause has been kept as a Directive
to State under article 45 (by substituting the old article 45). Therefore, the conventional
position would be that the State is not bound to act on this clause.
Fourth, the Act makes the parents or guardian responsible to provide
opportunities for education, as per Para 4. However, the division of the domain of
responsibility in this regard between the State and the parent/guardian is not quite clear.
In any case, in a country like ours, where a large section of population remains either

39
close to or below a narrowly defined poverty level, how meaningful is it to render the
responsibility of providing educational opportunities on the parents or guardians? Infact,
a couple of Bills introduced in 2002 were addressing some of these issues with a greater
degree of seriousness - such as the ‘Free Education (for children of parents living below
poverty line) Bill - 2002’, tabled by Sushil Kumar Shinde on May 3 - but they were cold-
shouldered.
In sum, there is a real danger that the 86th Amendment Act may not translate
into anything significant at the groundlevel. Nonetheless, it may have the potential to
take a few steps in the right direction, as an enabling legislation. In any case, in terms of
policy initiatives, there was possibly nothing else about which one can be even mildly
positive. On the contrary, as we have already noted, the broad policy direction is a
matter that has more to worry about than to be jubliant. In this respect, a few brief
remarks on one of the presumably important aspects of this broad direction, namely the
National Curriculum Framework for School Education (henceforth NCF), may be in
order here. The NCF was introduced by NCERT in 2002, and has generated lot of
concern within the academic community. The importance attached to the NCF by the
government may be gauged from the fact that many accord it the status of a National
Education Policy, and may be justifiably so. Critics have lashed out at the NCF on
serveral grounds. It is not possible here to recount all the criticisms, but we must
mention what may perhaps be the most negative thrust of the NCF. It is very hard to
miss that the BJP-led government at the Centre has not been shy of imposing its
fundamentalist version of Hinduism on the country’s educational system in a variety of
ways, and the NCF is a tool to further this objective. In the name of providing value-
based education NCF pushes the idea that a certain version of Hinduism is the be-all and
end-all as regards the ‘values’ that need to be inclucated. Further, through NCF and
40
other occasional pronouncements, the government’s spokespersons keep trying to prove
that ‘Hindu India’ was the greatest civilisation and culture in world history. Sure enough,
like other old civilizations, ancient India had its share of creditable achievements, but the
self-deluding and viciously jingoistic Hindutva version of these distorts the past and
attempt to push the country’s educational system on a retrogressive course. NCERT’s
recent well-known attempts to rewrite history books bear ample testimony to such
tendencies.
To get a flavour of what such attempts mean concretely, it may be in order to
recall a couple of findings from a booklet of SAHMAT, called “The Saffron Agenda in
Education”, on the new syllabi and textbooks in Gujarat (as quoted in Bidwai, 2001). The
said study reports that the class VI syllabous’s stated objectives include the following
expectations for the pupils:
• Is introduced to Vedic literature which is an expression of Indian culture; • Knows about the respectable status of women in Indian culture; • Gets acquainted with the basic truths of life against a backdrop of Indian
culture; • Learns for himself the truth; that in the context of Indian culture a person
acquires a high status not by right of birth but by merit; • Knows about how in the Indian cultural context the rules were oriented
towards the subjects; • Imbibes the basic values of Indian culture expressed by the narratives of the
epics, Ramayana, Mahabharata, and by the main characters in, for instance, the importance of 1) the purity of domestic life 2) steadfastness in adhering to truth even at the cost of suffering;
• Moulds the character which makes one abide by one’s duty when there is a conflict between personal relationship and a sense of duty.
One hardly needs to elaborate what, in the aggregate, is the implication of these
desirable objectives. Those who may still like to give the benefit of doubt to the agenda
of ‘value-based education’, should look at the textbook in the same state which celebrate
the varna system as “a precious gift of the Aryans to the mankind” and label all

41
minorities as “foreigners”. Further, a Class IX textbook analyses the “problems” of the
Scheduled Castes and Scheduled Tribes as follows: “Ofcourse, their ignorance, illeteracy
and blind faith are to be blamed for lack of progress because they still fail to realise
importance of education in life. Therefore, there is large-scale illeteracy among them and
female illeteracy is a most striking fact” (Bidwai, 2001). How much more can one
trivialize some of the most daunting challenges confronting the Indian society?
There are other questionable thrusts associated with the NCF, which we need not
take up here. The important point is: it is difficult to find much that can be considered
positive with this framework, which many infact interpret as India’s education policy.
Thus, to conclude this section, recent policy initiatives of the government
including those taken in 2002 do not generate much optimism with respect to taking up
the huge deficits in the education sector, and even appear to be retrogressive in
important ways.
In the next section, we move on to those policy areas which have significant
causal impacts on material poverty.

42
IV
Poverty and its Correlates
As is well-known, conceptualising poverty is a difficult and controversial subject.
At one level, it would appear reasonable to hold that poverty is essentially the non-
fulfilment of certain basic needs and the threshold of such needs consists of being able to
meet minimum nutritional, clothing and shelter requirements, escape avoidable
morbidity, and be literate. However, what constitutes a basic needs package is itself a
controversial subject. Should one focus only on a narrow set of economic and social
criteria? What about political and cultural deprivations? There are no easy answers, and
we have a whole range of conceptual constructions associated with the notion of poverty,
some of which do have operational counterparts.
In the narrowest sense, poverty is pegged to a nutritional norm, and most of the
poverty discussions in India are based on such a norm. It is based on the view that it is
possible to have a nutritional norm such that the probability of a person being
undernourished at that norm is minimum. Taking this norm as an anchor, it is then
possible to apply the known nutritional contents of different foods and work out the
expenditure required for the cheapest food basket. This is what economists call a
poverty line.
Using such a poverty line, economists generally agree that from the 1950s to the
mid-1970s, there was no trend change in the percentage of people below the poverty line
in India, but during the next decade and a half there was a clear trend decline. As regards
the period of economic reforms, there are conflicting assessments. As is well-known,
poverty estimates in India are based on surveys on consumer expenditure conducted by
43
the National Sample Survey Organisation (NSSO). Based on these surveys, the official
position of the Government of India is that the incidence of poverty in the country
declined by nearly 10 percentage points in the 5 year period between 1993-94 to reach
26.1 percent in 1999-2000 (See Table 4.1), even though there were wide inter-state
disparities both in terms of the poverty ratios at the latter date as well as in their rates of
decline during the decade of the 1990s. However, many experts have questioned the
government’s claim, mainly on the ground that the methodology of the NSSO survey on
consumer expenditure in 1999-2000 was different from the earlier surveys, and have
argued that the incidence of poverty could be substantially higher than the official
estimates. The claims and counter-claims have been widely discussed in the recent
months by the experts and here we shall stay away from the contentious number -
crunching issues. However, it may be noted here that the critics of the official estimates
appear to be on a firmer ground.
Even the calorie-based narrow notion of poverty has complex causal
connections, but its obvious major structural correlates are as follows: (a) assets, both
tangible (e.g. land) and intangible or embodied (e.g. skill); (b) employment availability;
and (c) rate of return to labour power. Efficacy of economic processes and policies
towards poverty reduction depends on their impacts on these correlates, a lesson from
economic history that one can hardly afford to ignore. During the first four decades
after independence, particularly during 1970s & ′80s, Indian economic policymakers
appeared to show relatively more respect to this lesson compared to what seems to be
the case in the reform period.
44
In the following, we try to assess the ascendant and emerging policy initiatives
relevant to poverty, in particular by tracking down the implications through the above
mentioned correlates.
Implications of Current Policies for Poverty Correlates As regards the access of assets to approximately the bottom half of the Indian
society, it can be said that herein lies one of the most pervasive failures of the Indian
development strategy of the past half-century. Land reforms in terms of more equitable
distribution of land was never taken up with any seriousness, except in some parts of the
country, For instance, compared to several countries in East Asia, such as South Korea,
Taiwan and Japan, where close to 35 percent or more of cultivable area was redistributed
within a short period of 3 to 5 years immediately after the World War II; in India the
comparable magnitude during the last fifty years has been below 1.5 percent. One may
also note here that among the most impresive performances in poverty-reduction during
the post World War-II era, the same East Asian ‘miracle’ cases are at the forefront, and
surely the redistributive land reforms were more than a mere coincidence in this respect.
Economically and socially vulnerable groups, apart from not benefitting from
redistributive land reforms, have infact been victims in terms of access to assets through
displacements (on account of a variety of development projects), erosion of their rights
vis-a-vis a whole range of common property resources etc. The sum total of these
processes was that substantial number of landholders ended up being landless. For
instance in Madhya Pradesh alone, during the last 50 years, close to 4.5 lakh acres of land
belonging to the Revenue Department has wrongly been classified as the property of
Forest Development, thus denying the ownership rights to legitimate landowners. All
these are very well-documented and we need not labour the point any further here.

45
However, it needs to be emphasized that during the reform period many of these
negative tendencies may have got accelerated sharply.
Land reform in terms of more equitable distribution is not even a rhetoric any
more, although every once a while the government at the centre as well as several state
governments do announce programmes about giving small plots of land to select socio-
economic groups. For instance, Madhya Pradesh government’s initiative in 2002 to give
small plots of land to Dalits was one of the very few positive steps in this regards
although the same state government has launched questionable programmes which
threaten the access to land and other assets of vulnerable groups, in particular the tribal
communities. Occasional reports from other states also do not seem encouraging in this
regard. For instance, in some district of Maharashtra, instances of land earlier distributed
to tribal landless and marginal farmers being taken away from them under the Private
Forests Act were brought to notice in 2002. In Tamil Nadu, Comprehensive Wasteland
Programme launched as per the state government’s budget 2001-2002 aims at
encouraging leasing out land to corporate houses. Its ostensible objective is to develop,
over a period of five years, approximately 25 lakh hactares with large agro-based
industries, and at least one such lease was given to Mahindra - Mahindra in 2002. The
issue is: why shouldn’t such land, which is in the public domain, be given to the landless
and marginal farmers, with necessary support package, to develop for their livelihoods?
Incidentally, under the said programme, even tracts of common grazing land have been
identified to be taken over and leased out to the corporate houses. Moreover, substantial
tracts of land categorized as wasteland in government records are said to have already
been developed and brought under the plough by thousands of marginal cultivators on
the basis of assurances given to them that at some point ownership rights would get
conferred, and there is real threat of displacement for such landholders.

46
Essentially, what we are witnessing is a resurgence of Social Darwinism. While
paying occasional lip-service to the cause of the vulnerable sections of the population, a
variety of processes have been unleashed facilitating transfer of land and other common
property resources to the wealthy and powerful and thus depleting the access to such
resources for the vulnerable sections of the population. Consistent with this strategy of
betting on the strong, the 10th Five Year Plan document, released in 2002, has gone on
to suggest that leasing should be legalised and contract farming should be promoted,
ostensibly to give a boost to the ongoing corporatization of agriculture. There is a real
danger that the mandarins of India’s economic policy are out to delegitimise whatever
legitimate space has been created, through long and arduous struggles since pre-
independence period, in the public policy discussions on the desirability of reforms in
land ownership, tenancy rights etc. To put it simply: we are witnessing the officially-
sanctioned reversal of the land reforms agenda that was promised soon after
independence. Baseless claims, such as the entry of the corporate sector in agriculture
will enhance employment opportunities substantially, are being bandied to legitimise and
push the case for corporate takeovers. Given the overall thrust of the Tenth Plan with
reference to land, forests, water and other common property resources, it is indeed
hypocritical when it occasionally envisages economic empowerment of Dalits through
‘endowing a piece of land’, or other supportive measures. Even if some of these
‘supportive measures’ materialize, although the mechanisms are far from clear, they
would be like small crumbs in an otherwise demanding scenario where the structural and
material conditions of their livelihoods are being threatened.
Among the policy pronouncements of 2002, one of the more disturbing policies
is about access to water. In terms of provision of water services for irrigation or even for
47
household use, the trend towards privatisation and higher user charges has got
accelerated - support for which also comes from the Tenth Plan - thus threatening
whatever limited access the economically and socially disadvantaged have. National
Water Policy 2002 calls for ‘private sector participation in the planning, development and
management of water resources’ on the grounds that this may introduce innovative ideas,
generate financial resources, ‘introduce corporate management and improve service
efficiency’. Simple truth is: consistent with the development in many parts of the world
during the last couple of decades, governments in India are simply abdicating their
responsibilities towards its people to suit the interests of the ‘water industry’. Growth of
this industry has been strongly facilitated by the World Bank and the International
Monetary Fund, which advocate commercialisation and privatisation of water and often
insist on these while giving loans to developing countries. There is mounting evidence
from every part of the globe that public providers have lower costs per unit compared to
private water utilities, and the transition from the former to the latter tends to cause
much hardship, particularly in developing countries, to substantial sections of the
population.
But inspite of all the evidence, the seductive logic of the neoliberal orthodoxy
coupled with not-too-hidden nexus between the corporate interests and governments are
putting the agenda of privatisation of water on fast track. There are reports that parts of
rivers and water bodies are being handed over to private managers. For instance, in
Chattisgarh, a 23.6 km. stretch of the Sheonath river was leased out to Radius Water
Limited. Fishing in, or taking water for irrigation purposes from, the said stretch is
banned. Similarly in Kerala the government has already approved several projects to
facilitate transfer of designated water bodies from public to private management, and the
two well-known recent schemes to have drawn much flak, and justifiably so, relate to
48
Malampuzha irrigation system, and the Periyar river. The significant fallout of these
developments is simple: sections of the poor and socially disadvantaged are being
deprived of the rights that they had.
Thus when it comes to a whole range of tangible assets - land, water, forests etc -
it is quite evident that the momentum towards loss of assets, or reduction in rights to
access such assets, has got accelerated in the recent times and 2002 was possibly among
the worst years in this regard.
As regards the other important correlates of poverty, the story since the
beginning of 1990s is no better. The rate of growth of returns to labour power has
suffered a decline during the reform period, compared to the earlier decade. For
agricultural labourers, who constitute the major bulk of the poor in India, the rate of
growth of real wages per annum was almost halved in the 1990s compared to the 1980s,
and the vulnerable workers across the board have suffered a similar fate. In general, the
past decade has witnessed a worsening of the working conditions of labourers in
informal sectors, both in agriculture and outside it, as per most of the relevant
indicators.
In this respect, possibly the hallmark of the 1990s has been the collapse of
employment opportunities. As the S.P. Gupta Report on Employment (2002), the
Report of the Second National Labour Commission (2002), and several other studies
based on the relevant data have found, the overall employment growth in the 1990s was
anywhere between two-thirds to a half of what it was in the 1980s. Open unemployment
has tended to become more of a serious problem in the recent years, even as disguised
unemployment continues at worrisome level. The employment elasticity of output
growth has dropped to near zero in a griculture, and in some sectors such as mining,

49
utilities, and social and community services, it has turned negative. The manufacturing
sector also witnessed substantial declines; in particular the growth of employment at an
average annual rate of only 0.87 percent between 1993 and 2000 was way below that in
the 1980s. Infact the share of the organised sector employment in total manufacturing at
16.5 percent in 2000 was lower than 18.3 percent in 1993.
The sharp deceleration in the organised sector employment on account of
collapse of opportunities in the public sector and only a slow increase in the private
sector, is obviously one of the more worrisome developments of the 1990s. Infact the
share of the organized sector in total workforce is only around 8 percent and the rest of
92 percent of the workers are located in the unorganized sector. Large sections of the
latter work under most unprotected conditions, as is well-documented, and there are
signs that their vulnerability may be on the rise.
One of the important causes, possibly the most significant, underlying a positive
development in rural areas during the 1980s was the increase in share of non-agricultural
employment in total rural employment. Given that the agricultural sector, even in
relatively backward states had started showing clear signs of declining employment
elasticity of output by 1980s, the above noted shift was considered a significant one by
many analysts. The important point that needs to be recalled here is that such a
development was largely on account of a substantial stepup in public expenditure in rural
areas, and not because of anything intrinsic to the growth process. Increase in the
government expenditure in rural areas was also instrumental in giving a boost to the
pitiful low wages in large parts of the country. The net impact of these developments
was that for the first time in the post-independence period, there was a clear trend
towards decline in poverty for well over a decade, beginning late 1970s.
50
As it happens, after the beginning of the economic reforms, the rate of growth of
central as well as state governments’ development expenditures started slackening, and
the situation has tended to worsen progressively in the recent years. Consequently, the
correlates that had facilated a declining trend in poverty prior to the onset of the reforms
have suffered a setback. As already mentioned, both the rates of growth of wage rate
and employment have taken a severe beating. Casualization of labour has continued
unabated and the proportion of self-employed has continued to go down; particularly
drastic has been the decline in non-agricultural employment in rural areas as may be seen
from Table 4.2.
Along with the above noted adverse developments, factors such as the squeeze
on credit for marginal/small farmers, negative developments on Public Distribution
System and a variety of other processes, most of which are well-documented, are bound
to have exacerbated the vulnerability in multiple ways, of those at the lower rungs of the
Indian society. Anecdotal evidence seems to suggeste that the instances of extreme
vulnerability getting translated into starvation dealths, suicides etc. may be on the rise.
As may be seen from Table 4.3, suicides on account of poverty, unemployment and
failure of agriculture is significant and quite substantial in many states of India.
In this context, it is worth emphasizing that among the greatest policy failures of
2002 was the central government’s inability to intervene in any substantive and
meaningful manner after the failure of summer monsoon. Infact, for a while
government spokespersons were not even willing to acknowledge drought conditions
had gripped several parts of the country. Even after the belated acknowledgement, there
was no attempt at any sort of damage containment. This was particularly absurd given
that at that time government’s food stocks were in excess of 60 million fonnes which
51
could have played an important role through food for work programme, both to provide
some relief as well as to undertake productive investment, for instance to strengthen rural
infrastructure. However, nothing of the sort was done. Infact, running down the stock
substantially would have made good sense even purely from the point of view of
bringing down the carrying cost, and subsidy on account of the same, a point
acknowledged even by some of the cheer-leaders of economic liberalisation in India.
In any event, nothing of any substance was done to address a nationwide tragedy,
and instead there was much quibbling over whether starvation deaths were actually
starvation deaths! We may also make the larger point here that all the talk of India being
self-sufficient in food is somewhat glib. Infact if one looks at the per capita availability
of cereals and pulses, as may be seen from Table 4.4, there are no reasons to make any
song and dance about it. Moreover, when it comes to food-security for these at the
lower rungs of society, it appears reasonable to hold the view that the situation is pretty
grim and has worsened in the recent years.
We may conclude this section by looking at the relevant policy direction coming
from the Tenth Five-Year Plan document. Like all its predecessors, this document too
sounds well-intentioned on the issue of poverty alleviation. Infact it explicitly states the
need for ‘expanding and reinvigorating the on-going poverty alleviation programmes to
improve quantitatively the economic conditions of SCs/OBCs/ Minorities, through
specially designed activities in the programmes best suited to their skills and
requirements’. However, there is no spelling out of detailed and actual policy
mechanisms that ought to be put in place to achieve the stated objective. If anything, the
suggestion that it makes about merger and rationalisation of such schemes may end up
diluting their quantitative significance.

52
Possibly the significant essential shift in the government’s policy perspective, as
reflected in the Tenth Plan document, is ever-greater reliance on the private sector. The
document hopes that the government will be able to ‘motivate the private and corporate
sectors to invest in the welfare and development of weaker sections and thus fulfil their
social obligations and responsibilities’. But there is no attempt to provide any grounding
for such a hope. And where on earth has the private sector fulfilled its ‘social
responsibilities’ on any significant scale to address the basic needs of the economically
and socially disadvantaged sections? Is it the case that the government is washing its
hands off from what are primarily its own responsibilities and day dreaming that the
private sector will do all the things that it has been grossly inadequate in addressing for
more than five decades? Sure enough, private and corporate sector must be included in
facilitating affirmative action for hitherto deprived groups, for which an appropriate
framework in terms of incentives, legislations, enforcement etc. need to be spelt out and
the Tenth Plan document shies away from that, but it would be sheer wishful thinking
that the market can be a substitute for the State in these areas.
To the extent that one can treat the plan document as the policy framework for
the five year span (i.e. 2002-2007), it seems that government is not even willing to engage
in any serious manner with the most pressing economic problems of almost the bottom
half of Indian society, such as not enough food, unaffordable health care, too few jobs
etc. On the contrary, often it does not even recognise the problem. For instance, the
document does not see access to food as a major problem, even through it is clear from
the NSS data that there has been a very large decline in per capita calorie consumption of
the poorest 40 percent of the population over the past decade. Worse still, the relevant

53
proposals in the document may lead to a further reduction in the Public Distribution
System, as well as public provisioning for other basic needs as has been indicated earlier.
A Concluding Remark
In the opening section of this essay, it was argued that in terms of its
constitutional mandate and through international declarations, India has committed itself
repeatedly to a development paradigms that would ensure access to basic needs for all its
citizens. Infact provision for most of these have been acknowledged as enforceable
rights to development by the Indian judicial system.
Nonetheless, the worst manifestations of poverty continue to afflict large sections
of Indian population and this has been the gravest failure of India’s development strategy
since independence. It also appears that the currently ascendent neoliberal globalization
agenda is making the material and social conditions more difficult and fragile for the
underprivileged economic and social groups, thus making it even for difficult for the
much cherished, promised, and even constitutionally and sometime legally mandated
rights to development to be realized. But then, the right to have rights (as Hannah
Arendt once put it), is never given on a platter, and the history of how such rights were
realized in different societies can be quite instructive in this regard. The current
economic policy regime in India does not inspire the confidence that we are on the right
track.
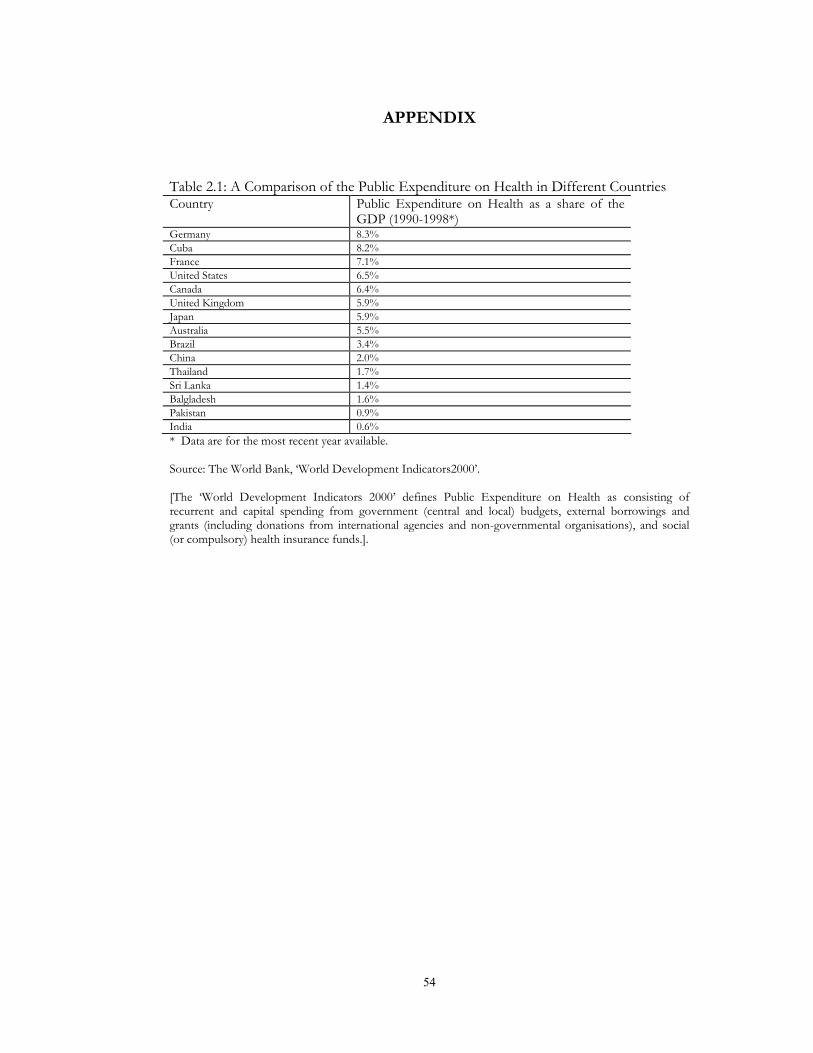
54
APPENDIX Table 2.1: A Comparison of the Public Expenditure on Health in Different Countries Country Public Expenditure on Health as a share of the
GDP (1990-1998*) Germany 8.3% Cuba 8.2% France 7.1% United States 6.5% Canada 6.4% United Kingdom 5.9% Japan 5.9% Australia 5.5% Brazil 3.4% China 2.0% Thailand 1.7% Sri Lanka 1.4% Balgladesh 1.6% Pakistan 0.9% India 0.6% * Data are for the most recent year available. Source: The World Bank, ‘World Development Indicators2000’. [The ‘World Development Indicators 2000’ defines Public Expenditure on Health as consisting of recurrent and capital spending from government (central and local) budgets, external borrowings and grants (including donations from international agencies and non-governmental organisations), and social (or compulsory) health insurance funds.].
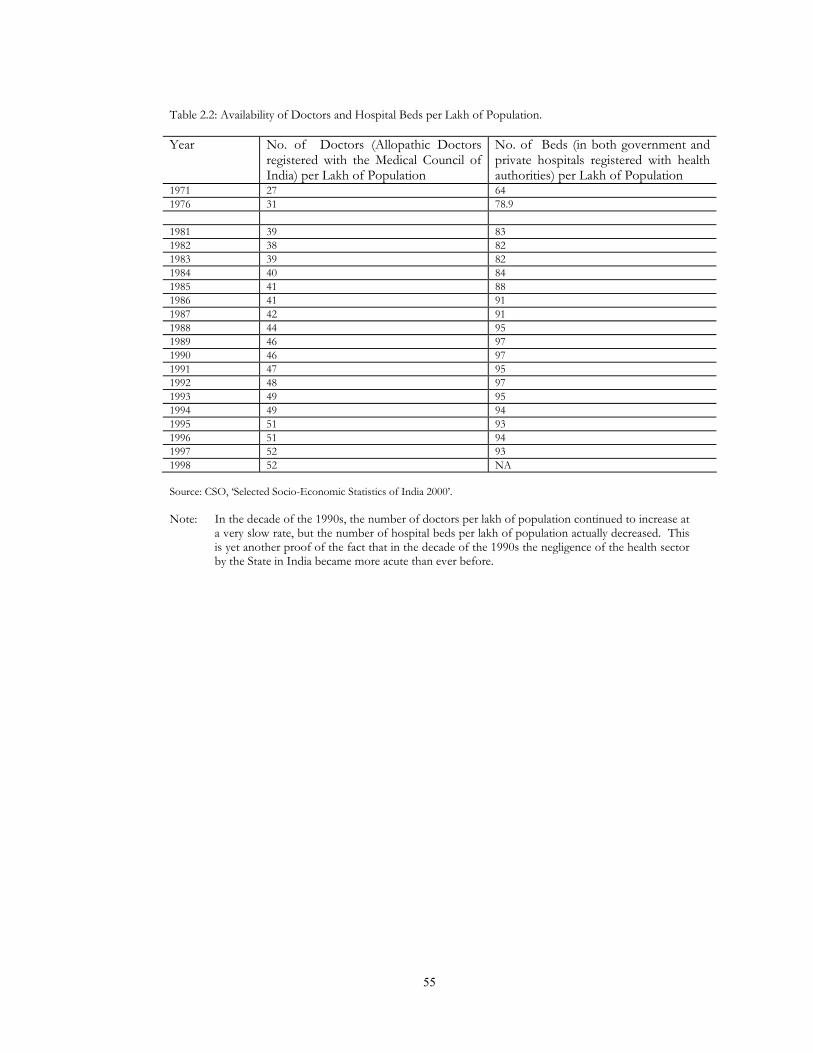
55
Table 2.2: Availability of Doctors and Hospital Beds per Lakh of Population. Year No. of Doctors (Allopathic Doctors
registered with the Medical Council of India) per Lakh of Population
No. of Beds (in both government and private hospitals registered with health authorities) per Lakh of Population
1971 27 64 1976 31 78.9 1981 39 83 1982 38 82 1983 39 82 1984 40 84 1985 41 88 1986 41 91 1987 42 91 1988 44 95 1989 46 97 1990 46 97 1991 47 95 1992 48 97 1993 49 95 1994 49 94 1995 51 93 1996 51 94 1997 52 93 1998 52 NA Source: CSO, ‘Selected Socio-Economic Statistics of India 2000’. Note: In the decade of the 1990s, the number of doctors per lakh of population continued to increase at
a very slow rate, but the number of hospital beds per lakh of population actually decreased. This is yet another proof of the fact that in the decade of the 1990s the negligence of the health sector by the State in India became more acute than ever before.
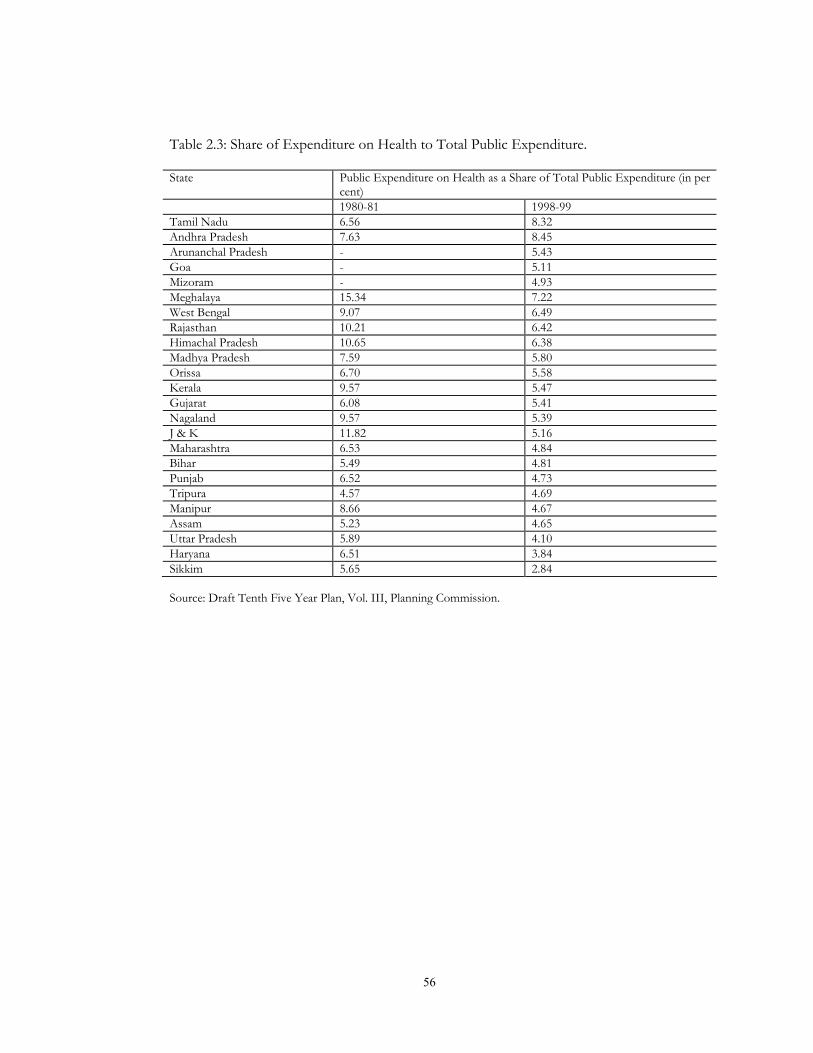
56
Table 2.3: Share of Expenditure on Health to Total Public Expenditure.
State Public Expenditure on Health as a Share of Total Public Expenditure (in per cent)
1980-81 1998-99 Tamil Nadu 6.56 8.32 Andhra Pradesh 7.63 8.45 Arunanchal Pradesh - 5.43 Goa - 5.11 Mizoram - 4.93 Meghalaya 15.34 7.22 West Bengal 9.07 6.49 Rajasthan 10.21 6.42 Himachal Pradesh 10.65 6.38 Madhya Pradesh 7.59 5.80 Orissa 6.70 5.58 Kerala 9.57 5.47 Gujarat 6.08 5.41 Nagaland 9.57 5.39 J & K 11.82 5.16 Maharashtra 6.53 4.84 Bihar 5.49 4.81 Punjab 6.52 4.73 Tripura 4.57 4.69 Manipur 8.66 4.67 Assam 5.23 4.65 Uttar Pradesh 5.89 4.10 Haryana 6.51 3.84 Sikkim 5.65 2.84 Source: Draft Tenth Five Year Plan, Vol. III, Planning Commission.
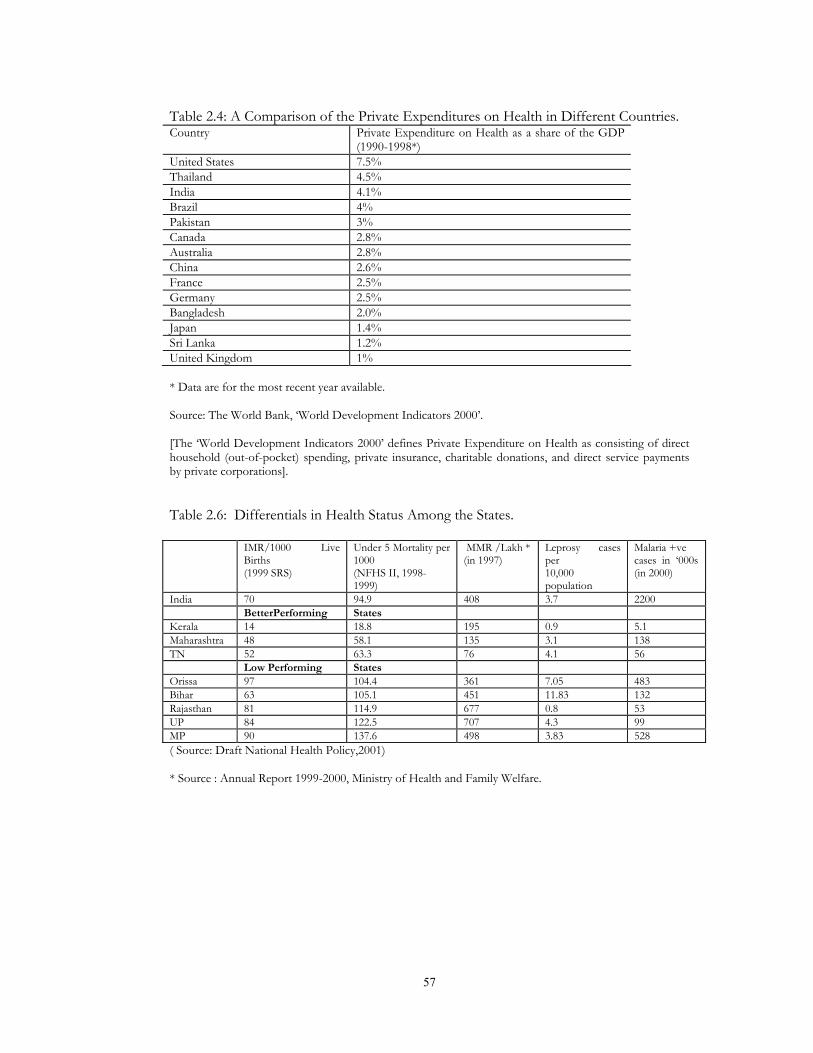
57
Table 2.4: A Comparison of the Private Expenditures on Health in Different Countries. Country Private Expenditure on Health as a share of the GDP
(1990-1998*) United States 7.5% Thailand 4.5% India 4.1% Brazil 4% Pakistan 3% Canada 2.8% Australia 2.8% China 2.6% France 2.5% Germany 2.5% Bangladesh 2.0% Japan 1.4% Sri Lanka 1.2% United Kingdom 1% * Data are for the most recent year available.
Source: The World Bank, ‘World Development Indicators 2000’.
[The ‘World Development Indicators 2000’ defines Private Expenditure on Health as consisting of direct household (out-of-pocket) spending, private insurance, charitable donations, and direct service payments by private corporations]. Table 2.6: Differentials in Health Status Among the States. IMR/1000 Live
Births (1999 SRS)
Under 5 Mortality per 1000 (NFHS II, 1998-1999)
MMR /Lakh * (in 1997)
Leprosy cases per 10,000 population
Malaria +ve cases in ‘000s (in 2000)
India 70 94.9 408 3.7 2200 BetterPerforming States Kerala 14 18.8 195 0.9 5.1 Maharashtra 48 58.1 135 3.1 138 TN 52 63.3 76 4.1 56 Low Performing States Orissa 97 104.4 361 7.05 483 Bihar 63 105.1 451 11.83 132 Rajasthan 81 114.9 677 0.8 53 UP 84 122.5 707 4.3 99 MP 90 137.6 498 3.83 528 ( Source: Draft National Health Policy,2001)
* Source : Annual Report 1999-2000, Ministry of Health and Family Welfare.
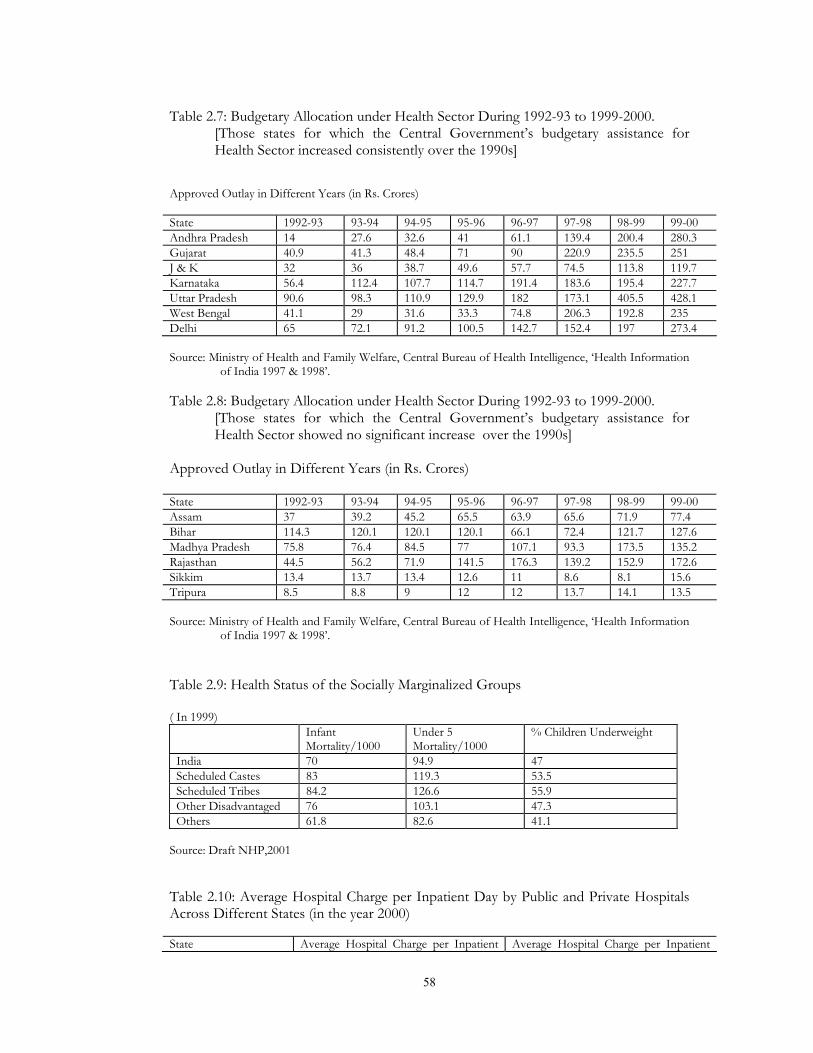
58
Table 2.7: Budgetary Allocation under Health Sector During 1992-93 to 1999-2000. [Those states for which the Central Government’s budgetary assistance for Health Sector increased consistently over the 1990s]
Approved Outlay in Different Years (in Rs. Crores)
State 1992-93 93-94 94-95 95-96 96-97 97-98 98-99 99-00 Andhra Pradesh 14 27.6 32.6 41 61.1 139.4 200.4 280.3 Gujarat 40.9 41.3 48.4 71 90 220.9 235.5 251 J & K 32 36 38.7 49.6 57.7 74.5 113.8 119.7 Karnataka 56.4 112.4 107.7 114.7 191.4 183.6 195.4 227.7 Uttar Pradesh 90.6 98.3 110.9 129.9 182 173.1 405.5 428.1 West Bengal 41.1 29 31.6 33.3 74.8 206.3 192.8 235 Delhi 65 72.1 91.2 100.5 142.7 152.4 197 273.4 Source: Ministry of Health and Family Welfare, Central Bureau of Health Intelligence, ‘Health Information
of India 1997 & 1998’. Table 2.8: Budgetary Allocation under Health Sector During 1992-93 to 1999-2000.
[Those states for which the Central Government’s budgetary assistance for Health Sector showed no significant increase over the 1990s]
Approved Outlay in Different Years (in Rs. Crores)
State 1992-93 93-94 94-95 95-96 96-97 97-98 98-99 99-00 Assam 37 39.2 45.2 65.5 63.9 65.6 71.9 77.4 Bihar 114.3 120.1 120.1 120.1 66.1 72.4 121.7 127.6 Madhya Pradesh 75.8 76.4 84.5 77 107.1 93.3 173.5 135.2 Rajasthan 44.5 56.2 71.9 141.5 176.3 139.2 152.9 172.6 Sikkim 13.4 13.7 13.4 12.6 11 8.6 8.1 15.6 Tripura 8.5 8.8 9 12 12 13.7 14.1 13.5 Source: Ministry of Health and Family Welfare, Central Bureau of Health Intelligence, ‘Health Information
of India 1997 & 1998’.
Table 2.9: Health Status of the Socially Marginalized Groups ( In 1999)
Infant Mortality/1000
Under 5 Mortality/1000
% Children Underweight
India 70 94.9 47 Scheduled Castes 83 119.3 53.5 Scheduled Tribes 84.2 126.6 55.9 Other Disadvantaged 76 103.1 47.3 Others 61.8 82.6 41.1
Source: Draft NHP,2001
Table 2.10: Average Hospital Charge per Inpatient Day by Public and Private Hospitals Across Different States (in the year 2000) State Average Hospital Charge per Inpatient Average Hospital Charge per Inpatient
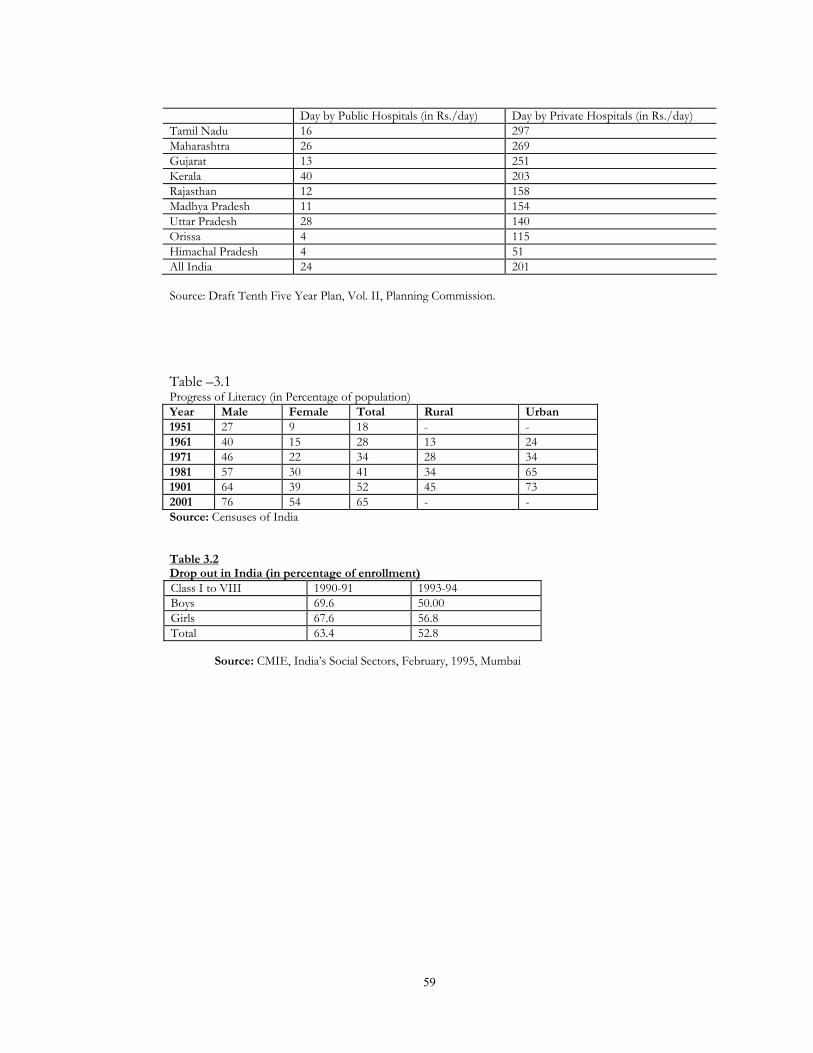
59
Day by Public Hospitals (in Rs./day) Day by Private Hospitals (in Rs./day) Tamil Nadu 16 297 Maharashtra 26 269 Gujarat 13 251 Kerala 40 203 Rajasthan 12 158 Madhya Pradesh 11 154 Uttar Pradesh 28 140 Orissa 4 115 Himachal Pradesh 4 51 All India 24 201 Source: Draft Tenth Five Year Plan, Vol. II, Planning Commission.
Table –3.1 Progress of Literacy (in Percentage of population) Year Male Female Total Rural Urban 1951 27 9 18 - - 1961 40 15 28 13 24 1971 46 22 34 28 34 1981 57 30 41 34 65 1901 64 39 52 45 73 2001 76 54 65 - - Source: Censuses of India
Table 3.2 Drop out in India (in percentage of enrollment) Class I to VIII 1990-91 1993-94 Boys 69.6 50.00 Girls 67.6 56.8 Total 63.4 52.8
Source: CMIE, India’s Social Sectors, February, 1995, Mumbai

60
Table 3.3 : Percentage of Children of School-going Age out of School going Children out of School, 1999-2000 States/UT % 6-14 years old out of school % contribution of state/UT to total
out-of-school children Rural Urban Total Rural Urban Total Andhra Pradesh 26.3 14.9 22.9 6.8 10.1 7.2 Arunanchal Pradesh 30.7 16.0 29.3 0.1 0.0 0.1 Assam 20.0 11.0 19.2 2.2 0.8 2.0 Bihar 48.4 29.0 45.9 22.6 12.5 21.2 Goa 13.1 5.4 9.9 0.0 0.1 0.0 Gujarat 23.0 11.6 19.6 3.4 4.5 3.6 Haryana 14.5 13.2 14.2 1.1 2.1 1.3 Himachal Pradesh 4.8 2.0 4.5 0.1 0.0 0.1 Jammu & Kashmir 19.0 10.7 17.5 0.5 0.4 0.5 Karnataka 22.6 10.2 19.8 4.1 3.5 4.0 Kerala 2.5 1.9 2.4 0.2 0.3 0.2 Madhya Pardesh 31.6 13.8 27.9 10.7 7.6 10.3 Maharashtra 14.0 6.8 11.4 3.9 6.7 4.3 Manipur 12.8 1.9 9.7 0.1 0.0 0.1 Meghalaya 13.0 3.7 11.3 0.1 0.0 0.1 Mizoram 9.3 4.4 7.3 0.0 0.0 0.0 Nagaland 10.1 5.8 8.7 0.0 0.0 0.0 Orissa 29.9 16.8 27.7 4.4 3.1 4.2 Punjab 14.4 11.1 13.4 1.1 2.2 1.2 Rajasthan 30.6 14.7 27.4 6.5 4.9 6.3 Sikkim 5.0 16.7 6.0 0.0 0.0 0.0 Tamilnadu 10.1 7.8 9.3 1.5 4.0 1.9 Tripura 9.6 9.0 9.5 0.1 0.1 0.1 Uttar Pradesh 28.6 22.5 27.4 21.5 26.1 22.1 West Bengal 26.4 18.2 25.1 8.7 7.1 8.5 A & N Island 7.4 4.5 6.7 0.0 0.0 0.0 Chandigarh 5.1 6.2 6.1 0.0 0.1 0.0 Dadra & Nagar Haveli 30.5 6.4 28.7 0.0 0.0 0.0 Daman & Diu 7.3 3.9 5.8 0.0 0.0 0.0 Delhi 1.7 13.5 10.6 0.0 3.6 0.5 Lakshadweep 1.6 3.8 2.9 0.0 0.0 0.0 Pondichery 1.9 7.1 5.0 0.0 0.1 0.0 Total 26.9 14.4 24.0 100.0 100.0 100.0 Source: Srivastava, Ravi, 2002.
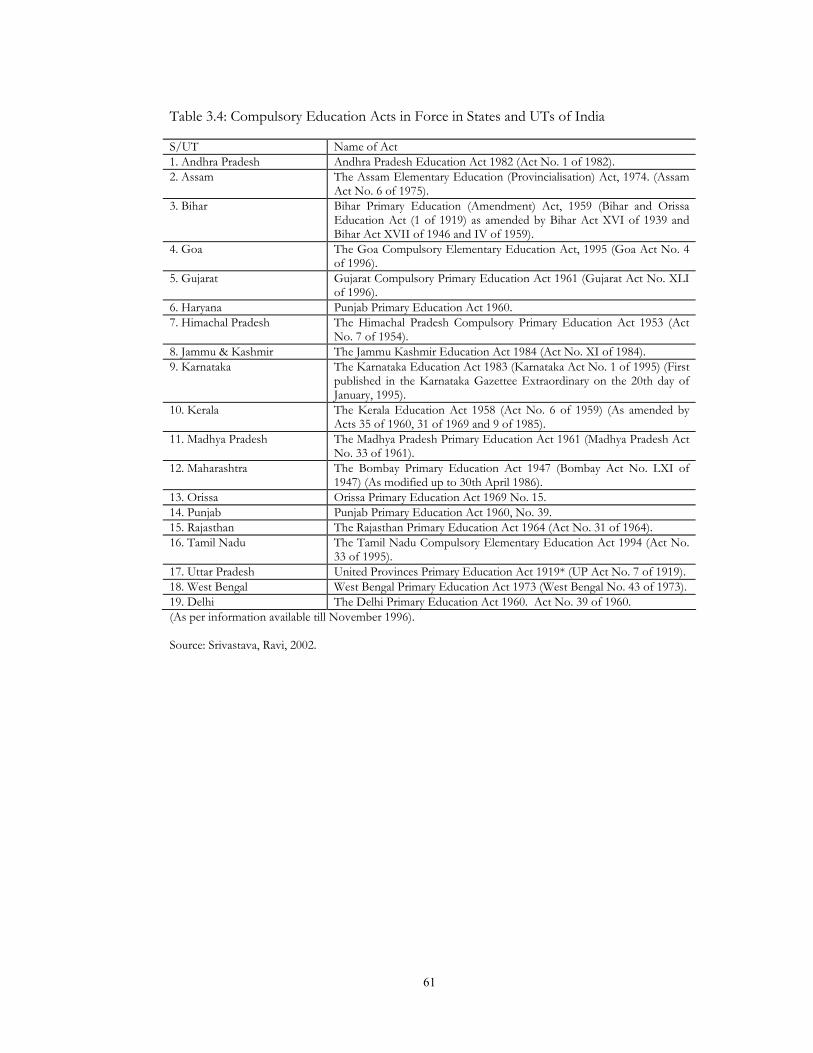
61
Table 3.4: Compulsory Education Acts in Force in States and UTs of India S/UT Name of Act 1. Andhra Pradesh Andhra Pradesh Education Act 1982 (Act No. 1 of 1982). 2. Assam The Assam Elementary Education (Provincialisation) Act, 1974. (Assam
Act No. 6 of 1975). 3. Bihar Bihar Primary Education (Amendment) Act, 1959 (Bihar and Orissa
Education Act (1 of 1919) as amended by Bihar Act XVI of 1939 and Bihar Act XVII of 1946 and IV of 1959).
4. Goa The Goa Compulsory Elementary Education Act, 1995 (Goa Act No. 4 of 1996).
5. Gujarat Gujarat Compulsory Primary Education Act 1961 (Gujarat Act No. XLI of 1996).
6. Haryana Punjab Primary Education Act 1960. 7. Himachal Pradesh The Himachal Pradesh Compulsory Primary Education Act 1953 (Act
No. 7 of 1954). 8. Jammu & Kashmir The Jammu Kashmir Education Act 1984 (Act No. XI of 1984). 9. Karnataka The Karnataka Education Act 1983 (Karnataka Act No. 1 of 1995) (First
published in the Karnataka Gazettee Extraordinary on the 20th day of January, 1995).
10. Kerala The Kerala Education Act 1958 (Act No. 6 of 1959) (As amended by Acts 35 of 1960, 31 of 1969 and 9 of 1985).
11. Madhya Pradesh The Madhya Pradesh Primary Education Act 1961 (Madhya Pradesh Act No. 33 of 1961).
12. Maharashtra The Bombay Primary Education Act 1947 (Bombay Act No. LXI of 1947) (As modified up to 30th April 1986).
13. Orissa Orissa Primary Education Act 1969 No. 15. 14. Punjab Punjab Primary Education Act 1960, No. 39. 15. Rajasthan The Rajasthan Primary Education Act 1964 (Act No. 31 of 1964). 16. Tamil Nadu The Tamil Nadu Compulsory Elementary Education Act 1994 (Act No.
33 of 1995). 17. Uttar Pradesh United Provinces Primary Education Act 1919* (UP Act No. 7 of 1919). 18. West Bengal West Bengal Primary Education Act 1973 (West Bengal No. 43 of 1973). 19. Delhi The Delhi Primary Education Act 1960. Act No. 39 of 1960. (As per information available till November 1996). Source: Srivastava, Ravi, 2002.
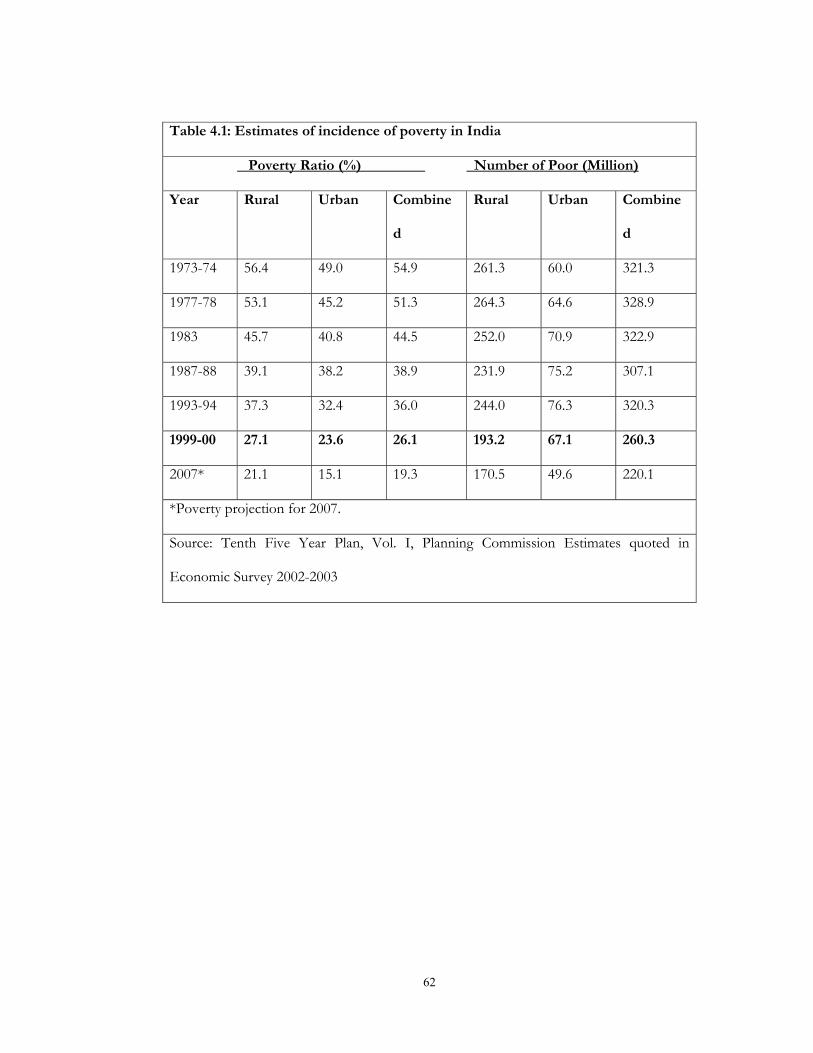
62
Table 4.1: Estimates of incidence of poverty in India
Poverty Ratio (%) Number of Poor (Million)
Year Rural Urban Combine
d
Rural Urban Combine
d
1973-74 56.4 49.0 54.9 261.3 60.0 321.3
1977-78 53.1 45.2 51.3 264.3 64.6 328.9
1983 45.7 40.8 44.5 252.0 70.9 322.9
1987-88 39.1 38.2 38.9 231.9 75.2 307.1
1993-94 37.3 32.4 36.0 244.0 76.3 320.3
1999-00 27.1 23.6 26.1 193.2 67.1 260.3
2007* 21.1 15.1 19.3 170.5 49.6 220.1
*Poverty projection for 2007.
Source: Tenth Five Year Plan, Vol. I, Planning Commission Estimates quoted in
Economic Survey 2002-2003
63
Table 4.2: NSS Rates of Growth of Employment: All India Usual Status: Principal (a) For Rural and Urban Areas
1977-78 to 1990-91 1990-91 to 1999-00 Agriculture 1.12 1.17 Non-agriculture 4.13 2.12 All Sectors 2.16 1.55 (b) For Rural Areas 1977-78 to 1990-91 1990-91 to 1999-00 Agriculture 1.06 1.27 Non-agriculture 4.75 0.99 All Sectors 1.84 1.20 Source: Sen & Jha (2001) Table 4.3: Statewise List of Suicides in India due to Poverty, Unemployment and Failure of Agriculture (in 1999) States Poverty Unemployment Farming/Agriculture Male Female Tot % of
Grand total
M F T % M F T %
AP 604 221 825 7.94 114 40 154 1.48 1604 370 1974 19.01 Arunachal 1 0 1 1.35 - - - - 3 3 6 8.11 Assam 201 57 258 10.18 133 42 175 6.9 68 14 82 3.23 Bihar 15 4 19 1.06 25 4 29 1.62 101 26 127 7.08 Goa 1 - 1 0.39 10 3 13 5.08 5 - 5 1.95 Gujrat 83 65 148 2.97 220 33 253 5.07 405 95 500 10.03 Haryana 33 1 34 1.48 38 11 49 2.13 170 35 205 8.92 H P 4 3 7 2.15 4 1 5 1.53 39 - 39 11.96 J & K - - - - 5 2 7 7.14 1 2 3 3.06 Karnataka 339 140 479 3.84 161 39 200 1.6 2002 377 2379 19.05 Kerala 7 2 9 0.09 239 68 307 3.14 1291 140 1431 14.63 M P 88 18 106 1.09 82 12 94 0.97 2055 599 2654 27.82 Maharashtra 202 56 258 1.9 173 28 201 1.48 2050 373 2423 Manipur - - - - - - - - - - - - Meghalaya 1 2 3 5.36 - - - - 3 2 5 8.93 Mizoram - - - - - - - - - - - - Nagaland - - - - - - - - - - 1 6.67 Orissa 6 4 10 0.27 29 1 30 0.82 259 6 265 7.26 Punjab 27 6 33 3.35 11 - 11 1.12 87 - 87 8.82 Rajasthan 56 26 82 2.19 68 11 79 2.11 583 141 724 19.34 Sikkim 6 2 8 7.41 - - - - 15 2 17 15.74 Tamilnadu 231 125 356 3.11 188 43 231 2.02 635 169 804 7.02 Tripura 20 20 40 4.26 - - - - 97 - 97 10.34 U P 99 33 132 2.41 137 6 143 2.61 726 119 845 15.43 West Bengal 30 13 43 0.31 121 22 143 1.03 917 323 1240 8.93
Source: Compiled from “Accidental Deaths and Suicides in India - 1999”, Ministry of Home Affairs, GOI. Table 4.4: Per Capita net Availability per day (grams) Year Cereals Pulses Total 1951 334.2 60.7 394.9 1952 325.4 59.1 384.5
64
1953 349.9 62.7 412.6 1954 388.1 69.7 457.8 1955 372.9 71.1 444.0 1956 360.4 70.3 430.7 1957 375.3 71.8 447.1 1958 380.5 58.5 439.0 1959 393.4 74.9 468.3 1960 384.1 65.5 449.6 1961 399.7 69.0 468.7 1962 398.9 62.0 460.9 1963 384.0 59.8 443.8 1964 401.0 51.0 452.0 1965 418.5 61.6 480.1 1966 359.9 48.2 408.1 1967 361.8 39.6 401.4 1968 404.1 56.1 460.2 1969 397.8 47.3 445.1 1970 403.1 51.9 455.0 1971 417.6 51.2 468.8 1972 419.1 47.0 466.1 1973 350.5 41.1 421.6 1974 410.4 40.8 451.2 1975 365.8 39.7 405.5 1976 373.8 50.5 424.3 1977 386.3 43.3 429.6 1978 422.5 45.5 468.0 1979 431.8 44.7 476.5 1980 379.5 30.9 410.4 1981 417.3 37.5 454.8 1982 415.6 39.2 454.8 1983 397.8 39.5 437.3 1984 437.8 41.9 479.7 1985 415.6 38.4 454.0 1986 434.2 43.9 478.1 1987 435.4 36.4 471.8 1988 411.8 36.7 448.5 1989 452.6 41.9 494.5 1990 435.3 41.1 476.4 1991 468.5 41.6 510.1 1992 434.5 34.3 468.8 1993 427.9 36.2 464.1 1994 434.0 37.2 471.2 1995 457.6 37.8 495.4 1996 442.5 32.7 475.2 1997 466.0 37.1 503.1 1998 414.2 32.8 447.0 1999 429.2 36.5 465.7 2000 422.0 31.8 454.4 2001 385.1 29.1 414.1 Source: Economic Survey 2003.
REFERENCES
Baru, R. (2002); “Privatisation and Corporatisation”, Seminar Paper, May.

65
Central Bureau of Health Intelligence, MoH&FW (2000); “Health Information of
India 1997 & 1998”. Central Statistical Organization, Government of India; “Selected Socio-
Economic Statistics of India 2000”. Centre for Monitoring Indian Economy; ‘India’s Social Sectors’, February 1995,
Mumbai. Chaudhury, Sudip (2002); “TRIPS Agreement and Amendment of Patents Act in
India”, Economic and Political Weekly, August 10. Delhi Science Forum (2001), “National Health Policy 2001 - Legitimising
Privatisation”, November. Department of Economic Affair, Ministry of Finance, Government of India;
“Budget 2002-2003”. Duggal, Ravi (2002); “Right to Helath” (Mimeo), CEHAT, Mumbai. Government of India, Ministry of Home Affairs (1999); Accidental Deaths and
Suicides in India. Government of India; The Gazzattee of India, Extraordinary, Part II Section 1,
13 December 2002, New Delhi. Government of India; Census of India 1961, 1981, 1991 and 2001. Government of India; Economic Survey 2002-2003. Ministry of Health and Family Welfare, Government of India; “Annual Report
1999-2000”. Ministry of Health and Family Welfare, Government of India; “Draft National
Health Policy, 2001”. Planning Commission, Government of India (2002); “Draft Tenth Five Year
Plan”. Quadeer, Imrana (2002); “Debt Payment and Devaluing Elements of Public
Health”, Economic and Political Weekly, January 5. Ramachandran, R. (2002); “Unhealthy Policy”, Frontline, March 15. Reddy, M.V. Lakshmi (2002); “Implementation of Adult Education and
Development Programme: Contradiction and Distortions”, University News, 40(40), October 7-13.

66
Sen, Abhijit and Jha, Praveen (2001); ‘Rural Employment: Patterns and Trends from the National Sample Survey’, CESP, JNU, New Delhi.
Sen, G.; Iyer, A. And George, A. (2002); “Structural Reforms and Health Equity -
A Comparison of NSS Surveys: 1986-87 and 1995-96”, Economic and Political Weekly, April 6.
Srivastava, R.S. (2002); ‘The Right to Education in India’, Preliminary Paper for
Discussion, CSRD, JNU, New Delhi. UNDP, “Human Development Report 2002”.
United Nations (1998); ‘Basic Facts About the United Nations’.