current market outlook 2013–2032 - cme-mec.ca $111 2012 $112 2013 ytd $110 year-over-year may 2012...
TRANSCRIPT

Current Market Outlook2013 –2032

Current Market Outlook2013 –2032
3Copyright © 2013 Boeing. All rights reserved.
Outlook on a Page
Growth measures
RegionsWorld economy (GDP) %Airline traffic (RPK) %Cargo traffic (RTK) %Airplane fleet %Market sizeDeliveriesMarket value ($B)Average value ($M)Unit share %Value share %New airplane deliveriesLarge widebodyMedium widebodySmall widebodySingle aisleRegional jetsTotalMarket value (2012 $B, catalog prices)Large widebodyMedium widebodySmall widebodySingle aisleRegional jetsTotal2012 fleetLarge widebodyMedium widebodySmall widebodySingle aisleRegional jetsTotal2032 fleetLarge widebodyMedium widebodySmall widebodySingle aisleRegional jetsTotal
Market values above 5 have been rounded to the nearest 10.
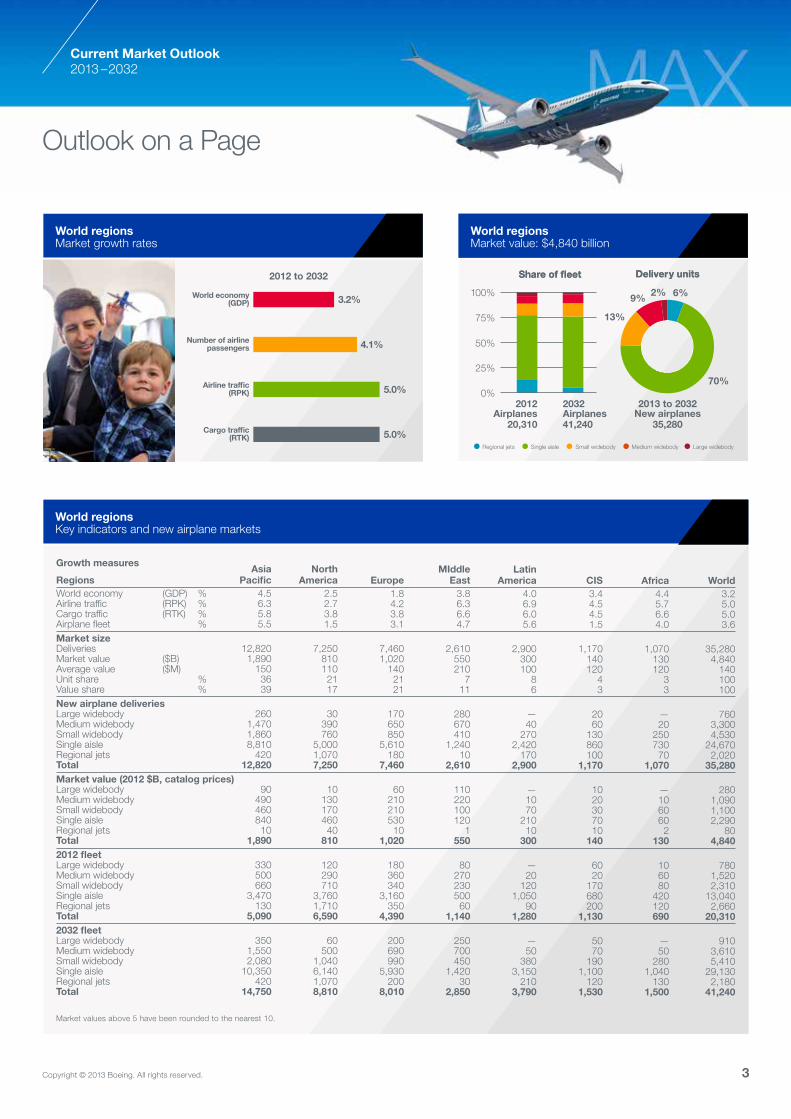
2012 to 2032
Number of airlinepassengers
Airline traffic(RPK)
Cargo traffic(RTK)
World economy(GDP)
5.0%
4.1%
3.2%
5.0%
Delivery units
2%
2013 to 2032New airplanes
35,280
Share of fleet
2012Airplanes
20,310
Delivery units
6%9%
13%
70%
100%
0%
75%
50%
25%
Share of fleet
2032Airplanes41,240
• Regional jets • Single aisle • Small widebody • Medium widebody • Large widebody
AsiaPacific
4.56.35.85.5
12,8201,890
1503639
2601,4701,8608,810
42012,820
9049046084010
1,890
330500660
3,470130
5,090
3501,5502,080
10,350420
14,750
NorthAmerica
2.52.73.81.5
7,2508101102117
30390760
5,0001,0707,250
1013017046040
810
120290710
3,7601,7106,590
60500
1,0406,1401,0708,810
Europe1.84.23.83.1
7,4601,020
1402121
170650850
5,610180
7,460
6021021053010
1,020
180360340
3,160350
4,390
200690990
5,930200
8,010
MIddleEast
3.86.36.64.7
2,610550210
711
280670410
1,24010
2,610
110220100120
1550
8027023050060
1,140
250700450
1,42030
2,850
LatinAmerica
4.06.96.05.6
2,900300100
86
—40
2702,420
1702,900
—1070
21010
300
—20
1201,050
901,280
—50
3803,150
2103,790
CIS3.44.54.51.5
1,170140120
43
2060
130860100
1,170
1020307010
140
6020
170680200
1,130
5070
1901,100
1201,530
Africa4.45.76.64.0
1,070130120
33
—20
25073070
1,070
—1060602
130
106080
420120690
—50
2801,040
1301,500
World3.25.05.03.6
35,2804,840
140100100
7603,3004,530
24,6702,020
35,280
2801,0901,1002,290
804,840
7801,5202,310
13,0402,660
20,310
9103,6105,410
29,1302,180
41,240
World regionsMarket growth rates
World regionsMarket value: $4,840 billion
World regionsKey indicators and new airplane markets

Current Market Outlook2013 –2032
4 Copyright © 2013 Boeing. All rights reserved.
Current Market Outlook2013 –2032
Purpose of the forecastThe Current Market Outlook is our long-term forecast of air traffic volumes and airplane demand. The forecast has several important practical applications. It helps shape our product strategy and provides guidance for our long-term business planning. We have shared the forecast with the public since 1964 to help airlines, suppliers, and the financial community make informed decisions.
Each year we start fresh, so we can factor the effects of current business conditions and developments into our analysis of the long-term drivers of air travel. The forecast details demand for passenger and freighter airplanes, both for fleet growth and for replacement of airplanes that retire during the forecast period. We also project the demand for conversion of passenger airplanes to freighters.
Air travel continues to be resilientThe remarkable resilience of air travel is amply documented in more than 45 years of published editions of the Boeing Current Market Outlook.
Commercial aviation has weathered many downturns in the past. Yet recovery has followed quickly as the industry reliably returned to its long-term growth rate of approximately 5 percent per year. Despite uncertainties, 2012 passenger traffic rose 5.3 percent from 2011 levels. We expect this trend to continue over the next 20 years, with world passenger traffic growing 5.0 percent annually. Air cargo traffic has been moderating after a high period in 2010. Air cargo contracted by 1.5 percent in 2012. Expansion of emerging-market economies will, however, foster a growing need for fast, efficient transport of goods. We estimate that air cargo will grow 5.0 percent annually through 2032.
The shape of the marketWe forecast a long-term demand for 35,280 new airplanes, valued at $4.8 trillion. We project that 14,350 of these new airplanes (41 percent of the total new deliveries) will replace older, less efficient airplanes, reducing the cost of air travel and decreasing carbon emissions. The remaining 20,930 airplanes will be for fleet growth, stimulating expansion in emerging markets and innovative airline business models. Approximately 24,670 airplanes (70 percent of new deliveries) will be single-aisle airplanes, reflecting growth in emerging markets such as China, and the continued expansion of low-cost carriers throughout the world. Widebody share will also increase, from 23 percent of today’s fleet to 24 percent in 2032. The 8,590 new widebody airplanes will allow airlines to continue expansion into more international markets.
Randy Tinseth
introduces
the 2013
Current Market
Outlook
Current Market Outlook2013–2032
New ValueSize airplanes ($B)
Large widebody 760 280
Medium widebody 3,300 1,090
Small widebody 4,530 1,100
Single aisle 24,670 2,290
Regional jets 2,020 80
Total 35,280 4,840
Airplanes in service2012 and 2032
Demand by size2013 to 2032
Size 2012 2032
Large widebody 780 910
Medium widebody 1,520 3,610
Small widebody 2,310 5,410
Single aisle 13,040 29,130
Regional jets 2,660 2,180
Total 20,310 41,240
*$ values throughout the CMO are catalog prices.
New ValueRegion airplanes ($B)
Asia Pacific 12,820 1,890
Europe 7,460 1,020
North America 7,250 810
Middle East 2,610 550
Latin America 2,900 300
CIS* 1,170 140
Africa 1,070 130
Total 35,280 4,840
Key indicators2012 to 2032
Demand by region2013 to 2032
Growth measures
World economy 3.2%Gross domestic product (GDP)
Airplane fleet 3.6%
Number of 4.1%passengers
Airline traffic 5.0%Revenue passenger-kilometers (RPK)
Cargo traffic 5.0%Revenue tonne-kilometers (RTK) *Commonwealth of Independent States.
Long-Term Market

Current Market Outlook2013 –2032
5Copyright © 2013 Boeing. All rights reserved.
Dynamic industryAviation is a dynamic industry that continuously adapts to various market forces. Key market forces that impact the airline industry are fuel prices, economic growth and development, environmental regulations, infrastructure, market liberalization, airplane capabilities, other modes of transport, business models, and emerging markets. Each of these forces can have both positive and negative impacts on the industry. Fuel is now the largest component of an airline’s cost structure. This has driven manufacturers to produce more efficient airplanes, such as the 787 and the 737 MAX, while encouraging airlines to pursue cost reductions and revenue enhancements in other areas in order to maintain profitability, even with higher fuel costs.
These market forces are incorporated into the long-term forecast that Boeing produces annually. The economy, as reflected by gross domestic product (GDP), one of the main contributors to airline growth, is forecast to rise 3.2 percent over the next 20 years, which will drive 5.0 percent annual growth in passenger traffic as well as 5.0 percent annual growth in cargo traffic (which is also highly dependent on global trade).
Airlines responding and adaptingAirlines continue to adapt to the dynamic business environment. Operating statistics suggest that airlines are deploying capacity strategically to help boost yields and cover higher fuel expenses. Passenger traffic continues to grow at or above trend. Passenger traffic grew 5.3 percent in 2012 compared to 2011, while capacity grew at a rate of 3.9 percent. This led to an industry-high load factor of 79.1 percent in 2012. Despite a challenging economy, 2012 was one of the best years the airline industry has had since the Great Recession. In 2012, airlines earned $7.6 billion profit. Asian airlines and North America contributed the most to profitability. IATA forecasts an even more profitable year in 2013, with traffic following the trend of at least 5.0 percent annual growth.
Source:IATA
June 2013
NorthAmerica
Europe Asia MiddleEast
LatinAmerica
Africa
5.0%
4.0%
3.0%
2.0%
1.0%
0.0%
-1%
2.4 4.4 3.7 4.6
0.3 1.6
(0.1)
0.11.0 1.5 0.3
0.6
Net profit (billions $)
• 2012 • 2013F
Market developmentsRegional profitability outlook
Market developmentsMarket drivers and considerations
World load factors
2002
2003
2004
2005
2006
2007
2008
2009
2010
2011
2012
80%
78%
76%
74%
72%
70%
68%
66%
Source:ICAO/
IATA
Market developmentsWorld passenger load factors at historic highs
Market Developments

Current Market Outlook2013 –2032
Current Market Outlook2013 –2032
6 Copyright © 2013 Boeing. All rights reserved.
Growth tempered by policy uncertaintyGlobal GDP growth for 2012 was disappointing at 2.2 percent. Expectations for a strengthening economic recovery as the year progressed failed to materialize. Policy uncertainty in the Eurozone caused the yields of peripheral country sovereign bonds to spike in mid-year, pushing Europe back into recession. US policy uncertainty produced the threat of the economy falling over a “fiscal cliff.” The result was weaker growth, not only in these major developed economies, but also in major emerging economies.
Regions recover at different ratesEmerging economies also faced their own headwinds. In China, investment and industrial production slowed in the face of the inventory buildup that resulted from the stimulus-driven boom of 2010 and 2011. Regulations aimed at curbing excesses in the property market also contributed to the slowdown. Growth in the rest of Asia was relatively strong, driven by robust domestic demand, which buffered lower demand for exports. The exception was Japan, which was mired in recession for most of the year. Growth moderated in Latin America and the deceleration was particularly pronounced in Brazil. The Mexican economy, by contrast, strengthened as increased business and consumer confidence sustained domestic demand.
Recovery in the major developed economies has been weak as households and governments reduce debt built up before and during the Great Recession. Global growth in 2013 is forecast to be no stronger than in 2012, though as policy uncertainty recedes, momentum is projected to increase in the second half of the year. This should provide a more robust base for accelerated growth in 2014 and 2015.
Fuel prices continue to challenge profitabilityVolatile oil prices have been the greatest challenge to airline profitability apart from the weak economy. Fuel costs have surpassed labor as the largest segment of airline operating cost. Fuel costs, approximately 13 percent of total costs in 2002, are closer to 34 percent today. After spiking in early 2012, oil prices have remained relatively stable. On the demand side, the weak economic outlook has moderated near-term growth projections. On the supply side, rising shale oil production in the United States is moderating near-term price projections. Lower jet fuel prices are bolstering near-term airline profitability outlooks.
Spot $/barrel (Brent crude oil / US Gulf Coast jet fuel)
180
160
140
120
100
80
60
40
2020132000
Average Annual Price2007 $72
2006 $65
2008 $97
2009 $62
2010 $80
2011 $111
2012 $112
2013 YTD $110
Year-over-Year
May 2012
Apr 2013
US, EU, Japan = 62% of World GDP
Jet Fuel
Brent Crude Oil
Real GDP growthApril 2013 forecast
Business environmentNear‐term economic challenges
-3
-2
-1
0
1
2
3
4
5
2007
2008
2009
2010
2011
2012
2013
2014
2015
2016
2017
Long-term average
Source: IHS Global
Insight
Business environmentRegional profitability outlook
Source:IATA
Business environmentOil and jet fuel prices elevated and volatile
Source: EIA
NorthAmerica
Europe Asia MiddleEast
LatinAmerica
Africa
2012 net profit (billions $)4.5%
4.0%
3.5%
3.0%
2.5%
2.0%
1.5%
1.0%
0.5%
0%
0.5%
2.4
0.3
3.9
0.9 0.3
(0.1)
Market DevelopmentsBusiness Environment

Current Market Outlook2013 –2032
7Copyright © 2013 Boeing. All rights reserved.
Single-aisle market share on the riseToday there are more than 900 airlines in operation, with more than 20,000 jet airplanes in service. The fleet composition has changed over the past 20 years, and we expect that it will continue to evolve over time. The widebody fleet mix has seen one of the largest changes. In 1992, the majority of widebody airplanes were of the small and large size categories. We expect the medium widebody category to gain an increasing share through 2032. The regional jet segment of the market continues to shrink as airlines focus on costs. This market segment will remain flat, thus losing share as airlines favor other size categories of airplanes. As emerging markets and the diversity of business models continue to expand, we expect that single-aisle airplanes will remain popular with airlines and passengers and thus gain share going forward.
Growing fuel efficiencyFuel costs have nearly doubled over the past 10 years. Fuel represents up to 30 percent of total operating cost for single-aisle airplanes and up to 50 percent for widebody airplanes. Airlines are looking at all opportunities to reduce costs. One way to do this is to replace older, less efficient airplanes with new-technology airplanes, such as the 737 MAX and 787. Other ways include increasing airplane utilization. Utilization for the single-aisle fleet is currently 2 percent higher than it was in 2011, and the widebody fleet is 0.4 percent higher than in 2011. The steadily rising load factor is another way airlines are increasing efficiency. Average load factor reached a record high of 79 percent in 2012.
Increasing geographical diversityAt year-end 2012, the United States had the world’s largest commercial fleet, comprising 6,080 airplanes. China, Russia, and the United Kingdom followed with the second, third, and fourth largest commercial fleets. Commercial airplane backlogs indicate growing geographical diversity in the order base. The United States and China retain the top two positions in terms of number of airplane orders, as new entrants including Indonesia, India, Malaysia, and Russia gain a significant presence.
Today’s fleetIn-service fleet: 20,314
Source:Flight Global Ascend
online database
5000
4000
3000
7000
6000
2000
1000
0
US
A
Chi
na
Rus
sia
UK
Ger
man
y
Can
ada
Jap
an
Fran
ce
Bra
zil
Aus
tral
ia
Largest in-service jet fleet at year-end 2012(Jets over 30 seats)
Today’s FleetBacklog: 10,022
3,000
2,500
2,000
1,500
1,000
500
0
US
A
Chi
na
Ind
one
sia
Indi
a
Mal
aysi
a
Rus
sia
UA
E
Bra
zil
No
rway
Sin
gapo
re
Backlog by country at year‐end 2012(Jets over 30 seats)
Source:Flight Global Ascend
online database
Today’s fleetFuel has doubled as a percentage of airline costs
100%
80%
60%
40%
20%
0%2003
Single aisle Widebody
20032013 2013
15%
30%
25%
50%
*Over the past 10 years as a cash operating cost, typical rules, representative aircraft • Fuel costs
Market DevelopmentsToday’s Fleet

Current Market Outlook2013 –2032
Current Market Outlook2013 –2032
8 Copyright © 2013 Boeing. All rights reserved.
Infrastructure investment remains crucialSustained investment in aviation infrastructure is crucial to the continuing growth of commercial aviation. Airports, national airspace management agencies, and airlines share challenges and opportunities of aviation growth.
Boeing analysis indicates that congestion at certain airports around the world will increase over the next 20 years as projected commercial air traffic growth drives demand for takeoffs and landings to reach or surpass airport capacity. The world’s busiest airports, such as London’s Heathrow, have already reached their limits for hourly airplane movements, even with slot controls.
Many airports have capacity to meet projected traffic growth. Other airports have the capacity to handle demand efficiently during off-peak hours, but are constrained during morning and/or evening hours when demand is highest. Continued infrastructure investment is particularly important in regions, such as China, Northeast and Southeast Asia, India, and Latin America, where aviation growth outpaces planned infrastructure development.
Capital improvementsAirport authorities around the world are investing in large capital projects, including new or improved runways, terminal expansions, and entirely new airports. These investments can significantly increase airport capacity, but are substantial, and development times typically extend more than a decade from initial planning to completion of construction. Community noise and environmental concerns often stretch development times further and may limit the scope of expansion.
Airspace management enhancementsMany national and regional airspace management agencies are engaged in programs to overhaul airspace systems. For example, the United States is implementing the NextGen program to help airports run smoother and avoid long takeoff lines on the runway. This type of program is implemented gradually, and the improvements in airport efficiency will be realized over time.
Airlines have implemented a number of approaches to manage airport crowding. In particular, airlines have replaced smaller airplanes such as regional jets with larger single-aisle airplanes, helping to ease demand for takeoff and landing slots during peak periods. Creating secondary hubs and expanding service to secondary airports also can ease congestion at the busiest airports. Airline alliances have proven effective in allowing airlines to expand route systems without duplicating services that would add to congestion.
In sum, although airports and governmental air services agencies will need to continue investing in infrastructure improvements, and airlines will need to evolve strategic responses at some airports, congestion will not be a major limiting factor to commercial air traffic growth during the forecast period.
Total cargo tonnes (millions)5
4
3
2
1
0
Hon
g K
ong
(HK
G)
Mem
phi
s (M
EM
)
Sha
ngha
i (P
VG
)
Inch
eon
(ICN
)
Anc
hora
ge (A
NC
)
Dub
ai (D
XB
)
Loui
svill
e (S
DF)
Par
is (C
DG
)
Fran
kfur
t (FR
A)
Toky
o (N
RT
)
Total passengers (millions)
100
80
60
40
20
0
Atl
anta
(AT
L)
Bei
jing
(PE
K)
Lond
on
(LH
R)
Chi
cago
(OR
D)
Toky
o (H
ND
)
Los
Ang
eles
(LA
X)
Par
is (C
DG
)
Dal
las
(DFW
)
JA
KA
RTA
(CG
K)
DU
BA
I (D
XB)
Investment in
infrastructure is
key to growth
InfrastructureInfrastructure is crucial to growth
Infrastructure2012 busiest airports by passengers
Infrastructure2012 busiest airports by cargo
Source:ACI Preliminary
Ranking
Source:ACI Preliminary
Ranking
Market DevelopmentsInfrastructure

Current Market Outlook2013 –2032
9Copyright © 2013 Boeing. All rights reserved.
Limited competition with commercial aviationOur long-term forecast considers the impact that other technologies, including high-speed rail (HSR), have on air travel. In 2010, worldwide railways carried 45 percent less passenger traffic, but 45 times more cargo traffic than commercial aviation. The total distance covered by railway networks was just 2.5 percent that of the aviation network. Analysis shows that (1) railways are well suited for carrying passengers over relatively short distances (terrain permitting), whereas aviation excels for longer journeys; (2) railways are an efficient mode for overland cargo transport; and (3) aviation is very effective for creating large transportation networks without heavy investment in infrastructure.
It has been 50 years since Japan introduced the world’s first modern HSR service between Tokyo and Osaka. At the end of 2012, the world’s longest HSR line with 2,230 kilometers between Beijing and Guangzhou became fully operational. A total of about 10,000 kilometers of HSR is in operation in China, more than in the rest of the world combined. Altogether, HSR still accounts for less than 2 percent of the world’s railway lines.
Recent information from China confirms limited competitionOverall rail traffic growth (conventional plus HSR) in China has not changed significantly since the introduction of the first 350-km/hr HSR between Beijing and Tianjin in 2008. Growth in rail traffic remains slower than domestic air travel growth. The average distance per rail trip has also remained flat for the past few years. In other countries, average trip distance has typically increased after the introduction of new HSR lines. Of the roughly 1,350 domestic city pairs served by airlines in China, about 200 are on the HSR network. For markets with more than twice-daily service, only 17 have experienced more than a 25 percent reduction in capacity since 2009. Although airlines must adjust fares to compete with HSR, industry data shows that average airline fares on the busiest Beijing-to-Shanghai route have held up well since the 2011 HSR inauguration.
Intermodal strategiesHSR could compete with some airlines in high-volume, high-yield markets. Yet, the relatively short routes where HSR excels represent only a small portion of the market served by commercial aviation. Airline assets are highly flexible, because airplanes can be easily redeployed to more lucrative markets. In addition, the infrastructure investment for a comprehensive aviation network is much lower than for ground modes of transport. Aviation’s network connectivity simply cannot be replicated by ground-based modes. Opportunities to develop intermodal solutions can potentially combine the advantages of both HSR and aviation.
Passenger traffic (RPK, trillions)
AirRail
0 2 4 6 8 10
55%
0 2 4 6 8 10
Cargo traffic (RTK, trillions)
AirRail
Track/network (km, millions)
AirRail
0 10 20 30 40 50
45x
2.5%
High-speed railRail1 vs. air2
Sources:12010 UIC members22010 ICAO/Boeing
Source:CAAC Ministry
of Railways
High-speed railTop high-speed rail by country
High-speed rail in service(1,000 km, 3/2013)
0 2 4 6 8 10China
Spain
Japan
France
Italy
Germany
1,325
1,350
1,375
1,250
1,275
1,300
High-speed railImpact on China’s domestic aviation
• Rail • Air (domestic)
30%
10%
20%
0%
525
550
575
450
475
500
Year
-ove
r-ye
ar g
row
th (R
PK)
Ave
rage
sta
ge le
ngth
(k
ilom
eter
s)
2006Rail Air2008 2010 2012
Market DevelopmentsHigh-Speed Rail

Current Market Outlook2013 –2032
Current Market Outlook2013 –2032
10 Copyright © 2013 Boeing. All rights reserved.
Environmental challenges for the airplane marketFor both economic and environmental reasons, airline customers demand ever-increasing fuel efficiency. Boeing and the aviation industry have committed to ambitious carbon dioxide emissions targets to achieve carbon-neutral aviation growth beyond 2020 and halve net carbon emissions by 2050 (compared to 2005). Boeing is playing a leadership role in leveraging technology and innovation in support of the industry’s strategy by
• Improving the performance of current jetliners and introducing new airplanes, such as the 787 Dreamliner, 747-8, and 737 MAX, that are significantly more efficient than the airplanes they replace.
• Enabling greater operational efficiency through improved airline operations and advocating for modernization of the global air traffic management system infrastructure.
• Championing the commercialization of sustainable aviation fuels that produce better than 50 percent lower life-cycle carbon dioxide emissions than conventional fuels.
This long-term approach will enable the aviation industry to meet its environmental targets and retain its license to grow.
Sustainable aviation fuelsTwo aviation biofuels processes have already been approved for commercial use, and several more are on track for approval in the coming years. Already, conventional jet fuel blends with up to 50 percent biofuel derived from sources such as camelina, waste cooking oil, and algae have been used on more than 1,500 commercial flights. Increasing the availability of sustainable aviation fuel is a critical component of aviation’s strategy to reduce emissions. Meeting airline fuel demand at price points comparable to those of petroleum-based fuels requires continued investment and government policy support. Boeing will continue to be an industry catalyst and advocate in both arenas.
Airport environment and growthThe Current Market Outlook projects a near doubling of the commercial airplane fleet by 2032. This will require many constrained airports to increase capacity. In some regions of the world, particularly Europe, airport communities have expressed concerns about the environmental effects of increased operations and airport expansion. Finding the appropriate balance between growth and community concerns takes time and can slow or limit progress in a region’s capacity planning. The combination of new, cleaner, and quieter airplanes like the 787, and innovative operational procedures that take advantage of Required Navigational Performance (RNP) and other operational efficiency technologies, holds the potential to improve the environment around airports while enabling airports to sustain regional economic growth.
30
2008 2009 2010 2011 2012
20
25
15
20
5
10
0
2624
21
15
8
Sustainable Aviation Fuel Users Group growth
SAFUG represents ~ 32% of commercial aviation fuel demand
Early jet airplanes
New generationjet airplanes
Noise footprint based on 85 dBa
1950s 1990s
Rel
ativ
e fu
el u
se
No
ise
dB
Hig
her
Low
er
Mor
eLe
ss
90% Reduction in noise footprint
70% Fuel improvement and CO2 efficiency
EnvironmentAirline commitment to biofuels is growing
EnvironmentTrack record of significant progress
Environment2013
Reducing
environmental
impacts through
technology
improvements
Market DevelopmentsEnvironment

Current Market Outlook2013 –2032
11Copyright © 2013 Boeing. All rights reserved.
Industry growth amid economic uncertaintyBoeing’s business analysis includes extensive study of global geopolitical dynamics that influence commercial aviation. This research focuses on current events as well as long-term trends. The analysis helps to determine risk and opportunity in the commercial aviation market as a whole, and in specific regions around the world.
While recent global events, including regional political turmoil, energy price volatility, and debt crises, have dampened near-term global economic growth, over the longer term, global growth forecasts are nearing pre-crisis levels. As the effects of government support programs wind down, it will be important for governments to maintain pro-growth policies. With respect to trade policy, the pace of new protectionist measures has slowed. Any resurgence of protectionism could constrain economic growth, adversely affecting demand for air travel and new airplanes.
Level playing field and aviation liberalizationGovernment assistance for civil aircraft development remains a concern. Recent World Trade Organization rulings have made clear that such government support must be provided on commercial terms. In the area of export finance, with other nations ramping up their own export credit activity, the Export-Import Bank of the United States remains a vital contributor to the competitiveness of US exporters.
Liberalization of aviation services (“Open Skies”) stimulates competition, giving passengers more choices and generally reducing ticket prices, which in turn increases demand for air travel. While the aviation industry remains heavily regulated in many parts of the world, the pace of liberalization has been steady, led by the United States, which has concluded Open Skies agreements with nearly 110 partners, including major markets such as the European Union and Japan.
Infrastructure, security, and environment The Current Market Outlook projects that the global large commercial airplane fleet will nearly double by the year 2032. Such growth will require infrastructure investments, as initiatives to modernize air traffic management provide crucial enhancements to both system capacity and efficiency.
While significant improvements in aviation security have been made globally since 9/11, constant vigilance is still required. Security concerns will continue to affect commercial aviation operations.
The aviation industry is addressing environmental challenges with a three-pronged strategy of designing more efficient and safer aircraft, improving operational procedures, and developing sustainable biofuels. Boeing is working with governments around the world to support the industry’s emission-reduction goals. This approach will allow the industry to continue strong growth over the long term, despite anticipated regulatory constraints.
Global policy trendsNew trade restrictive measures by G-20 members
Global policy trends2013
A global business
needs a global
policy perspective
20
25
10
15
0
5
Rep
ort V
III
Rep
ort V
II
Rep
ort V
I
Rep
ort V
Rep
ort I
V
Rep
ort I
II
Rep
ort I
I
Rep
ort I
New protectionist measures by G-20 nations (monthly average)
Source: Reports on G-20 Trade and Investment Measures, April 2009-October 2012 (each report covers approximately five months).
Global policy trendsChina domestic frequencies
1992 2012
Total weekly 351 8,701ASKs* (millions)
Weekly 2,184 52,651frequencies
Total airport 199 1,208pairs
Airplane 148 150size (seats)
Domestic frequencies 24-fold since 1992.
2012 *Available seat-kilometers.
1992
Source: August OAG
Market DevelopmentsGlobal Policy Trends

Current Market Outlook2013 –2032
Current Market Outlook2013 –2032
12 Copyright © 2013 Boeing. All rights reserved.
Practical value for Boeing and the industryThe long-term forecast contained in Boeing’s Current Market Outlook guides product strategy and provides the basis for business plan development. We have shared the forecast with the public since 1964 to help airlines, suppliers, industry organizations, academia, and financiers make informed business decisions and benchmark other forecasts or analyses.
Air travel demand is resilientGlobal and regional economic cycles profoundly affect air travel demand, so it is essential to take the current phase of the economic cycle into account in developing the long-term forecast. Historically, declines in economic activity are often associated with unexpected events. The resilience of air travel demand depends on the nature of the event and the extent to which the event affects air travel, directly or indirectly. For example, events related to personal safety, such as pandemic, war, or threats against aircraft, have a greater effect than commercial or political events. Perturbations from the long-term demand trend are typically relatively short lived, lasting around 12 months. The role air travel plays in the fabric of society is key to its resilience. Air travel is an essential part of personal and business life for many travelers. The Internet, mobile connectivity, and social media are increasingly integrated into daily life, including how we research, discuss, plan, and book travel. At the same time, improved airplane technology and efficiency are allowing airlines to make air travel more affordable, so airfares generally represent a smaller portion of total trip costs.
Development process for air travel demand outlookOur air travel demand forecast is developed by constructing and matching top-down and bottom-up analyses. Bottom-up analysis involves forecasts of traffic between and within individual countries, based on economic predictions, growth momentum, historical trends, travel attractiveness, and projections of the relative openness of air services and domestic airline regulation. Additionally, government statistics on inbound and outbound visitors and tourism receipts are included to identify and cross-check trends. Countries are grouped into geographical regions that generate air traffic flows between and within the regions. In the top-down approach, global and regional markets are similarly projected on aggregated variables. The bottom-up and top-down projections are then reconciled, allowing for the effects of industry and airline business model developments. Further, positive or negative region-specific developments, including population dynamics, shifts toward or away from other modes of transport, and emergence of new air services, are factored in. The resulting regional traffic forecasts are used in developing the airplane demand forecast.
Methodology2013
MethodologyWorld passenger traffic growth vs. GDP
Sources:Traffic-ICAO/IATA
GDP-IMF (PPP)
-4-202468
10121416
-2-1012345678
Percent passenger airline traffic growth
Real GDP growth
1971 1976 1981 1986 1991 1996 2001 2006 2011
Long-term traffic growth
EXPLORE!
The methodology
behind the 2013
traffic outlook
MethodologyRelative liberalization and traffic
Europe – North AmericaIntra-North AmericaIntra-Europe
Europe – Africa
Intra-China
Intra-Southeast Asia North America – Northeast AsiaIntra-South America
Central America – North AmericaEurope – Middle East
Relative liberalization index More liberal
1000
100
10
10 1 2 3 4 5 6
Traf
fic
stim
ulat
ion
Methodology

Current Market Outlook2013 –2032
13Copyright © 2013 Boeing. All rights reserved.
Philosophy behind the forecastGrowth in air travel, measured in revenue passenger-kilometers (RPK), has historically outpaced economic growth, represented by GDP. At the global level, the relationship is
RPK (growth) = GDP (growth) + f(t)
where f(t) is a time-varying function that typically centers around 2 percent.
This leads us to conclude that, at the regional level, about 60 to 80 percent of air travel growth can be attributed to economic growth, which in turn is driven by trade. This conclusion is consistent with the observation that countries whose economies are tied to trade tend to have higher rates of air travel. Air travel revenues consistently average about 1 percent of GDP in countries around the world, regardless of the size of the national economy. Globally, air travel has consistently tended toward this historical share of GDP. With a few exceptions, most countries move toward the general trend over the long term. The time-varying function f(t) accounts for the 20 to 40 percent of air travel growth that is not directly associated with GDP growth. This component of growth derives from the value travelers place on the speed and convenience that only air travel can offer. For example, the value travelers place on choice of arrival and departure times, routings, nonstop flights, choice of carriers, service class, and fares stimulates increased aviation services.
Liberalization is the primary driver of value creation in the global air transport network, typically spurring a “bump” in traffic demand. Studies suggest that as the relative openness of a country’s bilateral air service rises from the 20th to the 70th percentile, the resulting increase in traffic can boost air travel demand by 30 percent. Often, improved air services directly and indirectly stimulate economic growth, creating a virtuous circle that leads to further air transport growth, which in turn leads to added economic growth, and so on. The percentage of air transport growth that comes from economic development compared to the percentage that comes from the value of air travel services is an indicator of the maturity of an air travel market. Although individual regions may exhibit signs of slowing due to maturing markets, other regions continue or begin to grow vigorously. Current global percentages do not indicate that the world aviation market is nearing maturity in aggregate.
MethodologyDrivers of air travel
MethodologyWorld airline revenues
Source:ICAO, IATA IHS Global
Insight nominal GDP
60%-80% 20%-40%
Traveldemand
Additionaltravel demand
Economicgrowth
Globaltrade
Valueof service
Safe,efficient,
competitiveindustry
Fuel Capability
Environment Infrastructure
Airlinestrategies
Marketevolution
Emergingmarkets
Marketliberalization
Percent of GDP
0.50%
0.75%
1.00%
1.25%
2013F20122009200620032000
MethodologyLevels of liberalization
Source:World Economic Forum
Travel & Tourism Report 2009
Level of liberalization
nnnRegulatory
nnnTransitional
nnLiberal
Methodology—continued

Current Market Outlook2013 –2032
Current Market Outlook2013 –2032
14 Copyright © 2013 Boeing. All rights reserved.
New airline business models and emerging economiesEach year, we begin our analysis for the Current Market Outlook by examining key industry indicators, including fuel, market liberalization, airline capabilities, airline strategies, emerging markets, economic growth, high-speed rail, and the environment. Worldwide economic activity is the most powerful driver of commercial air transport growth and the resulting demand for airplanes. The global gross domestic product (GDP) is projected to grow 3.2 percent per year for the next 20 years, driving both air passenger traffic and air cargo traffic to average 5.0 percent annual growth worldwide over the same period.
Global growth spurred by emerging economiesEmerging economies are projected to grow 5.2 percent per year over the next 20 years, outpacing established economies, which will average 2.1 percent growth. Emerging and developing economies will account for 60 percent of global growth between 2012 and 2032. Their share of real global GDP will increase from 31 percent to 45 percent over the same period. The fastest growing economies include Asia Pacific (projected 4.5 percent growth), Latin America (projected 4.0 percent growth), and the Middle East (projected 3.8 percent growth).
Household income will grow and consumption patterns will change as educated labor forces expand, investment in physical and social infrastructure increases, urbanization progresses, and the relative importance of economic sectors shifts within the world’s emerging economies. With urbanization, the labor force shifts toward the industrial and service sectors, which spurs median incomes to converge toward the income levels of developed economies. The emerging global middle class will expect to enjoy standards of living comparable to those in developed economies. As demand for international goods and services rises and leisure time increases, appetite for travel will grow.
Business models and airline strategiesThere is a need for 35,280 new airplanes, 41 percent of which will replace older airplanes and 59 percent will expand the fleet. Airline strategies and business models help determine the types of airplanes that airlines purchase and, consequently, the types of airplanes that manufacturers produce. Low-cost carriers drive the strong demand for new, efficient single-aisle airplanes. Their share of the market is expected to grow from 14 percent to 20 percent by 2032. International expansion of network carriers is driving demand for 8,590 new widebody airplanes, including 850 freighters, primarily large freighters such as the 747-8 Freighter and 777 Freighter.
Forecast indicatorsEmerging markets driving economic growth
Forecast indicatorsAnnual traffic growth
South Asia
China
Southeast Asia
Asia Pacific
Africa
Latin America
Middle East
CIS
World
Oceania
North America
Europe
Northeast Asia
Annual GDP growth 2012 to 2032
6.6
4.7
6.4
4
4.4
4.5
3.2
3.4
3.8
1.8
2.5
2.6
1.6
6.6
4.7
6.4
4.0
4.4
4.5
3.2
3.4
3.8
1.8
2.5
2.6
1.6
Growth 2012 to 2032
Within China
Within Asia Pacific incl. China
Within North America
North America – Latin America
North Atlantic
Middle East – Asia Pacific
Within/to CIS
Europe – Asia Pacific
Within Latin America
Africa – Europe
Europe – Latin America
Within Europe
Transpacific
6.9%
6.9%
2.3%
3.5%
5.5%
3.6%
7.3%
4.8%
6.5%
5.0%
4.8%
4.5%
4.7%
6.9%
6.9%
2.3%
3.5%
5.5%
3.6%
7.3%
4.8%
6.5%
5.0%
4.8%
4.5%
4.7%
Forecast indicatorsGrowth rates
2012 to 2032
4.1%
3.2%
5.0%
5.0%
4.1%
3.2%
Numberof airline
passengers
Airlinetraffic(RPK)
Cargo traffic(RTK)
Worldeconomy
(GDP)
Forecast Indicators
Current Market Outlook2013 –2032
15Copyright © 2013 Boeing. All rights reserved.
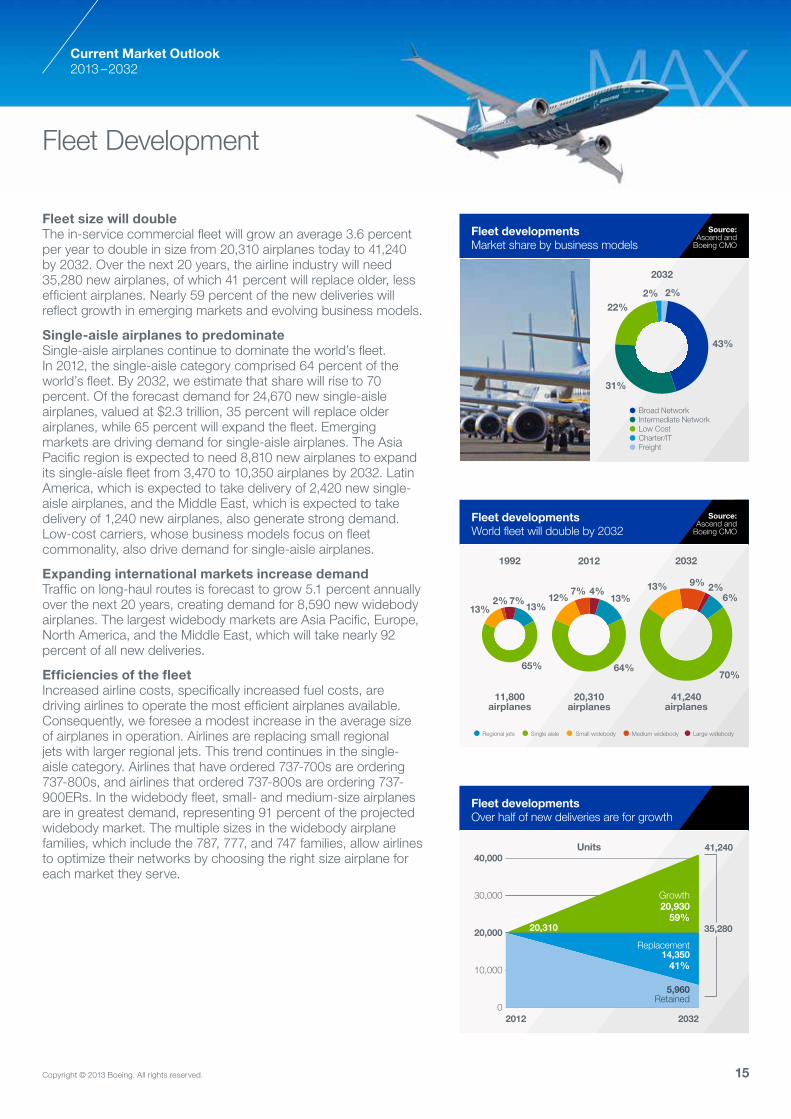
Fleet size will doubleThe in-service commercial fleet will grow an average 3.6 percent per year to double in size from 20,310 airplanes today to 41,240 by 2032. Over the next 20 years, the airline industry will need 35,280 new airplanes, of which 41 percent will replace older, less efficient airplanes. Nearly 59 percent of the new deliveries will reflect growth in emerging markets and evolving business models.
Single-aisle airplanes to predominateSingle-aisle airplanes continue to dominate the world’s fleet. In 2012, the single-aisle category comprised 64 percent of the world’s fleet. By 2032, we estimate that share will rise to 70 percent. Of the forecast demand for 24,670 new single-aisle airplanes, valued at $2.3 trillion, 35 percent will replace older airplanes, while 65 percent will expand the fleet. Emerging markets are driving demand for single-aisle airplanes. The Asia Pacific region is expected to need 8,810 new airplanes to expand its single-aisle fleet from 3,470 to 10,350 airplanes by 2032. Latin America, which is expected to take delivery of 2,420 new single-aisle airplanes, and the Middle East, which is expected to take delivery of 1,240 new airplanes, also generate strong demand. Low-cost carriers, whose business models focus on fleet commonality, also drive demand for single-aisle airplanes.
Expanding international markets increase demandTraffic on long-haul routes is forecast to grow 5.1 percent annually over the next 20 years, creating demand for 8,590 new widebody airplanes. The largest widebody markets are Asia Pacific, Europe, North America, and the Middle East, which will take nearly 92 percent of all new deliveries.
Efficiencies of the fleetIncreased airline costs, specifically increased fuel costs, are driving airlines to operate the most efficient airplanes available. Consequently, we foresee a modest increase in the average size of airplanes in operation. Airlines are replacing small regional jets with larger regional jets. This trend continues in the single-aisle category. Airlines that have ordered 737-700s are ordering 737-800s, and airlines that ordered 737-800s are ordering 737-900ERs. In the widebody fleet, small- and medium-size airplanes are in greatest demand, representing 91 percent of the projected widebody market. The multiple sizes in the widebody airplane families, which include the 787, 777, and 747 families, allow airlines to optimize their networks by choosing the right size airplane for each market they serve.
Fleet developmentsWorld fleet will double by 2032
• Regional jets • Single aisle • Small widebody • Medium widebody • Large widebody
6%2%9%
64%70%
4%7%7% 12%
65%
13%13%2%
13% 13%
41,240airplanes
20,310airplanes
11,800airplanes
203220121992
Source:Ascend and
Boeing CMO
Fleet developmentsOver half of new deliveries are for growth
40,000
30,000
20,000
10,000
0
41,240
35,280
20322012
Growth20,930
59%
Replacement14,350
41%
5,960Retained
Units
20,310
Fleet developmentsMarket share by business models
2032
2%2%22%
31%
43%
• Broad Network
• Intermediate Network
• Low Cost
• Charter/IT
• Freight
Source:Ascend and
Boeing CMO
Fleet Development

Current Market Outlook2013 –2032
Current Market Outlook2013 –2032
16 Copyright © 2013 Boeing. All rights reserved.
Single-aisle airplanes remain pivotalOver the next 20 years, we project that 24,670 single-aisle airplanes will be delivered, representing 70 percent of commercial airplane deliveries and 47 percent of total delivery value. Typically used for shorter distance travel, single-aisle airplanes are a flexible asset that airlines use both within regions and to connect adjacent regions. Demand for single-aisle airplanes will continue to be high in emerging economies where passenger traffic is growing and markets are liberalizing. Asia Pacific will receive 36 percent of the new single-aisle airplanes, while Europe and North America take 23 percent and 20 percent, respectively. In the mature markets, roughly half of new single-aisle airplanes will replace aging airplanes. As new 737 MAX and A320neo airplanes enter service, fleet fuel efficiency will improve and the more capable airplanes will be able to serve new, longer markets. Passengers will especially appreciate the new interior already available on the 737 for these longer flights.
International traffic creates small and medium widebody demandThe small and medium widebody airplane category is the highest valued market segment of the forecast. Accounting for 22 percent of forecast deliveries, the category represents 45 percent of the total world airplane delivery value at US$2.2 trillion over the next 20 years. This product category is also the most dynamic, with deliveries of the Boeing 787 Dreamliner increasing, introduction of the Airbus A350 pending, and development of even more fuel-efficient mid-sized airplanes anticipated. These products allow airlines to create new, economical, point-to-point international services and give airlines flexibility to complement existing Boeing 787 and 777 and Airbus A330 service. Over the next 20 years, the vast majority of these airplanes currently flying will be retired. By 2032, about 87 percent of the small and medium widebody airplanes in operation will have been delivered since 2012.
Demand for large airplanes focused in key regionsAsia Pacific, Europe, and the Middle East account for more than 90 percent of large-airplane demand in the 20-year forecast. These airplanes will serve as passenger jetliners on high-traffic trunk routes, as well as dedicated commercial freighters. The forecast 760 deliveries comprise 6 percent of total delivery value. The Asia Pacific region will receive 34 percent of these deliveries, while Europe will take 22 percent and the Middle East will take 37 percent. Although their share of long-haul traffic will diminish over the next 20 years, large airplanes remain an important part of the commercial airline fleet.
New airplanes85% of fleet will be new by 2032
100%
75%
50%
25%
0%
85% New Airplanes
15% Remaining Airplanes
New airplanesMarket value: $4.8 trillion
0
500
1,000
1,500
2,000
2,500
Regionaljets2%
$80
Singleaisle
47%
$2,290
Small widebody
23%
$1,100
Medium widebody
22%
$1,090
Large widebody
6%
Market valuein billions
Delivery units
3%4%8%
7%
21%
21%
36%
2013 to 2032New airplanes
35,280
New airplanesDeliveries by region
NewRegion airplanes
• Asia Pacific 12,820
• Europe 7,460
• North America 7,250
• Middle East 2,610
• Latin America 2,900
• CIS 1,170
• Africa 1,070
Total 35,280
$280
New Airplanes

Current Market Outlook2013 –2032
17Copyright © 2013 Boeing. All rights reserved.
Remarkable air cargo traffic stabilityDespite an unusually challenging environment over the past several years, air cargo remains indispensable for a variety of industries that require transport of time-sensitive commodities. These commodities include perishables; high-value, low-weight goods including consumer electronics; high-fashion apparel; pharmaceuticals; industrial machinery; and high-value intermediate goods such as auto parts. The speed and punctuality advantages of air freight ensure that it will continue to play a significant role in the global economy.
Both dedicated freighters and passenger airplane lower holds carry air cargo. Cargo capacity on passenger flights has been expanding as airlines deploy new jetliners, such as the 777-300ER, that have excellent cargo capability. Dedicated freight services, however, offer shippers a combination of reliability, predictability, and control over timing and routing that lower-hold cargo operations can’t often match. Thus, freighters consistently account for roughly 60 percent of global air cargo traffic.
Air cargo traffic, as measured in revenue tonne-kilometers (RTK), is projected to average 5.0 percent growth per year over the next 20 years, as global GDP and world trade return toward historic growth rates. Replacement of aging airplanes, plus the industry’s growth requirements, will create a demand for 2,300 freighter deliveries over the same period. About 1,450 of these will be passenger airplane conversions. The remaining 850 airplanes, valued at $240 billion, will be new. The freighter fleet will increase by more than half, from 1,730 airplanes in 2012 to 2,810 in 2032.
All standard-body freighters will be conversionsBoeing forecasts a requirement for 940 standard-body freighters, all passenger conversions, which are attractive for standard- body operations due to their low capital cost. Demand will be especially strong in emerging markets.
Express carriers drive medium widebody demandAbout one-third of the 590 medium widebody freighters delivered during the forecast period will be new purpose-built freighters. This freighter market is driven by express carriers that mitigate the lower economic efficiency of medium widebodies with higher yields. Competition from less expensive surface transport and passenger airplane lower-hold capacity constrains the use of medium widebody freighters in regional markets.
Intercontinental operations favor new, large freightersThe performance, efficiency, and reliability of new, purpose- built freighters outweigh the lower purchase prices for converted large freighters, especially for intercontinental operations, where high cargo density, larger payloads, and extended range are crucial. Thus, of the 770 large freighter deliveries, more than 80 percent will be new airplanes.
Air Cargo Market
2013 to 2032Freighters 2,300
Share of fleet
0%380 210
25%
64050%
75% 940
100% 130
20322012
Delivery units
Air cargo market850 new and 1,450 converted
• Large >80 tonnes
• Medium 40 to 80 tonnes
• Standard <80 tonnes
• Converted
Air cargo marketAnnual growth: 5.4% since 1982
• Annual change
1982
1990
2000
2012
• Annual RTKs
250
200
150
100
50
0
20%
15%
5%
10%
0%
-10%
-5%
-15%
Annual growth Annual RTKs (billions)
Market value(in billions)
$40Medium40 to 80tonnes
$200Large
More than80 tonnes
Air cargo marketMarket value: $240 billion
250
50
0
200
100
150
17%
83%

Current Market Outlook2013 –2032
Current Market Outlook2013 –2032
18 Copyright © 2013 Boeing. All rights reserved.
MiddleEast
Europe
LatinAmerica
Asia Pacific
CISNorth America
Africa
World regionsMarket value: $4,840 billion
Delivery units
6%2%9%
13%
70%
2013 to 2032New airplanes
35,280
100%
0%
75%
50%
25%
Share of fleet
2032Airplanes41,240
2012Airplanes
20,310
New Share airplanes by sizeLarge widebody 760 2%Medium widebody 3,300 9%Small widebody 4,530 13%Single aisle 24,670 70%Regional jets 2,020 6%Total 35,280
2012 2032 Fleet FleetLarge widebody 780 910Medium widebody 1,520 3,610Small widebody 2,310 5,410Single aisle 13,040 29,130Regional jets 2,660 2,180Total 20,310 41,240
Growth measuresEconomy (GDP) 3.2%Traffic (RPK) 5.0%Cargo (RTK) 5.0%Airplane fleet 3.6%
MarketsizeDeliveries 35,280Market value $4,840BAverage value $140M
World regionsKey indicators and new airplane markets
• Regional jets • Single aisle • Small widebody • Medium widebody • Large widebody
World regionsNew airplane market by region
Globalized demandAs aviation continues to become an integral part of life, it is bringing people closer together. As emerging markets continue to grow and new business models expand, airplane manufacturers are seeing greater geographical diversity in their customer base. In 1992, more than 70 percent of all traffic was carried by airlines in Europe or North America. By 2032, that proportion will shrink to 39 percent. Asia Pacific and Middle East airlines are becoming prominent in global aviation. The low-cost business model is becoming a viable option in emerging markets, offering consumers access to a wider range of destinations and the opportunity to choose the speed and convenience of flying over traditional modes of transportation. In addition, modern twin-aisle airplanes enable smaller operators in developing economies to compete on longer routes traditionally dominated by foreign carriers. Rapidly evolving aviation services in these regions are broadening the geographical balance of airplane demand, spurring a worldwide requirement for 35,280 new jet airplanes, of which 24,670 will be single aisle.
Regional focusDifferent regions will still have varying conditions with specialized requirements. Middle Eastern airlines will still favor twin-aisle airplanes and premium passenger services to take advantage of the area’s centrality and prominence in business travel. European and North American airlines respond to growing competition from low-cost carriers by replacing older, fuel inefficient airplanes with larger, more economical single-aisle models. In Asia, rising demand across the board will require a mix of single- and twin-aisle airplanes.
All regions will face similar challenges of fuel price volatility, emission control regimes, and ever-increasing airport congestion as the growing world fleet tries to keep pace with swelling international and local demand for air travel.
World Regions
Current Market Outlook2013 –2032Current Market Outlook2013 –2032
19Copyright © 2013 Boeing. All rights reserved.
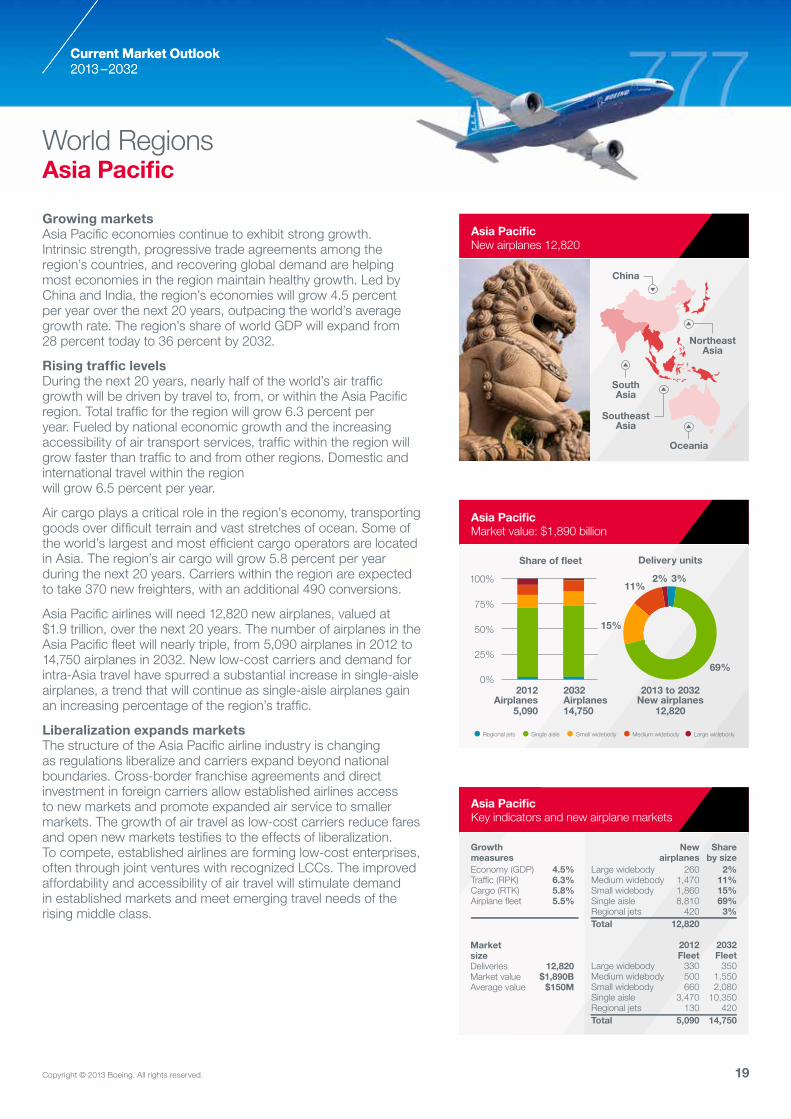
Growing marketsAsia Pacific economies continue to exhibit strong growth. Intrinsic strength, progressive trade agreements among the region’s countries, and recovering global demand are helping most economies in the region maintain healthy growth. Led by China and India, the region’s economies will grow 4.5 percent per year over the next 20 years, outpacing the world’s average growth rate. The region’s share of world GDP will expand from 28 percent today to 36 percent by 2032.
Rising traffic levelsDuring the next 20 years, nearly half of the world’s air traffic growth will be driven by travel to, from, or within the Asia Pacific region. Total traffic for the region will grow 6.3 percent per year. Fueled by national economic growth and the increasing accessibility of air transport services, traffic within the region will grow faster than traffic to and from other regions. Domestic and international travel within the region will grow 6.5 percent per year.
Air cargo plays a critical role in the region’s economy, transporting goods over difficult terrain and vast stretches of ocean. Some of the world’s largest and most efficient cargo operators are located in Asia. The region’s air cargo will grow 5.8 percent per year during the next 20 years. Carriers within the region are expected to take 370 new freighters, with an additional 490 conversions.
Asia Pacific airlines will need 12,820 new airplanes, valued at $1.9 trillion, over the next 20 years. The number of airplanes in the Asia Pacific fleet will nearly triple, from 5,090 airplanes in 2012 to 14,750 airplanes in 2032. New low-cost carriers and demand for intra-Asia travel have spurred a substantial increase in single-aisle airplanes, a trend that will continue as single-aisle airplanes gain an increasing percentage of the region’s traffic.
Liberalization expands marketsThe structure of the Asia Pacific airline industry is changing as regulations liberalize and carriers expand beyond national boundaries. Cross-border franchise agreements and direct investment in foreign carriers allow established airlines access to new markets and promote expanded air service to smaller markets. The growth of air travel as low-cost carriers reduce fares and open new markets testifies to the effects of liberalization. To compete, established airlines are forming low-cost enterprises, often through joint ventures with recognized LCCs. The improved affordability and accessibility of air travel will stimulate demand in established markets and meet emerging travel needs of the rising middle class.
World RegionsAsia Pacific
Asia PacificKey indicators and new airplane markets
Asia PacificMarket value: $1,890 billion
Asia PacificNew airplanes 12,820
2013 to 2032New airplanes
12,820
2012Airplanes
5,090
Delivery units
2% 3%11%
15%
69%
100%
0%
75%
50%
25%
Share of fleet
2032Airplanes14,750
• Regional jets • Single aisle • Small widebody • Medium widebody • Large widebody
New Share airplanes by sizeLarge widebody 260 2%Medium widebody 1,470 11%Small widebody 1,860 15%Single aisle 8,810 69%Regional jets 420 3%Total 12,820
2012 2032 Fleet FleetLarge widebody 330 350Medium widebody 500 1,550Small widebody 660 2,080Single aisle 3,470 10,350Regional jets 130 420Total 5,090 14,750
Growth measuresEconomy (GDP) 4.5%Traffic (RPK) 6.3%Cargo (RTK) 5.8%Airplane fleet 5.5%
MarketsizeDeliveries 12,820Market value $1,890BAverage value $150M
NortheastAsia
Oceania
SouthAsia
China
SoutheastAsia

Current Market Outlook2013 –2032
Current Market Outlook2013 –2032
20 Copyright © 2013 Boeing. All rights reserved.
Regional leaderChina continues to lead the Asia Pacific region in new deliveries. Over the next 20 years, Chinese airlines will need nearly 6,000 new airplanes, valued at $780 billion, accounting for more than 40 percent of forecast deliveries to the Asia Pacific region.
Continued growthWith GDP forecast to rise 6.4 percent per year over the next 20 years, China’s share of the total world GDP is expected to grow from 8.5 percent today to 16 percent by 2032. As Chinese incomes converge toward those in the historical industrialized nations, an expanding middle class will expect to enjoy a comparable standard of living and consumption patterns.
Air traffic continues to be robust. In 2012, traffic to, from, and within China increased 10.6 percent, according to the CAAC. Domestic traffic accounted for 78 percent of the total, international for 20 percent, and the remaining 2 percent was to Hong Kong, Macau, and Taiwan. Over the next 20 years, international travel will grow faster than domestic travel, increasing at an annual rate of 7.2 percent, compared to 6.8 percent for domestic travel.
China’s airports are rising in rank for total enplanements and deplanements, with Beijing at number 2 in the world, Hong Kong at 10, Guangzhou at 19, and Shanghai at 20. Hong Kong ranked as the number 1 cargo airport in terms of metric tonnes, with Shanghai at 3, Beijing at 14, and Guangzhou at 21.
Airplane demandAs in other parts of the world, single-aisle airplanes, such as the 737-800 and new 737 MAX 8, are the mainstay of the Chinese fleet and will continue to be over time. Today there are more than 1,650 single-aisle airplanes in service and a backlog of nearly 700 airplanes with airlines and lessors. Going forward, China will need 3,900 new airplanes, with single-aisle airplanes accounting for 70 percent of new deliveries.
With the fast growth in international travel, airlines in the region will need 1,440 new widebody airplanes. The number of new international long-haul markets has increased 135 percent over the past 10 years, with eight new markets opened in 2012 alone. Airlines continue to look for opportunities to expand their networks as international flying increases from secondary cities apart from Beijing, Shanghai, and Guangzhou. Long-haul service currently operates from Chengdu, Hangzhou, Xiamen, Chongqing, Sanya, Nanjing, and Shenyang, with the growth trend expected to continue.
World RegionsChina
• Domestic • International
ChinaRapid expansion on international routes
Rev
enue
pas
seng
er-k
ilom
eter
s
2012 2022 2032
2,400
2,000
1,600
1,200
800
400
0
2012-2032 International growth 7.2%
2012-2022 International growth 8.6%
Delivery units
2013 to 2032New airplanes
5,580
100%
0%
75%
50%
25%
Share of fleet
2012Airplanes
2,100
Delivery units
2% 4%11%
13%
70%
100%
0%
75%
50%
25%
Share of fleet
2032Airplanes6,450
• Regional jets • Single aisle • Small widebody • Medium widebody • Large widebody
ChinaMarket value: $780 billion
ChinaKey indicators and new airplane markets
New Share airplanes by sizeLarge widebody 100 2%Medium widebody 610 11%Small widebody 730 13%Single aisle 3,900 70%Regional jets 240 4%Total 5,580
2012 2032 Fleet FleetLarge widebody 80 120Medium widebody 120 630Small widebody 190 830Single aisle 1,650 4,630 Regional jets 60 240Total 2,100 6,450
Growth measuresEconomy (GDP) 6.4%Traffic (RPK) 6.9%Cargo (RTK) 6.9%Airplane fleet 5.8%
MarketsizeDeliveries 5,580Market value $780BAverage value $140M

Current Market Outlook2013 –2032
21Copyright © 2013 Boeing. All rights reserved.
Modest economic growthThis year, our definition of the Northeast Asia region encompasses Taiwan, Japan, and North and South Korea. Consequently, the economic base for our analysis is larger and the region’s economic growth appears slightly higher than in previous outlooks. Northeast Asia’s gross domestic product is forecast to grow 1.6 percent annually over the next 20 years. Japan’s economy is forecast to grow as it recovers from the economic challenges of the last decade, although low birth rates and a declining working-age population will moderate growth in the long term. Japan remains the dominant economy of the region, but South Korea and Taiwan provide one-quarter of the base and one-half of the projected economic growth over the forecast period.
Northeast Asia’s air capacity grew substantially in the 1990s, but slowed during the past decade as a result of a series of economic disruptions. Northeast Asia countries are concluding trade agreements, reducing travel barriers, and considering infrastructure changes to spur domestic and inbound travel in response to growth in the economy and air travel between neighboring nations.
Easing operating restrictionsNortheast Asia’s air travel is forecast to grow 3.1 percent annually over the next 20 years. In particular, several developments will boost air travel in Taiwan, including a recent Open Skies agreement with Japan, inclusion in the US Visa Waiver Program, and continued easing of cross-strait travel restrictions to mainland China.
Expanded operations agreements by Northeast Asia nations with the United States, Europe, the Middle East, and fast-growing neighboring nations are encouraging expansion of services and the opening of new markets. Airport capacity will continue to increase, particularly at Tokyo’s Haneda and Narita airports. Improved market access, increased trade, liberalization, airport development, amplified competition, and expanded low-cost service to, from, and within Northeast Asia will nurture continued air travel growth.
Fleet modernization continuesNetwork carriers in Northeast Asia are renewing fleets, forming joint ventures, and introducing new products. Airlines in Japan, Taiwan, and South Korea continue to modernize their fleets and grow their international networks, creating a need for 1,360 new airplanes over the next 20 years.
The number of regional jets, including the anticipated Mitsubishi MRJ, is forecast to grow modestly. Single-aisle airplanes will account for 42 percent of new deliveries. New small and medium widebody airplanes will account for 48 percent of new deliveries, while the number of large airplanes will remain relatively constant.
World RegionsNortheast Asia
3.3%
Northeast AsiaEconomic growth
Source:IHS Global Insights
Dec. 2012
2,0000 4,000 6,000
Real GDP levels(2005 USD in billions)
Japan 1.1%
2.7%
3.3%
2.6%
SouthKorea
Taiwan
NorthKorea
20-yeargrowth
• 2012 GDP
• Added GDP 2013-2032
Delivery units
2013 to 2032New airplanes
1,360
100%
0%
75%
50%
25%
Share of fleet
2012Airplanes
920
Delivery units
6% 4%
26%
22%
42%
100%
0%
75%
50%
25%
Share of fleet
2032Airplanes1,530
• Regional jets • Single aisle • Small widebody • Medium widebody • Large widebody
Northeast AsiaMarket value: $280 billion
New Share airplanes by sizeLarge widebody 90 7%Medium widebody 350 26%Small widebody 300 22%Single aisle 570 42%Regional jets 50 4%Total 1,360
2012 2032 Fleet FleetLarge widebody 120 140Medium widebody 170 370Small widebody 230 360Single aisle 360 610 Regional jets 40 50Total 920 1,530
Growth measuresEconomy (GDP) 1.6%Traffic (RPK) 3.1%Cargo (RTK) 4.8%Airplane fleet 2.6%
MarketsizeDeliveries 1,360Market value $280BAverage value $210M
Northeast AsiaKey indicators and new airplane markets

Current Market Outlook2013 –2032
Current Market Outlook2013 –2032
22 Copyright © 2013 Boeing. All rights reserved.
Robust traffic growthSouth Asian air travel is expected to grow 8.6 percent per year over the next 20 years. Domestic travel, and travel between South Asia, the Middle East, and Southeast Asia, will account for the largest flows.
South Asia’s demographics are highly favorable to the growth of air transportation. The region has a large population (totaling 1.7 billion people in 2012), and the share of this population entering the workforce is growing. The region’s real GDP is forecast to grow an average 6.6 percent per year between 2012 and 2032, by the end of which period, India could have the world’s fourth-largest economy if current trends toward economic policy liberalization, market reform, and investment continue.
Consolidation and new alliesHaving suffered large financial losses in recent years, Indian airlines moved toward more sound financial footing in 2013, with Kingfisher’s suspension of operations hailed as an opportunity for the surviving airlines to gain market share and raise fares.
Reform of foreign direct investment rules allowed foreign airlines to acquire up to 49 percent of an Indian airline, which quickly led Abu Dhabi’s Etihad Airways to acquire 24 percent of Jet Airways. This will provide much-needed funds for the Indian carrier and will have far-reaching implications for its network as traffic is shifted toward Abu Dhabi and away from other connecting airports. A new scissor-hub operation in the UAE is widely expected. This equity partnership continues to make its way through the Indian government agencies, having secured approval from some, while awaiting approval from others.
Also in 2013, AirAsia announced that it would partner with the Tata Group to launch a new low-cost airline. AirAsia would own 49 percent of the proposed airline, with Indian companies, the Tata Group and Telestra Tradeplace, controlling 51 percent of the venture. The new low-cost airline will mark the return of the Tata Group to the airline industry, some 60 years after the 1953 nationalization of Air India.
World RegionsSouth Asia
South AsiaSouth Asian travel varies by market
• 2012
• Traffic added, 2013-2032
chi‐swa
others
1000 200 300 400
Annual RPK(billions)
CAGR
swa-swa
mid-swa
eur‐swa
sea‐swa
nam‐swa
9.6%
7.5%
7.2%
8.4%
7.9%
8.9%
7.7%
Delivery units
2013 to 2032New airplanes
1,790
100%
0%
75%
50%
25%
Share of fleet
2012Airplanes
450
Delivery units
2%9%
8%
81%
100%
0%
75%
50%
25%
Share of fleet
2032Airplanes2,060
• Regional jets • Single aisle • Small widebody • Medium widebody • Large widebody
South AsiaMarket value: $240 billion
South AsiaKey indicators and new airplane markets
New Share airplanes by sizeLarge widebody - -Medium widebody 170 9%Small widebody 140 8%Single aisle 1,450 81%Regional jets 30 2%Total 1,790
2012 2032 Fleet FleetLarge widebody 10 -Medium widebody 50 180Small widebody 50 170Single aisle 340 1,680 Regional jets - 30Total 450 2,060
Growth measuresEconomy (GDP) 6.6%Traffic (RPK) 8.6%Cargo (RTK) 7.0%Airplane fleet 7.9%
MarketsizeDeliveries 1,790Market value $240BAverage value $130M

Current Market Outlook2013 –2032
23Copyright © 2013 Boeing. All rights reserved.
Airlines expand operationsSoutheast Asia’s airlines are growing rapidly as the region continues to develop economically. Low-cost carriers are expanding and gaining market share, stimulating passenger demand with attractive fares and new routes. Network carriers have restructured, both operationally and financially, for growth and increased competitiveness, some launching subsidiaries or partnering with low-cost airlines to expand their product offering in the quickly developing marketplace. The heightened competition has increased the availability and affordability of air travel within the region.
Regional markets will continue to grow rapidly as the Association of Southeast Asian Nations (ASEAN) strengthens ties for business and leisure travel. Travelers are increasingly likely to include multiple stops on their itineraries as low fares and integration of regional networks make this more attractive. Southeast Asian airlines have dramatically increased their orders for new airplanes to meet growing demand and open new, direct, long-range markets. In fact, more than half of the region’s forecast 2,160 single-aisle airplane deliveries over the next 20 years are already on order. New, efficient airplanes with improved capabilities and lower operating costs are integral to carriers’ business strategies.
Liberalization opens routesRegulatory changes and infrastructure improvements are crucial to air travel expansion. Relaxation of market regulations among ASEAN countries has removed many traditional barriers to growth. Flights among ASEAN capital cities have also increased, marking an intermediate step in the path to a unified regional aviation market. Several carriers are aggressively expanding into new markets by acquiring or partnering with other carriers in Southeast Asia and surrounding regions. Governments and airport authorities in the region are eager to expand their aviation infrastructures and capitalize on increased trade and tourism.
Airlines bolster economic growthThe economic relationships and collaboration among the region’s countries continue to strengthen. Air transportation plays a vital role in the region’s projected above-average 4.9 percent annual GDP growth over 10 years. For example, affordable air travel options have spurred growth throughout the region’s services sector, including tourism and financial services. The region’s strong air cargo operations enable efficient shipment of manufactured goods. Overall, air travel to, from, and within the region is projected to grow at an average annual rate of 6.7 percent over the next 20 years, led by 7.5 percent annual growth in the intraregional sector. About 70 percent of new airplane deliveries will be single-aisle airplanes to serve markets within the region.
World RegionsSoutheast Asia
New Share airplanes by sizeLarge widebody 50 2%Medium widebody 290 9%Small widebody 490 16%Single aisle 2,160 70%Regional jets 90 3%Total 3,080
2012 2032 Fleet FleetLarge widebody 80 60Medium widebody 140 310Small widebody 120 500Single aisle 750 2,530 Regional jets 20 90Total 1,110 3,490
Southeast AsiaKey indicators and new airplane markets
Delivery units
2013 to 2032New airplanes
3,080
100%
0%
75%
50%
25%
Share of fleet
2012Airplanes
1,110
Delivery units
2% 3%9%
16%
70%
100%
0%
75%
50%
25%
Share of fleet
2032Airplanes3,490
• Regional jets • Single aisle • Small widebody • Medium widebody • Large widebody
Growth measuresEconomy (GDP) 4.7%Traffic (RPK) 6.7%Cargo (RTK) 5.2%Airplane fleet 5.9%
MarketsizeDeliveries 3,080Market value $450BAverage value $150M
Southeast AsiaMarket value: $450 billion
Southeast AsiaBacklog 1.5 times larger than fleet
BacklogCurrentFleet
1,800
1,200
600
0
• Regional jets • Single aisle • Small widebody
• Medium widebody • Large widebody
Source:Flight Global Ascend
online database(July 2013) and CMO

Current Market Outlook2013 –2032
Current Market Outlook2013 –2032
24 Copyright © 2013 Boeing. All rights reserved.
A thriving marketOceania is a dynamic region of roughly 40 million people. Total air traffic is forecast to continue to grow at the current annual rate of 4.8 percent over the next 20 years as connections to the neighboring Asia Pacific region and other world regions improve. Traffic growth within Oceania will slightly lag the overall rate at 4.4 percent. Capacity between Oceania and Southeast Asia, the primary gateway to other world regions, is forecast to increase 5.0 percent per year. In addition, continued expansion of trade and tourism will spur the opening of more flights and new markets to North America, the Middle East, and China. Middle East airlines, bridging Oceania to Europe and Africa via stops in the Middle East, are forecast to spur 7.0 percent growth of Middle East flow. Traffic between China and Oceania will grow at a robust 6.5 percent.
The region’s airlines continue to evolveAirlines within Oceania continue to evolve in response to economic conditions and competition. Qantas introduced its own LCC, Jetstar, to counter increasing LCC competition in Oceania and has extended that model throughout Asia with franchises in Japan and Hong Kong. Recently Qantas entered a 10-year partnership with Emirates to collaborate on routes, pricing, scheduling, and other important aspects of operations. Virgin Australia acquired a major share of tigerair Australia. Etihad Airways, Singapore Airlines, and Air New Zealand acquired ownership shares of Virgin Australia. The first 787s in the region will arrive at Jetstar in the second half of 2013.
New airplanes are needed in the regionAs traffic increases and airlines evolve, there will be a continued need for new airplanes in the region. Over the next 20 years, Oceania is expected to need 1,010 new airplanes to be delivered, of which 730 will be single-aisle airplanes needed to transport people within the region or to nearby Southeast Asia. To meet demand for travel across the globe, 270 widebody airplanes will be required, of which approximately 200 will be small widebodies, 50 will be medium widebodies, and 20 will be large widebodies.
World RegionsOceania
5.0%
3.4% 4.3%
5.8%
4.6%
OceaniaStrong annual capacity growth on traffic flows
Delivery units
2013 to 2032New airplanes
1,010
100%
0%
75%
50%
25%
Share of fleet
2012Airplanes
510
Delivery units
2%1%5%
20%
72%
100%
0%
75%
50%
25%
Share of fleet
2032Airplanes1,220
• Regional jets • Single aisle • Small widebody • Medium widebody • Large widebody
New Share airplanes by sizeLarge widebody 20 2%Medium widebody 50 5%Small widebody 200 20%Single aisle 730 72%Regional jets 10 1%Total 1,010
2012 2032 Fleet FleetLarge widebody 40 30Medium widebody 20 60Small widebody 70 220Single aisle 370 900 Regional jets 10 10Total 510 1,220
Growth measuresEconomy (GDP) 2.6%Traffic (RPK) 4.8%Cargo (RTK) 5.2%Airplane fleet 4.5%
MarketsizeDeliveries 1,010Market value $140BAverage value $140M
OceaniaKey indicators and new airplane markets
OceaniaMarket value: $140 billion
5.1%
6.5%
7.0%

Current Market Outlook2013 –2032
25Copyright © 2013 Boeing. All rights reserved.
The US airline industry continues to restructureThe US airline industry continues to evolve into a financially stable industry due to the merger activity and resulting capacity and fleet rationalization that have occurred over the past five years. The fourth and final legacy airline merger between American Airlines and US Airways is pending government approval. If the merger is approved, further capacity rationalization is expected. In the interim, airline consolidation continues as Southwest integrates AirTran into its system, and United and Continental continue to merge their operations. Once the American-US Airways merger has been consummated, the four largest US airline operators will dominate other domestic competitors with at least 80 percent of available capacity.
Low-cost carriers lead capacity growthFor the fourth consecutive year, the US commercial airline industry has posted an increase in traffic growth, as measured by revenue passenger-miles (RPMs). Total RPMs flown by the network and low-cost carriers grew 1 percent in 2012 compared to the previous year. The low-cost carriers posted a year-over-year capacity increase of 4 percent while capacity for the legacy carriers was flat. The average annual load factor of 83 percent for the US carriers was an increase of half a percentage point from 2011.
Financial results for US airlines continue to show improvement as the industry restructures. Excluding American Airlines, which was engaged in corporate restructuring, the US airline industry had a net profit of US$1.9 billion for the year. Net margins, however, averaged slightly above 1 percent. With jet fuel representing between 35 and 40 percent of operating expenses, the airline industry will continue to focus on revenue growth and cost reductions to further improve financial performance that is necessary to fund future capital investment.
Passenger traffic to slightly outpace GDP growthLong-term moderate capacity growth, renewed focus on financial returns, ongoing investment in the fleet, and further product and technological enhancements are expected as US airline industry restructuring continues. North American passenger traffic growth will slightly outpace GDP and grow at an annual rate of 2.7 percent over the next 20 years. Both GDP and traffic were revised downward slightly from the previous year’s forecast due to the expectation of a long-term US economic recovery. Cargo revenue ton-mile projections were also revised downward to 3.8 percent per year compared to the previous forecast of 4.5 percent as the air freight industry undergoes its own fleet and capacity rationalization.
North AmericaGrowth of 2,200 aircraft by 2032
Aircraft requirements
• Totalfleet2032
• In servicefleet2012
10,000
5,000
0
• Replaced
• Retained
• Grow
6,59
0
8,81
0
North AmericaMarket Value: $810 billion
Delivery units
2013 to 2032New airplanes
7,250
100%
0%
75%
50%
25%
Share of fleet
2012Airplanes
6,590
Delivery units
69%
100%
0%
75%
50%
25%
Share of fleet
2032Airplanes8,810
• Regional jets • Single aisle • Small widebody • Medium widebody • Large widebody
1%15%
5%
10%
North AmericaKey indicators and new airplane markets
New Share airplanes by sizeLarge widebody 30 >1%Medium widebody 390 5%Small widebody 760 10%Single aisle 5,000 69%Regional jets 1,070 15%Total 7,250
2012 2032 Fleet FleetLarge widebody 120 60Medium widebody 290 500Small widebody 710 1,040Single aisle 3,760 6,140 Regional jets 1,710 1,070Total 6,590 8,810
Growth measuresEconomy (GDP) 2.5%Traffic (RPK) 2.7%Cargo (RTK) 3.8%Airplane fleet 1.5%
MarketsizeDeliveries 7,250Market value $810BAverage value $110M
World RegionsNorth America

Current Market Outlook2013 –2032
Current Market Outlook2013 –2032
26 Copyright © 2013 Boeing. All rights reserved.
Strength despite uncertaintyThe European aviation market remained strong in 2012, despite uncertainties from the sovereign debt crisis and recessions in some economies. Europe’s GDP was flat in 2012 and is forecast to grow by 1.8 percent annually through 2032. The Association of European Airlines reports that member airlines carried 1.5 percent more passengers in 2012. Members of the European Low Fares Airline Association (ELFAA) reported a 7.2 percent increase in passengers over 2011 levels. European airlines acquired more than 230 new airplanes in 2012, of which 74 percent were single aisle.
Aviation growth is expected to continue over the next 20 years, with European airlines forecast to acquire 7,460 new airplanes valued at $530 billion. Single-aisle airplanes will account for the majority of deliveries, representing a 73 percent share.
Although aviation growth in Europe is not as rapid as in the world’s emerging economies, the region’s large installed base of almost 4,400 airplanes sustains a substantial demand for replacement airplanes. This demand will account for 51 percent of Europe’s new-airplane market.
Leading strategic changeAirline operations continue to evolve with the launch of new ventures and new business models. Long-haul service by European low-cost carriers (LCC) is becoming a reality in 2013 with the delivery of the 787 to LCC Norwegian Air Shuttle. The next 20 years are expected to bring additional mergers and acquisitions, along with increased collaboration with alliance partners around the world.
Large Middle East carriers have captured significant long-haul share from European network carriers by providing one-stop service from Europe to markets such as India, Australia, and Southeast Asia. These carriers are also changing the way that they compete for European business: one by entering an alliance, another by acquiring an equity stake in a European carrier, and a third through a cooperative agreement with a non-European partner.
Large network airlines are tending to shift away from short-haul traffic, which is targeted by LCCs, and toward flowing passengers through their hubs on longer itineraries. LCCs have continued to add service in short-haul markets, with ELFAA members providing 35 percent of capacity on intra-Europe flights in 2012. Smaller flag carriers and charter airlines will be challenged to compete in an environment where LCCs dominate short-haul, point-to-point service, and large network carriers and their alliance partners exploit the cost advantages of mega-hubs for long-haul traffic.
100%
0%
75%
50%
25%
EuropeMarket Value: $1,020 billion
2%
2013 to 2032New airplanes
7,460
2012Airplanes
4,390
Delivery units
3%9%
11%
75%
Share of fleet
2032Airplanes8,010
• Regional jets • Single aisle • Small widebody • Medium widebody • Large widebody
EuropeKey indicators and new airplane markets
New Share airplanes by sizeLarge widebody 170 2%Medium widebody 650 9%Small widebody 850 11%Single aisle 5,610 75%Regional jets 180 3%Total 7,460
2012 2032 Fleet FleetLarge widebody 180 200Medium widebody 360 690Small widebody 340 990Single aisle 3,160 5,930Regional jets 350 200Total 4,390 8,010
Growth measuresEconomy (GDP) 1.8%Traffic (RPK) 4.2%Cargo (RTK) 3.8%Airplane fleet 3.1%
MarketsizeDeliveries 7,460Market value $1,020BAverage value $140M
Source:Sabre ADI
EuropeMarket share is being eroded to Gulf carriers
O-D market share (%)O-D traffic Europe to:
Indian Subcontinent
17% 35%
32% 15%2002
2012
Southeast Asia
14% 20%
22%2002
2012
Oceania
12%
16% 4%
0% 20% 40% 60%
2002
2012 33%
Indian subcontinent
Southeast Asia
Oceania
3%
• Europe • Gulf
World RegionsEurope

Current Market Outlook2013 –2032
27Copyright © 2013 Boeing. All rights reserved.
Many growth strategiesGrowth of Middle Eastern aviation outpaced the global average and will continue to do so, supported by a variety of growth strategies. Fleet expansion is the predominant strategy, with Emirates as the foremost practitioner.
Alliances and partnerships also contribute, as with the 2012 Emirates-Qantas codeshare agreement, or Qatar Airways’ pending membership in the oneworld alliance.
Low-cost carriers tend to pursue growth through business model innovation: reducing short-haul fares, setting up national subsidiaries, and opening new avenues of access to air transport services.
Other strategies include the purchase of equity shares in other airlines. For example, Etihad invested in airberlin and Jet Airways, in order to grow quickly and gain access to new markets without fleet expansion.
Liberalization gains groundFurther support for growth could come from liberalization of industry regulations. The Kingdom of Saudi Arabia (KSA) took significant steps in 2012 toward opening its markets. Gulf Air (Bahrain) and Qatar Airways have been granted rights to operate domestic flights within the KSA. Competition will be allowed in the markets for ground services, and it is expected that Saudia will be privatized. More vigorous competition should result in better, more frequent, and lower cost services.
The opportunity to relax price controls on domestic KSA flights remains, though it has not been adopted as a policy goal. Price deregulation could bolster industry health, enhancing service quality over the long term.
Liberalization of the region’s bilateral agreements is having important impacts. In the wake of Etihad’s investment in Jet Airways, the UAE and India are set to increase weekly seating entitlements from 13,300 to nearly 50,000 seats by 2015. These entitlements, which will be available to qualified airlines on both sides, will spur competition.
Infrastructure and airspace developmentInfrastructure development is a long-term concern. Although the region’s airspace is not yet crowded, large sections remain under military control, limiting the airspace available for commercial traffic. The region’s air traffic control (ATC) is not centralized, leaving airlines to manage flights within a patchwork of different ATC systems. Further, investment tends to target new runways and terminals, rather than ATC modernization. Awareness of infrastructure challenges is growing, and ongoing discussions between the Gulf Cooperation Council countries and their neighbors signal progress.
Source:IATA
Middle EastOutpaces the world in international traffic growth
Middle EastMarket value: $550 billion
Delivery units
100%
0%
75%
50%
25%
Share of fleet Delivery units
1%10%
26%
16%
47%
100%
0%
75%
50%
25%
Share of fleet
• Regional jets • Single aisle • Small widebody • Medium widebody • Large widebody
2013 to 2032New airplanes
2,610
2032Airplanes2,850
2012Airplanes
1,140
35%
30%
25%
20%
15%
10%
5%
0%
5%
2001
2002
2003
2004
2005
2006
2007
2008
2009
2010
2011
2012
• Middle East • World
Middle EastKey indicators and new airplane markets
New Share airplanes by sizeLarge widebody 280 10%Medium widebody 670 26%Small widebody 410 16%Single aisle 1,240 47%Regional jets 10 1%Total 2,610
2012 2032 Fleet FleetLarge widebody 80 250Medium widebody 270 700Small widebody 230 450Single aisle 500 1,420Regional jets 60 30Total 1,140 2,850
Growth measuresEconomy (GDP) 3.8%Traffic (RPK) 6.3%Cargo (RTK) 6.6%Airplane fleet 4.7%
MarketsizeDeliveries 2,610Market value $550BAverage value $210M
World RegionsMiddle East

Current Market Outlook2013 –2032
Current Market Outlook2013 –2032
28 Copyright © 2013 Boeing. All rights reserved.
Lower but steady growthThe World Bank semiannual report projects 3.5 percent GDP growth in Latin America and the Caribbean for 2013, better than last year’s 3 percent, but still lagging the 5 percent historical trend and the 6 percent growth in 2010. The Economic Commission for Latin America and the Caribbean predicts Latin America’s fastest growing economies will be Paraguay (10 percent), Panama (8 percent), and Peru (6 percent). Growth in Brazil and Argentina will not meet previous expectations.
Political and macroeconomic stability, solid growth, poverty reduction, and a fairer income distribution buoyed regional growth in the 2000s. The World Bank projects that future growth will rely more on a demand-driven domestic economy and less on cheap labor, exports, and undervalued currency. A robust aviation sector is crucial to growth. Brazil, the world’s seventh largest economy, has the third largest domestic aviation industry. Total domestic RPKs have nearly doubled from 44 million RPKs in 2007 to 87 billion RPKs in 2012. A majority of interstate passengers now travel by air.
A wave of consolidationsLATAM Airlines Group, established as the parent of LAN and TAM, is the largest instance of a massive consolidation trend that includes the mergers of Avianca with TACA, Gol with Webjet, and Azul with Trip. The region’s fleet, meanwhile, will grow from 1,280 airplanes to more than 3,790 and will need 2,900 new airplanes with a value of $300 billion by 2032. Average airplane age in the region’s fleet has been reduced from 14.8 years to 9.7 years since 2003, giving Latin America a younger fleet than those in the United States and Europe. Major carriers are cutting unprofitable routes and reducing capacity to achieve a more sustainable business environment.
Rise of the low-cost carriersLCCs have grown quickly in Brazil and Mexico, Latin America’s two largest markets. LCCs now account for more than 50 percent of Latin American capacity. The Ryanair-backed Viva Group already controls VivaAerobus and VivaColombia and is said to be eyeing expansion. LCCs are also extending their reach through partnerships. With only six LCCs in the region, the potential for expansion is great.
World RegionsLatin America
Latin AmericaStrong backlog in region
120
Latin American backlog
2013
201514
201716
201918
202120
22
0 40 80
• Regional jets • Single aisle • Small widebody
Source:Flight Global Ascend
Online Database
Latin AmericaMarket value: $300 billion
2013 to 2032New airplanes
2,900
2012Airplanes
1,280
Delivery units
6%1%9%
84%
100%
0%
75%
50%
25%
Share of fleet
2032Airplanes3,790
• Regional jets • Single aisle • Small widebody • Medium widebody • Large widebody
New Share airplanes by sizeLarge widebody - -Medium widebody 40 1%Small widebody 270 9%Single aisle 2,420 84%Regional jets 170 6%Total 2,900
2012 2032 Fleet FleetLarge widebody - -Medium widebody 20 50Small widebody 120 380Single aisle 1,050 3,150Regional jets 90 210Total 1,280 3,790
Growth measuresEconomy (GDP) 4.0%Traffic (RPK) 6.9%Cargo (RTK) 6.0%Airplane fleet 5.6%
MarketsizeDeliveries 2,900Market value $300BAverage value $100M
World regionsKey indicators and new airplane markets
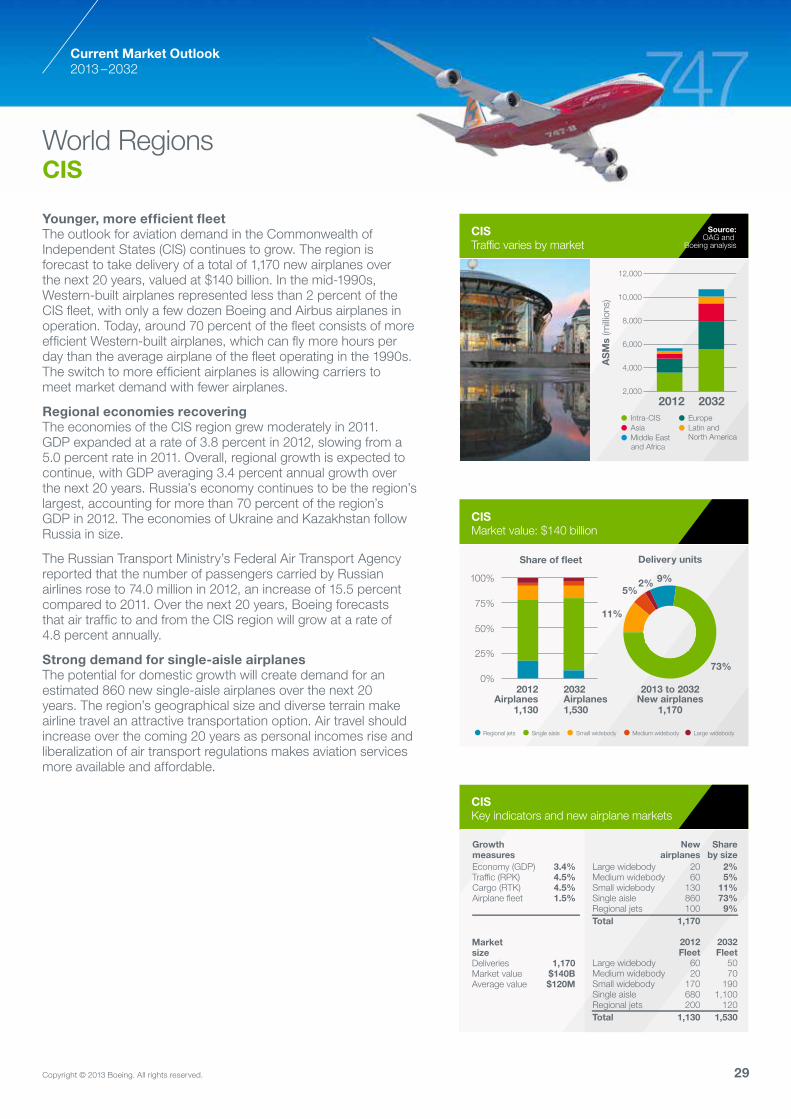
Current Market Outlook2013 –2032
29Copyright © 2013 Boeing. All rights reserved.
Younger, more efficient fleetThe outlook for aviation demand in the Commonwealth of Independent States (CIS) continues to grow. The region is forecast to take delivery of a total of 1,170 new airplanes over the next 20 years, valued at $140 billion. In the mid-1990s, Western-built airplanes represented less than 2 percent of the CIS fleet, with only a few dozen Boeing and Airbus airplanes in operation. Today, around 70 percent of the fleet consists of more efficient Western-built airplanes, which can fly more hours per day than the average airplane of the fleet operating in the 1990s. The switch to more efficient airplanes is allowing carriers to meet market demand with fewer airplanes.
Regional economies recoveringThe economies of the CIS region grew moderately in 2011. GDP expanded at a rate of 3.8 percent in 2012, slowing from a 5.0 percent rate in 2011. Overall, regional growth is expected to continue, with GDP averaging 3.4 percent annual growth over the next 20 years. Russia’s economy continues to be the region’s largest, accounting for more than 70 percent of the region’s GDP in 2012. The economies of Ukraine and Kazakhstan follow Russia in size.
The Russian Transport Ministry’s Federal Air Transport Agency reported that the number of passengers carried by Russian airlines rose to 74.0 million in 2012, an increase of 15.5 percent compared to 2011. Over the next 20 years, Boeing forecasts that air traffic to and from the CIS region will grow at a rate of 4.8 percent annually.
Strong demand for single-aisle airplanesThe potential for domestic growth will create demand for an estimated 860 new single-aisle airplanes over the next 20 years. The region’s geographical size and diverse terrain make airline travel an attractive transportation option. Air travel should increase over the coming 20 years as personal incomes rise and liberalization of air transport regulations makes aviation services more available and affordable.
CISKey indicators and new airplane markets
Source:OAG and
Boeing analysis
CISTraffic varies by market
CISMarket value: $140 billion
New Share airplanes by sizeLarge widebody 20 2%Medium widebody 60 5%Small widebody 130 11%Single aisle 860 73%Regional jets 100 9%Total 1,170
2012 2032 Fleet FleetLarge widebody 60 50Medium widebody 20 70Small widebody 170 190Single aisle 680 1,100Regional jets 200 120Total 1,130 1,530
Growth measuresEconomy (GDP) 3.4%Traffic (RPK) 4.5%Cargo (RTK) 4.5%Airplane fleet 1.5%
MarketsizeDeliveries 1,170Market value $140BAverage value $120M
2%
2013 to 2032New airplanes
1,170
2012Airplanes
1,130
Delivery units
9%5%
11%
73%
100%
0%
75%
50%
25%
Share of fleet
2032Airplanes1,530
• Regional jets • Single aisle • Small widebody • Medium widebody • Large widebody
20322012
• Intra-CIS
• Asia
• Middle East and Africa
• Europe
• Latin andNorth America
AS
Ms
(milli
ons)
12,000
10,000
8,000
6,000
4,000
2,000
World RegionsCIS

Current Market Outlook2013 –2032
Current Market Outlook2013 –2032
30 Copyright © 2013 Boeing. All rights reserved.
Robust air travel demand outlookOptimism about the strength and sustainability of Africa’s economic growth has increased recently. Sub-Saharan Africa weathered the financial crisis of 2008 and 2009 and commodity price volatility particularly well, continuing to achieve above-world-average economic growth. Accordingly, both the IMF and World Bank increased their expectations for sub-Saharan Africa’s economic growth over the next two years, despite a relatively weak global outlook.
Africa’s long-term economic growth rate of 4.4 percent is well above the world average. Commodity markets are expected to remain the primary driver of the continent’s economic growth, but recent indicators show increasing diversification among the region’s economies. According to the World Bank, this can be seen in foreign direct investment (FDI) flows, where the number of manufacturing and services investments is increasing. Rising investments and trade foster demand for air travel to and from the region.
Air travel network developmentConsistent with economic growth, air travel demand to, from, and within Africa is forecast to outpace world average growth at 5.7 percent annually. Growth to and from other emerging markets is expected to lead the way, as airlines both in Africa and other emerging market regions are planning to increase inter-regional connectivity.
Prospects for intra-African growth are also rising. Airlines in the region are exploring new business models and development of intra-regional hubs. Growth in pan-African airline networks can bring the efficiency of air travel to the continent’s transportation system. The flexibility of aviation networks and the relatively low cost per network kilometer make aviation infrastructure investment very attractive compared to investment in other modes.
Capacity to and from Europe will remain the largest single flow over the next decades, but long-term capacity growth will be slower than in other regions where trade and economic growth drive air travel demand more strongly.
Increased travel demand drives fleet growthAfrica is forecast to require close to 1,100 new airplanes over the next 20 years. Approximately 70 percent of forecast deliveries will support growth. Replacement of the existing aging fleet is also an important component of demand in Africa where the average in-service age of the fleet has declined by almost 20 percent since 2004. Single-aisle airplanes will account for the largest share of deliveries, while widebody airplanes will account for nearly half of the value of deliveries to Africa.
Delivery units
7%2%
23%
68%
2013 to 2032New airplanes
1,070
100%
0%
75%
50%
25%
Share of fleet
2032Airplanes1,500
2012Airplanes
690
• Regional jets • Single aisle • Small widebody • Medium widebody • Large widebody
AfricaMarket value: $130 billion
AfricaCapacity to become more diverse
Source:Boeing Analysis
and OAG
50 10 15
Weekly ASMs(billions)
2002
2012
2022
2032
• Africa-Europe
• Other Africa traffic flows• Within Africa
New Share airplanes by sizeLarge widebody - - Medium widebody 20 2%Small widebody 250 23%Single aisle 730 68%Regional jets 70 7%Total 1,070
2012 2032 Fleet FleetLarge widebody 10 -Medium widebody 60 50Small widebody 80 280Single aisle 420 1,040Regional jets 120 130Total 690 1,500
Growth measuresEconomy (GDP) 4.4%Traffic (RPK) 5.7%Cargo (RTK) 6.6%Airplane fleet 4.0%
MarketsizeDeliveries 1,070Market value $130BAverage value $120M
AfricaKey indicators and new airplane markets
World RegionsAfrica

2013 to 2032Pilots
498,000
3% 3%8%
10%
17%
20%
39%
Pilot & Technician OutlookNew pilots by region 2013–2032
Pilot & Technician Outlook20-year demand for aviation personnel
NEW!
Innovative
training for
tomorrow’s
workforce
Region Pilots
• Asia Pacific 192,300
• Europe 99,700
• North America 85,700
• Latin America 48,600
• Middle East 40,000
• Africa 16,500
• CIS 15,200
Total 498,000
2013 to 2032Technicians
556,000
3% 3%9%
9%
18%
19%
39%
Pilot & Technician OutlookNew technicians by region 2013–2032
Region Technicians
• Asia Pacific 215,300
• Europe 108,200
• North America 97,900
• Middle East 53,100
• Latin America 47,600
• CIS 18,000
• Africa 15,900
Total 556,000
Current Market Outlook2013 –2032
31Copyright © 2013 Boeing. All rights reserved.
Pilot & Technician Outlook
Burgeoning demand for highly trained personnelAs global economies expand and airlines take delivery of tens of thousands of new commercial jetliners over the next 20 years, the demand for personnel to fly and maintain those airplanes will be unprecedented. The aviation industry will need to supply approximately one million new commercial airline pilots and maintenance technicians between now and 2032 to support this tremendous growth.
The 2013 Boeing Pilot & Technician Outlook, a respected industry forecast of personnel demand, projects a requirement for 498,000 new commercial airline pilots and 556,000 new maintenance technicians to fly and maintain the new airplanes entering the world fleet over the next 20 years.
Meeting this exponential demand growth will require innovative solutions focused on new digital technology to match the learning requirements of a new generation. The growing diversity of aviation personnel will require instructors to have cross-cultural and cross-generational skills. Training providers will focus more strongly on enabling airplane operators to gain optimum advantage from the advanced features of the latest generation of airplanes, such as the 787 Dreamliner.
Pilot outlookAirlines across the globe are expanding their fleets and flight schedules to meet surging aviation demand in emerging markets. The industry continues to consider how to address challenges and fill the future pilot pipeline.
The largest projected growth in pilot demand is in the Asia Pacific region, with a requirement for 192,300 new pilots over the next 20 years. China will generate the largest share of the region’s demand, with a need for 77,400 pilots. Europe will require 99,700 pilots, North America 85,700, Latin America 48,600, the Middle East 40,000, Africa 16,500, and the Commonwealth of Independent States 15,200.
Technician outlookAs new-generation airplanes come to dominate the world fleet, airplane reliability will improve and maintenance check intervals will lengthen. Although this trend will moderate demand growth, global demand for technicians remains significant.
Emerging markets that currently recruit maintenance technicians from outside the region will have to develop a strong foundation for developing and training qualified technical personnel from within the local workforce.
The need for maintenance personnel is greatest in the Asia Pacific region, which will require 215,300 new technical personnel. China’s requirement will be the region’s greatest, with a need for 93,900 technicians. Airlines in Europe will require 108,200, North America 97,900, the Middle East 53,100, Latin America 47,600, the Commonwealth of Independent States 18,000, and Africa 15,900 technicians.

Current Market Outlook2013 –2032
Current Market Outlook2013 –2032
32 Copyright © 2013 Boeing. All rights reserved.
RPK: Revenue passenger-kilometers. The number of fare-paying passengers multiplied by the number of kilometers they fly (i.e., airline traffic).Note: Taiwan has been moved from Southeast Asia to Northeast Asia.
Regions
RPKs in billions
Africa – Africa
Africa – Europe
Africa – Middle East
Africa – North America
Africa – Southeast Asia
Central America – Central America
Central America – Europe
Central America – North America
Central America – South America
China – China
China – Europe
China – North America
China – Northeast Asia
China – Oceania
China – Southeast Asia
CIS – CIS
CIS – International
Europe – Europe
Europe – Middle East
Europe – North America
Europe – Northeast Asia
Europe – South America
Europe – Southeast Asia
Europe – South Asia
Middle East – Middle East
Middle East – North America
Middle East – Southeast Asia
Middle East – South Asia
North America – North America
North America – Northeast Asia
North America – Oceania
North America – South America
North America – Southeast Asia
Northeast Asia – Northeast Asia
Northeast Asia – Oceania
Northeast Asia – Southeast Asia
Oceania – Oceania
Oceania – Southeast Asia
South America – South America
Southeast Asia – Southeast Asia
Southeast Asia – South Asia
South Asia – South Asia
Rest of world
World total
Average growth2012 to 2032
6.3%
4.8%
7.5%
5.8%
6.7%
4.6%
4.5%
4.2%
6.5%
6.9%
6.1%
6.3%
4.8%
6.4%
7.5%
4.5%
4.9%
3.6%
5.0%
3.5%
3.2%
4.8%
5.0%
7.2%
5.7%
6.4%
6.6%
7.5%
2.3%
2.2%
4.2%
6.1%
6.5%
2.5%
3.5%
4.9%
4.5%
5.1%
7.4%
7.5%
8.4%
9.6%
5.0%
7.7%
2009
43.88
128.17
32.86
8.77
4.09
29.80
77.08
104.67
13.97
287.36
77.33
60.88
43.23
22.79
45.29
76.86
83.62
624.92
131.16
405.40
59.36
79.34
95.92
51.29
68.59
41.56
46.70
64.81
915.13
120.18
34.81
56.87
10.29
81.93
15.09
74.32
73.29
54.65
86.93
95.99
21.89
43.81
69.35
4,564.19
2008
41.58
125.60
24.90
6.28
5.37
32.29
83.29
115.77
13.08
236.53
82.52
62.70
48.44
21.37
50.59
88.93
77.73
660.55
115.15
432.38
68.97
75.17
101.53
55.48
63.37
29.54
45.36
49.46
974.07
139.37
32.26
52.68
9.33
84.85
20.81
87.73
72.01
57.42
81.60
93.22
24.34
40.08
55.49
4,639.17
2011
51.06
134.13
39.45
11.40
5.91
32.23
73.67
114.51
19.19
380.11
94.19
85.43
51.45
31.35
62.99
103.07
124.10
659.48
153.27
430.20
63.76
89.82
100.43
54.05
82.38
50.32
61.31
83.05
976.35
135.41
38.30
66.67
11.29
81.93
16.63
92.32
83.82
66.89
134.39
130.72
29.17
58.57
97.41
5,262.17
2010
48.66
135.45
36.41
11.31
5.61
31.29
73.82
112.65
18.31
335.44
82.12
71.37
51.81
27.43
54.71
87.55
101.55
640.17
143.81
418.58
64.27
82.95
97.11
53.80
77.91
45.70
56.28
75.11
946.28
128.38
34.85
60.93
10.32
84.65
18.15
79.60
78.37
61.14
115.85
113.15
28.52
49.50
87.85
4,938.73
2012
55.76
140.46
48.98
12.34
4.02
35.89
75.61
122.40
23.02
403.31
98.90
86.04
63.17
33.29
73.36
104.18
133.13
710.02
177.39
441.83
71.75
94.51
100.49
51.85
78.32
52.77
64.05
86.97
978.19
140.93
38.64
69.13
10.44
97.31
16.33
102.18
95.51
69.55
136.38
151.98
31.84
60.05
109.37
5,551.62
2032
190.72
362.07
208.24
38.13
14.61
88.21
183.97
279.28
81.40
1,523.24
325.34
293.46
159.97
115.55
313.32
253.19
349.06
1,448.03
470.64
881.39
135.95
242.08
265.72
207.66
235.17
182.46
229.52
372.41
1,538.67
219.72
87.81
224.68
37.11
160.76
32.22
267.03
231.67
189.00
566.54
644.70
161.24
374.54
485.81
14,672.32
2005
35.97
106.37
16.79
3.33
4.07
26.65
67.05
100.59
10.22
164.21
63.10
48.14
39.68
17.55
48.04
73.14
58.07
561.88
87.28
390.71
60.72
63.89
98.00
43.42
48.72
16.08
29.50
36.06
972.26
146.27
29.06
46.23
82.79
21.24
11.77
74.61
65.25
54.49
64.07
79.11
20.44
25.16
31.49
4,043.46
2007
37.31
125.32
23.09
4.89
5.18
29.68
80.71
106.83
11.01
223.12
91.03
54.52
49.31
19.40
49.34
80.76
81.59
634.21
106.59
420.61
67.90
70.75
96.84
58.51
60.27
23.44
41.14
46.49
1,022.41
143.74
32.11
52.06
88.79
21.05
11.25
86.32
74.35
52.36
83.08
93.39
20.56
36.29
44.29
4,561.90
2006
35.56
121.95
20.87
4.33
4.12
28.18
74.15
104.99
10.33
189.79
75.27
51.44
42.41
19.26
44.57
77.34
63.64
593.32
99.18
403.37
60.59
67.36
95.88
53.26
53.68
20.65
33.36
41.97
977.36
140.66
30.58
50.68
9.45
87.39
21.50
80.14
70.84
51.91
74.25
78.78
19.37
31.31
38.56
4,253.61
Airline passenger trafficGrowth by regional flow
Passenger Traffic

Current Market Outlook2013 –2032
33Copyright © 2013 Boeing. All rights reserved.
Total airplanes in service
Size
Regional jetsSingle aisleSmall widebodyMedium widebodyLarge widebody
Total
Passenger airplanes in service
Size
Regional jetsSingle aisleSmall widebodyMedium widebodyLarge widebody
Total
Freighter airplanes in service
Size
Large*Medium widebodyStandard
Total
Airplane demand
Size
Regional jetsSingle aisleSmall widebodyMedium widebodyLarge widebody
Total
Passenger airplane demand
Size
Regional jetsSingle aisleSmall widebodyMedium widebodyLarge widebody
Total
Freighter airplane demand
Size
Large*Medium widebodyStandard body
Total
2032
2.18029,1305,4103,610
910
41,240
2032
2,18028,1004,6302,900
620
38,430
2032
1,000780
1,030
2,810
Airplanes
2,02024,6704,5303,300
760
35,280
Airplanes
2,02024,6704,3202,810
610
34,430
Airplanes
640210
–
850
2012
2,66013,0402,3101,520
780
20,310
2012
2,61012,4901,7201,290
470
18,580
2012
540590600
1,730
$B
802,2901,1001,090
280
4,840
$B
802,2901,060
940230
4,600
$B
20040
–
240
*Large passenger and large freighter categories differ.
Demand and value by region
Region
Asia Pacific
Europe
North America
Latin America
Middle East
CIS
Africa
World
Deliveries by airplane size and region
Region
Asia Pacific
Europe
North America
Latin America
Middle East
CIS
Africa
World
Market value by airplane size and region*
Region
Asia Pacific
Europe
North America
Latin America
Middle East
CIS
Africa
World
Small widebody
1,860
850
760
270
410
130
250
4,530
Small widebody
460
210
170
70
100
30
60
$1,100
Single aisle
8,810
5,610
5,000
2,420
1,240
860
730
24,670
Single aisle
840
530
460
210
120
70
60
$2,290
Regional jets
420
180
1,070
170
10
100
70
2,020
Regional jets
10
10
40
10
–
10
–
$80
Medium widebody
1,470
650
390
40
670
60
20
3,300
Medium widebody
490
210
130
10
220
20
10
$1,090
$B
1,890
1,020
810
300
550
140
130
4,840
Largewidebody
260
170
30
0
280
20
–
760
Large widebody
90
60
10
–
110
10
–
$280
Airplanes
12,820
7,460
7,250
2,900
2,610
1,170
1,070
35,280
Totaldeliveries
12,820
7,460
7,250
2,900
2,610
1,170
1,070
35,280
Totaldeliveries
1,890
1,020
810
300
550
140
130
$4,840
*2012 $B, catalog prices. Values above 10 have been rounded to the nearest 10.
Passenger and freighter airplanesMarket value and demand by region
Passenger and freighter airplanesIn service and future fleet
Airplanes Required

Current Market Outlook2013 –2032
Current Market Outlook2013 –2032
34 Copyright © 2013 Boeing. All rights reserved.
Market by airplane size
Size
Large*
Medium
Small
Total twin aisle
More than 175 seats
90 to 175 seats
Total single aisle
Total regional jets
Total fleet
Passenger fleet development
Size
Large*
Medium
Small
Total widebody
More than 175 seats
90 to 175 seats
Total single aisle
Total regional jets
Total passenger fleet
Freighter fleet development
Size
Large*
Medium widebody
Standard body
Total freighter fleet
Total fleet
Size
Passenger fleet
Freighter fleet
Total fleet
Marketshare units
2%
9%
13%
24%
14%
56%
70%
6%
100%
End of year 2032
620
2,900
4,630
8,150
5,450
22,650
28,100
2,180
38,430
End of year 2032
1,000
780
1,030
2,810
End of year 2032
38,430
2,810
41,240
New airplanedeliveries
760
3,300
4,530
8,590
5,040
19.630
24,670
2,020
35,280
New deliveries2013 to 2032
610
2,810
4.320
7,740
5,040
19,630
24,670
2,020
34,430
New deliveries2013 to 2032
640
210
0
850
New deliveries2013 to 2032
34,430
850
35,280
Marketshare value
6%
22%
23%
51%
11%
36%
47%
2%
100%
Convertedto freighter
–
–
–
510
–
–
940
0
1,450
Convertedto freighter
130
380
940
1,450
Convertedto freighter
1,450
1,450
1,450
Market value2012 $B
280
1,090
1,100
2,470
540
1,750
2,290
80
4,840
Removedfrom service
460
1,200
1,410
3,070
1,210
7,850
9,060
2,450
14,580
Removedfrom service
310
400
510
1,220
Removedfrom service
14,580
1,220
15,800
End of year 2012
470
1,290
1,720
3,480
1,620
10,870
12,490
2,610
18,580
End of year 2012
540
590
600
1,730
End of year 2012
18,580
1,730
20,310
*Large passenger and large freighter categories differ.
Passenger and freighter airplanesMarket value and fleet development
Fleet Development
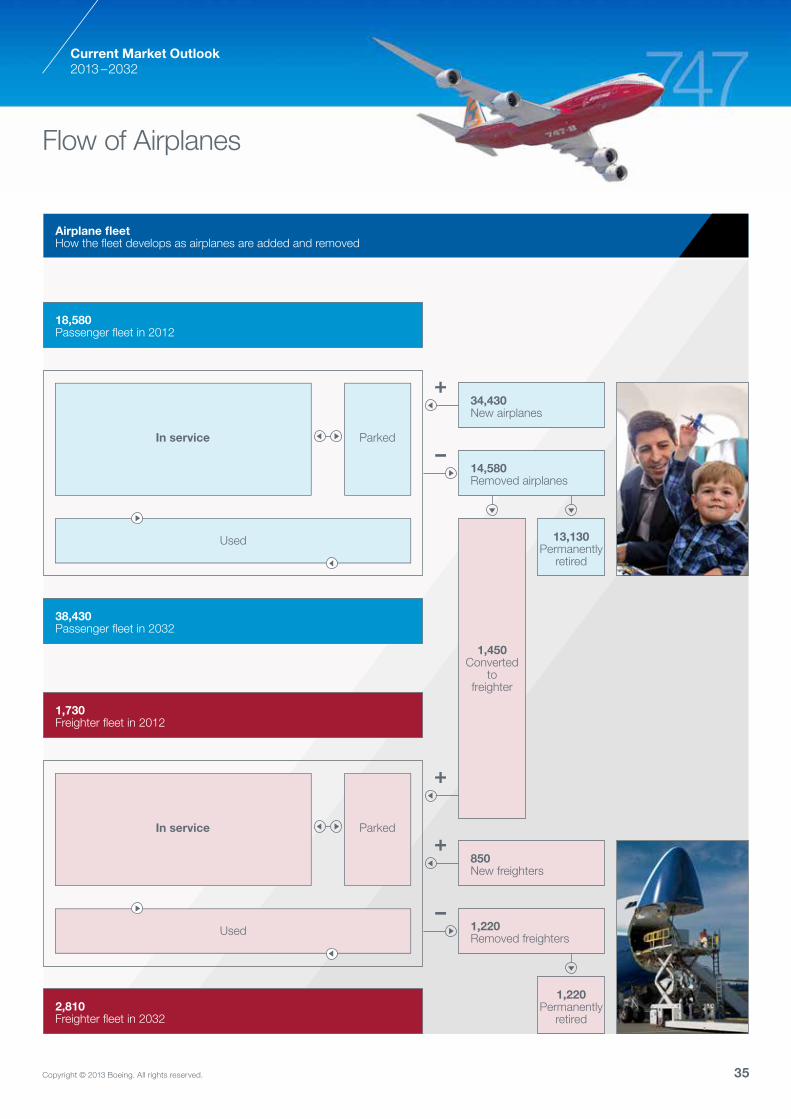
Current Market Outlook2013 –2032
35Copyright © 2013 Boeing. All rights reserved.
In service
850New freighters
1,220Removed freighters
1,730Freighter fleet in 2012
18,580Passenger fleet in 2012
2,810Freighter fleet in 2032
38,430Passenger fleet in 2032
Used
–
–
In service
Parked
Parked
14,580Removed airplanes
Used
+34,430New airplanes
+
+
1,450Converted
tofreighter
13,130Permanently
retired
1,220Permanently
retired
Airplane fleetHow the fleet develops as airplanes are added and removed
Flow of Airplanes

Current Market Outlook2013 –2032
Current Market Outlook2013 –2032
36 Copyright © 2013 Boeing. All rights reserved.
Fleet by airplane size
Size
Large*
Medium
Small
Total widebody
More than 175 seats
90 to 175 seats
Total single aisle
Total regional jets
Total fleet
Fleet by region in 2012
Region
Asia Pacific
North America
Europe
Latin America
Middle East
CIS
Africa
World
Fleet by region in 2032
Region
Asia Pacific
North America
Europe
Latin America
Middle East
CIS
Africa
World
Fleet share2032
2%
9%
13%
24%
14%
56%
71%
6%
100%
Total fleet
5,090
6,590
4,390
1,280
1,140
1,130
690
20,310
Total fleet
14,750
8,810
8,010
3,790
2,850
1,530
1,500
41,240
Airplanes inservice 2032
910
3,610
5,410
9,930
5,850
23,280
29,130
2,180
41,240
Large widebody
330
120
180
0
80
60
10
780
Large widebody
350
60
200
0
250
50
0
910
Fleet share2012
4%
7%
12%
23%
9%
55%
64%
13%
100%
Medium widebody
500
290
360
20
270
20
60
1,520
Medium widebody
1,550
500
690
50
700
70
50
3,610
Airplanes inservice 2012
780
1,520
2.310
4,610
1,840
11,200
13,040
2,660
20,310
Small widebody
660
710
340
120
230
170
80
2,310
Small widebody
2,080
1,040
990
380
450
190
280
5,410
Single aisle
3,470
3,760
3,160
1,050
500
680
420
13,040
Single aisle
10,350
6,140
5,930
3,150
1,420
1,100
1,040
29,130
Regional jets
130
1,710
350
90
60
200
120
2,660
Regional jets
420
1,070
200
210
30
120
130
2,180
*Large passenger and large freighter categories differ.
Fleet growthBy size and region
Fleet by Region

Current Market Outlook2013 –2032
37Copyright © 2013 Boeing. All rights reserved.
Major Traffic Flows
Airline traffic flowsBy region
Airline passenger growth rates 2012 to 2032
RPKs
Asia Pacific
North America
Europe
Middle East
Latin America
Africa
Airline passenger traffic in 2012
RPKs in billions
Asia Pacific
North America
Europe
Middle East
Latin America
Africa
Airline passenger traffic in 2032
RPKs in billions
Asia Pacific
North America
Europe
Middle East
Latin America
Africa
Asia Pacific
6.5%
Asia Pacific
1,208.1
Asia Pacific
4,229.2
North America
4.5%
2.3%
North America
288.4
978.2
North America
694.5
1,538.7
Europe
5.5%
3.5%
3.6%
Europe
323.0
441.8
710.0
Europe
934.7
881.4
1,448.0
Middle East
7.3%
6.4%
5.0%
5.7%
Middle East
208.1
52.8
177.4
78.3
Middle East
853.1
182.5
470.6
235.2
Latin America
5.7%
5.0%
4.7%
—
6.9%
Latin America
3.8
191.5
323.0
—
195.3
Latin America
11.6
504.0
426.1
—
736.1
Africa
7.1%
5.8%
4.8%
7.5%
8.7%
6.3%
Africa
17.8
12.3
140.5
49.0
2.7
55.8
Africa
70.1
38.1
362.1
208.2
14.2
190.7
Bold: Share within region.

Current Market Outlook2013 –2032
Current Market Outlook2013 –2032
38 Copyright © 2013 Boeing. All rights reserved.
How to read the tables Read down the selected column; for example:
• In 2012, traffic within North America accounted for 50% of all the total traffic to, from, within North America.
• In 2032, traffic within North America accounted for 40% of all the total traffic to, from, within North America.
Airline traffic distributionBy region
Traffic in 2012
RPKs
Asia Pacific
North America
Europe
Middle East
Latin America
Africa
Total traffic to and from region
Traffic in 2032
RPKs
Asia Pacific
North America
Europe
Middle East
Latin America
Africa
Total traffic to and from region
Africa
6%
4%
51%
18%
—
20%
100%
Africa
8%
4%
41%
24%
2%
22%
100%
Latin America
1%
34%
30%
—
35%
0%
100%
Latin America
1%
30%
25%
—
44%
1%
100%
Middle East
37%
9%
31%
14%
—
9%
100%
Middle East
44%
9%
24%
12%
—
9%
100%
Europe
16%
23%
36%
9%
9%
7%
100%
Europe
21%
19%
32%
10%
9%
8%
100%
North America
15%
50%
22%
3%
10%
1%
100%
North America
18%
40%
23%
5%
13%
1%
100%
AsiaPacific
59%
14%
16%
10%
—
1%
100%
AsiaPacific
62%
10%
14%
13%
—
1%
100%
Bold: Share within region. Sum data down the table only. Excludes other small flows that are not included in the summary table (less than 1% of each region).
Traffic by Region

Current Market Outlook2013 –2032
39Copyright © 2013 Boeing. All rights reserved.
Passenger and freighterAirplane market sector definitions
90 to 175 seats
Boeing 717, 727Boeing 737-100 through -500Boeing 737-600, -700, -800Boeing 737 MAX 7, MAX 8Airbus A318, A319, A320Airbus A319neo, A320neoBoeing-MDC DC-9, MD-80, -90AVIC ARJ-900BAe 146-300, Avro RJ100Bombardier CRJ-1000Bombardier CS100, CS300Embraer 190, 195COMAC C919Fokker 100UAC MS 21-200 -300Ilyushin IL-62Tupolev TU-154Yakovlev Yak-42
Medium widebody40 to 80 tonnes
Boeing 767Lockheed L-1011SFBoeing-MDC DC-10Boeing 787Airbus A300Airbus A330Ilyushin IL-76TD
MediumTwo class: 340 to 450 seatsThree class: 300 to 400 seats
Boeing 777Boeing-MDC MD-11Airbus A340Airbus A350-1000Ilyushin IL-86Boeing 787-10
Single-aisle passenger airplanes
Regional jets
Antonov An-148AVIC ARJ-700Avro RJ70, RJ85BAe 146-100, -200Bombardier CRJDornier 328JETEmbraer 170, 175Embraer ERJ-135, -140, -145Fokker 70, F28Mitsubishi MRJSukhoi Superjet 100Yakovlev Yak-40
Freighter airplanes
Standard bodyLess than 45 tonnes
BAe 146Boeing-MDC DC-8, -9Boeing 737Boeing 727Tupolev TU-204Boeing 707Boeing-MDC MD-80Boeing 757-200Airbus A318, A319, A320, A321
Widebody passenger airplanes
SmallTwo class: 230 to 340 seatsThree class: 200 to 300 seats
Boeing 767, 787Boeing-MDC DC-10Airbus A300, A310Airbus A330-200, -300**Airbus A350-800, -900**Lockheed L-1011Ilyushin IL-96
More than 175 seats
Boeing 707, 757Boeing 737-900ERBoeing 737 MAX 9Airbus A321Airbus A321neoTupolev TU-204, TU-214UAC MS21-400
Large*More than 80 tonnes
Boeing-MDC MD-11Boeing 747-100 through -400Boeing 777Airbus A350Ilyushin IL-96TAntonov An-124747-8F
Large*Three class: more than 400 seats
Boeing 747-8Boeing 747-100 through -400Airbus A380
Bold: Airplanes in production or launched. Production and conversion (SF) models assumed for each type unless otherwise specified. *Large passenger and large freighter categories differ. **A330-300 and A350-900 moved from the medium category to the small category.
Airplane Categories

Current Market Outlook2013 –2032
Current Market Outlook2013 –2032
40 Copyright © 2013 Boeing. All rights reserved.
Opinion and Feedback
We value your opinionPlease provide your name, position, company, and address below, or attach your business card.
FeedbackWhat do you think?
Send your comments to usOur contact details are below.
Your perspective
• What will be the main factors to affect future air transport markets?
• What will be the likely impact of these factors?
Your feedback
• What do you think of web-only access to forecast information (with a PDF for you to print locally)?
• If you have used the interactive forecast data- base on our website, tell us what you think of it.
• What areas would you like to see covered in more detail in the Current Market Outlook?
• What additional data would you like us to make available?
• What did you find most valuable?
• Was there anything you disliked?
Your comments
Any other questions or comments?
Website
www.boeing.com/cmo
Forecast databasewww.boeing.com/cmo/data
Contact
Michael WarnerSenior ManagerMarket Analysis
Fax1.206.766.1022
AddressBoeing Commercial AirplanesMarket AnalysisP.O. Box 3707, MC 21-28Seattle, WA 98124-2207


Boeing Commercial AirplanesMarket AnalysisP.O. Box 3707 MC 21-28Seattle, WA 98124-2207www.boeing.com/cmo
The statements contained herein are based on goodfaith assumptions and provided for general information purposes only. These statements do not constitute an offer, promise, warranty, or guarantee of performance.Actual results may vary depending on certain events or conditions. This document should not be used or relied upon for any purpose other than that intended by Boeing.
Copyright © 2013 Boeing. All rights reserved. Printed in USA 239448 9/13