current performance of a passive wetlands treating …
TRANSCRIPT

1
CURRENT PERFORMANCE OF A PASSIVE WETLANDS TREATING
ACID MINE DRAINAGE FROM UNDERGROUND MINE SEALS AT
MORAINE STATE PARK, BUTLER COUNTY, PENNSYLVANIA
A THESIS
Submitted to the Faculty of the School of Graduate Studies and Research
Of California University of Pennsylvania in partial
Fulfillment of the requirements for the degree of
Master of Science
By Jay Allan Winter
Research Advisor, Dr. Kyle Fredrick
California, Pennsylvania 2008

2
CALIFORNIA UNIVERSITY OF PENNSYLVANIA
CALIFORNIA, PA
THESIS APPROVAL
Earth Sciences
We hereby approve the Thesis of
Jay Allan Winter Candidate for the degree of Master of Sciences
Date Faculty Research Advisor Signature Committee Member Signature Committee Member Signature

i
CURRENT PERFORMANCE OF A PASSIVE WETLANDS TREATING ACID
MINE DRAINAGE FROM UNDERGROUND MINE SEALS AT MORAINE STATE
PARK, BUTLER COUNTY, PENNSYLVANIA
By: Jay A. Winter
Advisor: Dr. Kyle Fredrick
Date: November 24, 2008
A Thesis in partial fulfillment of the requirements for a Master of Science Degree
in Earth Sciences, California University of Pennsylvania; California, Pennsylvania
ABSTRACT
Coal mining was conducted in the area of Moraine State Park prior to
establishment of the park and associated Lake Arthur. Sixty-nine underground
mine entries were sealed during the 1960s and early 1970s along the proposed
shore of Lake Arthur. Not all seals were successful and some were leaking acid
mine drainage (AMD) and depositing iron hydroxides. A passive wetlands
treatment system was constructed in 1996 to treat the AMD from one of these
leaking seals. The design life of the system was estimated as twelve years. Six
monitoring locations were established, water samples collected, analyzed for
AMD parameters, and precipitate thickness measured to determine if the ponds
continue to function properly twelve years later. This research determined the
wetlands treatment system continues to ameliorate the AMD discharge,
determined that the ponds do not need to be cleaned out at this time,
recommends a monitoring and maintenance schedule.

ii
Acknowledgements:
I would like to acknowledge all those who have helped me with this project, but I
am sure I am leaving some people out. Thank you to Dr. Robert Vargo, who got
this whole thing started (in my Mind). I wish I could have taken more classes
from him. My current advisor Dr. Kyle Fredrick and all my advisors and
professors at California University of Pennsylvania. Mr. John Foreman, for
providing me with several files, mapping, and for the reclamation plan that helped
to make the area surrounding Lake Arthur suitable for a state park and a lake
that is not just an AMD treatment pond. The park area is a wonderful resource
for work and play and I was able to explore portions of the park that not many
people have visited. Most park visitors are not even aware that the area had a
mining history. Jeremy Rekich and staff at the Moraine State Park Office and
Davis Hollow Marina, especially Wink who saved me some travel time. Members
of the Slippery Rock Watershed Coalition, especially Margaret Dunn, Cliff
Denholm, and Wil Taylor. Members of the Lake Arthur Sailing Club for being
interested in the study I was doing during the sailing season. Department of
Environmental Protection Laboratory. North County Brewing in Slippery Rock for
liquid sustenance and rehydration after long days outstanding in the field. My
wife (Patty) and children (Paul and Jill) who supported me and have missed me
while I was outstanding in the field, I think.

iii
Table of Contents
ABSTRACT ................................................................................................................................................................. i
Acknowledgements: .............................................................................................................................................. ii
Introduction ................................................................................................................................................................ 1
Background ........................................................................................................................................................... 5
Project Scope .................................................................................................................................................... 15
Methods ..................................................................................................................................................................... 17
Table 2 – Monitoring Points ................................................................................................................... 25
Field Data Sampling Events ....................................................................................................................... 29
Laboratory Water Quality Sample Events ........................................................................................... 30
Precipitate Thickness Measurements ................................................................................................... 30
Analysis ..................................................................................................................................................................... 33
Climatic Data ...................................................................................................................................................... 33
Field Data Measurements ........................................................................................................................... 34
Laboratory Water Quality Data ................................................................................................................. 34
Iron Hydroxide Precipitate Thickness .................................................................................................... 35
Discussion ................................................................................................................................................................ 36
Conclusions ............................................................................................................................................................. 40
Recommendations ............................................................................................................................................... 46
Further Study .......................................................................................................................................................... 47
Bibliography ............................................................................................................................................................. 48
Appendix 1 .......................................................................................................................................................... 51
Table 1 – Precipitation Data .................................................................................................................. 51
Tables 3 through 8 – Field Data .......................................................................................................... 51
Table 9 – Laboratory Data ..................................................................................................................... 51
Table 10 – Precipitate Thickness........................................................................................................ 51
Appendix 2 .......................................................................................................................................................... 66
Monitoring Point Location Maps ............................................................................................................... 66
Figure 16 and Figure 17 .......................................................................................................................... 66
Data Graphs .................................................................................................................................................. 66
Figures 22 through 43 .............................................................................................................................. 66

1
Introduction
Moraine State Park is a 16,725-acre green space surrounding Lake Arthur
located to the east of the Interstate 79 interchange with State Route 422 in Butler
County, Pennsylvania (Figure 1). The geologic history of the area includes the
formation of predecessor glacial lakes, their draining, and the erosive processes
that formed the gorge that is now part of McConnell’s Mill State Park, located to
the west of Moraine State Park (Figure 2). The bedrock in the area of Moraine
State Park is sedimentary layers of sandstone, siltstone, shale, limestone and
coal. The stratigraphy consists of the Pennsylvanian aged Conemaugh and
Allegheny Formations with a thin veneer of unconsolidated Pleistocene and
recent sediments (Shepps et al., 1959 and Fleeger et al. 2003). The general
stratigraphic sequence is shown in Figure 3.
Figure 1 - Location Map (From: DeLorme Street Atlas USA ® 2005 Plus, 2004)

2
Figure - 2 Moraine State Park and McConnells Mill Location Map (From Fleeger, et al, 2003)
Figure 3 – Generalized Stratigraphic Column for Moraine State Park Area
(Maksimovic and Maynard, 1983)
The bedrock is weathered and soils cover most of the park area with some areas
covered with Pleistocene glacial deposits of Wisconsin Age. Evidence of several

3
continental glacial advances have been noted and described in the area of
Moraine State Park. These ground and end moraine deposits are how the park
was named. ―Glaciers moved into northwestern Butler County at least twice
during Pleistocene time and deposited a heterogeneous mixture of clay, silt, sand
and boulders, called till‖ (Poth, 1973). The depositional records of first and
second glacial advances have been eroded. The third ice advance occurred
approximately 140,000 years ago (Fleeger, et al. 2003). Frank W. Preston
(1950) performed the initial mapping of glacial lakes in the area. Preston
described the largest and earliest one, Lake Arthur. During one of the glacial
advances, glacial Lake Arthur was ―reduced in size and split into two lakes called
Lake Edmund and Lake Watts‖ (Shepps, et al. 1959) and a third smaller lake,
Lake Prouty, was formed to the southwest (Fleeger et al. 2003) (Figure 4).
Figure 4 (From: Fleeger et al, 2003)

4
As stated by Alley (2000), ―More commonly, the meltwaters will pond along the
edge of the ice‖ and this is what happened in the area of glacial Lake Arthur.
Glacial Lake Edmund formed to the north in the Slippery Rock Creek valley,
glacial Lake Watts formed in the Muddy Creek valley, and the smaller Lake
Prouty formed near Cleland Rock (Fleeger et al. 2003). All of these lakes formed
along the edge of glacial ice. Ice dam failure and subsequent release of
floodwaters is how Slippery Rock gorge was formed. Lake water flooded the
area catastrophically to erode the gorge several times. Approximately 23,000
years ago, lakes were dammed behind the most recent continental glaciation
(Fleeger et al. 2003). The lakes either broke through these ice barricades
several times or flowed around the front of the glacial ice after it melted. The
gorge of McConnells Mill State Park was eroded by successive releases of water
from glacial lakes in the past.
These state parks are used by local and regional residents for a variety of
recreational activities. There are 60 miles of trails for hiking, biking, horseback
riding, and in the winter months, cross country skiing and snowmobile riding.
The park receives about 1.2 million visitors each year. The 3,225 acre Lake
Arthur is utilized by water enthusiasts for swimming, fishing, kayaking, rowing,
canoeing, windsurfing and sailing. Ten boat launches around the lake allow
access for all of these boating opportunities (DCNR, 2008)
The major tributary drainages that contribute water to Lake Arthur include Bear
Run, Swamp Run, Big Run, Shannon Run, and Muddy Creek along with
approximately 75 unnamed intermittent streams (U. S. Geological Survey 7.5
5
Minute Topographic Quadrangle Maps - Mount Chestnut, Portersville, and
Prospect Quadrangles). Water exits the lake over the dam spillway via Muddy
Run located on the west side of the lake. Muddy Creek has a USGS flow
monitoring station at this downstream location that provides real-time flow data
(USGS, 2008).
Background
The region has a long history of coal mining including surface and underground
mines with their associated mine spoil and coal refuse piles. Many of the input
streams had been affected by AMD from historical coal mining (Maksimovic and
Maynard; 1983 and Foreman et al, 1972). During the early to mid 1900s, many
of these historical coal mines and associated facilities were left unreclaimed and
abandoned.
The Middle Kittanning coal was mined both prior to and after World War I along
the north side of Muddy Creek where the coal seam outcrops. During this time
period, it was standard mining practice to develop underground coal mines in the
up-dip direction. This facilitated the transport of coal out of the mine and gravity
drainage of water. This practice allowed the water encountered by the mine
workings to drain from the mine entries as AMD. Underground mining operations
were practically non-existent after the 1930’s. From 1940 to 1966, surface mines
were active in the future park area on several coal seams. Most of the up-dip or
upslope mining operations were located along the north shore of the proposed
Lake Arthur. During the time of planning for the construction of the park, only

6
one underground mine in the area (Salzano-Ross Mine shown on Figure 5) was
in operation (Foreman, 1968). Four coal seams were mined in the area of the
park: Middle Kittanning, Upper Kittanning, Lower Freeport and Upper Freeport
(Figure 4).
Figure 5 – Mined Areas Western Portion of Moraine State Park (From: Maksimovich and Maynard, 1983)
The Brush Creek and both Freeport Coal seams were mined in the area,
however only surface mining techniques were utilized when these seams were
mined. The largest amount of coal removed within the proposed park area was
by a number of underground and surface mines that removed coal from the
Middle Kittanning seam. This coal seam is laterally persistent and averages
approximately 36 inches in thickness (Foreman, 1968). At the climax of mining,
coal was being loaded onto the rail cars of the Western Allegheny Railroad that

7
ran the entire length of Muddy Creek within the present park area (Foreman,
1968). The Middle Kittanning coal has high sulfur content ―up to 3.8 pct.‖
(Maksimovic and Maynard, 1983) and therefore spoils and coal mine refuse
leaches large amounts of AMD.
Figure 6 – Mined Areas Eastern Portion of Moraine State Park (From: Maksimovich and Maynard, 1983)
Acid mine drainage forms as a result of exposing pyrite bearing materials to
water and oxygen which begins the weathering process. Pyrite is the mineral
that is mainly responsible for AMD. It contains iron and sulfur that can react with
water and oxygen to generate acid. The acid can dissolve minerals and metals
in rock including iron, aluminum, and manganese. Once mobilized, the water

8
containing metals and acidity can have a deleterious effect on the environment
by disrupting or eliminating entire stream ecosystems (Taylor, et al, 2003).
Coal and coal mining waste contains the mineral pyrite (FeS2). In the presence
of oxygen and water, pyrite weathers as expressed in equation 1.
2FeS2(s) + 7O2(aqu) + 2H2O → 2Fe2+
+ 4SO42-
+ 4H+ (1)
The weathering process produces sulfate (SO42-), dissolved ferrous iron (Fe2+),
and acidity represented by the hydrogen ions (H+). If additional oxygen is
available ferrous iron (Fe2+) can be further oxidized to Fe3+ (ferric iron).
2Fe2+
+ ½O2 + 2H+ → 2Fe
3+ + H2O (2)
Additional amounts of acidity can be produced when ferric iron precipitates as
iron oxyhydroxide forming yellow boy or ochre. The precipitate is the reddish-
yellow or orange stain on the bottom of many streams in the coal fields and the
material that collects in the bottom of treatment ponds. Equation 3 shows the
iron oxyhydroxide precipitation reaction.
2Fe3+
+ 6H2O ↔ 2Fe(OH)3(s) + 6H+ (3)
This reaction can attain equilibrium, therefore the equation is written as both a
forward and reverse reaction (Rose and Cravotta, 1998). Additional acidity can
be generated when ferric iron reacts with pyrite to form ferrous iron as shown in
equation 4.
14Fe3+
+ 2FeS2(s) + 8H2O → 15Fe2+
+ 2SO42-
+ 16H+ (4)

9
The ferrous iron in equation 4 could either be oxidized and carry on the reactions
shown in equations 2, 3, and 4 or remain in solution.
When iron precipitates, as in equation 3, hydrogen ions are released into
solution. One method of removal of iron from solution is to increase the alkalinity
with bicarbonate ions (Younger et al., 2002). Some water has natural alkalinity
from the dissolution of limestone rock units. According to Hedin et al, (1994), net
alkaline water contains at least 1.8 mg/l alkalinity for each 1mg/l of dissolved iron.
Water is considered to be net alkaline if the ratio of alkalinity to acidity is positive
(Hedin et al, 1994). Water with a lower ratio is considered net acidic because the
oxidation and hydrolysis reactions release hydrogen ions, the pH is lowered, and
acidity correspondingly increases. Younger et al (2002), state that ―Mine waters
that contain an excess of alkalinity are referred to as net alkaline. A fundamental
aspect of the efficient passive treatment of mine drainage is the recognition of net
alkaline conditions when they exist naturally, and the passive creation of net
alkaline conditions when they do not exist‖. Passive wetlands treatment systems
are designed to emulate natural amelioration processes in wetlands. The
passive technique and process is not a construct the system and walk away
solution. Passive wetlands treatment systems use inherent chemical and
complimentary biological processes that occur in natural wetlands to affect
positive changes in water quality (Taylor, et al, 2003). When water flowing
through a passive wetlands treatment system has an iron concentration decrease
and a corresponding pH decrease, the water can be classified as net acidic.
When water flowing through an aerobic passive wetlands treatment system has

10
an iron concentration decrease and a corresponding pH increase, the water can
be classified as net alkaline.
When calcium carbonate dissolves from limestone it can increase the pH of
water by combining with hydrogen ions and adds alkalinity with bicarbonate ions.
These reactions are expressed in equations 5 and 6.
CaCO3 + 2H+ ↔ Ca
+2 + H2O + CO2 (5)
CaCO3 + H2CO3 ↔ Ca+2
+ 2HCO3 (6)
Under aerobic conditions, iron can form oxyhydroxides (FeOOH) or hydroxides
(Fe(OH)3) (Costello, 2003). The removal of iron from solution occurs in three
steps: 1) ferrous iron oxidation (equation 7), 2) ferric iron hydrolysis (equation 8),
and 3) sedimentation of ferric oxyhydroxide solids (equation 9).
2Fe2+
+ ½O2 + 2H+ → 2Fe
3+ + H2O (7)
Fe3+
+ 3H2O ↔ FeOOH(sus) + 3H+ (8)
FeOOH(sus) ↔ FeOOH(sed) (9)
Where ―sus‖ indicates a suspended solid and ―sed‖ indicates a sediment (settled)
solid (Younger et al, 2002). This process can be entirely chemical or receive a
microbial assist, depending on the pH, as various bacteria can act as catalysts to
the reaction. The chemical process is most active between ph of 6 to 7; whereas
the biological process is more dominant at lower pH. At pH values greater than
4, the rate of ferric iron hydrolysis is fast and therefore formation of suspended
precipitate solids is fast. At pH value less than 3, the of the hydrolysis reaction

11
rate appears to be very slow and solutions can maintain their ferric iron content
despite over saturation of numerous ferric (oxy)hydroxide and oxide minerals.
The rate of the iron removal is dependent on the pH, iron concentration and the
amount of dissolved oxygen. As pH decreases, iron removal is limited by the
oxidation step (Younger et al, 2002).
Manganese oxidizes and hydrolyzes according to equation 10.
4Mn2+
+ 0.25O2 + 6H2O → 4MnOOH + 8H+ (10)
The precipitates of MnOOH or MnO2 appear as black particles. Certain bacteria
can influence manganese oxidation and removal. The pH of water has to be
greater than 6 for bacteria to efficiently catalyze Mn2+ oxidation. The removal of
manganese from solution requires the water be at a pH greater than 6 and most,
if not all, of the iron must have previously been removed from solution. The
manganese oxide precipitation is autocatalytic and once some manganese has
precipitated, then the rate of precipitation can increase (Watzlaf et al., 2004,
Hedin et al, 1994).
Four main processes remove ferric hydroxide from water.
1. Settlement of ferric hydroxide flocculate from suspension in ponds.
2. Physical filtering of colloidal ferric hydroxide from water by plants roots
and stalks, fibrous materials placed in the wetlands, or other non-
vegetative filtering materials, such as gravel.
3. Batty described iron plaque formation on the root structures of plants,
such as Typha latifolia and Phragmites australis, which seep out oxygen

12
that causes the dissolved ferrous iron to precipitate as a ferric hydroxide
covering on the roots (as cited in Younger et al, 2002).
4. Jarvis and Younger describe surface catalyzed oxidation of ferrous iron
(SCOOFI) as a three stage process where dissolved Fe2+ is adsorbed to
existing ferric hydroxide (as cited in Younger et al, 2002). Then the ferric
hydroxide surface is the site of a catalytic reaction for the oxidation of the
adsorbed ferrous iron to ferric iron as shown in equation 7. The ferric iron
hydrolyses as shown in equation 8 which forms a layer of new ferric
hydroxide that then perpetuates the cycle (Younger et al, 2002).
Costello (2003) describes some of the same processes, like filtering of
suspended precipitate, and other processes that can remove metals in wetland
treatment systems. These include uptake and incorporation of materials in roots
and leaves of plants, adsorption on algal material, decaying plant matter, or
inorganic soils material, or removal of material in either the aerobic or anaerobic
zone by bacterial activity.
Many processes in a passive wetland treatment system can affect the stability of
alkalinity and acidity in the treated water. According to Younger et al (2002), the
most important is sulfate reduction by bacteria. Sulfate reducing bacteria can
remove metals from solution by reducing sulfate to sulfide which reacts with
dissolved metals that then precipitate out of solution (Costello, 2003). In order
for this reaction to occur, the conditions have to be anaerobic, or without
oxidizing compounds like oxygen, Fe3+, or Mn4+. Conditions like this are present
in wetlands treatment systems that have a substrate material of compost or other

13
organic material (Watzlaf, et al, 2004). In equation 11, the CH2O in the reaction
represents a carbon source.
Sulfate in AMD can be removed by organic material in anaerobic conditions
through bacterial sulfate reduction. The sulfate-reducing bacteria oxidize the
organic compound and utilize sulfate as an electron acceptor. This reaction
releases hydrogen sulfide and bicarbonate as shown in equation 11.
2CH2O + SO42-
→ H2S + 2HCO3- (11)
The ―sulfate-reducing bacteria utilize acetate produced by the hydrolysis of lingo-
cellulose materials‖, (Younger, et al 2002). The requirements for the sulfate-
reducing bacteria to both survive and thrive include circum-neutral pH, anoxic
conditions, no Fe3+, and a minimum of 100 mg/l of sulfate in the water. If the
sulfate-reducing bacteria are active (i.e. alive and thriving), then the alkalinity
produced by the reaction in equation 11 can assist with the functioning of the
wetlands treatment. According to Manahan (1990), ―the bacteria Desulfovibrio
can reduce sulfate ion to H2S‖. The hydrogen sulfide product can react with
dissolved metals to form metal sulfide precipitates (Costello, 2003) as shown in
equation 12.
H2S + M+2
→ MS + 2H+ (12)
The AMD discharges from the underground mines, and surface runoff from
several unreclaimed surface mines and refuse piles, could have contributed poor
quality water to the 3,225-acre Lake Arthur (Foreman, 1968). However, during
the late 1960s and early 1970s, a surface mine reclamation and underground

14
mine sealing program ameliorated many of the AMD generation sites. Prior to
the development of Moraine State Park, abandoned surface mines and coal
refuse piles were reclaimed using various pollution abatement measures. From
1969 to 1971, numerous deep mine entries were sealed to assist in water quality
improvement and filling of Lake Arthur (Foreman and McLean, 1972). Some of
the old coal mining roads from the past mining operations became park roads
and trails.
A variety of wildlife now inhabits the park setting and recreational hunting of deer,
turkey, and geese is allowed in approved areas. Lake Arthur currently supports
numerous fish species including bass, walleye, crappie, catfish, bluegill, perch,
musky, and other baitfish.
During 1979 and 1980, a study was performed by the United States Department
of the Interior, Bureau of Mines personnel (Maksimovic and Maynard; 1983) to
assess the long-term effectiveness of the deep mine sealing. The study by
Maksimovic and Maynard identified original weir locations at previous mine
entries, evaluated the condition of the entry area, measured water flow from the
sealed areas, recorded water levels in the mine pools behind the seals, collected
water samples for laboratory analysis, and compared their data to data collected
both prior to and after the initial sealing of the mines in 1969-1971. They found
that the total acid loading was reduced and was less variable. The total mean
and minimum iron loading increased and the maximum iron load decreased. The
variability of the iron loading was reduced. ―Overall, mine sealing improved the

15
water quality in the park’s Lake Arthur‖ (Maksimovic and Maynard; 1983)
Maksimovic and Maynard noted that,
―Deep mine seals installed in the Kildoo Mine area were found to be
ineffective, and in the mid-1970’s the Pennsylvania Department of
Environmental Resources designed a new mine pollution abatement
project. In 1979, exploratory borings indicated waterflow through a
pervious shale zone located under the coal seam. During subsequent
reclamation of the strip mine area, a subsurface drainage system was
installed and the area regraded and resealed. Postconstruction
monitoring data are not available for this project.‖
Project Scope
The research presented in this paper includes an examination of precipitation,
flow rates and water quality at six monitoring points: three at a passive wetland
treatment system, an untreated AMD discharge, and two at control stream points
not affected by mine drainage. The passive wetlands treatment system and the
untreated discharge (MDJ-1) are located in close proximity to both the Lincoln
Mine and the Kildoo Mine area (Figure 6). These locations were monitored to (1)
determine how the flow rate is affected by precipitation, (2) measure water quality
changes from the wet through the dry season, (3) record seasonal fluctuations in
water quality, and (4) assess performance of the passive treatment system.
Recent and historical precipitation data presented in this study are tabulated and
analyzed to determine if precipitation amounts increase or decrease flow from
the wetlands treatment system. Any changes to the amount of precipitation and
therefore AMD flow from the passive wetlands treatment system could have a

16
detrimental impact on Lake Arthur, the park wildlife, and recreational
opportunities for the users of Moraine State Park.

17
Methods
This study is a review of the passive wetlands treatment system that was
designed and constructed during 1995-96 to treat an AMD discharge emanating
from sealed mine entries of either the Lincoln Mine and/or Kildoo Mine (Middle
Kittanning coal seam) (Foreman, 1968). The design life of the passive wetlands
treatment system was approximately twelve (12) years (Moraine State Park
Office files). After this period, it was believed the iron oxyhydroxide precipitate in
the settling and cattail treatment ponds would need to be removed. A
maintenance plan was considered but one was not implemented (Rekich,
personal communication, 11/16/2008). The operation and maintenance of the
wetlands is the responsibility of Moraine State Park. In order to determine the
current performance of the passive wetland treatment system, precipitation data
was tabulated, field measurements were made, water samples were collected for
laboratory analysis, and precipitate thickness was measured in Pond 1 of the
passive wetlands treatment system (Figure 18 and Figure 23). The precipitate
thickness measurements were collected to determine how much volume
remained in the pond, whether the pond needed to be cleaned, and to estimate
how much time remained before cleaning was required.
Precipitation data was compared to discharge values to determine if precipitation
has an effect on the wetlands treatment system. Flow rates of the untreated
AMD discharge and the control stream were compared to precipitation and the

18
flow rate from the treatment pond system. Precipitation in the region is
measured at several recording stations. Three regional stations, between 7 and
12 miles from the park, have been recording data since the late 1940s, which is
prior to the beginning of initial AMD flow monitoring for the original mine
reclamation projects completed in the 1960s and 1970s. A meteorology weather
station is located at the Moraine State Park South Shore Office (Figure 5). Park
Rangers record the daily total precipitation, maximum and minimum temperature,
plus wind speed and direction. The park staff measure lake water temperature a
few times each month. The climatological data are maintained at the Moraine
State Park South Shore Office. This station was utilized for January 2007
through September 2008 precipitation and temperature measurements for this
study. The weather station is located approximately 4.5 miles from both the
passive wetlands treatment system and the untreated AMD discharge, and 2.3
miles from the control stream (Mount Chestnut, Portersville, and Prospect USGS
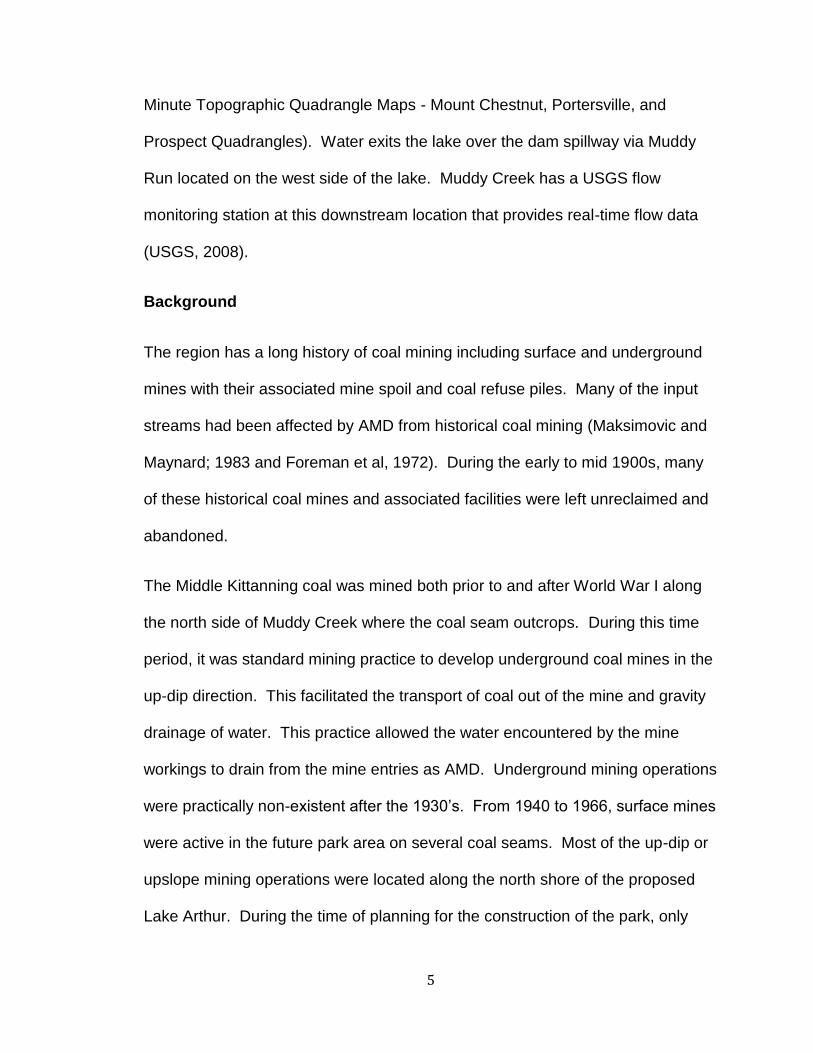
Topographic Quadrangle Maps). Precipitation data from 2007 through
September 2008 recorded at the park office are included in Appendix 1, Table 1.
Figure 7 – Weather Station at Moraine State Park Office

19
Initial site reconnaissance was conducted with Mr. Jeremy Rekich, Assistant
Park Manager from Moraine State Park. The ponds in the passive wetland
treatment system were reviewed, along with several other potential monitoring
locations in the area. The incoming AMD discharge location(s) for the passive
wetlands treatment system could not be located. A Pennsylvania Department of
Conservation and Natural Resources (DCNR) Collectors Permit needed to be
approved prior to establishing the monitoring locations and sampling the sites.
The initial flow readings at the wetland treatment ponds and an untreated AMD
discharge were measured using a 1 inch portable Baski® flume (Figure 8).
Based on these readings, it was determined that 90º triangular (V-notch) weirs
would be sufficient to monitor flow from Pond 1, Pond 3, and the untreated AMD
discharge (MDJ-1) (Figures 9, 10, and 11).
Figure 8 – 1 inch Portable Baski® Flume
These weirs were constructed from ¾ inch lumber. The weir for Pond 3 was
installed against pre-existing 2 inch by 10 inch pressure treated lumber that had
been installed during the original pond construction as a flow regulating device.

20
Another flow regulating board was later uncovered when vegetation was
removed from the Pond 1 outlet area. At the time of initial site reconnaissance,
these original design boards were not visible as vegetation had overgrown the
outlet areas of both Pond 1 and Pond 3.
Figure 9 - 90º Triangular (V-notch) Weir at Pond 1 Outlet (MSP-1)
The outflow pipe for Pond 2 was measured and a 90º ―street bend‖ of appropriate
size was purchased to attach to the outlet pipe (Figure 12). Flow was directed
into a graduated bucket and the standard bucket and stop watch method used to
measure the flow rate from Pond 2 (Trimmer, 1994). This 90º pipe was attached
each time a flow measurement was made and then removed.

21
Figure 10 – Pond 3 Outlet (MSP-3)
Figure 11 – Untreated Mine Drainage Discharge (MDJ-1)
Figure 12 – Pond 2 Outlet (MSP-2)

22
Water quality screening of potential monitoring locations was done using a HACH
iron test kit (Model IR-18B) to field test for iron concentration to determine
whether these sites were affected by AMD. When testing with the HACH kit,
Pond 1 in the passive wetland treatment system showed greater than 10 mg/l,
1.6 mg/l for Pond 2, and 1.6 mg/l for the Pond 3. An untreated AMD discharge,
located approximately 800 feet northeast of the passive wetlands treatment
system, had a field screening iron concentration of 4.0 mg/l. This AMD discharge
flows via a stream channel and natural wetlands, approximately 174 feet, before
entering Lake Arthur. This stream was screened using the HACH test kit and at
the point where it enters Lake Arthur, the iron measured 1.6 mg/l. Therefore, the
majority of the iron had precipitated out of solution by the time the flow reached
the lake. There was no iron hydroxide staining on either the stream substrate
where it enters the lake or in the lake. No iron was detected in numerous HACH
tests performed in the control stream (Davis Hollow). Based on these field
screening measurements, this stream near the Davis Hollow Marina is not
affected by mine drainage. Several other potential monitoring locations were
checked for iron and none proved to have elevated iron and the flow rates did not
appear to be high enough to flow throughout the proposed monitoring period.
The initial flow readings at the Davis Hollow control stream were measured using
an 8 inch portable Baski® flume. Based on these flow measurements, the
appropriate size of the rectangular weir was estimated. Rectangular weirs with a
three foot width were constructed from 2 inch by 12 inch, eight foot long pressure
treated lumber. Reconnaissance was performed for the control stream to

23
determine appropriate locations to install three-foot rectangular weirs, one
upstream and one downstream (Figure 13 and 14).
Figure 13 – Davis Hollow Control Stream Upstream (DHM-1)
Figure 14 – Davis Hollow Control Stream Downstream (DHM-2)

24
It was believed that if the flow rates diminished significantly at the control stream
monitoring locations, and measurements could not be made at the 3 foot wide
weirs, then either the 8 inch or the 1 inch portable Baski® flume (Figure 12) could
be used to collect flow measurements.
Figure 15 – Baski® Flume Measurement near DHM-2
The discharge locations from Pond 1, Pond 2, and Pond 3 were determined to be
the best monitoring locations at the wetlands treatment system. The monitoring
location for the untreated AMD discharge location was selected based on the
distance to Lake Arthur, the best location to direct several separated flows to one
point, and the weir location remaining discreet and unobtrusive in order to avoid
vandalism and protect the park setting. The control stream monitoring locations
were selected based on ease of access, no apparent mining impacts, the ability

25
to use the portable flumes if flow reduced, and proximity to the Davis Hollow
Marina. Table 2 is a listing of sample locations selected for the monitoring
program:
Table 2 – Monitoring Points
Mon. Pt. Location Description Figure No.
MSP-1 Pond 1 outlet Primary settling pond 9, 19, 23
MSP-2 Pond 2 outlet Secondary cattail pond 12, 20, 22
MSP-3 Pond 3 outlet Polishing pond prior to entering Lake Arthur 10, 21
MDJ-1 Mine Drainage Collection of untreated AMD 11
DHM-1 Control Stream
Davis Hollow upstream location 13
DHM-2 Control Stream
Davis Hollow downstream location 14, 15
Field measurements of pH, flow, and water temperature were recorded from
March through September of 2008 at the six monitoring locations. These
monitoring locations are shown in Appendix 2 (Figures 16 and 17). Flow
measurements were recorded both before and after precipitation events to
determine if precipitation increases flow from the treatment ponds, untreated
AMD discharge, and/or the control stream.
A diagram of the passive treatment pond system layout is shown on Figure 18.

26
Pond 1
Pond 2
Pond 3
SL7 SL6 SL5 SL4 SL3 SL2 SL1
Pond Outlet (MSP-2)
Pond Outlet (MSP-1)
Pond Outlet (MSP-3)
Sludge Thickness Sample Locations
Figure 18 – Diagram of Pond Layout and Sample Locations
(North is to the right side of diagram)
*Not to scale
Pond 1 measures approximately 185 feet by 14 feet (Figure 19) and is the
primary settling pond in the system. Pond 2 measures approximately 100 feet by
45 feet and a monoculture of cattails (Typha latifolia) has become well
established in this shallow pond (Figure 20). A photo of the original pond
construction, located at an information display adjacent to the wetlands, indicates
the placement of compost and straw bales in Pond 2 to increase the flow
distance and therefore the detention time of water. Pond 3 measures
approximately 100 feet by 40 feet and has emergent vegetation during the
summer months (Figure 21). The adjacent untreated AMD discharge (MDJ-1) is
located proximal to Burton Road (Figure 16) where it emerges from a sphagnum
moss covered area, approximately 174 feet from where the flow enters Lake
Arthur. This discharge location is located proximal to where the Kildoo Mine is
shown on Figure 6. The control stream (Davis Hollow) is located proximal to the

27
Davis Hollow Marina and was sampled because it was determined by field
screening to not be affected by mining. Water quality samples were collected
from all monitoring locations on a monthly basis from March through August of
2008. Water quality analyses consisted of standard AMD parameters of pH, iron,
manganese, aluminum, sulfate, acidity, alkalinity, and total suspended solids.
Figure 19 – Pond 1

28
Figure 20 – Pond 2 Cattails
Figure 21 – Pond 3 with Emergent Vegetation

29
Field Data Sampling Events
At each visit to the study area, field measurements for flow, temperature,
and pH, were collected and recorded along with qualitative observations at the
monitoring locations. The field measurements record data between the monthly
laboratory sample events.
Figure 22 – Thermometer at MSP-2 for scale (note iron oxide staining)
Temperature was measured with a FISHERbrand® thermometer (Figure
19) and readings were made to the closest degree. Readings of pH were
measured using a pHTestr 1, hand held pH meter, manufactured by Oakton®
Instruments. This device was calibrated according to the manufacturers’
recommendation. Flow depths were measured with a Lufkin Rugged Red End
(No. 1066), six-foot collapsible rule. Tables of field data are included in Appendix
2 (Tables 3 through 8).

30
Laboratory Water Quality Sample Events
Water samples were collected monthly from March through August of
2008 for laboratory analysis of water quality parameters. The downstream
location within the wetland treatment system was sampled first so that
succeeding samples would not affect the downstream sample results (i.e. MSP-3
was sampled first, then MSP-2, and finally MSP-1). The untreated AMD
discharge (MDJ-1) location was collected. Davis Hollow stream sample location
DHM-2 was sampled first and then the upstream sample DHM-1 was collected.
Two Nalgene® HDPE sample bottles were filled at each monitoring location; one
500 ml bottle for general analysis and one 125 ml bottle for metals analysis. The
125 ml samples were fixed with nitric acid as a preservative to a pH less than 2
and all samples were packed in ice and shipped to the Department of
Environmental Protection (DEP) Laboratory in Harrisburg, Pennsylvania.
Laboratory Data is included in Appendix 2 (Table 9).
Precipitate Thickness Measurements
Precipitate thickness was measured in Pond 1 to assist with the
assessment of life expectancy or volume remaining for precipitate retention. This
assessment is needed for recommendation of when and if the pond needs to be
cleaned out and refurbished. A total of seven (7) iron hydroxide precipitate
thickness measurements were made on October 4, 2008. Precipitate depth in
Pond 1 was measured by extending a six foot graduated ruler attached to a ¾
inch wooden dowel rod, taped perpendicular to the end of an extendable
aluminum pole (Figure 23).

31
Figure 23 – Precipitate Thickness Measurement Device
The depth of the water was measured when the dowel rod first encountered the
top of the precipitate. The wooden dowel rod/ruler assembly was then pressed
into the precipitate to resistance with hand pressure and the measurement was
recorded. Next, the aluminum extension pole was struck with a standard round-
pointed shovel five times to drive the dowel to refusal at the bottom of the pond,
and then a measurement was recorded. This procedure was repeated at seven
locations along the length of Pond 1 (Figure 18). The thickness of precipitate
was calculated and a cross section of the pond was constructed (Figure 21). A
table of precipitate thickness measurements is included in Appendix 2 (Table 10).
Since the original design depth of the pond is unknown, the depth of the pond
was estimated as five feet deep. Therefore, only an approximation of the amount

32
the pond has filled since construction could be determined. In order to calculate
the potential life expectancy of the treatment pond, the average precipitate
thickness of 12 inches was compared to the remaining pond depth and
projections were made to determine how much longer the ponds could continue
to retain precipitate. An unsuccessful attempt was made to identify and describe
any layering in the precipitate. A three foot long, 1 inch diameter clear plastic soil
sample tube, was pushed into the bottom of the pond. The tube was then tapped
five times with a shovel in an attempt to set a plug of precipitate in the bottom of
the sample tube. The tube was carefully withdrawn from the bottom of the pond.
However, each time the tube was withdrawn, no precipitate sample was retained
in the tube.

33
Analysis
Four general types of data were analyzed for this project: (1) climate data
(Figures 24-26); (2) field measurements of pH, temperature, and flow; (3)
laboratory sample analysis; (4) precipitate depth/thickness measurements. All of
data are included graphically in Appendix 2
Climatic Data
The daily precipitation measurements recorded at the Moraine State Park South
Shore Office weather station are shown in Figure 24. Figure 25 shows the
monthly precipitation totals for the period from January 2007 through September
2008. Figure 26 shows the departure from normal of the monthly precipitation
data. In addition to the weather monitoring station at the South Shore Park
Office, precipitation data is available at three NOAA weather monitoring stations
in the region. These three locations are between 7 and 12 miles from Moraine
State Park. Precipitation amounts, lake level and temperature are measured by
the park rangers and tabulated. Copies of this data was provided and compared
to the regional monitoring locations. The precipitation amounts for the three
regional stations and the Moraine State Park data coincide. Unfortunately, the
month of October 2007 is not available for the Moraine State Park station.
Comparisons of daily precipitation data to flow data are shown in Figures 27
through 29. Monitoring point water temperature is compared to ambient air
temperature maximums and minimums in Figure 30. Air temperature increased

34
throughout the monitoring period. Water temperatures at the monitoring
locations increased as air temperature increased. Temperature of the treatment
pond water increased as it flowed through the system.
Field Data Measurements
Flow data for the wetlands treatment ponds and MDJ-1 is shown in Figure 31. A
comparison was made between upstream (DHM-1) and downstream (DHM-2)
flow measurements for the control stream (Figure 32).
Laboratory Water Quality Data
A comparison was made between upstream (DHM-1) and downstream (DHM-2)
laboratory water quality data of the control stream. Most of the parameters were
below detection limits. Therefore, only pH and alkalinity vs. acidity were graphed
for comparison (Figures 33 and 34). A limited amount of historical water quality
data was obtained from the Moraine State Park office. Several agencies were
contacted to request any additional data they might have regarding the
construction and design of the treatment system. Several samples had been
collected; however, the descriptions of the sample locations did not lend
themselves to location in the field. Attempts to locate someone with knowledge
of the original location of the samples were not successful. One set of samples
from the completed wetland treatment system was collected on August 28, 1996
after construction. Laboratory data from this sample and the 2008 sample events
is included in Appendix 1 (Table 9).

35
Water quality for the wetlands treatment ponds is depicted in two ways. The first
is water quality trends over time and the second is trends through the wetlands
treatment system. Figure 35 shows the pH data for the treatment ponds over
time compared to the untreated discharge at MDJ-1. Figure 36 shows the data
as the water flows through the treatment pond system. Figure 37 is a graph of
the iron data for the treatment pond system over time. Figure 38 is a graph of
the iron data as the water flows through the treatment pond system. Figure 39 is
a graph of the field pH data for all monitoring locations. Figure 40 is a graph of
the iron data compared to the pH data over time. Figure 41 is a graph of the
manganese data over time. Figure 42 is a graph of the manganese data as the
water flows through the treatment system. Figure 43 is a graph of the sulfate
data over time. Figure 44 is a graph of the sulfate data as the water flows
through the treatment system.
Iron Hydroxide Precipitate Thickness
Iron hydroxide precipitate thicknesses are presented in Appendix 1 (Table 10).
The precipitate thickness was variable along the length of Pond 1. The average
of the seven measurements was approximately 12 inches. A cross section
through the pond is depicted in Figure 45.

36
Discussion
The graph of daily precipitation measured at the Moraine State Park Station
show there were higher precipitation events in 2007 and generally lower and
more frequent precipitation in 2008 (Figure 24). The graph of monthly
precipitation (Figure 25) shows a general decrease in monthly precipitation
amounts from January 2007 through September of 2008. Figure 26, the
departure from normal graph, shows 3 months below average in 2007 and
precipitation amounts were lower than average for April, May, July, August and
September of 2008. Several graphs (Figures 27, 28, and 29) show that as
precipitation decreased there was a corresponding decrease in flow especially
during the months of below average precipitation near the end of the study
period. There is a corresponding reduction in flow through the treatment ponds
during the monitoring period. Water temperatures increased through the
monitoring period and mimicked the ambient air temperature readings (Figure
30). The groundwater discharge temperatures, measured at MDJ-1 and Pond 1,
remained fairly constant with only a slight increase (8 degrees F at MDJ-1) during
the summer. The water in the wetlands treatment system warmed as it flowed
through the ponds by a few degrees (8 to 10 degrees F). A comparison of
treatment pond flow to MDJ-1 flow is shown in Figure 31. The treatment ponds
had more flow than MDJ-1 and MDJ-1 had the least amount of flow variability.
Flow in the control stream decreased through the monitoring period and there
was no flow during late August in the Davis Hollow stream channel and pools

37
were no longer present during early September (Figure 32). The flow amount
was slightly higher at the downstream location (DHM-2) compared to the
upstream monitoring location (DHM-1). By the end of September 2008, flow was
beginning to return to Davis Hollow. Control stream pH increased through the
monitoring period and the downstream pH was consistently higher than the
upstream location (Figure 33). Figure 34 compared the alkalinity to acidity of the
control stream monitoring locations and alkalinity increased with a corresponding
decrease in acidity through the monitoring period. Metals concentrations were
generally below detection limits which confirmed that this control stream is not
affected by AMD.
The passive treatment system pH compared to the untreated discharge at MDJ-1
shows that the untreated discharge pH is slightly higher than the treatment
system pH (Figure 35). The pH of MSP-2 decrease significantly during the
monitoring period and the pH of the water decreased as it flowed through the
system (Figure 36). Based on the analytical laboratory results the treatment
ponds are net acidic. Aluminum concentrations were below detection limits and
are not an issue at the passive treatment system. Figure 37 and Figure 38 show
that iron concentrations are lowered from Pond 1 to the discharge of water at
Pond 3. Iron is precipitating out of solution in Pond 1 and Pond 2. The discharge
limit for iron from treatment ponds in Pennsylvania is 7 mg/l and the treatment
ponds are meeting this standard. Figure 38 shows that there has been a water
quality improvement since the ponds were constructed in 1996. However, the
discharge in 1996 did not meet the 7 mg/l discharge limit for iron for treatment

38
systems. Manganese concentrations were constant through the monitoring
period (Figure 41). The concentration of manganese at the untreated discharge
(MDJ-1) was consistently less than at the wetlands treatment system. During the
spring months of March, April, and May there was a slight decrease in
concentration as the water flowed through the wetlands treatment system (Figure
42). During the months of June, July, and August analysis showed a slight
increase in manganese concentration. A similar increase in concentration was
recorded in the data from August of 1996. Manganese concentrations are
slightly lower than when the ponds were initially constructed. However,
manganese is not being removed in large quantities. The discharge limit for
manganese from treatment ponds in Pennsylvania is 5 mg/l and the treatment
ponds are meeting this standard. Figure 42 shows that there has been a water
quality improvement since the ponds were constructed in 1996. However, the
discharge in 1996 met the 5 mg/l discharge limit for manganese. Sulfate
concentration at MDJ-1 increased through the monitoring period and the
treatment ponds showed a fluctuation with an increase for the June sample.
Sulfate concentrations decreased as the water flowed through the wetlands
treatment system similar to the samples collected in 1996. However, the
concentration of sulfate is lower than when the ponds were initially constructed
(Figure 44). As a qualitative indicator, the ―rotten egg‖ smell of Pond 3
demonstrates that the reaction described in equation 12 is present and ongoing.
The requirements for sulfate reducing bacteria appear to be met and these
processes appear to be occurring, based on the decrease in sulfate

39
concentration through the wetlands treatment system. The single historical
sample (August 28, 1996) from the wetlands treatment system matches this
same trend. This is apparent in the graphs of sulfate concentration (Figure 43
and Figure 44). During the summer months, the pH of the final effluent from the
system lowers. Iron is removed from the water as it moves through the system.
Sulfate concentrations are lowered slightly as the water flows through the
system. The compost and organic materials growing in Pond 2 and Pond 3
contribute to the amelioration.
As of this date, the cleaning out of the ponds has not been necessary because
the iron precipitate is accumulating in the treatment system and not in Lake
Arthur. Precipitate depth measurements (Figure 45) show that the thickness
decreases from northern to the southern portion of the pond (20 inches to 8
inches respectively) with an average thickness of about 12 inches. This equates
to an accumulation rate of 1 inch a year. With between 30 and 40 inches of pond
depth remaining, the precipitate could be retained in Pond 1 for another 25 to 30
years before the pond would need to be cleaned and the precipitate removed.

40
Conclusions
At the beginning of the monitoring period, in March 2008, there was still an
accumulation of snow on the ground. The elevated flow readings at the control
stream monitoring points clearly showed the spring thaw (Figure 28).
Precipitation is typically higher in the spring and decreases through the summer
and fall season. Treatment pond flow decreased through the monitoring period
which corresponds to the recorded decrease in precipitation.
Based on the initial visual examination of the passive wetlands treatment system,
the system appeared to be functioning properly. There was no accumulation of
iron precipitate in Lake Arthur at the outlet from Pond 3. However, no
measurements of water quality had been collected to determine if the treatment
system was functioning properly and to determine if the water quality had
improved since the system was installed. The only samples collected were
shortly after the construction of the treatment system (August 28, 1996) and no
samples had been collected since that time. Moraine State Park Staff had not
measured iron concentrations from the treatment system and did not know if the
system was continuing to functioning properly. This is the philosophy of
construct the system and it will passively treat the water with no other
involvement needed. Minimal maintenance was done on the ponds over the
twelve years since construction. After 12 years, the assumption was that the
ponds would need to be cleaned and maintained. Someone needed to collect

41
water samples to determine whether the system was functioning properly and
determine whether the ponds needed to be cleaned out. This study determined
that the passive wetlands treatment system is treating the AMD discharge
adequately with no major impacts to the lake and Pond 1 can continue to collect
and contain additional precipitate volume for many years.
Dissolved iron is precipitating out of solution in Pond 1 and Pond 2. The
hydrolysis reaction from the precipitation of iron hydroxide in Pond 2 increases
the hydrogen ion concentration and therefore the pH is lower at the outlet to
Pond 2 (MSP-2). A pH increase is shown for Pond 3 for most months. This
could be due to the removal of sulfate and a corresponding slight increase in
alkalinity. The data show that the passive wetlands treatment system is
functioning properly. The passive wetlands treatment ponds lower the iron
concentration as the water flows through the system. All measurements at the
discharge to Lake Arthur are below Pennsylvania water quality discharge limits
for treatment systems.
Hedin et al (1994) and Watzlaf et al (2004) describe the most common
maintenance concerns for passive wetlands treatment ponds is embankment and
outlet stability. In addition, they describe pests (muskrats, beavers, and other
burrowing creatures) causing instability of embankments, blocking outlet
structures and uprooting emergent vegetation causing water level fluctuations.
Muskrat(s) have been active in Pond 3 and at monitoring point MSP-3 during the
time of this investigation (Figure 46). Vegetative material was piled against the
flow monitoring weir, blocking the flow, and raising the pond water level. This

42
vegetation was removed several times (Figure 47). This affected the Pond 3
water level and therefore the flow rate measurements for MSP-3. Elevated flow
readings were measured but were not included on the graphs of flow data.
Figure 46 – Muskrat blockage of Pond 3 outlet (MSP-3 weir covered; rock
hammer for scale)
It was anticipated that the treatment pond flow rate would be steady with slight
seasonal fluctuations and increased flow corresponding to precipitation events.
This did occur through the monitoring period. The treatment pond system shows
a general trend of decreased flow through the monitoring period.

43
Figure 47 – (Field assistant, Paul Winter, shown removing blockage from outflow
pond.)
The decrease in flow may be due to the uptake of water and evapotranspiration
processes of the wetland vegetation. The water quality was expected to improve
as it flowed through the passive wetlands treatment system. The control stream
was expected to have consistently better water quality and that flow rates would
vary seasonally with higher flows in the spring and lower discharge in the
summer. It was unanticipated that the pH of the control stream would increase
over time and that there would be a difference between the upstream and
downstream pH measurements.
Water quality did improve as the water flowed through the passive wetlands
treatment system. Iron, manganese, and sulfate all had lower concentrations by

44
the time treated water flowed out of the final pond. Although the manganese
concentration was reduced less than 1 mg/l, the discharge still meets
Pennsylvania discharge requirements of less than 5 mg/l. It was unexpected and
interesting that the acidity increased (with a corresponding lowering of the pH) as
the metals precipitated out of solution. The hydrolysis reaction is evident in
Figures 38 and 40. As iron is removed the pH of the water in Pond 2 is lowered.
Water quality for MDJ-1 (the untreated AMD discharge) changed throughout the
monitoring period. The quality of the untreated AMD discharge was expected to
remain consistent with some improvement during and immediately after
precipitation events due to dilution. The quality changes, however, could not be
linked to the flow conditions as flow remained fairly constant through the
monitoring period. Sulfate concentration increased throughout the monitoring
period. This could be due to less rainfall available for groundwater recharge and
shallower groundwater being used in evapotranspiration processes. While the
manganese concentration was lowest at MDJ-1, compared to the wetland
treatment system, the concentration increased through the monitoring period.
This could be due to the lack of dilution caused by a reduction of groundwater
recharge.
The wetlands treatment ponds showed a slight lowering of sulfate through the
treatment system. Through the monitoring period, sulfate concentrations lowered
from high in the spring (295.9 mg/l) to fluctuating in the summer and an upward
trend is apparently occurring in the fall (Figure 43). This could be due to reduced
precipitation, reduction of groundwater recharge due to increased

45
evapotraspiration and precipitation, or changes in the conditions needed for
sulfate removal (equation 11) such as circum-neutral pH, anoxic conditions, no
Fe3+, and a minimum of 100 mg/l of sulfate in the water. Manganese
concentrations decreased slightly through the wetlands treatment system for
most dates of monitoring. The initial samples collected in 1996 showed an
increase of manganese through the system (Figure 42). The July 14, 2008
samples indicated an increase in manganese concentration through the system.
Iron concentration was lowered as the water flowed through the treatment
system. By the time water flowed into Lake Arthur, the treatment system had
removed enough iron that the water would meet Pennsylvania discharge limits (7
mg/l). In general, the overall water quality has improved since the treatment
system was installed. All parameters are lower than they were after the system
was initially installed in 1996 (Figures 38, 42, and 44).
One of the limiting factors for passive wetlands treatment systems is the
accumulation of precipitate which reduces the retention time of the water being
treated. By using the average measured precipitate thickness present in Pond 1
(approximately 12 inches), over the twelve year life of the pond, this yields an
accumulation rate of about one inch per year. With a current remaining pond
depth estimated at 36 inches, there should be sufficient volume in Pond 1 for
approximately 25 to 30 years of precipitate retention remaining.

46
Recommendations
This study analyzed the passive wetlands treatment performance. As part of the
study, three concerns were addressed as recommendations: 1) whether the
initial settling pond required cleaning 2) suggested monitoring and maintenance
plan 3) recommend the best timing for the pond precipitate cleaning to be
performed.
It appears that there is sufficient capacity in Pond 1 for many more years of
precipitate retention. Ponds in the wetlands treatment system should be
monitored on a yearly basis for standard AMD parameters. A standard HACH
test for iron would be sufficient. There are several small shrubs and trees
growing on the pond embankments. These trees and shrubs should be removed
from the embankments and the larger dead trees on the northern side of the
ponds should be removed. The outlet structures of the ponds should be checked
and cleaned of vegetation material on at least an annual basis. After the
vegetation is removed from the pond outlets, a few wheelbarrow loads of
limestone cobbles could be added to the outlet structures of Pond 1 and Pond 3
to increase aeration and add alkalinity. When the ponds do need to be cleaned
out, this procedure should be performed during the dry/low flow season of the
year (August/September). (Note: These recommendations will be forwarded to
the staff at Moraine State Park)

47
Further Study
Many researchers are studying the microbial-facilitated chemical processes that
occur in wetlands treatment systems. These processes and additional research
could be conducted at this passive wetlands treatment system and others in the
area (Margaret Dunn, personal communication, 9/25/2008).
Currently, funding is not in place for the removal of the iron precipitate from both
Pond 1 and Pond 2. Funding sources should be planned and an account
established for future maintenance costs associated with the wetlands.
Alternative methods of precipitate removal could be researched to determine
what method of removal would be best suited and what would cause the least
amount of disturbance to the area around the wetland treatment system.
Precipitate samples could be collected prior to pond cleaning, and forwarded to
companies that currently process iron hydroxide precipitate, to determine if there
is a viable use for the recovered materials. These materials could also be used
for educational activities at the park. After precipitate removal, water samples
could be collected to determine if the removal of the precipitate improved the
quality of the effluent water from the treatment system and/or how quickly the
treatment system returned to normal operating conditions.

48
Bibliography
Alley, R. B.; (2000) The Two Mile Time Machine: Ice Cores, Abrupt Climate Change, and Our Future; Princeton University Press, Princeton New Jersey.
Costello, C.; (2003) Acid Mine Drainage: Innovative Treatment Technologies;
United States Environmental Protection Agency, Office of Solid Waste and
Emergency Response Technology Innovation Office, Washington, D.C.; Paper
by a National Network of Environmental Studies Grantee, Unpublished.
DeLorme Street Atlas USA® 2005 Plus, 2004.
Dunn, Margaret; (2008); Personal Communication; Slippery Rock Watershed
Coalition and Stream Restoration Incorporated, Cranberry, Pennsylvania.
Fleeger, G. M., Bushnell, K. O., and Watson, D. W., (2003) Moraine and
McConnells Mill State Parks, Butler and Lawrence Counties—Glacial Lakes and
Drainage Changes; Pennsylvania Geological Survey, 4th ser., Park Guide 4, 12
p.
Foreman, J. W. and McLean, D. C.; (1972) Evaluation of Pollution Abatement
Procedures Moraine State Park, Butler County, Pennsylvania; Gwin, Dobson &
Foreman, Inc. Consulting Engineers, Altoona, Pa. for United States Department
of the Interior Federal Water Pollution Control Administration Project #14010
DSC & Commonwealth of Pennsylvania Department of Mines and Mineral
Industries CR-85,. Includes Progress Reports from 1968, 1969, 1971.
Foreman, J. W.; (1968) Report of Mine Drainage Project MD-8A, Moraine State
Park Watershed Area, Butler County, Pennsylvania; Gwin Engineers, Inc.
Consulting Engineers, Altoona, Pa. for Commonwealth of Pennsylvania
Department of Mines and Mineral Industries.
Hedin, R. S.; Narin, R. W.; and Kleinman, R. L. P.; (1994) Passive Treatment of
Coal Mine Drainage; United States Department of the Interior, Bureau of Mines;
Information Circular IC9389.
Maksimovic, S. D., Maynard, B. R.; (1983) Long-Term Effectiveness of Deep
Mine Sealing at Moraine State P, Butler County, Pa.; United States Department
of the Interior, Bureau of Mines; Report of Investigations 8767.
Manahan, S. E.; (1990) Environmental Chemistry; 4th Edition, Lewis Publishers,
Inc.; originally published by W. Grant Press, Boston, 1984.
National Climatic Data Center, NOAA Precipitation Data; Monthly total
precipitation and departure from normal (Received November 5 and 12, 2007) for

49
Stations Butler 2 SW, Slippery Rock 1SSW, and New Castle 1N. [Available
online at http://ncdc.noaa.gov].
Pennsylvania Department of Conservation and Natural Resources:
<http://www.dcnr.state.pa.us/stateparks/parks/moraine.aspx>.
Pennsylvania Department of Conservation and Natural Resources DCNR (2008)
PAMAP Program Bureau of Topographic and Geologic Survey (Figures 16 and
17).
Poth, C.W.; (1973) Summary Ground-Water Resources of Butler County,
Pennsylvania; United States Geological Survey; Water-Resources Division, in
Cooperation with the Pennsylvania Geological Survey; Water Resource Report
36.
Rekich, Jeremy D.; Personal Communication, Assistant Park Manager, Bureau of
State Parks, Moraine State Park and McConnells Mill State Park, Portersville,
Pennsylvania.
Rose, A. W., and Cravotta III, C. A. (1998), Geochemistry of Coal Mine Drainage.
P.1.1-1.22. In Brady, K.B., Smith, M. B., and Schuek, J. (ed.); Coal Mine
Drainage Prediction and Pollution Prevention in Pennsylvania. 5600-BK-
DEP2256. Pennsylvania Department of Environmental Protection, Harrisburg,
Pennsylvania.
Shepps, V.C., White, G. W., Droste, J. B., and Sitler, R. F.; (1959) Glacial
Geology of Northwestern Pennsylvania; Commonwealth of Pennsylvania,
Department of Internal Affairs, Topographic and Geologic Survey, Bulletin G 32.
Singer, P. C. and Stumm, W. (1970) Acid Mine Drainage: the rate limiting step,
Science, 167, 1121-1123.
Taylor, W., Dunn, M., and Busler, S. (2003) Accepting the Challenge – A Primer
About the History, Cause, and Solutions to Abandoned Mine Drainage, Third
Edition; A Slippery Rock Watershed Coalition Publication, Stream Restoration,
Incorporated.
Trimmer, W. L., (1994) Estimating Water Flow Rates, EC 1369 Oregon State
University Extension Service.
United States Department of the Interior Geological Survey 7.5 Minute Series
Topographic Quadrangle Maps: Mount Chestnut Quadrangle, 1964; Photo
revised 1993. Portersville Quadrangle, 1961; Photo revised 1979. Prospect
Quadrangle, 1961; Photo revised 1970.
USGS, 2008 <http://waterdata.usgs.gov/nwis/uv?03106300>.

50
Watzlaf, G. R., Schroeder, K.T., Kleinman, R. L. P., Kairies, C. L., and Narin, R.
W.; (2004) The Passive Treatment of Coal Mine Drainage; United States
Department of Energy, National Energy Technology Laboratory 2004/1202.
Younger, P. L., Banwart, S. A., and Hedin, R. S.; (2002) Mine Water - Hydrology,
Pollution, Remediation; Kluwer Academic Publishers, Dordrecht, Netherlands.

51
Appendix 1
Table 1 – Precipitation Data
Tables 3 through 8 – Field Data
Table 9 – Laboratory Data
Table 10 – Precipitate Thickness

52

53
Table 1 MSP Weather Information 2007-2008
Date Precip.
(in.) Date Precip.
(in.) Date Precip.
(in.) Date Precip.
(in.) Date Precip.
(in.) Date Precip.
(in.)
1/1/2007 0.45 2/1/2007 0.00 3/1/2007 0.01 4/1/2007 0.00 5/1/2007 0.03 6/1/2007 0.02
1/2/2007 0.40 2/2/2007 0.02 3/2/2007 0.84 4/2/2007 0.54 5/2/2007 0.14 6/2/2007 0.00
1/3/2007 0.00 2/3/2007 0.01 3/3/2007 0.00 4/3/2007 0.00 5/3/2007 0.00 6/3/2007 0.58
1/4/2007 0.00 2/4/2007 0.01 3/4/2007 0.01 4/4/2007 0.13 5/4/2007 0.00 6/4/2007 0.12
1/5/2007 0.57 2/5/2007 0.01 3/5/2007 0.01 4/5/2007 0.03 5/5/2007 0.00 6/5/2007 0.45
1/6/2007 0.55 2/6/2007 0.01 3/6/2007 0.01 4/6/2007 0.12 5/6/2007 0.00 6/6/2007 0.06
1/7/2007 0.10 2/7/2007 0.15 3/7/2007 0.17 4/7/2007 0.03 5/7/2007 0.00 6/7/2007 0.00
1/8/2007 0.05 2/8/2007 0.01 3/8/2007 0.00 4/8/2007 0.01 5/8/2007 0.00 6/8/2007 0.00
1/9/2007 1.47 2/9/2007 0.00 3/9/2007 0.00 4/9/2007 0.14 5/9/2007 0.00 6/9/2007 1.08
1/10/2007 0.05 2/10/2007 0.00 3/10/2007 0.25 4/10/2007 0.01 5/10/2007 0.00 6/10/2007 0.00
1/11/2007 0.00 2/11/2007 0.00 3/11/2007 0.00 4/11/2007 0.00 5/11/2007 0.00 6/11/2007 0.00
1/12/2007 0.10 2/12/2007 0.01 3/12/2007 0.07 4/12/2007 0.62 5/12/2007 0.00 6/12/2007 0.00
1/13/2007 0.70 2/13/2007 0.06 3/13/2007 0.00 4/13/2007 0.15 5/13/2007 0.00 6/13/2007 0.00
1/14/2007 0.30 2/14/2007 0.50 3/14/2007 0.05 4/14/2007 0.01 5/14/2007 0.00 6/14/2007 0.03
1/15/2007 0.79 2/15/2007 0.00 3/15/2007 1.27 4/15/2007 0.51 5/15/2007 0.00 6/15/2007 0.00
1/16/2007 0.55 2/16/2007 0.00 3/16/2007 0.44 4/16/2007 0.03 5/16/2007 0.09 6/16/2007 0.00
1/17/2007 0.06 2/17/2007 0.01 3/17/2007 0.05 4/17/2007 0.24 5/17/2007 0.35 6/17/2007 0.00
1/18/2007 0.00 2/18/2007 0.01 3/18/2007 0.01 4/18/2007 0.01 5/18/2007 0.01 6/18/2007 0.00
1/19/2007 0.09 2/19/2007 0.00 3/19/2007 0.00 4/19/2007 0.00 5/19/2007 0.02 6/19/2007 0.02
1/20/2007 0.07 2/20/2007 0.09 3/20/2007 0.50 4/20/2007 0.00 5/20/2007 0.17 6/20/2007 1.01
1/21/2007 0.01 2/21/2007 0.16 3/21/2007 0.05 4/21/2007 0.00 5/21/2007 0.00 6/21/2007 0.00
1/22/2007 0.06 2/22/2007 0.03 3/22/2007 0.25 4/22/2007 0.00 5/22/2007 0.00 6/22/2007 0.26
1/23/2007 0.04 2/23/2007 0.07 3/23/2007 0.30 4/23/2007 0.00 5/23/2007 0.00 6/23/2007 0.00
1/24/2007 0.01 2/24/2007 0.00 3/24/2007 0.60 4/24/2007 0.00 5/24/2007 0.00 6/24/2007 0.00
1/25/2007 0.15 2/25/2007 0.01 3/25/2007 0.01 4/25/2007 0.00 5/25/2007 0.02 6/25/2007 0.00
1/26/2007 0.01 2/26/2007 0.26 3/26/2007 0.00 4/26/2007 0.75 5/26/2007 0.07 6/26/2007 0.00
1/27/2007 0.07 2/27/2007 0.01 3/27/2007 0.00 4/27/2007 0.22 5/27/2007 0.02 6/27/2007 0.00
1/28/2007 0.05 2/28/2007 0.01 3/28/2007 0.00 4/28/2007 0.15 5/28/2007 0.17 6/28/2007 1.53
1/29/2007 0.04 3/29/2007 0.00 4/29/2007 0.03 5/29/2007 0.00 6/29/2007 0.20
1/30/2007 0.09 3/30/2007 0.00 4/30/2007 0.00 5/30/2007 0.00 6/30/2007 0.00
1/31/2007 0.19 3/31/2007 0.00 5/31/2007 0.00

54
Table 1 (cont)
Date Precip.
(in.) Date Precip.
(in.) Date Precip.
(in.) Date Precip.
(in.) Date Precip.
(in.) Date Precip.
(in.)
7/1/2007 0.00 8/1/2007 0.00 9/1/2007 0.00 10/1/2007 11/1/2007 0.03 12/1/2007 0.00
7/2/2007 0.00 8/2/2007 0.00 9/2/2007 0.00 10/2/2007 11/2/2007 0.00 12/2/2007 0.02
7/3/2007 0.00 8/3/2007 0.00 9/3/2007 0.00 10/3/2007 11/3/2007 0.00 12/3/2007 0.66
7/4/2007 0.00 8/4/2007 0.00 9/4/2007 0.00 10/4/2007 11/4/2007 0.00 12/4/2007 0.20
7/5/2007 0.02 8/5/2007 0.00 9/5/2007 0.00 10/5/2007 11/5/2007 0.00 12/5/2007 0.10
7/6/2007 0.12 8/6/2007 0.97 9/6/2007 0.00 10/6/2007 11/6/2007 0.29 12/6/2007 0.25
7/7/2007 0.00 8/7/2007 0.03 9/7/2007 0.00 10/7/2007 11/7/2007 0.23 12/7/2007 0.15
7/8/2007 0.00 8/8/2007 1.65 9/8/2007 0.51 10/8/2007 11/8/2007 0.00 12/8/2007 0.22
7/9/2007 0.00 8/9/2007 0.42 9/9/2007 0.26 10/9/2007 11/9/2007 0.01 12/9/2007 0.01
7/10/2007 0.00 8/10/2007 1.72 9/10/2007 0.00 10/10/2007 11/10/2007 0.01 12/10/2007 0.85
7/11/2007 0.00 8/11/2007 0.01 9/11/2007 0.02 10/11/2007 11/11/2007 0.00 12/11/2007 0.00
7/12/2007 0.18 8/12/2007 0.00 9/12/2007 0.00 10/12/2007 11/12/2007 0.44 12/12/2007 0.62
7/13/2007 0.00 8/13/2007 0.00 9/13/2007 0.00 10/13/2007 11/13/2007 0.55 12/13/2007 0.75
7/14/2007 0.00 8/14/2007 0.00 9/14/2007 0.00 10/14/2007 11/14/2007 0.08 12/14/2007 0.25
7/15/2007 0.00 8/15/2007 0.00 9/15/2007 0.41 10/15/2007 11/15/2007 0.18 12/15/2007 1.12
7/16/2007 0.00 8/16/2007 0.01 9/16/2007 0.00 10/16/2007 11/16/2007 0.12 12/16/2007 0.70
7/17/2007 0.00 8/17/2007 0.00 9/17/2007 0.00 10/17/2007 11/17/2007 0.03 12/17/2007 0.12
7/18/2007 0.08 8/18/2007 0.00 9/18/2007 0.00 10/18/2007 11/18/2007 0.25 12/18/2007 0.00
7/19/2007 0.09 8/19/2007 0.01 9/19/2007 0.00 10/19/2007 11/19/2007 0.02 12/19/2007 0.01
7/20/2007 0.54 8/20/2007 1.01 9/20/2007 0.00 10/20/2007 11/20/2007 0.01 12/20/2007 0.00
7/21/2007 0.00 8/21/2007 2.36 9/21/2007 0.00 10/21/2007 11/21/2007 0.00 12/21/2007 0.00
7/22/2007 0.00 8/22/2007 0.06 9/22/2007 0.00 10/22/2007 11/22/2007 0.55 12/22/2007 0.00
7/23/2007 0.00 8/23/2007 0.06 9/23/2007 0.00 10/23/2007 11/23/2007 0.20 12/23/2007 0.80
7/24/2007 0.00 8/24/2007 0.00 9/24/2007 0.00 10/24/2007 11/24/2007 0.06 12/24/2007 0.15
7/25/2007 0.33 8/25/2007 0.85 9/25/2007 0.00 10/25/2007 11/25/2007 0.00 12/25/2007 0.00
7/26/2007 0.01 8/26/2007 0.00 9/26/2007 0.00 10/26/2007 11/26/2007 0.47 12/26/2007 0.00
7/27/2007 0.88 8/27/2007 0.00 9/27/2007 0.04 10/27/2007 11/27/2007 0.95 12/27/2007 0.78
7/28/2007 0.26 8/28/2007 0.00 9/28/2007 2.50 10/28/2007 11/28/2007 0.00 12/28/2007 0.01
7/29/2007 0.05 8/29/2007 0.00 9/29/2007 0.00 10/29/2007 11/29/2007 0.00 12/29/2007 0.22
7/30/2007 0.00 8/30/2007 0.00 9/30/2007 0.00 10/30/2007 11/30/2007 0.00 12/30/2007 0.00
7/31/2007 0.00 8/31/2007 0.00 10/31/2007 12/31/2007 0.01

55
Table 1 (cont)
Date Precip.
(in.) Date Precip.
(in.) Date Precip.
(in.) Date Precip.
(in.) Date Precip.
(in.) Date Precip.
(in.)
1/1/2008 0.10 2/1/2008 0.50 3/1/2008 0.01 4/1/2008 0.18 5/1/2008 0.01 6/1/2008 0
1/2/2008 0.17 2/2/2008 0.51 3/2/2008 0.02 4/2/2008 0.00 5/2/2008 0 6/2/2008 0
1/3/2008 0.04 2/3/2008 0.00 3/3/2008 0.00 4/3/2008 0.00 5/3/2008 0.02 6/3/2008 0
1/4/2008 0.00 2/4/2008 0.01 3/4/2008 0.68 4/4/2008 0.16 5/4/2008 0.35 6/4/2008 0.37
1/5/2008 0.00 2/5/2008 1.25 3/5/2008 0.56 4/5/2008 0.30 5/5/2008 0 6/5/2008 0.23
1/6/2008 0.20 2/6/2008 0.53 3/6/2008 0.00 4/6/2008 0.00 5/6/2008 0 6/6/2008 1
1/7/2008 0.01 2/7/2008 0.19 3/7/2008 0.03 4/7/2008 0.00 5/7/2008 0 6/7/2008 0
1/8/2008 0.00 2/8/2008 0.08 3/8/2008 0.50 4/8/2008 0.00 5/8/2008 0.45 6/8/2008 0
1/9/2008 0.16 2/9/2008 0.01 3/9/2008 0.25 4/9/2008 0.00 5/9/2008 0.01 6/9/2008 0
1/10/2008 0.00 2/10/2008 0.10 3/10/2008 0.01 4/10/2008 0.00 5/10/2008 0.26 6/10/2008 0.01
1/11/2008 0.94 2/11/2008 0.02 3/11/2008 0.00 4/11/2008 0.16 5/11/2008 0 6/11/2008 0.1
1/12/2008 0.01 2/12/2008 0.25 3/12/2008 0.06 4/12/2008 0.42 5/12/2008 0.46 6/12/2008 0
1/13/2008 0.00 2/13/2008 0.51 3/13/2008 0.00 4/13/2008 0.22 5/13/2008 0.01 6/13/2008 0
1/14/2008 0.30 2/14/2008 0.00 3/14/2008 0.25 4/14/2008 0.20 5/14/2008 0 6/14/2008 0.62
1/15/2008 0.02 2/15/2008 0.10 3/15/2008 0.53 4/15/2008 0.00 5/15/2008 0.08 6/15/2008 0.51
1/16/2008 0.08 2/16/2008 0.00 3/16/2008 0.01 4/16/2008 0.00 5/16/2008 0.4 6/16/2008 0.07
1/17/2008 0.00 2/17/2008 0.02 3/17/2008 0.35 4/17/2008 0.00 5/17/2008 0.03 6/17/2008 0.01
1/18/2008 0.13 2/18/2008 0.15 3/18/2008 0.02 4/18/2008 0.00 5/18/2008 0.35 6/18/2008 0.05
1/19/2008 0.00 2/19/2008 0.05 3/19/2008 0.25 4/19/2008 0.00 5/19/2008 0.1 6/19/2008 0
1/20/2008 0.00 2/20/2008 0.00 3/20/2008 1.05 4/20/2008 0.39 5/20/2008 0 6/20/2008 0
1/21/2008 0.00 2/21/2008 0.01 3/21/2008 0.00 4/21/2008 0.06 5/21/2008 0.01 6/21/2008 0
1/22/2008 0.00 2/22/2008 0.25 3/22/2008 0.02 4/22/2008 0.00 5/22/2008 0.04 6/22/2008 0.54
1/23/2008 0.11 2/23/2008 0.25 3/23/2008 0.03 4/23/2008 0.00 5/23/2008 0 6/23/2008 0.01
1/24/2008 0.04 2/24/2008 0.01 3/24/2008 0.00 4/24/2008 0.01 5/24/2008 0 6/24/2008 0.11
1/25/2008 0.00 2/25/2008 0.00 3/25/2008 1.63 4/25/2008 0.00 5/25/2008 0 6/25/2008 0
1/26/2008 0.01 2/26/2008 0.21 3/26/2008 0.00 4/26/2008 0.01 5/26/2008 0 6/26/2008 0.9
1/27/2008 0.02 2/27/2008 0.30 3/27/2008 0.00 4/27/2008 0.00 5/27/2008 0.01 6/27/2008 0.2
1/28/2008 0.01 2/28/2008 0.05 3/28/2008 0.85 4/28/2008 0.75 5/28/2008 0 6/28/2008 0.88
1/29/2008 0.18 2/29/2008 0.48 3/29/2008 0.01 4/29/2008 0.22 5/29/2008 0 6/29/2008 0.09
1/30/2008 0.00 3/30/2008 0.00 4/30/2008 0.00 5/30/2008 0 6/30/2008 0.44
1/31/2008 0.00 3/31/2008 0.40 5/31/2008 0.12
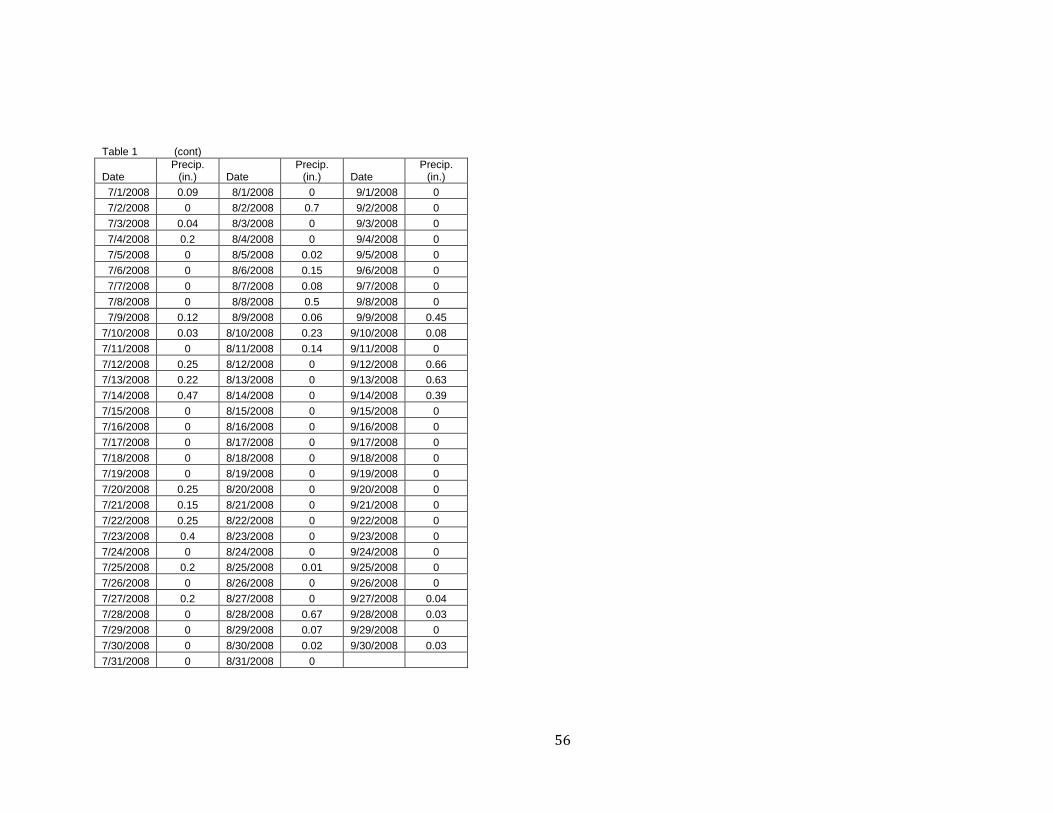
56
Table 1 (cont)
Date Precip.
(in.) Date Precip.
(in.) Date Precip.
(in.)
7/1/2008 0.09 8/1/2008 0 9/1/2008 0
7/2/2008 0 8/2/2008 0.7 9/2/2008 0
7/3/2008 0.04 8/3/2008 0 9/3/2008 0
7/4/2008 0.2 8/4/2008 0 9/4/2008 0
7/5/2008 0 8/5/2008 0.02 9/5/2008 0
7/6/2008 0 8/6/2008 0.15 9/6/2008 0
7/7/2008 0 8/7/2008 0.08 9/7/2008 0
7/8/2008 0 8/8/2008 0.5 9/8/2008 0
7/9/2008 0.12 8/9/2008 0.06 9/9/2008 0.45
7/10/2008 0.03 8/10/2008 0.23 9/10/2008 0.08
7/11/2008 0 8/11/2008 0.14 9/11/2008 0
7/12/2008 0.25 8/12/2008 0 9/12/2008 0.66
7/13/2008 0.22 8/13/2008 0 9/13/2008 0.63
7/14/2008 0.47 8/14/2008 0 9/14/2008 0.39
7/15/2008 0 8/15/2008 0 9/15/2008 0
7/16/2008 0 8/16/2008 0 9/16/2008 0
7/17/2008 0 8/17/2008 0 9/17/2008 0
7/18/2008 0 8/18/2008 0 9/18/2008 0
7/19/2008 0 8/19/2008 0 9/19/2008 0
7/20/2008 0.25 8/20/2008 0 9/20/2008 0
7/21/2008 0.15 8/21/2008 0 9/21/2008 0
7/22/2008 0.25 8/22/2008 0 9/22/2008 0
7/23/2008 0.4 8/23/2008 0 9/23/2008 0
7/24/2008 0 8/24/2008 0 9/24/2008 0
7/25/2008 0.2 8/25/2008 0.01 9/25/2008 0
7/26/2008 0 8/26/2008 0 9/26/2008 0
7/27/2008 0.2 8/27/2008 0 9/27/2008 0.04
7/28/2008 0 8/28/2008 0.67 9/28/2008 0.03
7/29/2008 0 8/29/2008 0.07 9/29/2008 0
7/30/2008 0 8/30/2008 0.02 9/30/2008 0.03
7/31/2008 0 8/31/2008 0
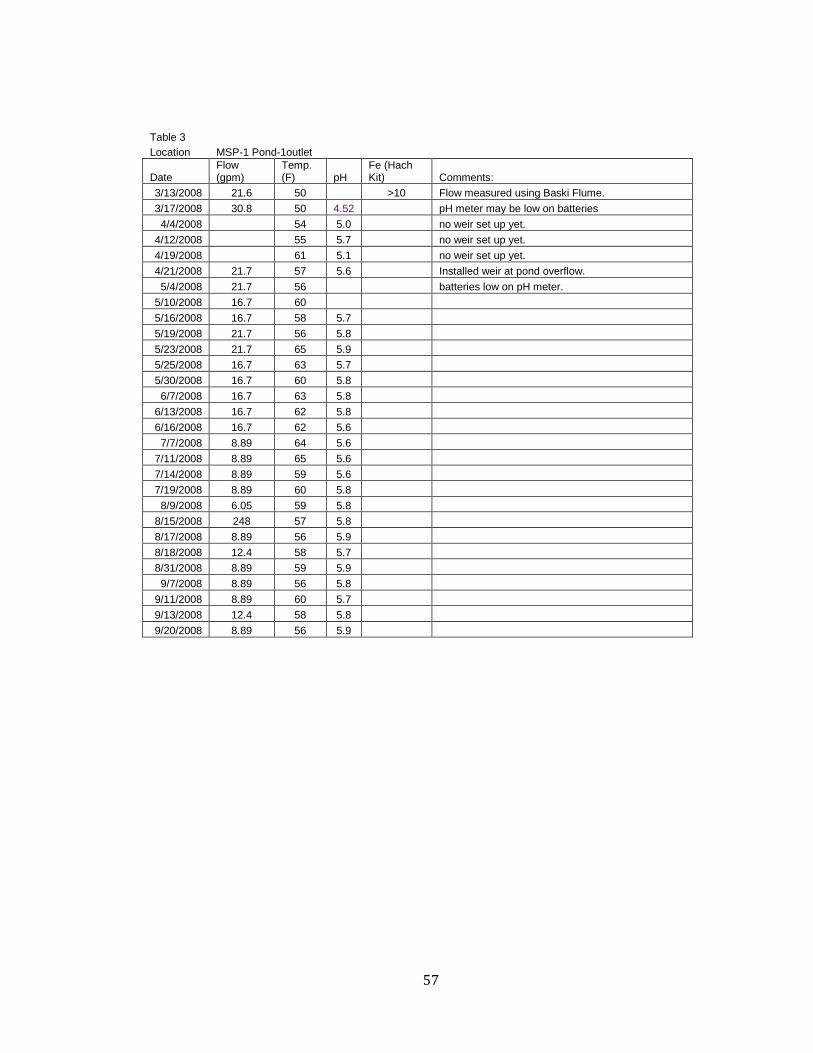
57
Table 3 Location MSP-1 Pond-1outlet
Date Flow (gpm)
Temp. (F) pH
Fe (Hach Kit) Comments:
3/13/2008 21.6 50 >10 Flow measured using Baski Flume.
3/17/2008 30.8 50 4.52 pH meter may be low on batteries
4/4/2008 54 5.0 no weir set up yet.
4/12/2008 55 5.7 no weir set up yet.
4/19/2008 61 5.1 no weir set up yet.
4/21/2008 21.7 57 5.6 Installed weir at pond overflow.
5/4/2008 21.7 56 batteries low on pH meter.
5/10/2008 16.7 60
5/16/2008 16.7 58 5.7
5/19/2008 21.7 56 5.8
5/23/2008 21.7 65 5.9
5/25/2008 16.7 63 5.7
5/30/2008 16.7 60 5.8
6/7/2008 16.7 63 5.8
6/13/2008 16.7 62 5.8
6/16/2008 16.7 62 5.6
7/7/2008 8.89 64 5.6
7/11/2008 8.89 65 5.6
7/14/2008 8.89 59 5.6
7/19/2008 8.89 60 5.8
8/9/2008 6.05 59 5.8
8/15/2008 248 57 5.8
8/17/2008 8.89 56 5.9
8/18/2008 12.4 58 5.7
8/31/2008 8.89 59 5.9
9/7/2008 8.89 56 5.8
9/11/2008 8.89 60 5.7
9/13/2008 12.4 58 5.8
9/20/2008 8.89 56 5.9

58
Table 4 Location MSP-2 Pond-2 outlet
Date Flow (gpm)
Temp. (F) pH
Fe (Hach Kit) Comments:
3/13/2008 50 1.6 Flow from outlet of pond 2 6.75 inch OD PVC pipe.
3/17/2008 48 4.9 pH meter may be low on batteries
4/4/2008 52 5.6
4/12/2008 55 5.3 no flow measurement; need a 90 degree pipe.
4/19/2008 26.6 62 5.2
4/21/2008 30 58 5.2
5/4/2008 30 56 batteries low on pH meter.
5/10/2008 26.6 60
5/16/2008 26.6 57 5.0
5/19/2008 24 58 5.1
5/23/2008 26.6 67 5.0
5/25/2008 24 66 4.9
5/30/2008 24 62 4.9
6/7/2008 24 65 4.7
6/13/2008 21.8 65 4.4 Pipe outlet submerged about 1".
6/16/2008 20 64 4.4
7/7/2008 14.1 66 4.2
7/11/2008 12 69 4.1
7/14/2008 12.6 64 4.3
7/19/2008 12 66 4.1
8/9/2008 8 62 4.1
8/15/2008 120 58 5.8
8/17/2008 16 60 4.3
8/18/2008 16 60 4.2
8/31/2008 13.33 63 4.2
9/7/2008 14.1 59 4.3
9/11/2008 13.33 60 4.3
9/13/2008 21.8 60 4.3
9/20/2008 12.6 59 4.5

59
Table 5 Location MSP-3 Pond-3 outlet
Date Flow (gpm)
Temp. (F) pH
Fe (Hach Kit) Comments:
3/13/2008 21.7 51 1.6
3/17/2008 41.8 42 5.06 pH meter may be low on batteries
3/20/2008 50.3 51
3/29/2008 27.5 51
4/4/2008 34.2 50 5.6
4/12/2008 27.5 58 5.5
4/19/2008 21.7 64 5.3
4/21/2008 21.7 60 5.4
5/4/2008 156 56 Possible rodent blockage; cleaned out & measured.
5/10/2008 21.7 61 batteries low on pH meter.
5/16/2008 21.7 59 5.3
5/19/2008 21.7 56 5.4
5/23/2008 21.7 67 5.3
5/25/2008 21.7 68 4.9
5/30/2008 16.7 62 5.3
6/7/2008 50.3 68 5.2 vegetation blockage of weir; therefore flow higher.
6/13/2008 123 68 5.4 vegetation blockage of weir; therefore flow higher.
6/16/2008 193 67 5.6 Muskrat blocked weir with vegetation
7/7/2008 193 69 5.3 Muskrat blocked weir with vegetation
7/11/2008 108 74 5.1 Muskrat blocked weir with vegetation
7/14/2008 156 67 5.7 Muskrat blocked weir with vegetation
7/19/2008 81.7 70 5.1 Muskrat blocked weir with vegetation
8/9/2008 139 67 5.3 Muskrat blocked weir with vegetation
8/15/2008 193 65 4.3 Muskrat blocked weir with vegetation
8/17/2008 81.7 62 4.1 Muskrat blocked weir with vegetation
8/18/2008 34.2 63 4.6 Muskrat blocked weir with vegetation
8/31/2008 156 64 4.2 Muskrat blocked weir with vegetation
9/7/2008 94.2 62 4.1 Muskrat blocked weir with vegetation
9/11/2008 59.7 62 4.2 Muskrat blocked weir with vegetation
9/13/2008 12.4 63 4.1 No blockage
9/20/2008 8.89 62 4.7 No blockage

60
Table 6 Location MDJ-1 Untreated AMD Discharge
Date Flow (gpm)
Temp. (F) pH
Fe (Hach Kit) Comments:
3/13/2008 8.9 52 4
3/17/2008 12.4 52 4.52 pH meter may be low on batteries
3/20/2008 8.89 52
3/29/2008 12.4 52
4/4/2008 8.89 52 5.5
4/12/2008 8.89 54 5.7
4/19/2008 6.05 53 5.6
4/21/2008 6.05 53 5.1
5/4/2008 6.05 54 batteries low on pH meter.
5/10/2008 8.89 54
5/16/2008 8.89 53 5.5
5/19/2008 8.89 54 5.6
5/23/2008 6.05 65 5.6
5/25/2008 6.05 57 5.6
5/30/2008 6.05 61 5.6 Repair/redirect some flow uphill through MDJ-1.
6/7/2008 8.89 60 5.6
6/13/2008 8.89 59 5.5
6/16/2008 8.89 57 5.6
7/7/2008 6.05 58 5.5
7/11/2008 6.05 60 5.5
7/14/2008 8.89 56 5.6
7/19/2008 8.89 57 5.4
8/9/2008 6.05 56 5.5
8/15/2008 6.05 58 5.4
8/17/2008 6.05 56 5.4
8/18/2008 6.05 58 5.6
8/31/2008 6.05 58 5.4
9/7/2008 6.05 58 5.4
9/11/2008 6.05 57 5.4
9/13/2008 6.05 57 5.6
9/20/2008 6.05 57 5.5

61
Table 7
Location MSPDHM-1
Date Flow (gpm)
Temp. (F) pH
Fe (Hach Kit) Comments:
3/13/2008 233.0 42 0 Measure flow with 8" Baski flume.
3/17/2008 624.0 40 3.4 pH meter may be low on batteries
3/20/2008 1990.0 46 Weir full plus 3/4 inches across 8 feet; est. of flow.
3/29/2008 422.0 46
4/4/2008 302.0 47 6.2
4/12/2008 248.0 52 6.7
4/19/2008 107.5 60 7.1
4/21/2008 150.4 54 5.6
5/4/2008 248.0 55 pH meter needs new batteries.
5/10/2008 197.0 57 batteries low on pH meter.
5/16/2008 197.0 54 5.8
5/19/2008 197.0 52 6.9
5/23/2008 65.0 62 6.7
5/25/2008 40.0 64 7.2
5/30/2008 24.5 59 7.5 flume measurement of flow
6/7/2008 23.0 64 7.6
6/13/2008 17.6 66 7.5
6/16/2008 17.6 63 7.4
7/7/2008 13.0 65 6.5
7/11/2008 10.9 66 6.5
7/14/2008 14.4 64 7.1
7/19/2008 13.0 67 6.6
8/9/2008 9.9 62 6.7
8/15/2008 9.0 62 6.4
8/17/2008 9.0 62 6.3
8/18/2008 9.0 63 6.5
8/31/2008 0.0 64 6.5 Temp and pH measured in pool
9/7/2008 0.0 nm nm No flow or pool
9/11/2008 0.0 nm nm
9/13/2008 45.0 64 6.5
9/20/2008 2.0 62 6.3

62
Table 8
Location MSPDHM-2
Date Flow (gpm)
Temp. (F) pH
Fe (Hach Kit) Comments:
4/4/2008 50 6.3 0 No flow measurement device installed.
4/12/2008 53 6.7 No flow measurement device installed.
4/19/2008 150.4 62 7.3 New 3 foot rectangular weir installed.
4/21/2008 197 53 7.5
5/4/2008 302 batteries low on pH meter.
5/10/2008 197 58
5/16/2008 248 54 6.2
5/19/2008 197 52 6.9
5/23/2008 107.5 61 6.7
5/25/2008 65 64 7.2
5/30/2008 63.2 60 7.5 flow measured with flume.
6/7/2008 70.6 60 7.4 flow measured with flume.
6/13/2008 29.2 66 7.8
6/16/2008 26.0 64 7.8
7/7/2008 13.0 66 6.8
7/11/2008 9.92 68 6.8
7/14/2008 29.2 63 7.4
7/19/2008 13.0 67 6.6
8/9/2008 6.1 59 5.8
8/15/2008 9.0 62 6.4
8/17/2008 9.0 62 6.3
8/18/2008 9.0 63 6.2
8/31/2008 0.0 64 6.8 Temp and pH measured in pool
9/7/2008 0.0 No flow or pool
9/11/2008 0.0 No flow or pool
9/13/2008 78.3 64 6.5
9/20/2008 3.8 66 6.4

63
Table 9
MSP-1 First Settling Pond
MSP-1
Date pH Iron (total) Manganese Sulfate Aluminum Alkalinity Acidity
Flow (gpm) TSS
Collected by:
8/28/1996 5.7 35.2 2.71 331.3 0.584 32 86 18
DEP - Tim Gillen
3/17/2008 6.1 22.858 2.753 295.9 <0.5 35.8 18 30.8 16 jaw
4/21/2008 5.5 21.162 2.662 282.9 <0.5 13 15 21.7 20 jaw
5/19/2008 5.9 21.671 2.555 260.0 <0.5 32.5 21.4 21.7 6 jaw
6/16/2008 5.8 19.939 2.560 274.2 <0.5 32.2 28.4 16.7 6 jaw
7/14/2008 5.8 18.824 2.368 248.6 <0.5 25.4 21 8.89 <5 jaw
8/18/2008 5.8 32.586 2.630 283.8 <0.5 32.2 25 12.4 10 jaw
MSP-2 Second Treatment Pond discharge
MSP-2
Date pH Iron (total) Manganese Sulfate Aluminum Alkalinity Acidity
Flow (gpm) TSS
Collected by:
8/28/1996 5.5 25.8 2.76 312.8 <0.5 24 60 24
DEP - Tim Gillen
3/17/2008 5.9 3.437 2.437 292.8 <0.5 12.6 12.6 <3 jaw
4/21/2008 6.0 0.713 2.479 272.1 <0.5 8.0 12.4 30 4 jaw
5/19/2008 5.2 0.682 2.525 253.6 <0.5 8.8 17.2 24 <5 jaw
6/16/2008 4.5 0.785 2.700 269.5 <0.5 6.6 26.8 20 <5 jaw
7/14/2008 4.3 2.004 2.378 251.6 <0.5 5.2 12.6 12.6 <5 jaw
8/18/2008 4.2 2.026 2.532 277.7 <0.5 4.4 8 15.99 <5 jaw
MSP-3 Final Treatment Pond from wetlands
MSP-3
Date pH Iron (total) Manganese Sulfate Aluminum Alkalinity Acidity
Flow (gpm) TSS
Collected by:
8/28/1996 4.4 16.9 2.82 292.2 <0.5 6.4 54 48
DEP - Tim Gillen
3/17/2008 5.8 2.078 2.437 290.5 <0.5 11.4 12 30.8 <3 jaw
4/21/2008 6.2 0.527 2.458 260.2 <0.5 9.8 8.8 21.7 4 jaw
5/19/2008 5.6 0.762 2.436 240.2 <0.5 10.6 12.2 21.7 <5 jaw
6/16/2008 5.6 2.372 2.582 248.9 <0.5 11.2 14.6 193 <5 jaw
7/14/2008 5.8 4.908 2.471 242.9 <0.5 13.8 7.6 156 <5 jaw
8/18/2008 4.5 2.085 2.601 269.6 <0.5 6.6 4.4 34.2 8 jaw
Blocked by muskrat

64
Table 9 (cont) Untreated Mine Drainage East of Treatment Ponds
MDJ-1
Date pH Iron (total) Manganese Sulfate Aluminum Alkalinity Acidity
Flow (gpm) TSS
Collected by:
3/17/2008 6.0 4.184 1.223 190.6 <0.5 23 5.4 12.4 <3 jaw
4/21/2008 6.4 2.828 1.062 204.8 <0.5 15 2 6.05 4 jaw
5/19/2008 5.8 3.312 1.226 228.2 <0.5 18.2 9.2 8.89 <5 jaw
6/16/2008 5.8 2.469 1.413 246.5 <0.5 17.0 1.8 8.89 <5 jaw
7/14/2008 5.8 2.842 1.342 250.9 <0.5 17.8 6.8 8.89 <5 jaw
8/18/2008 5.8 3.984 1.675 277.2 <0.5 19 1 6.05 <5 jaw
Davis Hollow Marina Control Stream - Upstream Monitoring point
DHM-1
Date pH Iron (total) Manganese Sulfate Aluminum Alkalinity Acidity
Flow (gpm) TSS
Collected by:
3/17/2008 6.0 <0.3 0.063 <20.0 <0.5 8 9.4 624 jaw
4/21/2008 6.3 <0.3 <0.05 25.8 <0.5 8.8 3 150.4 <3 jaw
5/19/2008 6.6 <0.3 <0.05 25.0 <0.5 10.4 10.4 197 <5 jaw
6/16/2008 6.9 <0.3 <0.05 <20.0 <0.5 16.8 8.4 17.6 <5 jaw
7/14/2008 7.0 <0.3 <0.05 23.6 <0.5 16.6 -6.6 14.1 <5 jaw
8/18/2008 7.1 <0.3 <0.05 <20.0 <0.5 17.4 -10.8 9.0 <5 jaw
Davis Hollow Marina Control Stream - Downstream Monitoring Point
DHM-2
Date pH Iron (total) Manganese Sulfate Aluminum Alkalinity Acidity
Flow (gpm) TSS
Collected by:
4/21/2008 6.4 <0.3 <0.05 24.5 <0.5 10 4.2 197 <3 jaw
5/19/2008 6.7 <0.3 <0.05 30.1 <0.5 11.6 10.6 197 <5 jaw
6/16/2008 7.0 <0.3 0.059 25.8 <0.5 18.4 7.8 26 <5 jaw
7/14/2008 7.2 <0.3 0.065 <20.0 <0.5 18.6 -5.2 29.2 <5 jaw
8/18/2008 7.2 0.91 0.057 <20.0 <0.5 19.8 -10.6 3.8 <5 jaw
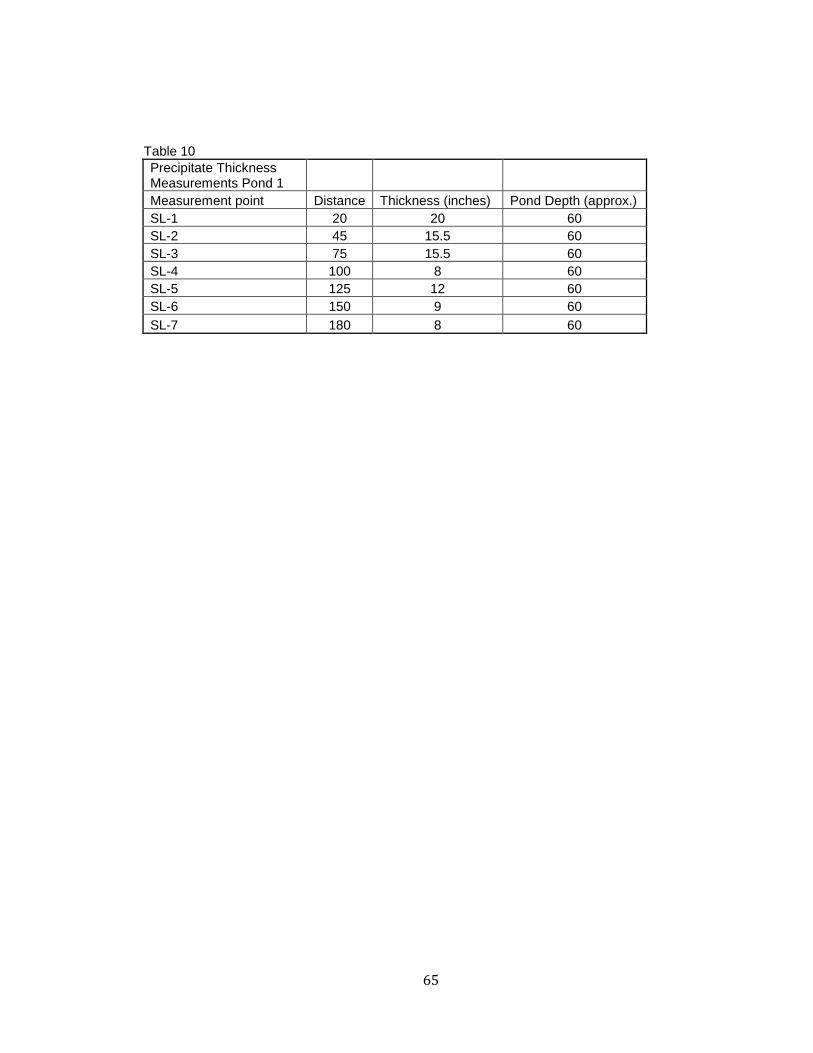
65
Table 10 Precipitate Thickness Measurements Pond 1
Measurement point Distance Thickness (inches) Pond Depth (approx.)
SL-1 20 20 60
SL-2 45 15.5 60
SL-3 75 15.5 60
SL-4 100 8 60
SL-5 125 12 60
SL-6 150 9 60
SL-7 180 8 60

66
Appendix 2
Monitoring Point Location Maps
Figure 16 and Figure 17
Data Graphs
Figures 22 through 43

67
Figure 16 - Barkley Road Passive Wetlands Treatment System Monitoring Locations North ↑From: PAMAP Program Bureau of Topographic and Geologic Survey Pennsylvania Department of Conservation and Natural Resources (2007)
Burton Road
Untreated Discharge (MDJ-1)
Pond 3 Outlet (MSP-3)
Pond 2 Outlet (MSP-2)
Pond 1 Outlet (MSP-1)

68
Figure 17 - Davis Hollow Monitoring Point Locations North ↑From: PAMAP Program Bureau of Topographic and Geologic Survey Pennsylvania Department of Conservation and Natural Resources (2007)
Upstream Monitoring Location
(DHM-1)
Downstream Monitoring Location
(DHM-2)
Davis Hollow Cabin

69
Figure 24
Moraine State Park Office Weather Station
0.00
0.50
1.00
1.50
2.00
2.50
3.00
1/1/
2007
2/1/
2007
3/1/
2007
4/1/
2007
5/1/
2007
6/1/
2007
7/1/
2007
8/1/
2007
9/1/
2007
10/1
/200
7
11/1
/200
7
12/1
/200
7
1/1/
2008
2/1/
2008
3/1/
2008
4/1/
2008
5/1/
2008
6/1/
2008
7/1/
2008
8/1/
2008
9/1/
2008
Pre
cip
itatio
n (
inches)

70
Figure 25
Monthly Total Precipitation - Moraine State Park Station
0
1
2
3
4
5
6
7
8
9
10
Jan-07
Feb-07
Mar-07
Apr-07
May-07
Jun-07
Jul-07
Aug-07
Sep-07
Oct-07
Nov-07
Dec-07
Jan-08
Feb-08
Mar-08
Apr-08
May-08
Jun-08
Jul-08
Aug-08
Sep-08
Inch
es

71
Figure 26
Precipitation Departure from Normal
-3
-2
-1
0
1
2
3
4
5
6
Jan-07
Feb-07
Mar-07
Apr-07
May-07
Jun-07
Jul-07
Aug-07
Sep-07
Oct-07
Nov-07
Dec-07
Jan-08
Feb-08
Mar-08
Apr-08
May-08
Jun-08
Jul-08
Aug-08
Sep-08
Pre
cipi
tatio
n (in
ches
abo
ve o
r be
low
nor
mal
)

72
Figure 27
Precipitation Compared to Flow at Wetalnds Treatment Ponds
0
0.2
0.4
0.6
0.8
1
1.2
1.4
1.6
1.8
3/1
/20
08
3/1
5/2
00
8
3/2
9/2
00
8
4/1
2/2
00
8
4/2
6/2
00
8
5/1
0/2
00
8
5/2
4/2
00
8
6/7
/20
08
6/2
1/2
00
8
7/5
/20
08
7/1
9/2
00
8
8/2
/20
08
8/1
6/2
00
8
8/3
0/2
00
8
9/1
3/2
00
8
9/2
7/2
00
8
Pre
cip
itatio
n (
inch
es)
0
10
20
30
40
50
60
Flo
w (
gp
m)
Precipitation
Flow MSP-1 (gpm)
Flow MSP-2
Flow MSP-3

73
Figure 28
0
500
1000
1500
2000
2500
0
0.2
0.4
0.6
0.8
1
1.2
1.4
1.6
1.8
Flo
w (g
pm
)
Pre
cip
itatio
n (in
ches)
Comparison of Precipitation to Flow
Precipitation
DHM-1 Flow (gpm)

74
Figure 29
Precipitation compared to f low from MSP-2
0
0.2
0.4
0.6
0.8
1
1.2
1.4
1.6
1.8
3/1/
2008
3/15
/200
8
3/29
/200
8
4/12
/200
8
4/26
/200
8
5/10
/200
8
5/24
/200
8
6/7/
2008
6/21
/200
8
7/5/
2008
7/19
/200
8
8/2/
2008
8/16
/200
8
8/30
/200
8
9/13
/200
8
9/27
/200
8
Pre
cip
itatio
n (
inches)
0
5
10
15
20
25
30
35
Flo
w (
gpm
)
Precipitation
MSP-2

75
Figure 30
10
20
30
40
50
60
70
80
90
100
2/22/2008 4/12/2008 6/1/2008 7/21/2008 9/9/2008 10/29/2008
Degre
es F
ahre
nheit
Temperature All Monitoring Locations
MDJ-1
MSP Pond-1
MSP Pond-2
MSP Pond-3
MSPDHM-1
MSPDHM-2
Ambient Air High
Ambient Air Low

76
Figure 31
Flow from ponds w ith Rodent affects removed
0
10
20
30
40
50
60
2/22/2008 4/12/2008 6/1/2008 7/21/2008 9/9/2008 10/29/2008
g.p
.m.
MSP Pond-1
MSP Pond-2
MSP Pond-3
MDJ-1

77
Figure 32
Flow for Control Streaml Monitoring Points
0.0
500.0
1000.0
1500.0
2000.0
2500.0
2/22/2008 4/12/2008 6/1/2008 7/21/2008 9/9/2008 10/29/2008
Gal
lons
per
min
ute
MSPDHM-1
MSPDHM-2

78
Figure 33 – Graph of pH of Control Stream
Laboratory pH of control stream
5.5
6.0
6.5
7.0
7.5
2/22/2008 4/12/2008 6/1/2008 7/21/2008 9/9/2008
pH
(s.u
.)
DHM-1
DHM-2

79
Figure 34 – Graph of Control Stream Alkalinity vs. Acidity
Comparison of Contol Stream Alkalinity vs. Acidity
-15
-10
-5
0
5
10
15
20
25
2/22/2008 3/13/2008 4/2/2008 4/22/2008 5/12/2008 6/1/2008 6/21/2008 7/11/2008 7/31/2008 8/20/2008 9/9/2008
Concentr
ato
n in
mg/l
DHM-1 Alkalinity
DHM-1 Acidity
DHM-2 Alkalinity
DHM-2 Acidity

80
Figure 35
pH ponds compare to untreated discharge
4
4.5
5
5.5
6
6.5
7
2/22/2008 4/12/2008 6/1/2008 7/21/2008 9/9/2008
pH
(s.u
.)
MSP-1
MSP-2
MSP-3
MDJ-1
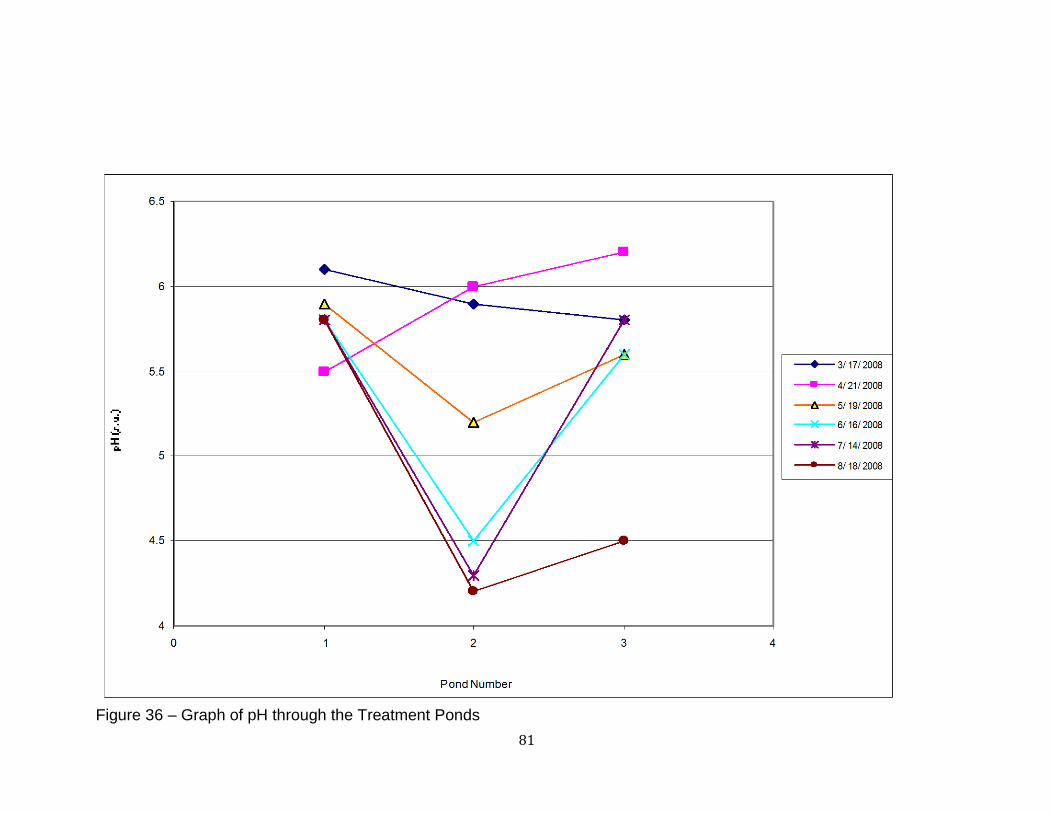
81
Figure 36 – Graph of pH through the Treatment Ponds

82
Figure 37
Iron
0
5
10
15
20
25
30
35
2/22/2008 4/12/2008 6/1/2008 7/21/2008 9/9/2008
Concentr
atio
n in
mg/l
MSP-1
MSP-2
MSP-3
MDJ-1
PA Limit (7 mg/l)

83
Figure 38
Iron concentration through the treatment system
0
5
10
15
20
25
30
35
40
MSP-1 MSP-2 MSP-3
8/28/1996
3/17/2008
4/21/2008
5/19/2008
6/16/2008
7/14/2008
8/18/2008

84
Figure 39
pH All Monitoring Points
3
3.5
4
4.5
5
5.5
6
6.5
7
7.5
8
2/22/2008 4/12/2008 6/1/2008 7/21/2008 9/9/2008 10/29/2008
pH
(s.u
.)
MDJ-1
MSP Pond-1
MSP Pond-2
MSP Pond-3
DHM-1
DHM-2

85
Figure 40
0
5
10
15
20
25
30
35
4/2/08 4/22/08 5/12/08 6/1/08 6/21/08 7/11/08 7/31/08 8/20/08 9/9/08
4
4.5
5
5.5
6
6.5
MSP-1 Iron
MSP-2 Iron
MSP-3 Iron
pH MSP-1
pH MSP-2
pH MSP-3

86
Figure 41 .
Manganese
0
1
2
3
4
5
6
2/22/20
08
3/13/20
08
4/2/200
8
4/22/20
08
5/12/20
08
6/1/200
8
6/21/20
08
7/11/20
08
7/31/20
08
8/20/20
08
9/9/200
8
Concentr
atio
n in
mg/l
MSP-1
MSP-2
MSP-3
MDJ-1
PA Limit (5 mg/l)
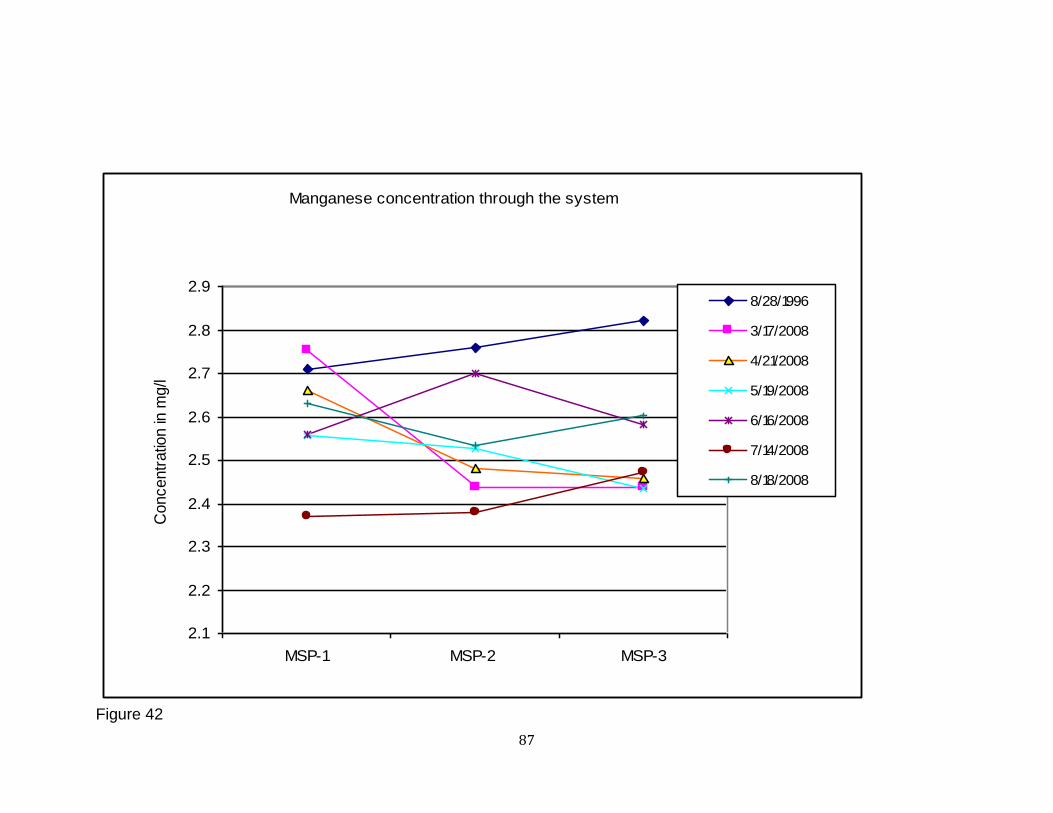
87
Figure 42
Manganese concentration through the system
2.1
2.2
2.3
2.4
2.5
2.6
2.7
2.8
2.9
MSP-1 MSP-2 MSP-3
Concentr
atio
n in
mg/l
8/28/1996
3/17/2008
4/21/2008
5/19/2008
6/16/2008
7/14/2008
8/18/2008

88
Figure 43
Sulfate
175
195
215
235
255
275
295
315
2/22/2008 4/12/2008 6/1/2008 7/21/2008 9/9/2008
MSP-1
MSP-2
MSP-3
MDJ-1

89
Figure 44
Sulfate concentration through the system
200
220
240
260
280
300
320
340
MSP-1 MSP-2 MSP-3
Concentr
atio
n in
mg/l
8/28/1996
3/17/2008
4/21/2008
5/19/2008
6/16/2008
7/14/2008
8/18/2008

90
Figure 45
20
15.5 15.5
8
12
9 8
0
10
20
30
40
50
60
70
0 10 20 30 40 50 60 70 80 90 100 110 120 130 140 150 160 170 180
Dep
th in
In
ch
es
SL-1 SL-2 SL-3 SL-4 SL-5 SL-6 SL-7
Diagram of Precipitate Thickness and Pond Depth Pond 1
Precipitate Thickness (inches)
Pond Water Level (approx.)

91