current state of the non-banking sector ... - · pdf file4 2. loan portfolio as of 1 april...
TRANSCRIPT

1
National Bank of the Republic of Kazakhstan
CURRENT STATE OF THE
NON-BANKING SECTOR OF
KAZAKHSTAN
AS OF 1 APRIL 2015
Almaty 2015
2
Tables of Contents
THE STRUCTURE OF NON-BANKING SECTOR OF KAZAKHSTAN...................................................... 3
I. CURRENT STATE OF THE MORTGAGE ORGANIZATIONS ...................................................... 3
1. ASSETS ...................................................................................................................................................... 3
2. LOAN PORTFOLIO ................................................................................................................................... 4
3. LIABILITITES ........................................................................................................................................... 5
4. CAPITAL ...................................................................................................................................................... 5
5. EFFICENCY OF THE MORTGAGE ORGANIZATIONS ......................................................................... 6
II. CURRENT STATE OF THE NON-BANKING SECTOR ..................................................................... 8
1. ASSETS .......................................................................................................................................................... 8
2. LOAN PORTFOLIO ...................................................................................................................................... 8
3. LIABILITITES ............................................................................................................................................... 9
4. CAPITAL ..................................................................................................................................................... 10
5. EFFICENCY OF THE NON-BANKING ORGANIZATION’S ACTIVITY ............................................ 11
3
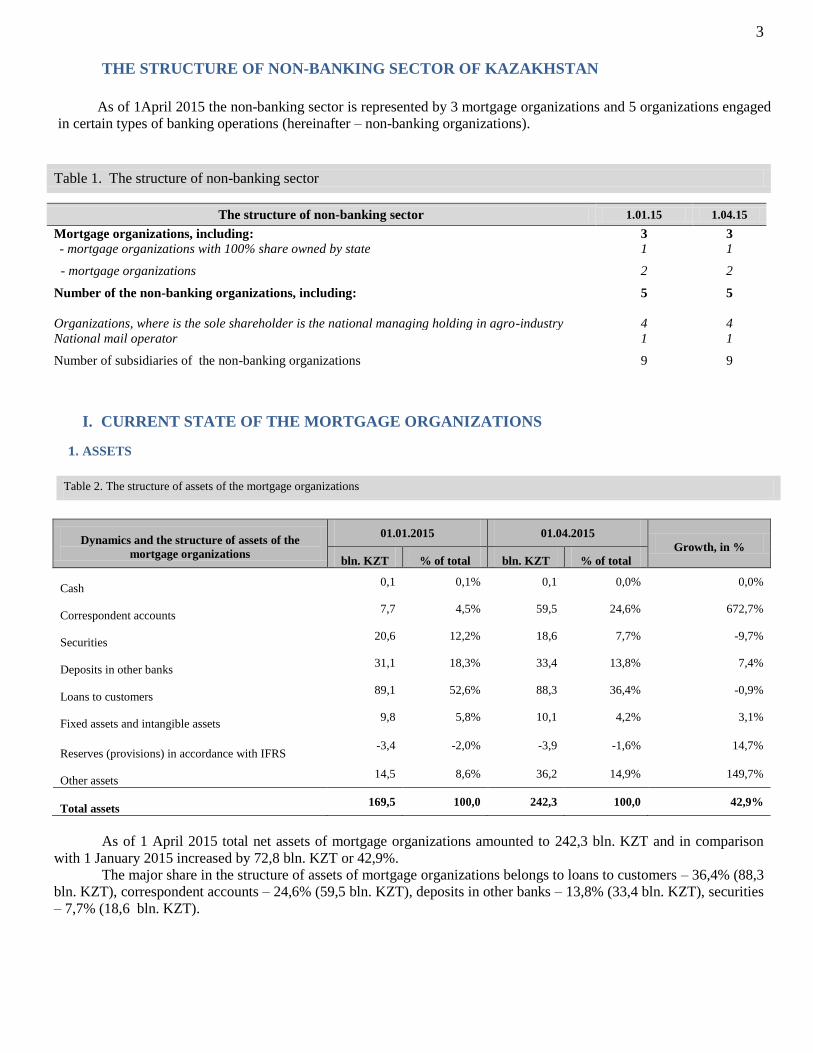
THE STRUCTURE OF NON-BANKING SECTOR OF KAZAKHSTAN
The structure of non-banking sector 1.01.15 1.04.15
Mortgage organizations, including: 3 3
- mortgage organizations with 100% share owned by state 1 1
- mortgage organizations 2 2
Number of the non-banking organizations, including: 5 5
Organizations, where is the sole shareholder is the national managing holding in agro-industry 4 4
National mail operator 1 1
Number of subsidiaries of the non-banking organizations 9 9
I. CURRENT STATE OF THE MORTGAGE ORGANIZATIONS
1. ASSETS
Dynamics and the structure of assets of the
mortgage organizations
01.01.2015 01.04.2015
Growth, in %
bln. KZT % of total bln. KZT % of total
Cash 0,1 0,1% 0,1 0,0% 0,0%
Correspondent accounts 7,7 4,5% 59,5 24,6% 672,7%
Securities 20,6 12,2% 18,6 7,7% -9,7%
Deposits in other banks 31,1 18,3% 33,4 13,8% 7,4%
Loans to customers 89,1 52,6% 88,3 36,4% -0,9%
Fixed assets and intangible assets 9,8 5,8% 10,1 4,2% 3,1%
Reserves (provisions) in accordance with IFRS -3,4 -2,0% -3,9 -1,6% 14,7%
Other assets 14,5 8,6% 36,2 14,9% 149,7%
Total assets 169,5 100,0 242,3 100,0 42,9%
As of 1 April 2015 total net assets of mortgage organizations amounted to 242,3 bln. KZT and in comparison
with 1 January 2015 increased by 72,8 bln. KZT or 42,9%.
The major share in the structure of assets of mortgage organizations belongs to loans to customers – 36,4% (88,3
bln. KZT), correspondent accounts – 24,6% (59,5 bln. KZT), deposits in other banks – 13,8% (33,4 bln. KZT), securities
– 7,7% (18,6 bln. KZT).
Table 1. The structure of non-banking sector
Table 2. The structure of assets of the mortgage organizations
As of 1April 2015 the non-banking sector is represented by 3 mortgage organizations and 5 organizations engaged
in certain types of banking operations (hereinafter – non-banking organizations).
4
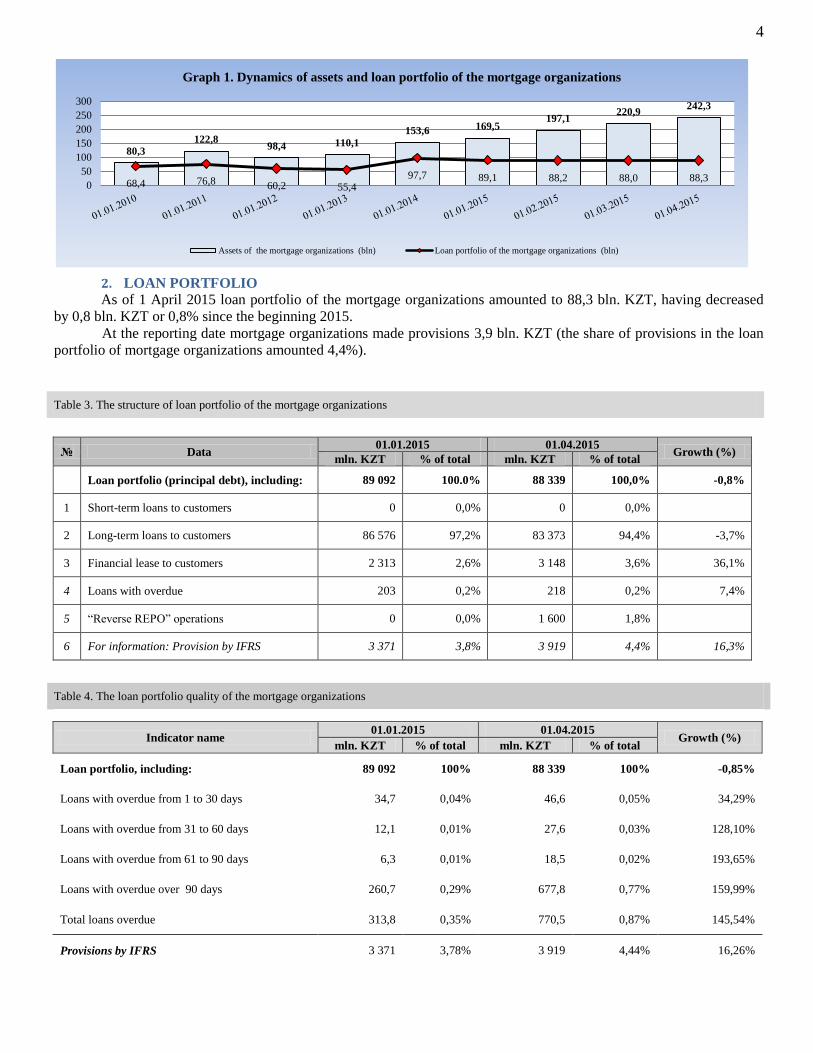
2. LOAN PORTFOLIO
As of 1 April 2015 loan portfolio of the mortgage organizations amounted to 88,3 bln. KZT, having decreased
by 0,8 bln. KZT or 0,8% since the beginning 2015.
At the reporting date mortgage organizations made provisions 3,9 bln. KZT (the share of provisions in the loan
portfolio of mortgage organizations amounted 4,4%).
№ Data 01.01.2015 01.04.2015
Growth (%) mln. KZT % of total mln. KZT % of total
Loan portfolio (principal debt), including: 89 092 100.0% 88 339 100,0% -0,8%
1 Short-term loans to customers 0 0,0% 0 0,0%
2 Long-term loans to customers 86 576 97,2% 83 373 94,4% -3,7%
3 Financial lease to customers 2 313 2,6% 3 148 3,6% 36,1%
4 Loans with overdue 203 0,2% 218 0,2% 7,4%
5 “Reverse REPO” operations 0 0,0% 1 600 1,8%
6 For information: Provision by IFRS 3 371 3,8% 3 919 4,4% 16,3%
Table 4. The loan portfolio quality of the mortgage organizations
Indicator name 01.01.2015 01.04.2015
Growth (%) mln. KZT % of total mln. KZT % of total
Loan portfolio, including: 89 092 100% 88 339 100% -0,85%
Loans with overdue from 1 to 30 days 34,7 0,04% 46,6 0,05% 34,29%
Loans with overdue from 31 to 60 days 12,1 0,01% 27,6 0,03% 128,10%
Loans with overdue from 61 to 90 days 6,3 0,01% 18,5 0,02% 193,65%
Loans with overdue over 90 days 260,7 0,29% 677,8 0,77% 159,99%
Total loans overdue 313,8 0,35% 770,5 0,87% 145,54%
Provisions by IFRS 3 371 3,78% 3 919 4,44% 16,26%
80,3 122,8
98,4 110,1
153,6 169,5 197,1
220,9 242,3
68,4 76,8 60,2 55,4 97,7 89,1 88,2 88,0 88,3
0
50
100
150
200
250
300
Graph 1. Dynamics of assets and loan portfolio of the mortgage organizations
Assets of the mortgage organizations (bln) Loan portfolio of the mortgage organizations (bln)
Table 3. The structure of loan portfolio of the mortgage organizations
5
As of 1 April 2015 the share of overdue loans (including overdue interest) in the total loan portfolio of mortgage
organizations amounted 0,87% (or 770,5 mln. KZT). Loans with overdue over 90 days at the reporting date amounted to
677,8 mln. KZT or 0,77% of the loan portfolio.
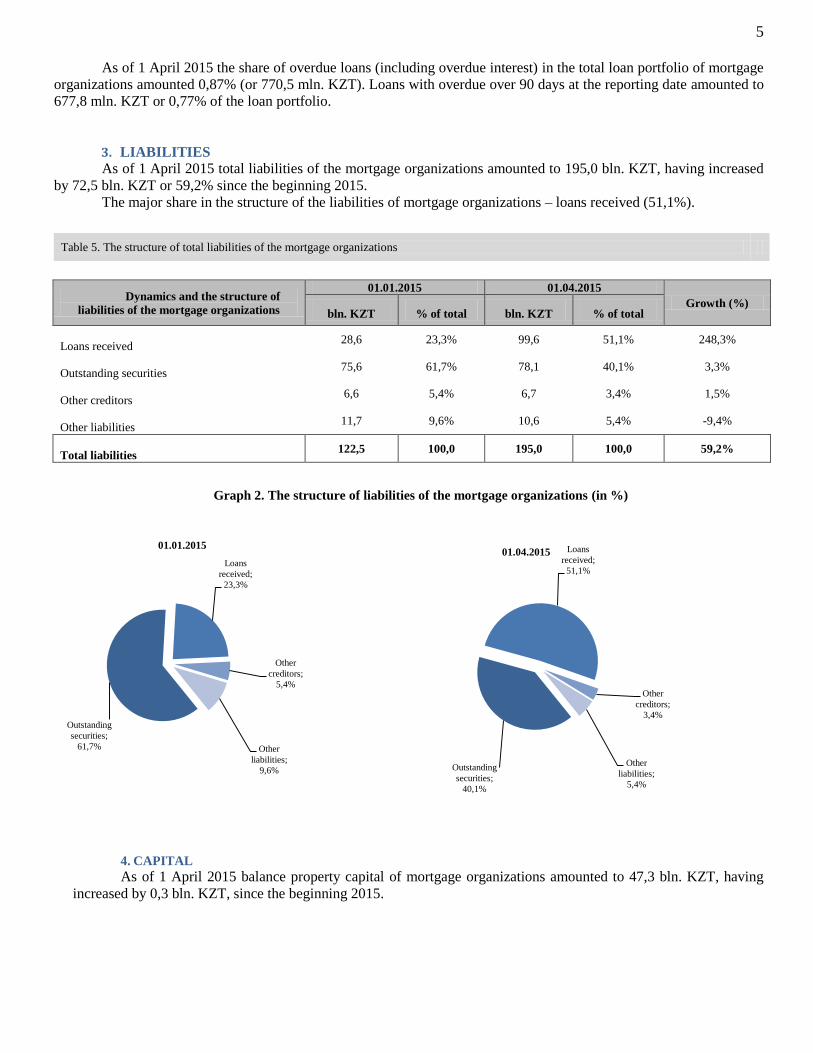
3. LIABILITIES
As of 1 April 2015 total liabilities of the mortgage organizations amounted to 195,0 bln. KZT, having increased
by 72,5 bln. KZT or 59,2% since the beginning 2015.
The major share in the structure of the liabilities of mortgage organizations – loans received (51,1%).
Dynamics and the structure of
liabilities of the mortgage organizations
01.01.2015 01.04.2015
Growth (%) bln. KZT % of total bln. KZT % of total
Loans received 28,6 23,3% 99,6 51,1% 248,3%
Outstanding securities 75,6 61,7% 78,1 40,1% 3,3%
Other creditors 6,6 5,4% 6,7 3,4% 1,5%
Other liabilities 11,7 9,6% 10,6 5,4% -9,4%
Total liabilities 122,5 100,0 195,0 100,0 59,2%
Graph 2. The structure of liabilities of the mortgage organizations (in %)
4. CAPITAL
As of 1 April 2015 balance property capital of mortgage organizations amounted to 47,3 bln. KZT, having
increased by 0,3 bln. KZT, since the beginning 2015.
Outstanding
securities;
61,7%
Loans
received;
23,3%
Other
creditors;
5,4%
Other
liabilities;
9,6%
01.01.2015
Outstanding
securities;
40,1%
Loans
received;
51,1%
Other
creditors;
3,4%
Other
liabilities;
5,4%
01.04.2015
Table 5. The structure of total liabilities of the mortgage organizations

6
As of 1 April 2015 calculated own capital amounted to 52,5 bln. KZT, as of 1 January 2015 – 52,2 bln. KZT.
Ratios 01.01.2015 01.04.2015
Paid up share capital (including additional capital), KZT bln. 63,2 62,2
Calculated own capital, KZT bln. 52,2 52,5
Capital adequacy ratio (k1>=0,06) 0,274 0,197
Capital adequacy ratio (k1-2>=0,06) 0,315 0,217
Capital adequacy ratio (k1-3>=0,12) 0,354 0,237
5. EFFICENCY OF THE MORTGAGE ORGANIZATIONS
Profitability of the mortgage organizations
01.04.2014 01.04.2015
Growth, % KZT, bln. KZT, bln.
Interest income 4,0 4,4 10,0
Interest expenses 3,1 3,2 3,2
Non-interest income -0,1 0,2 -300,0
Non-interest expenses 0,5 0,6 20,0
Provisions (recovery of provision) for possible losses on
transactions -0,3 0,2 -166,7
Income tax expenses 0 0,3
Net profit (loss) 0,6 0,3 -50,0
-23 000
-18 000
-13 000
-8 000
-3 000
2 000
7 000
12 000
17 000
22 000
27 000
32 000
37 000
42 000
47 000
52 000
57 000
62 000
67 000Graph 3. Capital structure of mortgage organizations (KZT, bln)
Authorized capital
Reserve capital
Undistributed net income (loss) of the
current year
Undistributed net income (loss) of the
previous year
Table 6. Capital adequacy ratios
Table 7. Profitability of the mortgage organizations

7
As of 1 April 2015 net profit of the mortgage organizations amounted to 0,3 bln. KZT.
0,3 0,1
1,3
0,1 0,3 0,3
0
2
Graph 4. Profit (loss) of the mortgage organizations (in KZT, bln.)
8
II. CURRENT STATE OF THE NON-BANKING SECTOR
1. ASSETS
Dynamics and the structure of assets of the
non-banking organizations
01.01.2015 01.04.2015 Growth, in %
KZT bln. % of total KZT bln. % of total
Cash 56,1 8,8 66,9 10,2 19,3
Deposits placed with other banks 23 3,6 7,6 1,2 -67,0
Securities 11,7 1,8 11,4 1,7 -2,6
Lending 204,3 32,1 212,4 32,3 4,0
Financial lease 157,4 24,7 156,1 23,7 -0,8
Investments in the capital of other legal entities and
subordinated debt 24,8 3,9 25,1 3,8 1,2
Account receivable 52,1 8,2 67,4 10,2 29,4
Other assets 106,7 16,8 111,1 16,9 4,1
Total assets 636,1 100,0 658,0 100,0 3,4
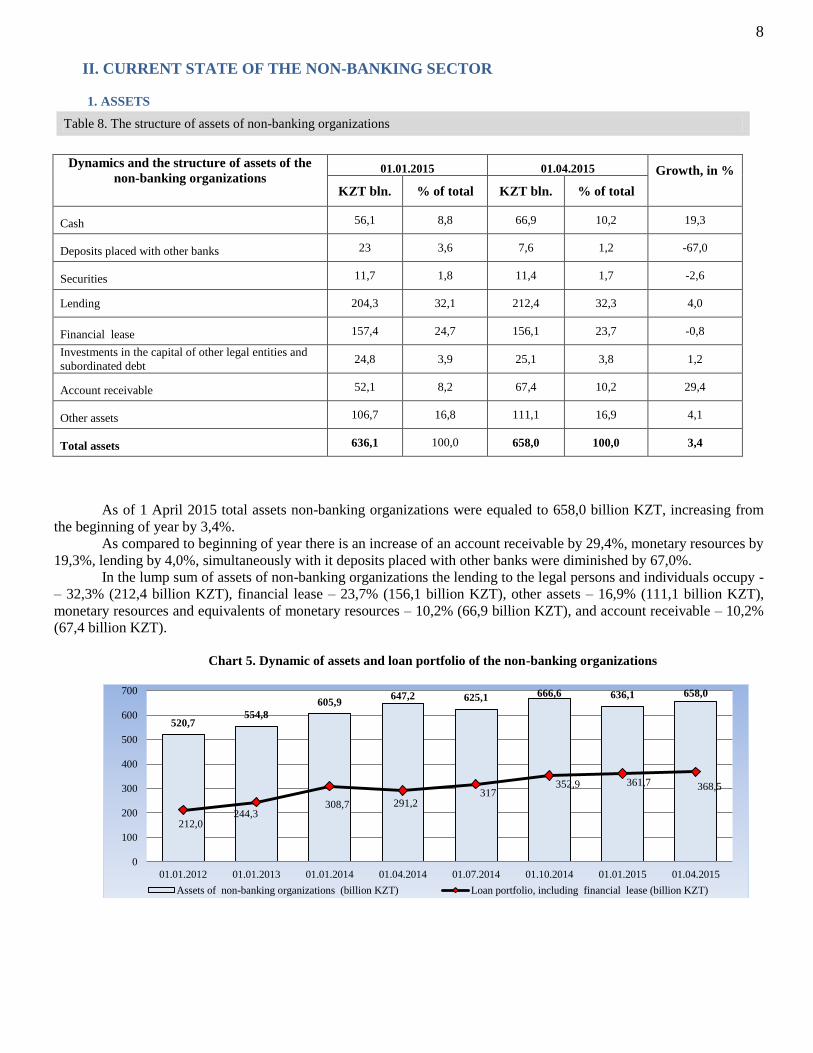
As of 1 April 2015 total assets non-banking organizations were equaled to 658,0 billion KZT, increasing from
the beginning of year by 3,4%.
As compared to beginning of year there is an increase of an account receivable by 29,4%, monetary resources by
19,3%, lending by 4,0%, simultaneously with it deposits placed with other banks were diminished by 67,0%.
In the lump sum of assets of non-banking organizations the lending to the legal persons and individuals occupy -
– 32,3% (212,4 billion KZT), financial lease – 23,7% (156,1 billion KZT), other assets – 16,9% (111,1 billion KZT),
monetary resources and equivalents of monetary resources – 10,2% (66,9 billion KZT), and account receivable – 10,2%
(67,4 billion KZT).
Chart 5. Dynamic of assets and loan portfolio of the non-banking organizations
520,7 554,8
605,9 647,2 625,1 666,6 636,1 658,0
212,0 244,3
308,7 291,2 317
352,9 361,7 368,5
0
100
200
300
400
500
600
700
01.01.2012 01.01.2013 01.01.2014 01.04.2014 01.07.2014 01.10.2014 01.01.2015 01.04.2015
Assets of non-banking organizations (billion KZT) Loan portfolio, including financial lease (billion KZT)
Table 8. The structure of assets of non-banking organizations

9
2. LOAN PORTFOLIO
As of 1 April 2015 the combined loan portfolio (taking into account a financial lease) of non-banking
organizations made 368,5 billion KZT, that the more index folded on beginning 2014 year, by 6,8 billion KZT or 1,9%.
Provisions, formed on a loan portfolio in accordance with the requirements of International Financial Reporting
Standards accounted 33,4 billion KZT or 9,1% from the combined loan brief-case of non-banking organizations, and as
compared to 01.01.2015 were decreased by 2,9%.
Table 9. Loan portfolio quality of the non-banking organizations
Data
Growth in
% bln. KZT % of total bln. KZT % of total
Total loan portfolio, including financial lease 361,7 100 368,5 100 1,9
Loans with overdue from 1 to 30 days 2,9 0,8 1,6 0,4 -44,8
Loans with overdue from 31 to 60 days 3,4 0,9 1,2 0,3 -64,7
Loans with overdue from 61 to 90 days 0,4 0,1 1,6 0,4 300,0
Loans with overdue over 90 days 43,2 11,9 49,3 13,4 14,1
Total loans overdue 49,8 13,8 53,7 14,6 7,8
Reserves (provisions) in accordance with the requirements of International Financial Reporting Standards
34,4 9,5 33,4 9,1 -2,9
The share of overdue debts (including an overdue reward) in the total loan portfolio of non-banking
organizations on 01.04.2015 was amounted to 14,6% (or 53,7 billion KZT), including outstanding debt, that over 90
days is of 13,4% (or 49,3 billion KZT).
Outstanding debt on a basic debt and reward with a term from 1 to 30 days makes 0,4% from a loan portfolio,
from 31 to 60 days - 0,3%, from 61 to 90 days - 0,4%.
Outstanding debt on a basic debt and reward with a term over 90 days upon the current date accounted 49,3
billion KZT or 13,4% from a loan portfolio, increasing from the beginning of 2015 by 14,1%.
3. LIABILITITES
The total liabilities of non-banking organizations on comparison with the beginning 2015 year, was increased by
18,0 billion KZT or 5,4% and on the state on April 1, 2015 amounted to 354,1 billion KZT.
As compared to beginning of year in the structure of liabilities of non-banking organizations there is an increase
of outstanding securities by 21,0%, attracted deposits by 8,2%, and other liabilities by 11,0%, thus account payable was
diminished by 1,6%.
In the structure of liabilities of non-banking organizations borrowings were prevailed (60,9%).
Table 10. The structure of total liabilities of the non-banking organizations
The structure and dynamics of the non-banking organization’s liabilities
01.01.2015 01.04.2015 Growth in %
bln. KZT % of total bln. KZT % of total
Deposits attracted 20,8 6,2 22,5 6,4 8,2
Borrowings 214,6 63,9 215,7 60,9 0,5
Outstanding securities 64,8 19,3 78,4 22,1 21,0
Account payable 18,6 5,5 18,3 5,2 -1,6
Other liabilities 17,3 5,1 19,2 5,4 11,0

10
Total liabilities 336,1 100,0 354,1 100,0 5,4
Chart 6. Liability mix of non-banking organizations.
01.01.2015 01.04.2015
4. CAPITAL
Balance property capital of non-banking organizations on the state on April 1, 2015 amounted to 303,9 KZT
billion, that is more index, folded on January, 1, 2015 on 3,9 billion KZT or 1,3%.
Chart 7. The structure of capital of the non-banking organizations
Deposits
attracted; 6,2
Borrowings;
63,9
Outstanding
securities ;
19,3
Account
payable; 5,5
Other
liabilities; 5,1 Deposits
attracted; 6,4
Borrowings;
60,9
Outstanding
securities ;
22,1
Account
payable; 5,2
Other
liabilities; 5,4
-25
5
35
65
95
125
155
185
215
245
275 Other provizions
Authorized capital
Bonuses(additional prepaid capital)
Reserve capital
Undistributed net income (Loss) of the
current year
Undistributed net income (Loss) of the
previous year

11
Capital adequacy ratios of the branch organizations
of the national managing holding
01.01.2015 01.04.2015
1 2 3
Paid up share capital, billion KZT 276,4 277,9
Calculated capital, billion KZT 267,1 270,5
Capital adequacy ratio (к1) 0,489 0,491
Capital adequacy ratio (к1-2) 0,606 0,583
Capital adequacy ratio (к1-3) 0,542 0,510
Capital adequacy ratios of National operator of mail 01.01.2015 01.04.2015
Capital, billion KZT 12,6 12,6
Capital adequacy ratio 0,240 0,219
Current liquidity ratio 0,473 0,478
As of 1 April 2015 the size of regulatory capital of branch organizations of the national managing holding in
the agricultural sector was amounted to 270,5 billion KZT. Whereas at the beginning of 2015 this index was
amounted to 267,1 billion KZT.
Upon the current date the capital of National operator of mail was made 12,6 billion KZT.
5. EFFICENCY OF THE NON-BANKING ORGANIZATION’S ACTIVITY
Income of the non-banking organizations, bln. KZT1 01.04.2014
bln. KZT
01.04.2015
bln. KZT Growth in %
Total income, including: 21,7 14,2 -34,6
Interest income 7,5 9 20,0
Non-interest income 0,4 0,3 -25,0
Other income 13,8 4,9 -64,5
Total expenses, including: 15,5 11,4 -26,5
Interest expenses 3,9 4 2,6
Non-interest expenses 0 2,8
Other expenses 11,5 4,6 -60,0
Profit (loss) before allocation to reserves 6,2 2,8 -54,8
Provisions (recovery of provision) for possible losses on transactions 2,5 2,4 -4,0
Income tax 0,8 -0,1 -112,5
Net profit (loss) 2,9 0,5 -82,8
1 According to Statement of profit or loss
Table 11. Capital adequacy ratios
Table 12. Profitability of the non-banking organizations

12
As of 01.04.2015 non-banking organizations’ profit was amounted to 0,5 KZT billion.
Chart 8. Profitability of the non-banking organizations, KZT billion
4,6 2,9
2
6,9 6,8
0,5
-1
1
3
5
7
9
01.01.2014 01.04.2014 01.07.2014 01.10.2014 01.01.2015 01.04.2015