current status and future of contents membrane process in korea
TRANSCRIPT

2009-03-02
1
Current Status and Future of Membrane Process in KOREA
Eun Namkung, Ph.D.Professor, Myongji University Director, Eco-STAR Project, Korea MOE
1. Background
Contents
2. Current Status of Wastewater Works
3. Future Directions – Membrane Process
4. Eco-STAR Project
Water Quality in Four Major Rivers Background of Korean Water & Wastewater Works
4
Water Works – The 1st Drinking Water Treatment Plant (DWTP) in 1908
Wastewater Works – The 1st
Sewage Treatment Plant (STP) in 1976

2009-03-02
2
Rapid Industrialization and Urbanization since
1960s till present
US$100 to US$20,000
Three Phases of Sewerage Development in Korea
Phase 1 – BOD/SS (late 1976 – 1990)Phase 2 – TN/TP (early 1990 – mid 2000) Phase 3 – Micropollutants (late 2000 -
2015)
Policy Classification pH BOD(㎎/L)
CODmn(㎎/L)
SS(㎎/L)
TN(㎎/L)
TP(㎎/L)
E-coli(CFU/100㎖)
'64.10 PollutionPrevention Act
Activated Sludge Process,Trickling filter Process etc
≥ 5.8≤ 8.6 ≤ 20 ≤ 70 ≤3,000
High-rate Trickling filter ProcessModified Aeration process etc
≥ 5.8≤ 8.6 ≤ 60 ≤ 120 ≤ 3,000
Sedimentation ≥ 5.8≤ 8.6 ≤ 120 ≤ 150 ≤ 3,000
Others ≥ 5.8≤ 8.6 ≤ 150 ≤ 200 ≤ 3,000
'78.7EnvironmentConservationAct
≤ 30 ≤ 70
'91.2Water QualityConservationAct
~ '95. 12. 31 ≤ 30 ≤ 70
'96. 1. 1. ~ ≤ 20 ≤ 20 ≤ 120 ≤ 8
'93.7Water QualityConservationAct
~ '95. 12. 31 ≤ 30 ≤ 50 ≤ 70
'96. 1. 1. ~ ≤ 20 ≤ 40 ≤ 20 ≤ 120 ≤ 8
'00.10Water QualityConservationAct
Specific Areas & Jamsil Area < 10 < 40 < 10 < 20 < 2
Other Areas < 20 < 40 < 20 < 60 < 8
'01.10 Sewerage LawSpecific Areas ≤ 10 ≤ 40 ≤ 10 ≤ 20 ≤ 2 ≤ 3,000
Other Areas < 20 < 40 < 20 ≤ 60 ≤ 8 ≤ 3,000
'07.10 Sewerage LawSpecific Areas ≤ 10 ≤ 40 ≤ 10 ≤ 20 ≤ 2 ≤ 3,000
Other Areas < 20 < 40 < 20 ≤ 60 ≤ 8 ≤ 3,000
Effluent Quality Standards Concept of Sewage Treatment
8
2009-03-02
3
New Policies in Water Quality Management “Clean Water, Eco River 2015”
- Fishable and Swimmable Water Environment Vision & Policy
announced by Ministry of Environment
which requires more stringent effluent quality standards.
10
“Total Water Pollution Load Management System(TWPLMS)”
- Which was implemented to improve water quality
in four major rivers and its basins. The TWPLMS requires
more advanced sewage treatment in order to lower their
total pollution load (currently BOD based, but additional TP
criteria would be included from 2011).
11
“Water Reclamation and Reuse Policy”
- Scheme supported by Korean government as "The Third Water Utility."
12

2009-03-02
4
Current Status of Wastewater Works in
Korea
Wastewater Service – STP Based
Classification ’97 ’98 ’99 ’00 ’01 ’02 ’03 ’04 ’05 ’06Service population
(thousand) 28,559 31,099 32,539 33,843 35,369 36,760 38,449 39,924 41,157 42,113
Capacity(thousand m3/day) 15,038 16,616 17,712 18,400 19,230 20,233 20,954 21,617 22,568 23,160
Percentage of sewered population(%) 60.3 65.9 68.4 70.5 73.2 75.8 78.8 81.4 83.5 85.7
0
5,000
10,000
15,000
20,000
25,000
30,000
'97 '98 '99 '00 '01 '02 '03 '04 '05 '060102030405060708090100
Capacity(thousand m3/day)Percentage of sewered population(%)
15,038 16,616 17,712 18,400 19,230 20,23 20,95 21,617 22,568 23,16060.365.9 68.4 70.5
73.2 75.878.8 81.4 83.5 85.7
18400 19230 19976 20885 21536 22387 23160
266.7 1063.3 4016 4969 6681 8457 101071.4%
5.5%
20.1% 23.8%31.0%
37.8%43.6%
0
5000
10000
15000
20000
25000
2000 2001 2002 2003 2004 2005 2006
시설용량(천톤/일)
0%
20%
40%
60%
80%
전체 고도 고도처리비율
172 184201
242268
294
344
13 22 40 76111
152194
7.6%12.0%
19.9%
31.4%
41.4%
51.7%56.4%
0
100
200
300
2000 2001 2002 2003 2004 2005 2006
개소수
0%
20%
40%
60%
80%
15
Status of Advanced Sewage Treatment
Capacity(103 m3/day)
Number of plantsTypical Treatment Process
Influent Bar screen
Grit chamber
Primary clarifier
Aeration tank
Secondary clarifier
Chlorine-contact
tankEffluent
Screenings GritPump
(typical)
Belt thickener
Supernatant return
Anaerobic digester
Dewatered sludge
Belt press
Return sludge
O2
Cl2
< Activated sludge >

2009-03-02
5
Nitrogen & Phosphorus Removal
Anaerobicstages
Anoxicstages
Return sludge
Waste sludge<A2/O process>
Aerobicstages
Anaerobic Anoxic
Return sludge
<5 stages Bardenpho process>
Aerobic Anoxic Aerobic
Recycle
Recycle
Waste sludge
Classification Total SBR A2O Media Biofilm Others
Plants
2006 194 68 77 30 15 4
2005 145 50 56 22 12 5
2004 105 41 39 17 4 4
Ratio(%, 2006) 100 35.1 39.7 15.4 7.7 2.1
18
Treatment type of Advanced Sewage Plants
Number of plants
0
20
40
60
80
100
SBR계열 A2O계열 MEDIA 미생물 기타
시설수(개
소)
2004 2005 2006
39.7%
35.1%
25.2%
BIOFILM Others
Wastewater Service
'99 '98 '99 '00 '01 '02 '03 '04 '05 '06
Combined sewer ratio(%) Separate sewer ratio(%)Designed extension(km)
38,148 40,160 41,437 42,878 44,534 45,680 46,167 47,255 48,257 48,914
20,523 22,170 23,304 25,317 27,305 30,179 32,438 34,959 37,498 42,039
92,39196,728 103,280
107,623 112,567 116,141 119,521120,814
125,709 133,482
63.5 64.4 62.7 63.4 63.8 65.3 65.8 68.1 68.2
71.2
Sewer Coverage(%)
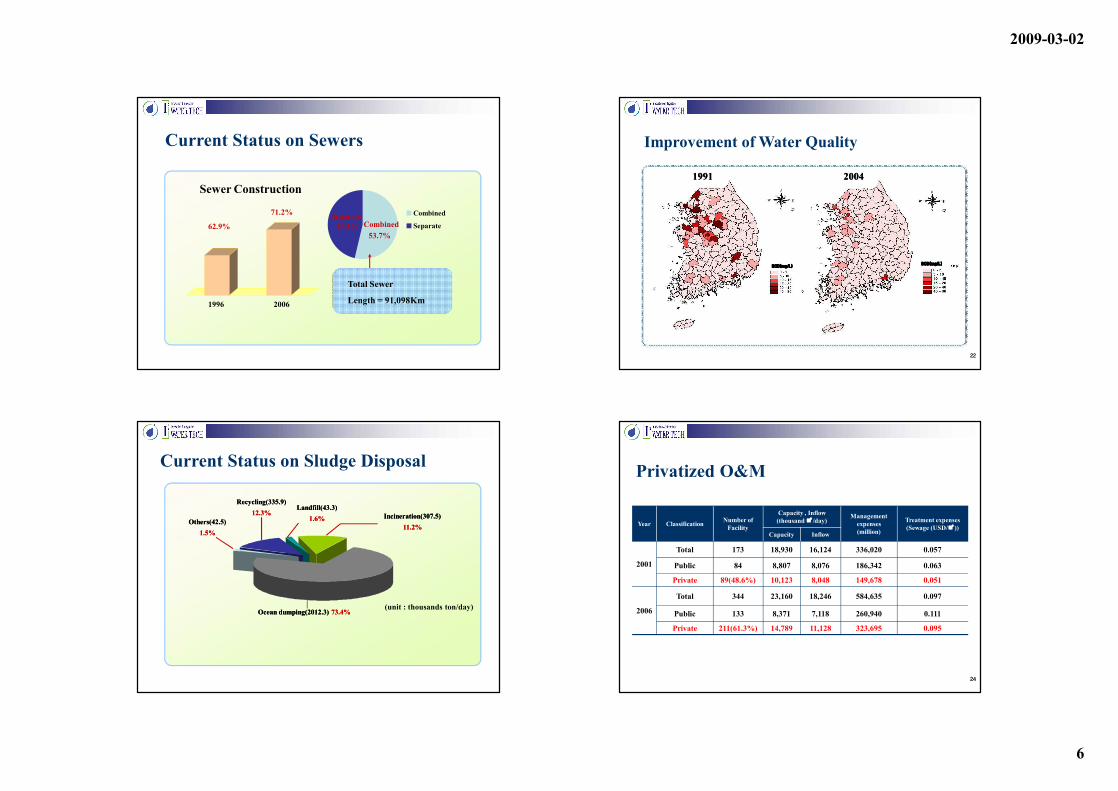
• Sewer Coverage : 71.2%- Urban areas (83.6%) > Rural areas (51.7%)
Number of Sewage Treatment Plants
< 1996 > < 2006 >
Number of Plants 79 344
Capacity (thousands m3/day) 11,452 23,160
Average Capacity per plant(thousands ton/day)
145.0 67.7
NumberCapacity
2009-03-02
6
Sewer Construction
Combined
Separate
Total Sewer
Length = 91,098Km
53.7%46.3%
SeparateCombined62.9%
71.2%
1996 2006
Current Status on Sewers
BOD(mg/L) BOD(mg/L) BOD(mg/L) BOD(mg/L)
19911991 20042004
Improvement of Water Quality
22
Others(42.5)Others(42.5)1.5%1.5%
Recycling(335.9)Recycling(335.9)12.3%12.3%
Landfill(43.3)Landfill(43.3)1.6%1.6% Incineration(307.5)Incineration(307.5)
11.2%11.2%
Ocean dumping(2012.3) Ocean dumping(2012.3) 73.4%73.4%
Current Status on Sludge Disposal
(unit : thousands ton/day)
Privatized O&M
Year Classification Number of Facility
Capacity , Inflow(thousand ㎥/day)
Management expenses(million)
Treatment expenses(Sewage (USD/㎥))
Capacity Inflow
2001
Total 173 18,930 16,124 336,020 0.057
Public 84 8,807 8,076 186,342 0.063
Private 89(48.6%) 10,123 8,048 149,678 0.051
2006
Total 344 23,160 18,246 584,635 0.097
Public 133 8,371 7,118 260,940 0.111
Private 211(61.3%) 14,789 11,128 323,695 0.095
24

2009-03-02
7
• Governmental countermeasures prepared for increased consumer desire and advent of ISO/TC224
• Korea MOE is currently developingPerformance Index (PI) for Water &Wastewater Works
Working on ISO/TC224
1. Tools for increasing O&M of Water & Wastewater Utilities
2. Basis for rational budget allocation in Water & Wastewater Utility retrofitting/rehabilitation
3. Standard to compare service qualities of Water & Wasterwater utilities
Use of PIs
2006
Sewerage Coverage Ratio Reuse rate of Treated Sewerage
Recycle rate of
Sewerage Sludge
2010 2015
6.8% 12.0%18.0%
85.5%90.0% 92.0%
42.9%
56.0%
75.0%
13.7%
67.0% 70.0%
2006 2010 2015 2006 2010 2015
25
50
75
100
25
50
75
100
25
50
75
100
Farming and Fishing Village
22
Future Plan for Sewerage Management by 2015
Farming and Fishing Village
Farming and Fishing Village
Future Directions
It is going to be Membrane Process
2009-03-02
8
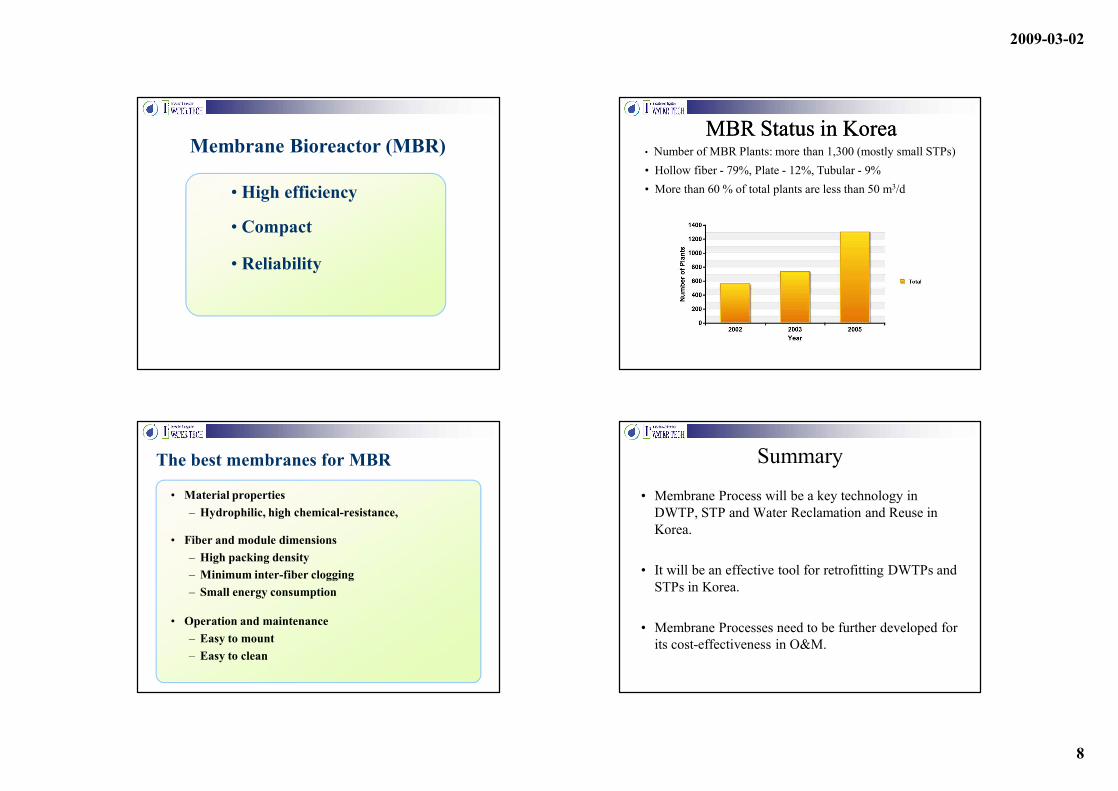
• High efficiency
• Compact
• Reliability
Membrane Bioreactor (MBR) • Number of MBR Plants: more than 1,300 (mostly small STPs)• Hollow fiber - 79%, Plate - 12%, Tubular - 9% • More than 60 % of total plants are less than 50 m3/d
MBR Status in KoreaMBR Status in Korea
The best membranes for MBR
• Material properties– Hydrophilic, high chemical-resistance,
• Fiber and module dimensions– High packing density – Minimum inter-fiber clogging – Small energy consumption
• Operation and maintenance – Easy to mount– Easy to clean
• Membrane Process will be a key technology in DWTP, STP and Water Reclamation and Reuse in Korea.
• It will be an effective tool for retrofitting DWTPs and STPs in Korea.
• Membrane Processes need to be further developed for its cost-effectiveness in O&M.
Summary

2009-03-02
9
Eco-STAR Project
Eun Namkung, Ph.D.Professor, Myongji University Director, Eco-STAR Project, Korea MOE
Logo
• Technical Innovation
• Technical Integration
To develop
and commercialize
the world-best water
treatment technologies
and systems
Vision From Source to Tap
2009-03-02
10
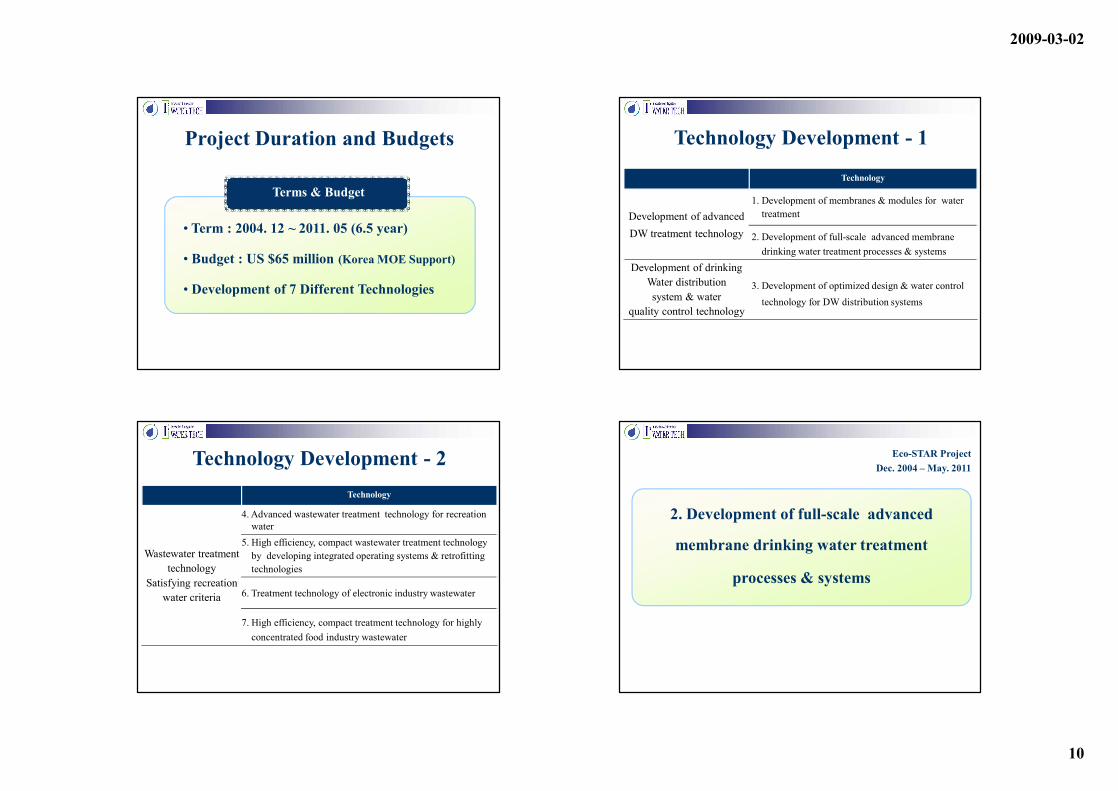
• Term : 2004. 12 ~ 2011. 05 (6.5 year)
• Budget : US $65 million (Korea MOE Support)
• Development of 7 Different Technologies
Project Duration and Budgets
Terms & Budget Technology
Development of advanced DW treatment technology
1. Development of membranes & modules for water treatment
2. Development of full-scale advanced membrane drinking water treatment processes & systems
Development of drinking Water distribution system & water
quality control technology
3. Development of optimized design & water controltechnology for DW distribution systems
Technology Development - 1
Technology
Wastewater treatment technology
Satisfying recreation water criteria
4. Advanced wastewater treatment technology for recreation water
5. High efficiency, compact wastewater treatment technology by developing integrated operating systems & retrofitting technologies
6. Treatment technology of electronic industry wastewater
7. High efficiency, compact treatment technology for highly concentrated food industry wastewater
Technology Development - 2 Eco-STAR ProjectDec. 2004 – May. 2011
2. Development of full-scale advanced
membrane drinking water treatment
processes & systems
2009-03-02
11
High compact/Energy SavingHigh efficiency
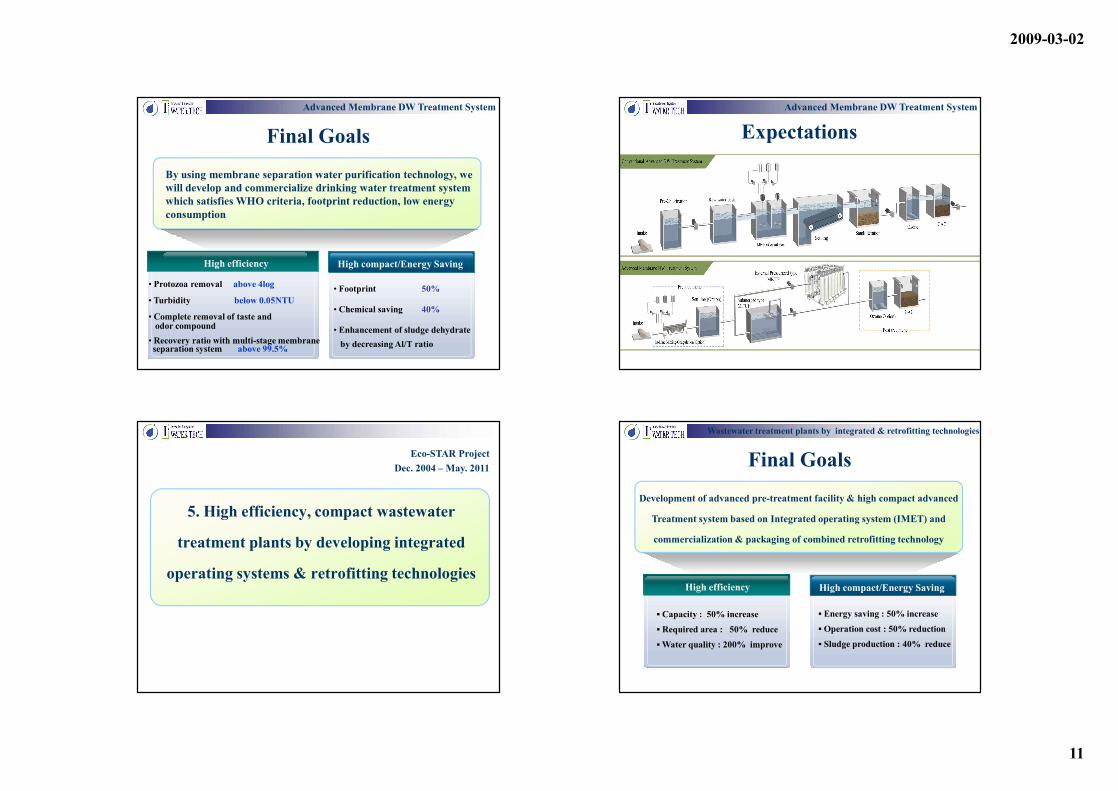
Final Goals
By using membrane separation water purification technology, we will develop and commercialize drinking water treatment system which satisfies WHO criteria, footprint reduction, low energy consumption
• Protozoa removal above 4log
• Turbidity below 0.05NTU
• Complete removal of taste and odor compound
• Recovery ratio with multi-stage membrane separation system above 99.5%
• Footprint 50%
• Chemical saving 40%
• Enhancement of sludge dehydrate by decreasing Al/T ratio
Advanced Membrane DW Treatment System
ExpectationsAdvanced Membrane DW Treatment System
5. High efficiency, compact wastewater
treatment plants by developing integrated
operating systems & retrofitting technologies
Eco-STAR ProjectDec. 2004 – May. 2011
High compact/Energy SavingHigh efficiency
§ Capacity : 50% increase
§ Required area : 50% reduce
§ Water quality : 200% improve
§ Energy saving : 50% increase
§ Operation cost : 50% reduction
§ Sludge production : 40% reduce
Development of advanced pre-treatment facility & high compact advanced
Treatment system based on Integrated operating system (IMET) and
commercialization & packaging of combined retrofitting technology
Final GoalsWastewater treatment plants by integrated & retrofitting technologies

2009-03-02
12
Current water quality
BOD SS TN TP
Present 7.2 3.6 15.5 1.2
Improved water quality
Grit chamber
Primary clarifier
Settling tankAeration tank
Thickener 1st digester 2nd digester
Present(2004)
BOD SS TN TP
Goal 5.0 5.0 10 0.5
After(2010)
Plant area372,126㎡Plant area372,126㎡
Plant area186,063㎡Plant area186,063㎡
Energy (electricity)50millionKW
Energy (electricity)50millionKW
Operation cost85billion won
Operation cost85billion won
Energy (electricity)30millionKW
Energy (electricity)30millionKW
Operation cost68billion won
Operation cost68billion won
ABIO, DBIO, SCBC
Settling Tank
DigesterThickener
Grit chamber
ExpectationsWastewater treatment plants by integrated & retrofitting technologies
Project Phases
2004.12 - 2005.5
11StSt
2009.6 – 2011.5
2007.6 – 2009.5
2005.6 - 2007.5
22ndnd
33rdrd
44thth
Construction (or Preparation) of basic
technical foundations
Development of unit and integrated system
technologies
System optimizationand applications
(or feasibility study)
Commercialization of water treatment systems
developed
§ Membrane/module§ Membrane-based water
treatment processes§ Drinking water
distribution system water quality control
§ Wastewater treatment technology for recreation water
Develop and
commercialize
the world-best water treatment
Technologies and
systems
§ Water treatment membrane (MF/UF/NF/special)/module manufacturing technology
§ Hybrid systems with conventional treatment processes
§ Cleaning, repair and rehabilitation of distribution system
§ Unit and integrated system wastewater treatment technologies
§ Commercialization of water treatment membrane/module
§ Improvement of demonstration plant efficiency and feasibility
§ Commercialization Optimum water quality management technology in distribution system
§ Commercialization ofWastewater treatment technology developed
§ Water treatment membrane /module & control systems
§ Membrane process optimization & installation and operation of full-scale demonstration plants
§ Application of optimum water quality management technology in distribution system
§ Optimization of wastewatertreatment technology for recreation water
Integration
Innovation
Key Strategies
Select & Focus • Globally competitive technologydevelopment
Development of integrated technologies
• Unit process/technology development• Integration of BT/NT/IT/ET
Development - oriented
Application – oriented
Commercialization -oriented
• Exclusion of academic studies withno commercial values
• System development
• Feasibility verification by full-scale demonstration study
• Technology development through field applications
• Industry - leading• Setting up quantitative (measurable) project goals
Develop
and commercialize
the world-best water
treatment technologies
and systems
System Development
Automatic Measurement
& Control
Equipment, Unit Design, Construction, Operating & Maintenance
Manual
Process

2009-03-02
13
• High Efficiency
• Low Energy
• Multifunction
• Low Solids
• Compact
Eco-Design & LCC/LCA
From Cradle To Grave
Eco-Design & LCC/LCA
• Product / Process / Program / System
• Patent
• Paper
3P strategy
Final Outcome
Performance + Cost Effectiveness
Success Criteria for Commercialization

2009-03-02
14
Thank you Thank you
for your attention !for your attention !