current status of water-related … files/s7-pham...college of sciences, hue university, vietnam...
TRANSCRIPT
ICSS Asia 2012, Bali, Indonesia
Pham Khac Lieu, D.Eng.
Department of Environmental Science
College of Sciences, Hue University, Vietnam
CURRENT STATUS OF
WATER-RELATED
SANITATION CONDITIONS IN
HUE CITY, VIETNAM

ICSS Asia 2012, Bali, Indonesia
Contents
1. Hue city at a glance
2. Water resources and supply in Hue
3. Water-related sanitation practices in Hue
4. Threats to water-related sanitation improvement
5. Concluding remarks
ICSS Asia 2012, Bali, Indonesia
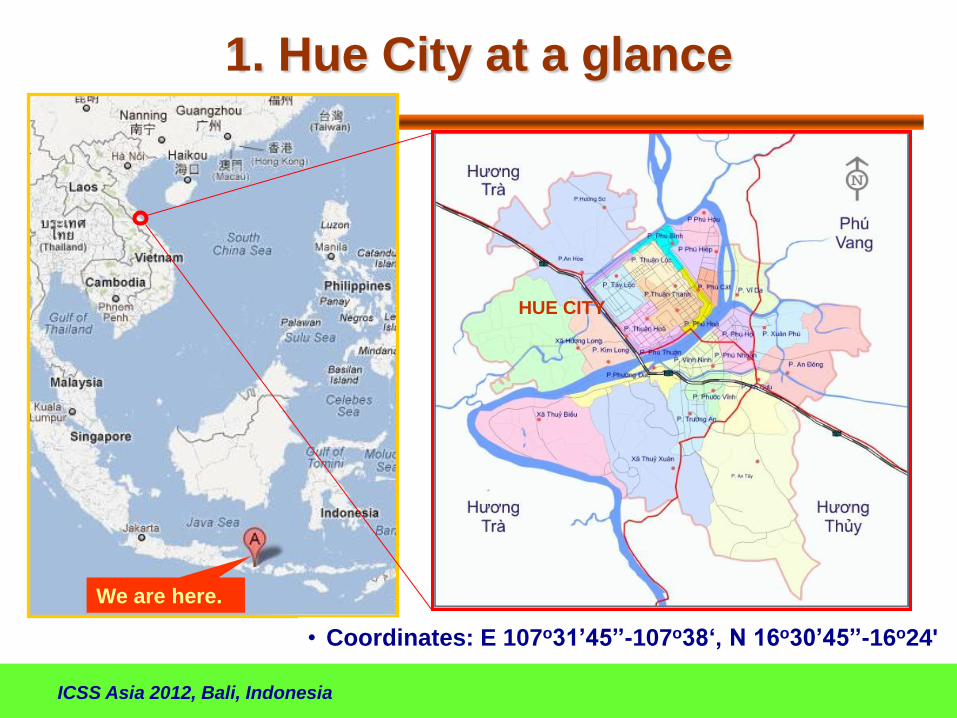
• Coordinates: E 107o31’45’’-107o38‘, N 16o30’45’’-16o24'
HUE CITY
We are here.
1. Hue City at a glance
ICSS Asia 2012, Bali, Indonesia
1. Hue City at a glance
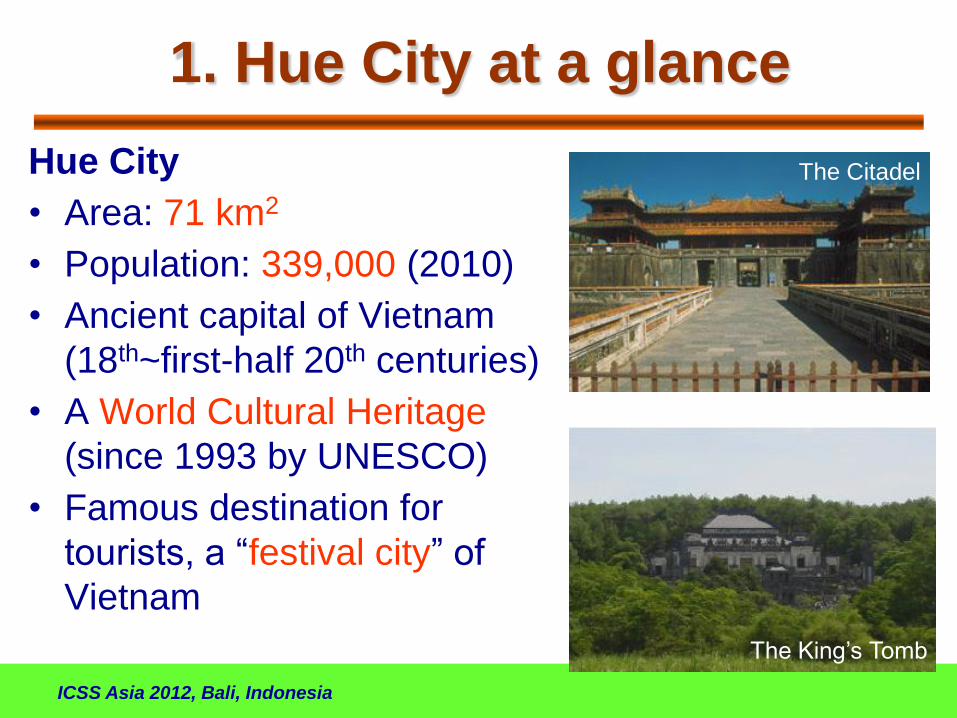
Hue City
• Area: 71 km2
• Population: 339,000 (2010)
• Ancient capital of Vietnam
(18th~first-half 20th centuries)
• A World Cultural Heritage
(since 1993 by UNESCO)
• Famous destination for
tourists, a “festival city” of
Vietnam
The Citadel
The King’s Tomb
ICSS Asia 2012, Bali, Indonesia
1. Hue City at a glance
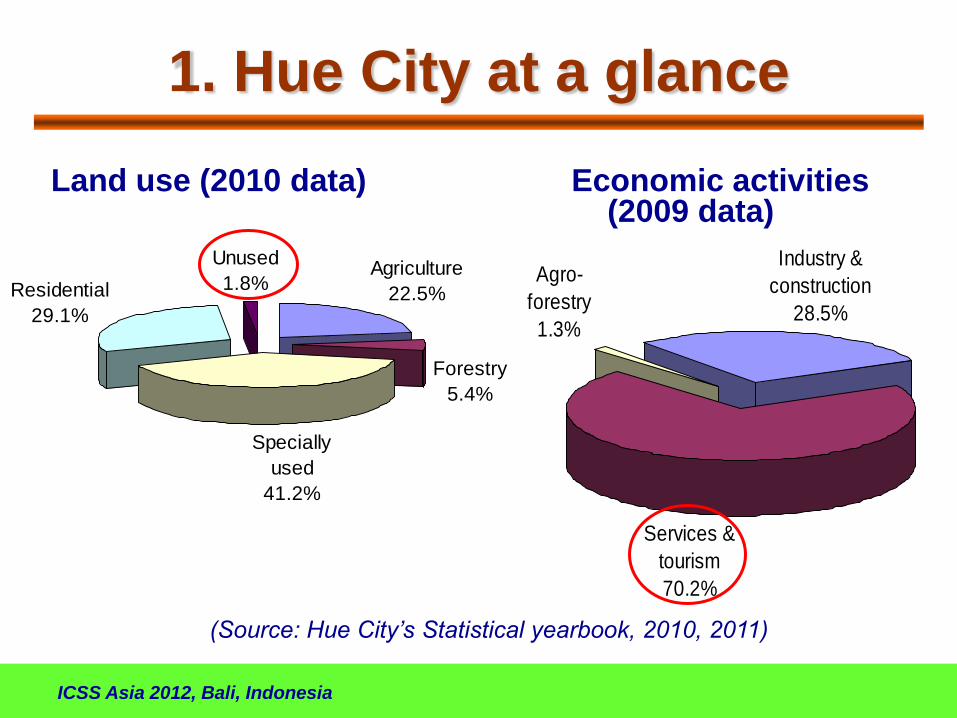
Land use (2010 data)
Agriculture
22.5%
Forestry
5.4%
Specially
used
41.2%
Residential
29.1%
Unused
1.8%
Economic activities (2009 data)
Industry &
construction
28.5%
Services &
tourism
70.2%
Agro-
forestry
1.3%
(Source: Hue City’s Statistical yearbook, 2010, 2011)

ICSS Asia 2012, Bali, Indonesia
1. Hue City at a glance
Geographical features
• flat land of the downstream basin of the Huong River
• rather low elevation
Climate
• hot and wet
• average annual temperature: 25oC
• average annual rainfall: 2,500 mm
Hue
City
ICSS Asia 2012, Bali, Indonesia
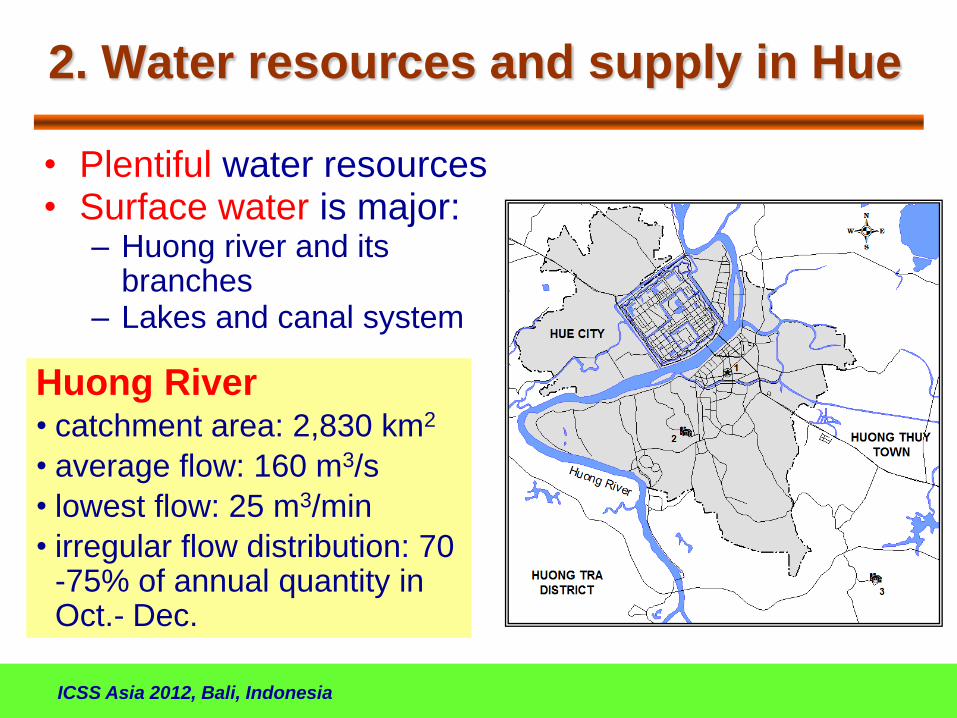
2. Water resources and supply in Hue
• Plentiful water resources • Surface water is major:
– Huong river and its branches
– Lakes and canal system
Huong River • catchment area: 2,830 km2
• average flow: 160 m3/s
• lowest flow: 25 m3/min
• irregular flow distribution: 70 -75% of annual quantity in Oct.- Dec.
ICSS Asia 2012, Bali, Indonesia
2. Water resources and supply in Hue
Water quality
• Mainstream of Huong river
– Generally good for domestic supply, irrigation, recreation, etc.
– Slightly organic and pathogenic pollution (in dry season)
– Highly turbid (in flood season)
• River’s branches, lakes and canal
– Moderate organic pollution and eutrophication (dry season)
ICSS Asia 2012, Bali, Indonesia
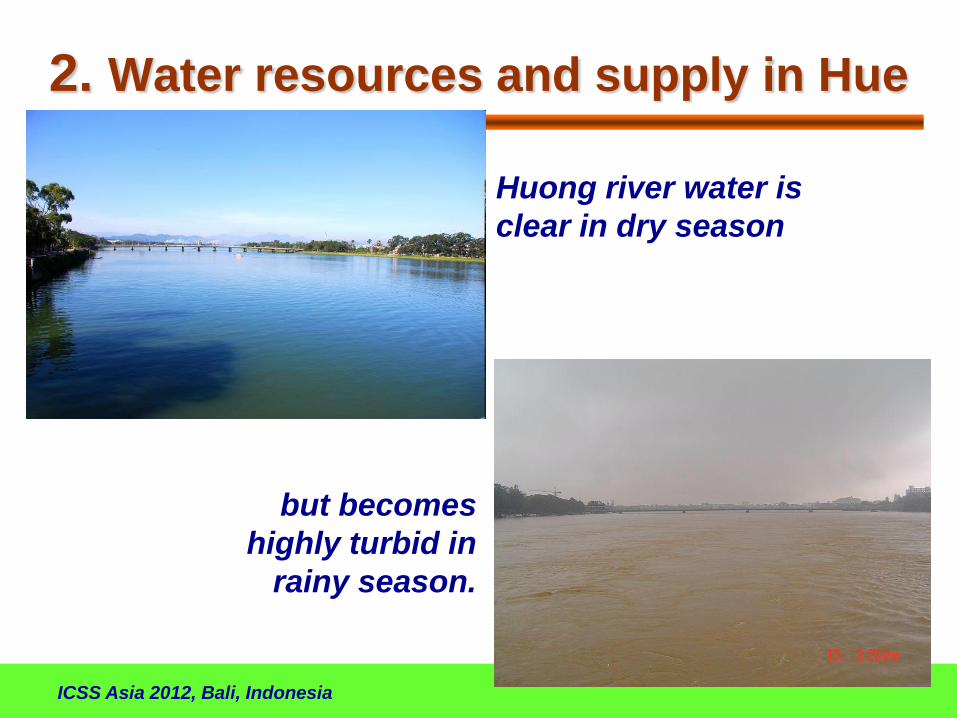
2. Water resources and supply in Hue
Huong river water is
clear in dry season
but becomes
highly turbid in
rainy season.
ICSS Asia 2012, Bali, Indonesia
2. Water resources and supply in Hue
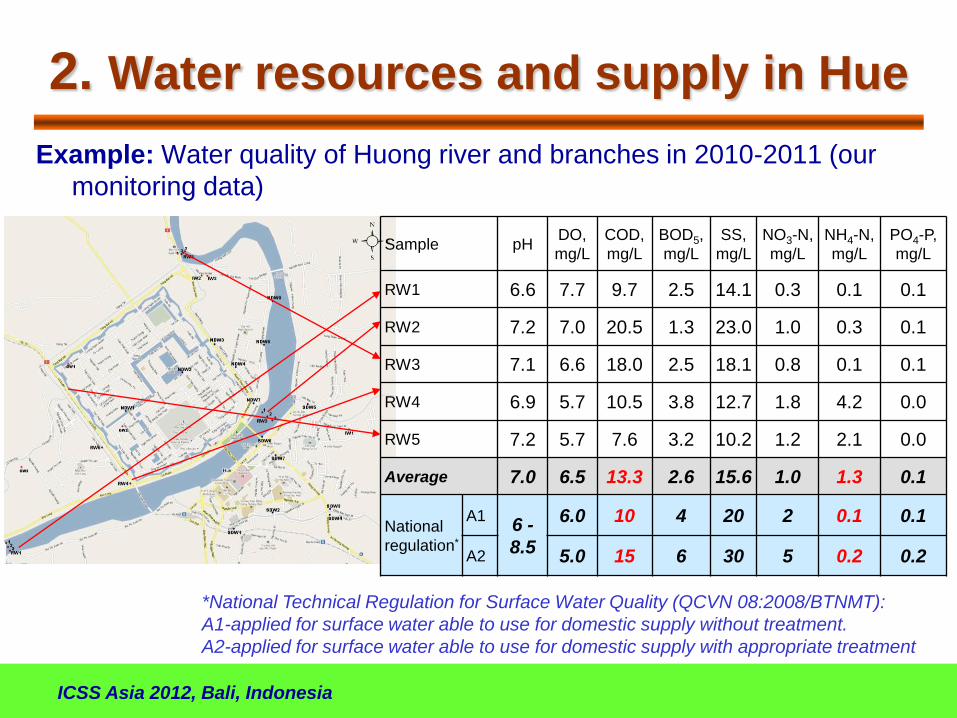
Sample pH DO,
mg/L
COD,
mg/L
BOD5,
mg/L
SS,
mg/L
NO3-N,
mg/L
NH4-N,
mg/L
PO4-P,
mg/L
RW1 6.6 7.7 9.7 2.5 14.1 0.3 0.1 0.1
RW2 7.2 7.0 20.5 1.3 23.0 1.0 0.3 0.1
RW3 7.1 6.6 18.0 2.5 18.1 0.8 0.1 0.1
RW4 6.9 5.7 10.5 3.8 12.7 1.8 4.2 0.0
RW5 7.2 5.7 7.6 3.2 10.2 1.2 2.1 0.0
Average 7.0 6.5 13.3 2.6 15.6 1.0 1.3 0.1
National
regulation*
A1 6 -
8.5
6.0 10 4 20 2 0.1 0.1
A2 5.0 15 6 30 5 0.2 0.2
*National Technical Regulation for Surface Water Quality (QCVN 08:2008/BTNMT):
A1-applied for surface water able to use for domestic supply without treatment.
A2-applied for surface water able to use for domestic supply with appropriate treatment
Example: Water quality of Huong river and branches in 2010-2011 (our
monitoring data)

ICSS Asia 2012, Bali, Indonesia
2. Water resources and supply in Hue
Water use in Hue city
• Public piped water is
main use
• Tap water coverage:
100% city area
(HUEWACO, 2010)
• Average per capita
consumption: 120 -
140 liters/day
97%
1% 2%
Public piped water Drilled wells Dug wells
Distribution of domestic water use by
households (Center for Preventive Medicine,
2010)
ICSS Asia 2012, Bali, Indonesia
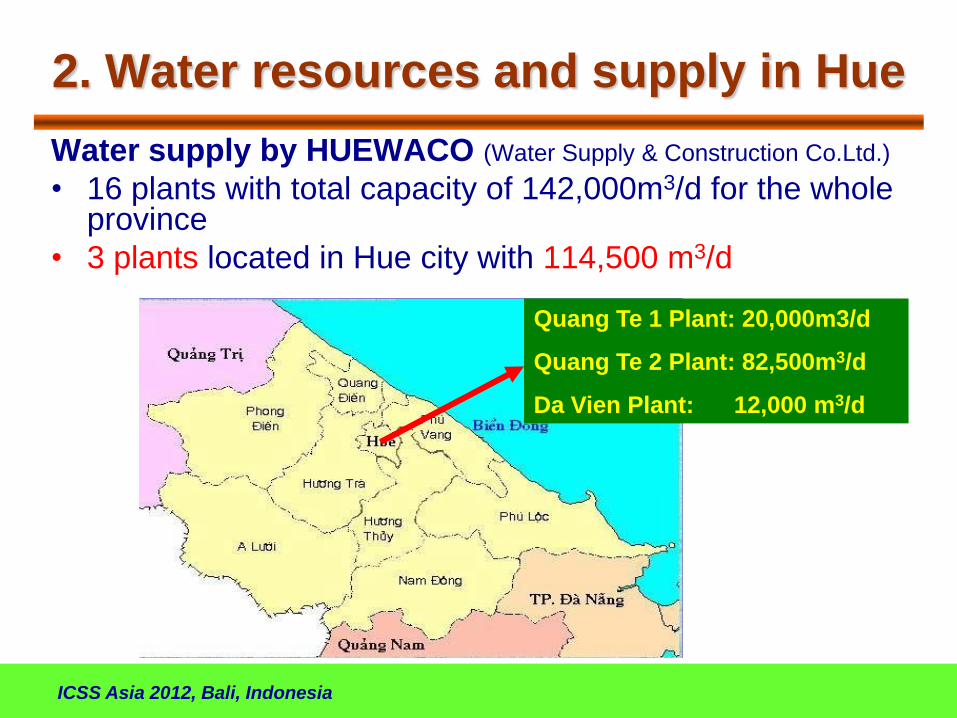
Water supply by HUEWACO (Water Supply & Construction Co.Ltd.)
• 16 plants with total capacity of 142,000m3/d for the whole province
• 3 plants located in Hue city with 114,500 m3/d
Quang Te 1 Plant: 20,000m3/d
Quang Te 2 Plant: 82,500m3/d
Da Vien Plant: 12,000 m3/d
2. Water resources and supply in Hue

ICSS Asia 2012, Bali, Indonesia
Tap water quality
• Meets all requirements by National Technical Regulation on Drinking Water Quality
• Turbidity always 10 times lower than standard value (0.2 NTU vs. 2.0 NTU)
• Declared Water Safety Plan in 2008 (one of three companies in South-East Asia recognized by WHO)
Water tariff in Hue:
Basic price + VAT + WW fee + PES
4,100 VND + 410 VND + 40 VND
= 4,550 VND/m3 (0.22 USD/m3)
(PES: Payments for Forest Services)
2. Water resources and supply in Hue
ICSS Asia 2012, Bali, Indonesia
3. Wastewater management in Hue
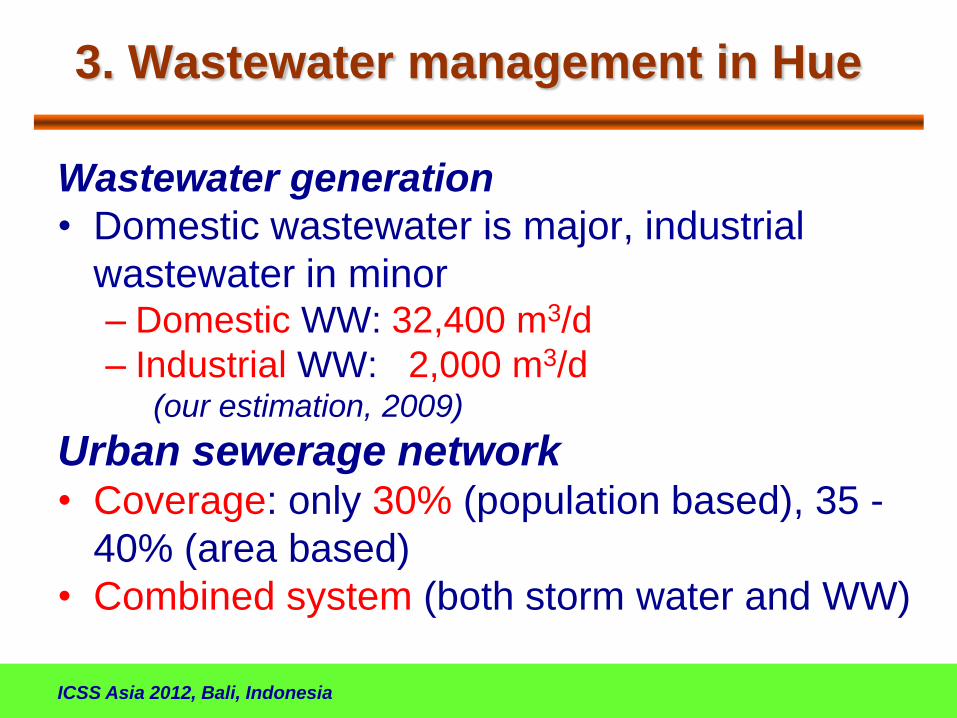
Wastewater generation
• Domestic wastewater is major, industrial
wastewater in minor – Domestic WW: 32,400 m3/d
– Industrial WW: 2,000 m3/d (our estimation, 2009)
Urban sewerage network • Coverage: only 30% (population based), 35 -
40% (area based)
• Combined system (both storm water and WW)
ICSS Asia 2012, Bali, Indonesia
3. Wastewater management in Hue
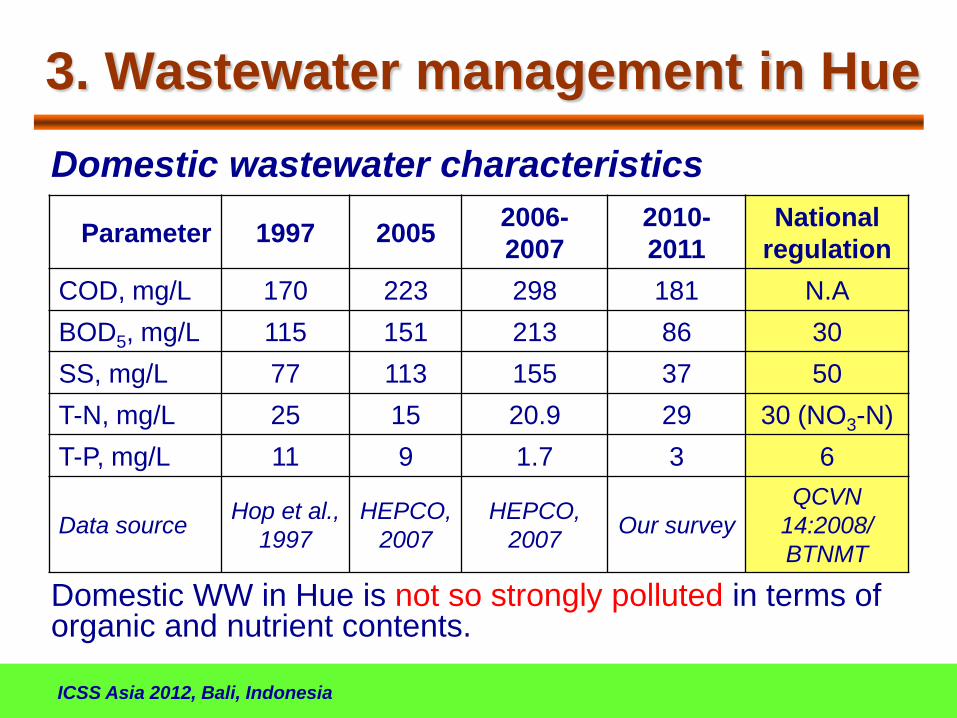
Domestic wastewater characteristics
Parameter 1997 2005 2006-
2007
2010-
2011
National
regulation
COD, mg/L 170 223 298 181 N.A
BOD5, mg/L 115 151 213 86 30
SS, mg/L 77 113 155 37 50
T-N, mg/L 25 15 20.9 29 30 (NO3-N)
T-P, mg/L 11 9 1.7 3 6
Data source Hop et al.,
1997
HEPCO,
2007
HEPCO,
2007 Our survey
QCVN
14:2008/
BTNMT
Domestic WW in Hue is not so strongly polluted in terms of organic and nutrient contents.

ICSS Asia 2012, Bali, Indonesia
3. Wastewater management in Hue
Domestic wastewater
• At present – No collection system and
treatment plant in Hue
– Discharged into environment
(rivers, lakes,…) with some
pretreatment or without
treatment.
• On going project “Hue City Water Environment Improvement” (loaned from Japan)
1st phase (2008-2016): construction of a MWWTP with capacity of 20,000 m3/d.
(HEPCO, 2007; Thua Thien Hue PPC, 2009).
ICSS Asia 2012, Bali, Indonesia
4. Water-related sanitation practices in Hue
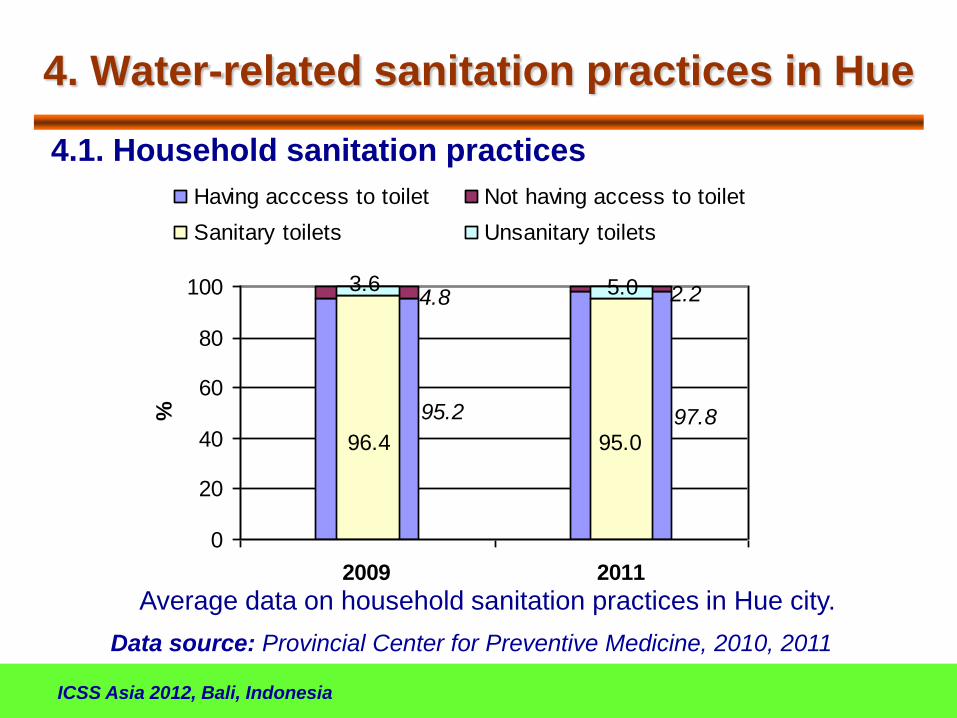
4.1. Household sanitation practices
97.895.2
2.24.8
95.096.4
5.03.6
0
20
40
60
80
100
2009 2011
%
Having acccess to toilet Not having access to toilet
Sanitary toilets Unsanitary toilets
Data source: Provincial Center for Preventive Medicine, 2010, 2011
Average data on household sanitation practices in Hue city.

ICSS Asia 2012, Bali, Indonesia
4. Water-related sanitation practices in Hue
Data on access to toilet by wards in 2011.
Data source: Provincial Center for Preventive Medicine
0%
20%
40%
60%
80%
100%
Phu
Binh
Kim
Lon
g
Huo
ng L
ong
Phu
Thu
an
Thuan
Hoa
Thuan
Tha
nh
Thuan
Loc
An
Hoa
Huo
ng S
o
Tay L
oc
Phu
Hoa
Phu
Hie
p
Phu
Hau
Phu
Cat
Vy Da
Xua
n Phu
Phu
Hoi
Phu
Nhu
an
Vinh
Ninh
An
Cuu
An
Don
g
An
Tay
Phu
ong
Duc
Phu
oc V
inh
Truon
g An
Thuy Xua
n
Thuy Bieu
Wards
Sanitary toilets Unsanitary toilets Not having access to toilet
ICSS Asia 2012, Bali, Indonesia
4. Water-related sanitation practices in Hue
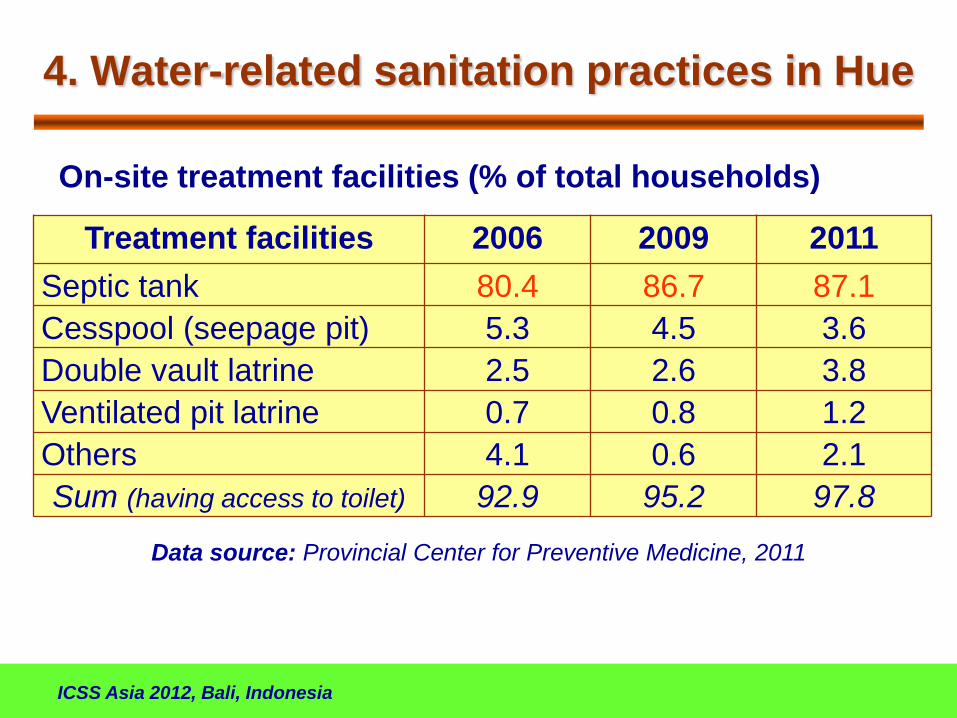
On-site treatment facilities (% of total households)
Treatment facilities 2006 2009 2011
Septic tank 80.4 86.7 87.1
Cesspool (seepage pit) 5.3 4.5 3.6
Double vault latrine 2.5 2.6 3.8
Ventilated pit latrine 0.7 0.8 1.2
Others 4.1 0.6 2.1
Sum (having access to toilet) 92.9 95.2 97.8
Data source: Provincial Center for Preventive Medicine, 2011
ICSS Asia 2012, Bali, Indonesia
4. Water-related sanitation practices in Hue
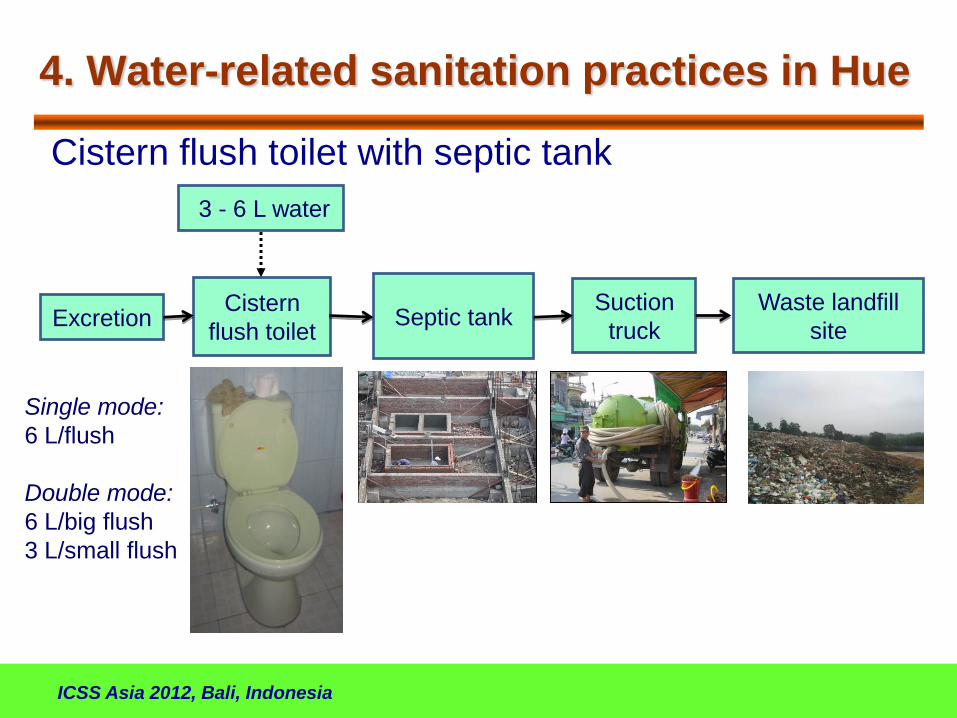
Cistern flush toilet with septic tank
Excretion Cistern
flush toilet Septic tank
3 - 6 L water
Suction
truck
Waste landfill
site
Single mode:
6 L/flush
Double mode:
6 L/big flush
3 L/small flush

ICSS Asia 2012, Bali, Indonesia
4. Water-related sanitation practices in Hue
Pour flush toilet with septic tank
Excretion Pour flush
toilet Septic tank
~ 3 L water
Suction
truck
Waste landfill
site
ICSS Asia 2012, Bali, Indonesia
4. Water-related sanitation practices in Hue
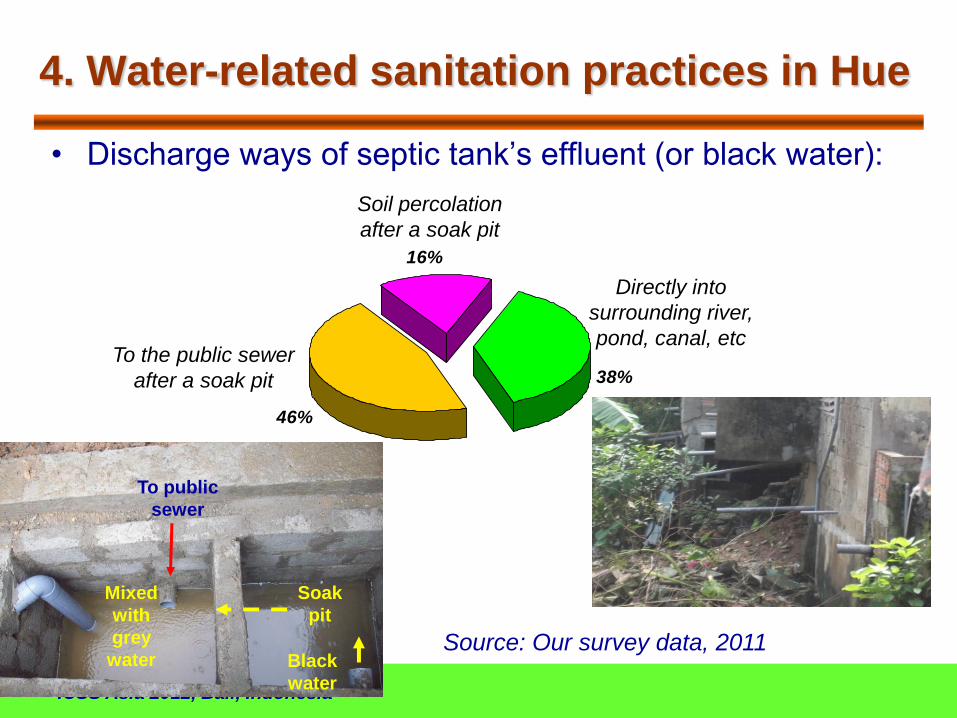
• Discharge ways of septic tank’s effluent (or black water):
46%
16%
38%
Directly into
surrounding river,
pond, canal, etc To the public sewer
after a soak pit
Mixed
with
grey
water
Soak
pit
To public
sewer
Black
water
Soil percolation
after a soak pit
Source: Our survey data, 2011

ICSS Asia 2012, Bali, Indonesia
4. Water-related sanitation practices in Hue
4.2. Personal hygienic practices
• Hand washing: – 68% always and 32%
occasionally wash hands before eating.
– 83.5% always and 16.5% occasionally wash hand after defecation.
• Anal cleaning: – Paper use: 59.3%
– Both paper and water use: 32,2%
– Water use: 8,5%
Tissue paper Water for anal cleaning
Source: Our survey data, 2011

ICSS Asia 2012, Bali, Indonesia
4. Water-related sanitation facilities in Hue
Poor sanitation practices in the slum at Phu Binh ward:
• 115 households with 783 persons
• only 12 public toilets
• located closely to outer canal of Citadel
Source: Our survey data, 2011

ICSS Asia 2012, Bali, Indonesia
4. Water-related sanitation practices in Hue
Waterborne diseases in Hue city (2009 – 2011)
(cases of patient)
Disease 2009 2010 2011
Cholera 0 0 0
Typhoid 1 1 0
Dysentery 320 4 345
Diarrhea 2812 3504 1713
(Source: Provincial Center for Preventive Medicine, 2010)
No outbreak in recent years
ICSS Asia 2012, Bali, Indonesia
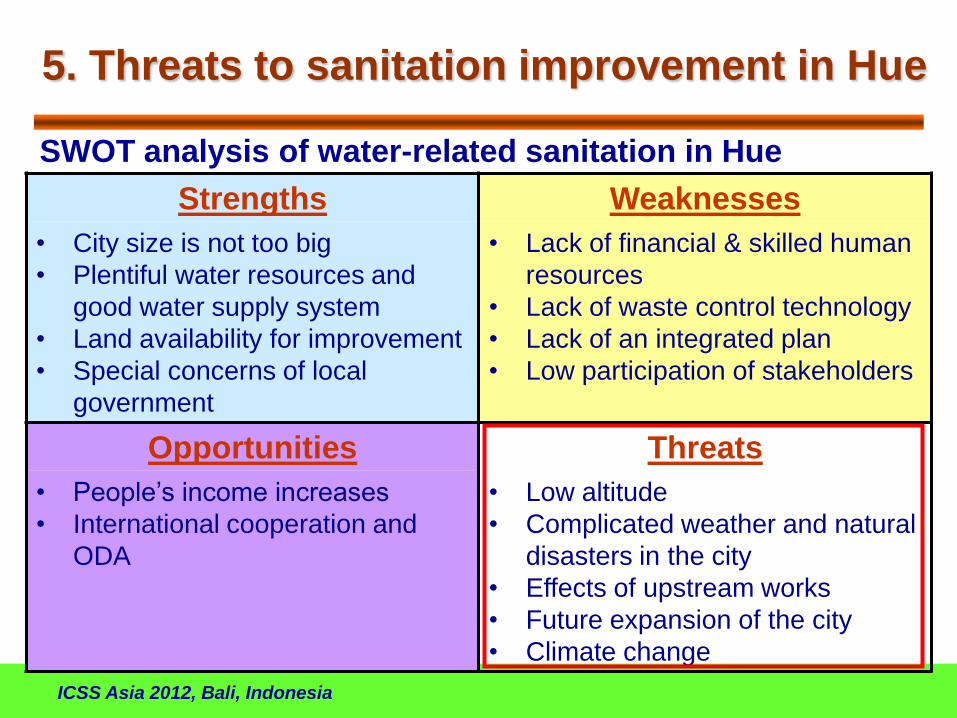
5. Threats to sanitation improvement in Hue
Strengths Weaknesses
• City size is not too big
• Plentiful water resources and
good water supply system
• Land availability for improvement
• Special concerns of local
government
• Lack of financial & skilled human
resources
• Lack of waste control technology
• Lack of an integrated plan
• Low participation of stakeholders
Opportunities Threats
• People’s income increases
• International cooperation and
ODA
• Low altitude
• Complicated weather and natural
disasters in the city
• Effects of upstream works
• Future expansion of the city
• Climate change
SWOT analysis of water-related sanitation in Hue
ICSS Asia 2012, Bali, Indonesia
5. Threats to sanitation improvement in Hue
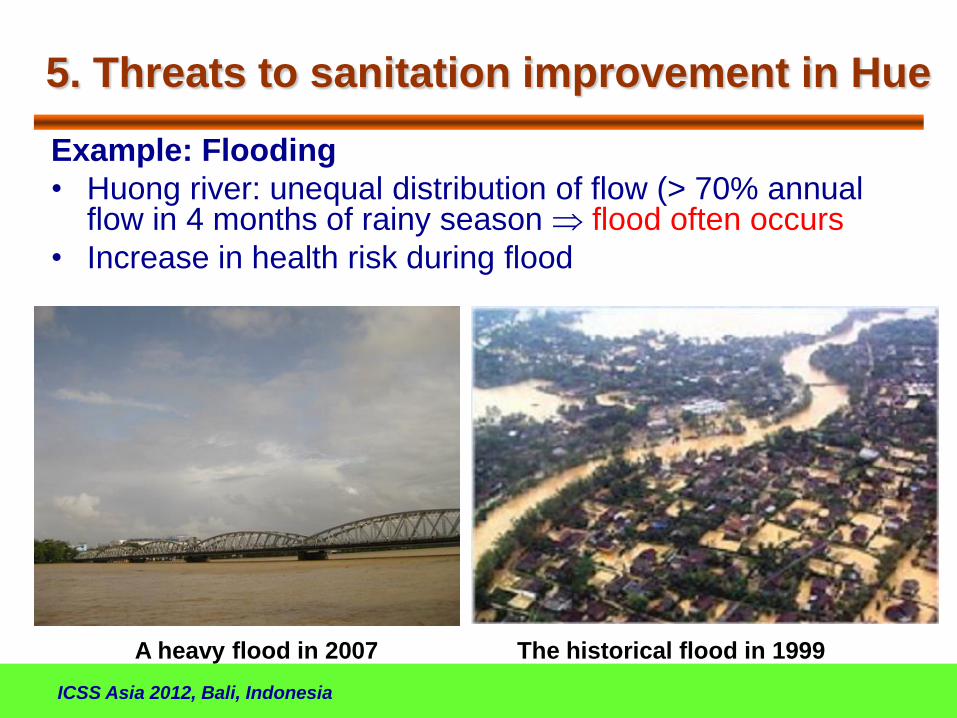
Example: Flooding
• Huong river: unequal distribution of flow (> 70% annual flow in 4 months of rainy season flood often occurs
• Increase in health risk during flood
The historical flood in 1999 A heavy flood in 2007
ICSS Asia 2012, Bali, Indonesia
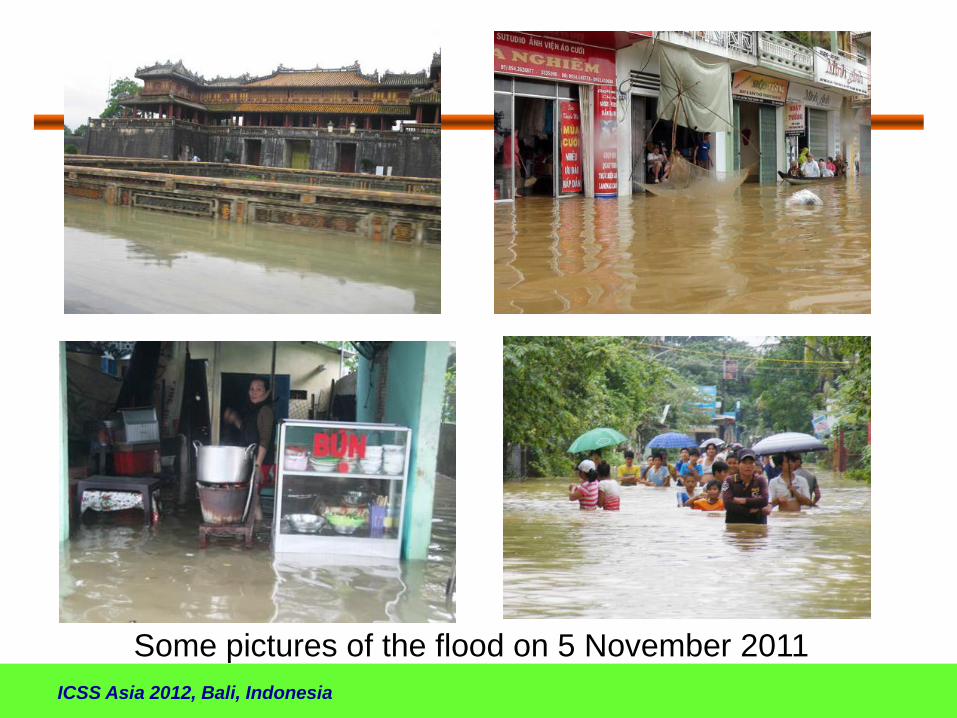
Some pictures of the flood on 5 November 2011

ICSS Asia 2012, Bali, Indonesia
5. Threats to sanitation improvement in Hue
Example: Upstream dams and reservoirs - possible impacts: – Changes in flooding regime/duration
– Changes in water quality
Ta Trach Reservoir • Dam height = 56 m
• Dam length = 1,112m
• Storage capacity = 646 Mm3
Binh Dien Dam • Dam height = 83.6 m
• Dam length = 362.8m
• Storage capacity = 424 Mm3
Huong Dien Reservoir • Dam height = 82.5 m
• Dam length = 180 m
• Storage capacity = 820 Mm3
increase health risk
ICSS Asia 2012, Bali, Indonesia
Concluding remarks
• Current status of water-related sanitation in
Hue city: – Good water supply practice: plentiful source, reliable
supply system, safe water planning, etc.
– Inadequate drainage and sewerage system: low
coverage, no sewage treatment, etc.
– Good basic household sanitation but some problems
remained: • Uncontrolled discharge of septic tank’s effluent?
• Weak linkage between household and public sanitation systems.
– Not good personal hygienic practices: low awareness of
a significant number of people
– Some threats to the improvement of sanitation in Hue
ICSS Asia 2012, Bali, Indonesia
Expectations
• Expectations for collaboration from the International Network on Health Risk Assessment in Urban Area? – Baseline and comprehensive data on water-
related sanitation conditions; – Analysis of constraints and factors of
sanitation improvement; – Health risk assessment under inundation
condition; – Planning and solutions for a sustainable
sanitation system; – etc.

ICSS Asia 2012, Bali, Indonesia