current toolbox models: maccs2 - department of energy maccs2 workshop bixler… · current toolbox...
TRANSCRIPT

Current Toolbox Models: MACCS2
Nate Bixler
Sandia National Laboratories
P. O. Box 5800
Albuquerque, New Mexico, 87185-0748
Presented at the DOE Workshop to Discuss
Issues Regarding Deposition Velocity and MACCS2
June 5-6, 2012
DOE, Germantown, Maryland
Sandia is a multiprogram laboratory operated by Sandia Corporation, a Lockheed Martin Company,
for the United States Department of Energy under contract DE-AC04-94AL85000.
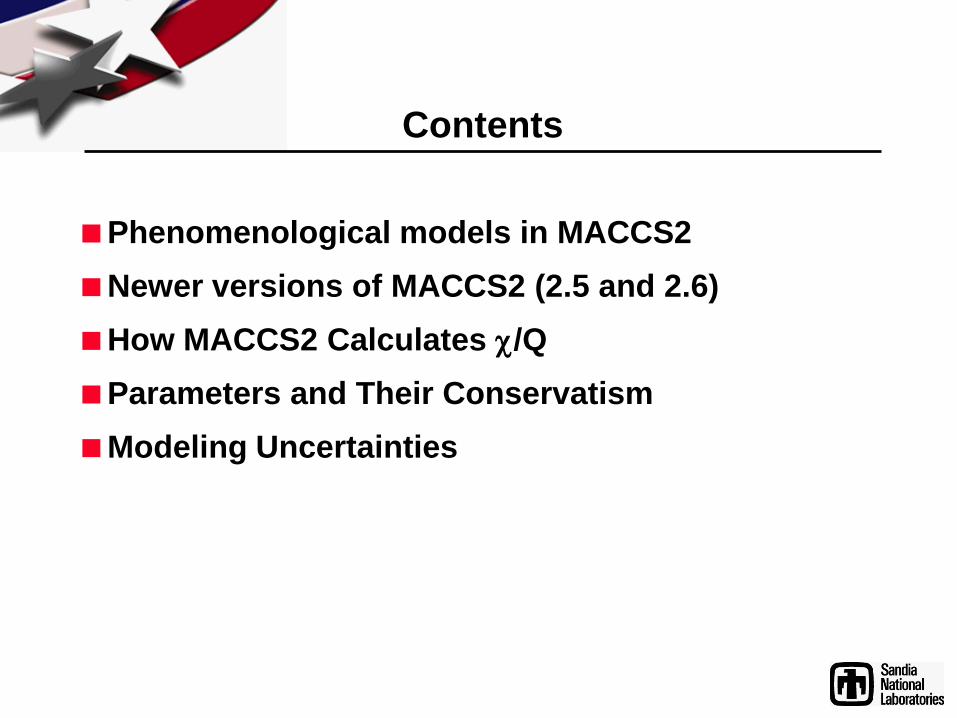
Contents
Phenomenological models in MACCS2
Newer versions of MACCS2 (2.5 and 2.6)
How MACCS2 Calculates c/Q
Parameters and Their Conservatism
Modeling Uncertainties
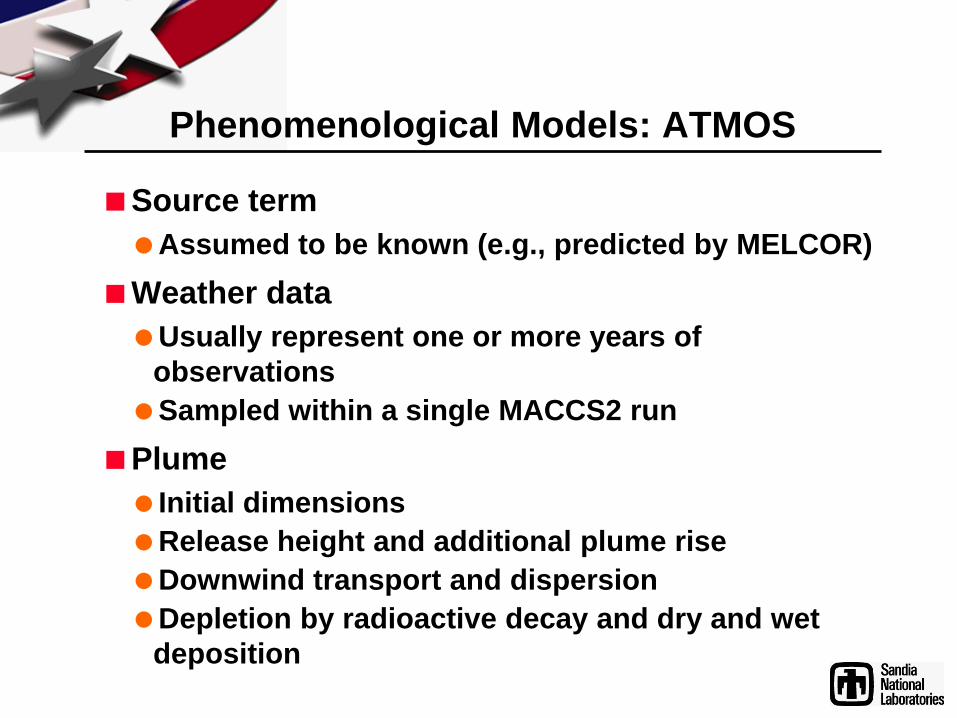
Phenomenological Models: ATMOS
Source term
Assumed to be known (e.g., predicted by MELCOR)
Weather data
Usually represent one or more years of
observations
Sampled within a single MACCS2 run
Plume
Initial dimensions
Release height and additional plume rise
Downwind transport and dispersion
Depletion by radioactive decay and dry and wet
deposition

Phenomenological Models: EARLY
Emergency phase – 1 day to 1 week
Exposure pathways
Cloudshine, groundshine, direct inhalation, and
inhalation of resuspended aerosols
Emergency responses
Evacuation, sheltering, and relocation
Heath effects
Acute health effects and latent cancer
Economic consequences
Evacuation/Relocation costs

Phenomenological Models: CHRONC
Exposure pathways
Groundshine, inhalation of resuspended particles, and
food and water ingestion
Mitigative actions
Decontamination
Interdiction
Condemnation
Economic consequences
Cost of decontamination
Loss of use of property
Disposal of agricultural products
Relocation of population
Condemnation of property

MACCS2 Version 1.13 (Toolbox)
First released in 2001
Recompiled with Intel’s FORTRAN compiler to be compatible with Windows 2000 and XP
Includes a validate-only option
Enhanced error handling and reporting
Resolved errors leading to defect notifications
Added check to ensure reasonable bounds on sy
Corrected error in food-chain output for leafy vegetables
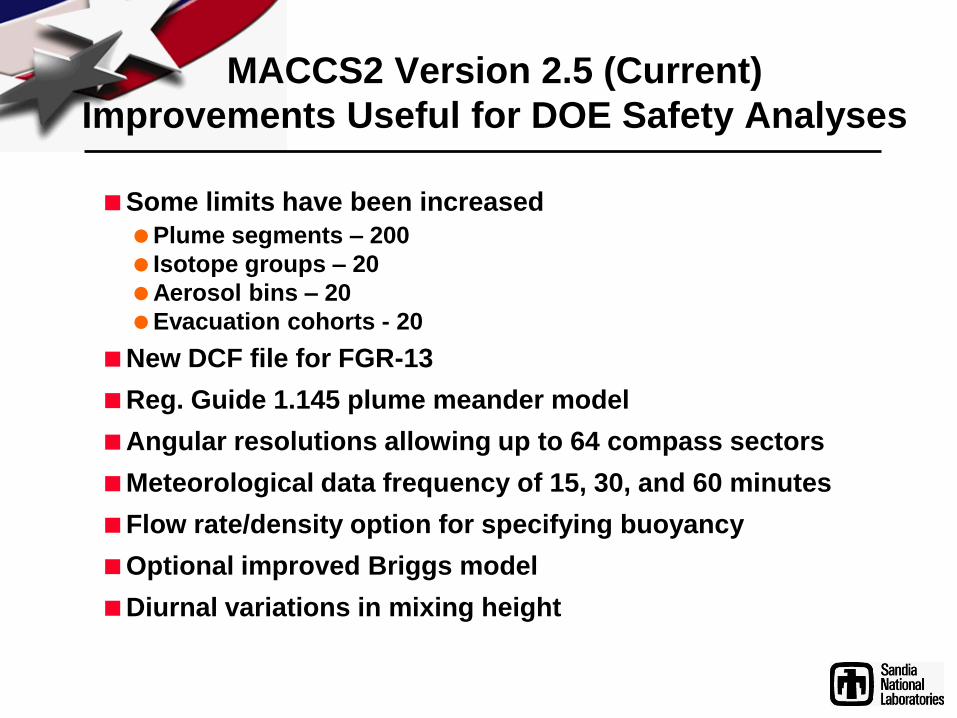
MACCS2 Version 2.5 (Current)
Improvements Useful for DOE Safety Analyses
Some limits have been increased
Plume segments – 200
Isotope groups – 20
Aerosol bins – 20
Evacuation cohorts - 20
New DCF file for FGR-13
Reg. Guide 1.145 plume meander model
Angular resolutions allowing up to 64 compass sectors
Meteorological data frequency of 15, 30, and 60 minutes
Flow rate/density option for specifying buoyancy
Optional improved Briggs model
Diurnal variations in mixing height

MACCS2 Version 2.5 (Current)
Other Modeling Improvements
Option for time-based, long-range dispersion
Annual and piecewise-linear dose threshold models
KI ingestion model
Effect of adverse weather on evacuation speeds
Concentration and dose output by grid element and land area exceeding specified concentration or dose
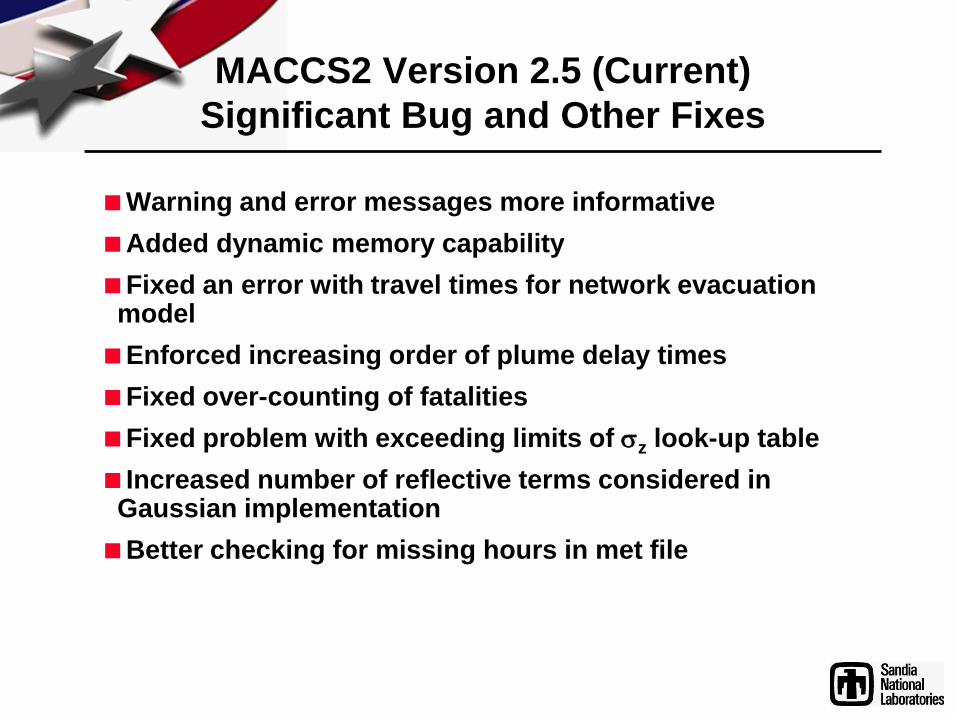
MACCS2 Version 2.5 (Current)
Significant Bug and Other Fixes
Warning and error messages more informative
Added dynamic memory capability
Fixed an error with travel times for network evacuation model
Enforced increasing order of plume delay times
Fixed over-counting of fatalities
Fixed problem with exceeding limits of sz look-up table
Increased number of reflective terms considered in Gaussian implementation
Better checking for missing hours in met file

MACCS2 Version 2.6 (Near Future)
Improvements Useful for DOE Safety Analyses
Optional units for results
Activities in Bq or Ci
Distances in units of km or mi
Area in units of hectares, km2, mi2
Doses in units of Sv or rem

MACCS2 Version 2.6 (Near Future)
Significant Bug and Other Fixes
Error message printed when bounds for sy exceeded in lookup table
Several fixes made for SUMPOP site-file option
Fixed conflict with pointer used for KI model
Fixed issue with land area calculation for Types C and D output
Longer file names allowed
Correction to Reg. Guide 1.145 plume meander model
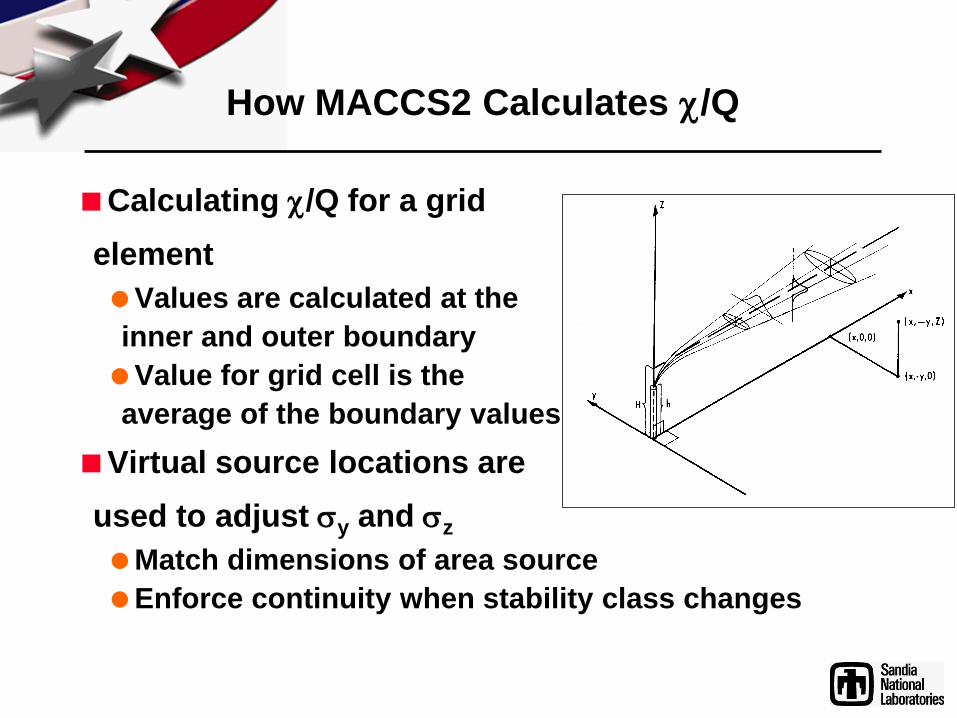
How MACCS2 Calculates c/Q
Calculating c/Q for a grid
element
Values are calculated at the
inner and outer boundary
Value for grid cell is the
average of the boundary values
Virtual source locations are
used to adjust sy and sz
Match dimensions of area source
Enforce continuity when stability class changes

User Specification of Dispersion Parameters
sy and sz can be defined as
power-law functions or with
lookup tables
Exceeding bounds of sy
lookup table results in
fatal error
Exceeding bounds of sz
lookup table results in
Warning message
sz remains constant until
stability class changes

User Specification of Dispersion Parameters
User can provide multipliers on sy and sz
Multiplier on sy commonly used to treat plume meander
Additional sy multiplier usually set to unity
User-specified multiplier for sz commonly used to
account for surface roughness
Treatment of surface roughness should be
consistent with meteorological data

Plume Meander Models
Version 1.13.1 contains the
original MACCS2 plume
meander model
Meander factor proportional to
plume duration raised to the 0.2
(< 1 hr) or 0.25 (> 1 hr) power
Version 2.5 also includes Reg.
Guide 1.145 plume meander
model
Based on release duration of 1
hour
Meander factor depends on
wind speed and stability class
Meander factor reaches a
maximum at 800 m then
diminishes

Model Conservatisms
Gaussian plume model has some conservative
tendencies
Straight-line Gaussian plume model produces
maximum peak doses at site boundaries
Other results, e.g., population doses and predicted
health effects, are not necessarily conservative
Other aspects of model are mostly controlled by
user input and can be conservative or best
estimate, e.g.,
Choice of dispersion parameters
Choice of deposition velocity
Parameter Conservatisms – Wind Speed
Requiring minimum 0.5 m/s wind speed may or
may not be conservative
Contaminants may build up in region close to
source during calm winds (nonconservative when
receptor is in cloud)
Contaminants may have spread over a significant
area during calm winds before getting transported
downwind when winds are stronger (conservative if
point source is assumed)
MACCS2 is probably not the right tool for sites
with calm winds more than 5% of the time

Parameter Conservatisms –
Deposition Velocity
Deposition velocity can be
chosen conservatively for
specific results
Small deposition velocity
maximizes inhalation dose
(important for alpha emitters)
Small deposition velocity
minimizes groundshine dose
(important for gamma emitters
and longer exposure times)
Small deposition velocities are
generally conservative when
only inhalation and cloudshine
are important

Parameter Conservatisms – Dispersion
Gaussian plume model with point source at short
distances can be highly conservative (dose to collocated
worker)
Notes on dispersion at short distances
Tadmor and Gur dispersion correlation should not be used at
distances less than 500 m, as recommended by authors
NRC correlation of Pasquill-Gifford is valid at shorter distances
NRC correlation is more conservative than Briggs Open
Country model
Most dispersion correlations provide similar results
between 500 m and 10 km
Comparison of Briggs Open Country and Pasquill-Gifford
Briggs is less conservative at distances less than ~10 km
Briggs is more conservative at distances beyond ~10 km

Modeling Uncertainties
Atmospheric transport is inherently uncertain
Uncertainty occurs at many levels
Uncertainty and lack of resolution of atmospheric
data
Use of simplified dispersion and deposition
models to reduce CPU time
Lack of knowledge of dispersion and deposition
parameters that apply under specific conditions
Stochastic uncertainties in weather
WinMACCS (distributed with newer versions of
MACCS2) contains a framework for sampling
uncertain inputs
Goals of WinMACCS Interface to MACCS2
Increased usability
Reduce potential for errors
Improve productivity
Compatibility with current input files (import
function)
Simple interface with SECPOP, COMIDA2, and
MELCOR
LHS shell for sampling uncertain inputs
Capability to create and export graphs
Preservation of current capabilities

WinMACCS Overview
Interface shows
Menu
Project properties,
parameters, and files
Calculation progress
and error messages
Run Models screen
Legend

Project Properties
Project properties
determine what
data are needed
Color coding
shows the input
categories that
require attention
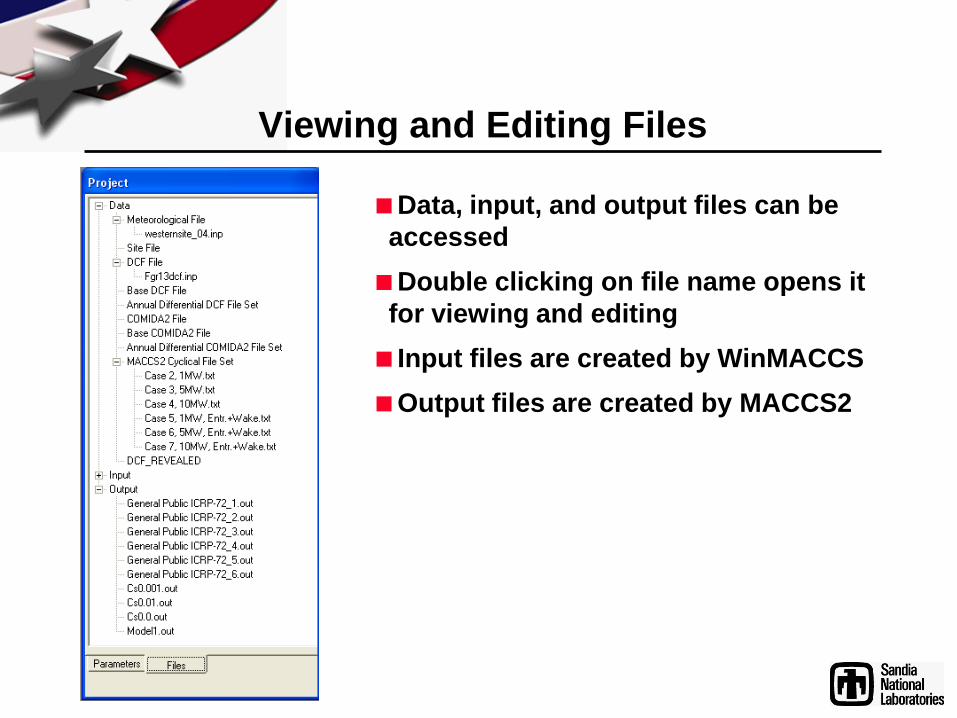
Viewing and Editing Files
Data, input, and output files can be
accessed
Double clicking on file name opens it
for viewing and editing
Input files are created by WinMACCS
Output files are created by MACCS2
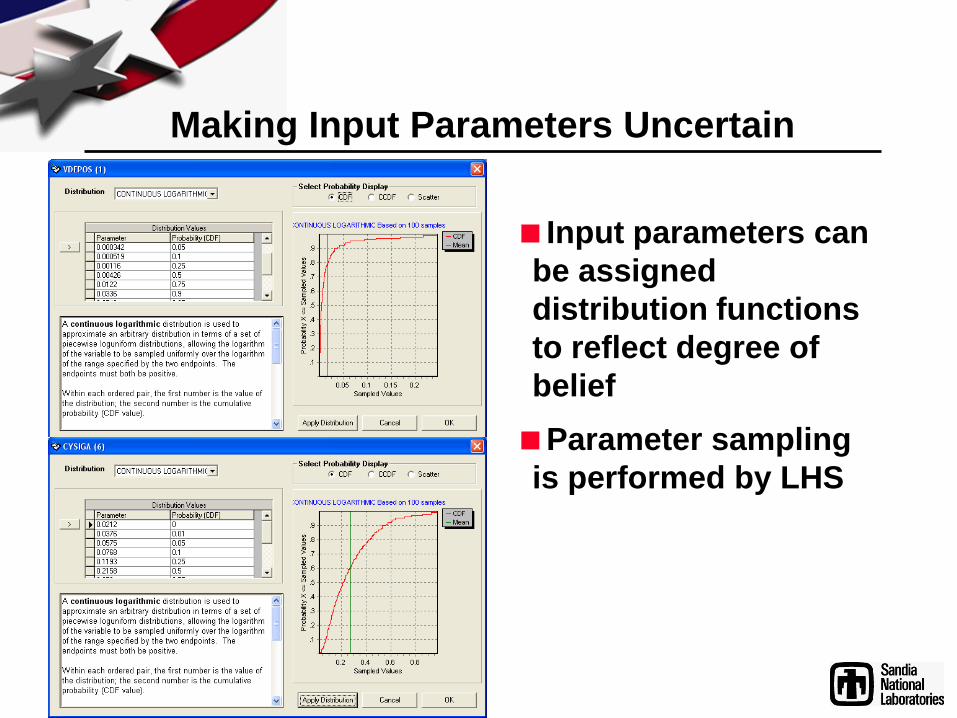
Making Input Parameters Uncertain
Input parameters can
be assigned
distribution functions
to reflect degree of
belief
Parameter sampling
is performed by LHS
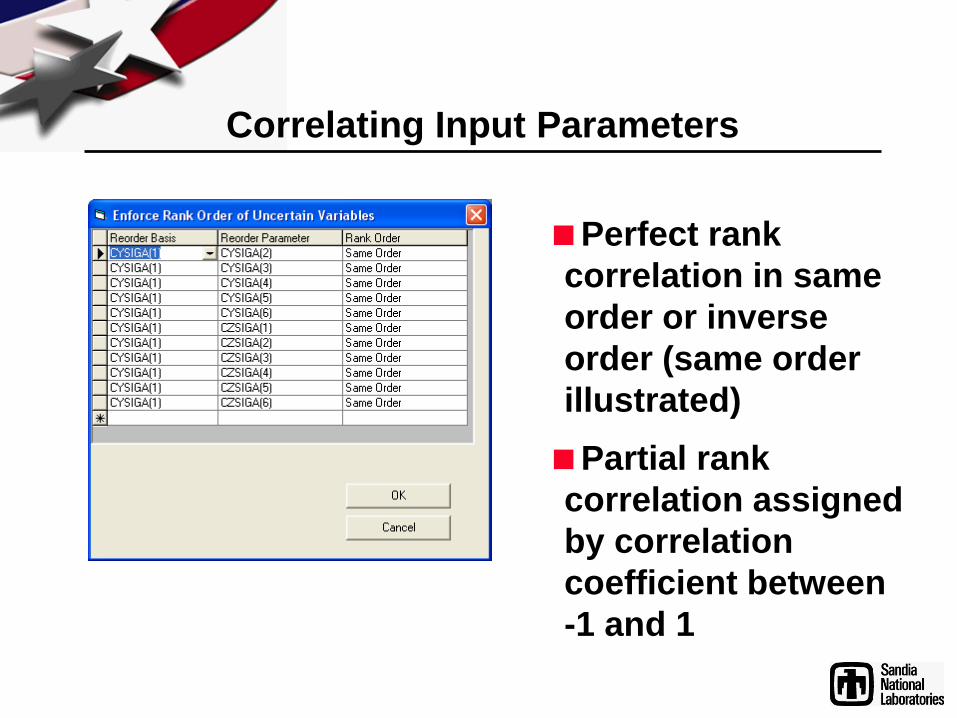
Correlating Input Parameters
Perfect rank
correlation in same
order or inverse
order (same order
illustrated)
Partial rank
correlation assigned
by correlation
coefficient between
-1 and 1

Evaluation of Uncertain Inputs
DOE currently uses the 95th percentile weather
result to characterize peak dose at site boundary
Some inputs are chosen as best estimates
Other inputs are chosen conservatively
Piling up a number of conservative assumptions can
lead to results representing 99th or higher percentile
An alternative strategy is to evaluate uncertain
input values (in addition to weather)
Create distributions for uncertain inputs
Use WinMACCS to sample inputs and evaluate
overall 95th percentile results
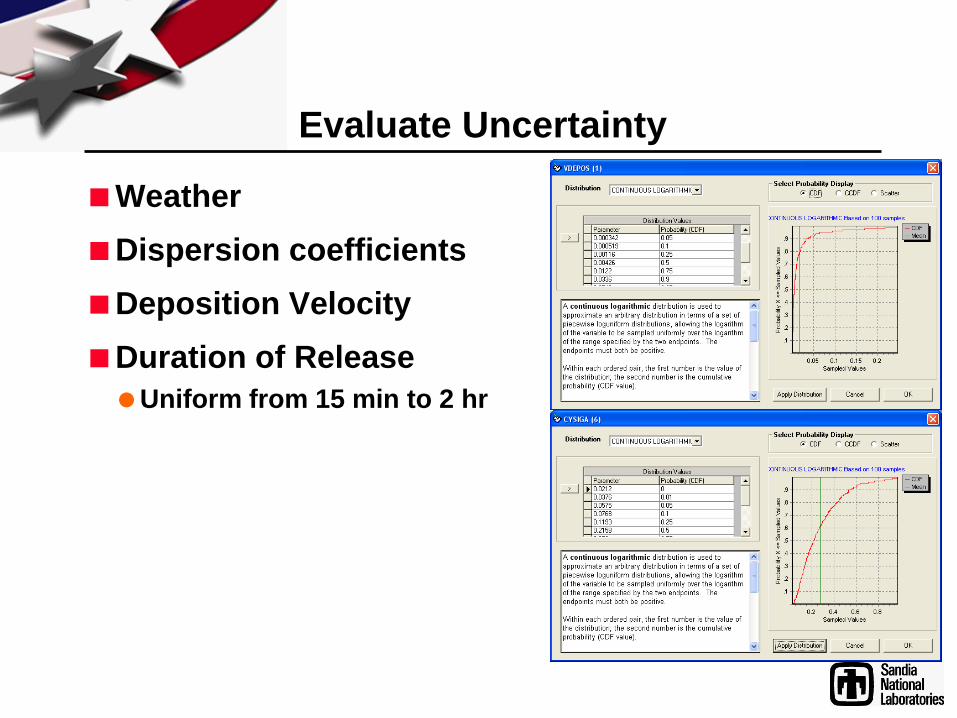
Evaluate Uncertainty
Weather
Dispersion coefficients
Deposition Velocity
Duration of Release
Uniform from 15 min to 2 hr

Comparison of DOE Point Estimate
with Distribution Representing Uncertain Inputs
Dose Results at 1 km Downwind of Source
Combined Distribution
Curve represents
Weather uncertainty
Uncertainty in deposition
velocity
Uncertainty in dispersion
Uncertainty in release
duration
Weather Only Curve
represents weather
uncertainty
95th percentile result aligns
with 96th percentile of
Combined Distribution
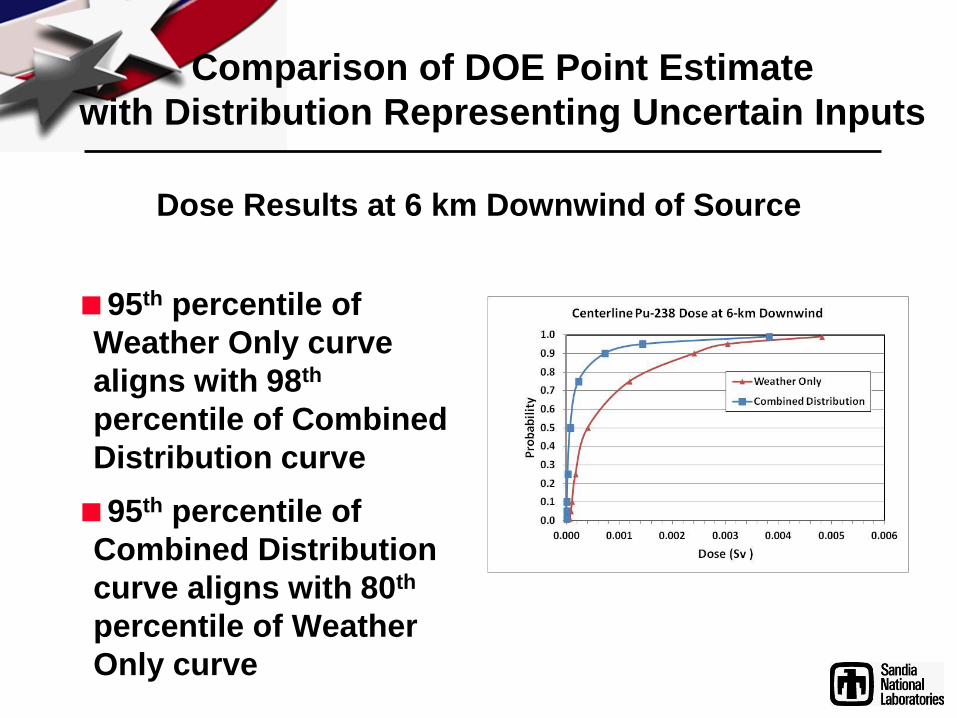
Comparison of DOE Point Estimate
with Distribution Representing Uncertain Inputs
Dose Results at 6 km Downwind of Source
95th percentile of
Weather Only curve
aligns with 98th
percentile of Combined
Distribution curve
95th percentile of
Combined Distribution
curve aligns with 80th
percentile of Weather
Only curve

Comparison of DOE Point Estimate
with Distribution Representing Uncertain Inputs
Dose Results at 15 km Downwind of Source
95th percentile of
Weather Only curve
aligns with 99th
percentile of Combined
Distribution curve

Graphical Output
CCDFs displayed
for uncertain
Weather data
Input parameters
Grand mean
Data can be
exported for further
analysis and
plotting

MACCS2 Support and Development
Sandia is continuing to support and develop
MACCS2
User support
Distribution of code versions (1.13.1, 2.4, and 2.5)
Version 2.6 will be released this month
Code updates in response to user feedback
A Windows interface, WinMACCS, is available
Versions 3.5 and 3.6 have been released
Version 3.7 (coupled with MACCS2 2.6) is
scheduled to be released very soon