current water accounts and water quality for the cooper
TRANSCRIPT
A scientific collaboration between the Department of the Environment, Bureau of Meteorology, CSIRO and Geoscience Australia
1 Current water accounts and water quality for the Cooper subregion Product 1.5 for the Cooper subregion from the Lake Eyre Basin Bioregional Assessment
2 September 2015
v20151026
The Bioregional Assessment Programme The Bioregional Assessment Programme is a transparent and accessible programme of baseline assessments that increase the available science for decision making associated with coal seam gas and large coal mines. A bioregional assessment is a scientific analysis of the ecology, hydrology, geology and hydrogeology of a bioregion with explicit assessment of the potential direct, indirect and cumulative impacts of coal seam gas and large coal mining development on water resources. This Programme draws on the best available scientific information and knowledge from many sources, including government, industry and regional communities, to produce bioregional assessments that are independent, scientifically robust, and relevant and meaningful at a regional scale.
The Programme is funded by the Australian Government Department of the Environment. The Department of the Environment, Bureau of Meteorology, CSIRO and Geoscience Australia are collaborating to undertake bioregional assessments. For more information, visit http://www.bioregionalassessments.gov.au.
Department of the Environment The Office of Water Science, within the Australian Government Department of the Environment, is strengthening the regulation of coal seam gas and large coal mining development by ensuring that future decisions are informed by substantially improved science and independent expert advice about the potential water related impacts of those developments. For more information, visit http://www.environment.gov.au/coal-seam-gas-mining/.
Bureau of Meteorology The Bureau of Meteorology is Australia’s national weather, climate and water agency. Under the Water Act 2007, the Bureau is responsible for compiling and disseminating Australia's water information. The Bureau is committed to increasing access to water information to support informed decision making about the management of water resources. For more information, visit http://www.bom.gov.au/water/.
CSIRO Australia is founding its future on science and innovation. Its national science agency, CSIRO, is a powerhouse of ideas, technologies and skills for building prosperity, growth, health and sustainability. It serves governments, industries, business and communities across the nation. For more information, visit http://www.csiro.au.
Geoscience Australia Geoscience Australia is Australia’s national geoscience agency and exists to apply geoscience to Australia’s most important challenges. Geoscience Australia provides geoscientific advice and information to the Australian Government to support current priorities. These include contributing to responsible resource development; cleaner and low emission energy technologies; community safety; and improving marine planning and protection. The outcome of Geoscience Australia’s work is an enhanced potential for the Australian community to obtain economic, social and environmental benefits through the application of first class research and information. For more information, visit http://www.ga.gov.au.
ISBN-PDF 978-1-925315-11-0
Citation Karim F, Smith M and Cassel R (2015) Current water accounts and water quality for the Cooper subregion. Product 1.5 for the Cooper subregion from the Lake Eyre Basin Bioregional Assessment. Department of the Environment, Bureau of Meteorology, CSIRO and Geoscience Australia, Australia. http://data.bioregionalassessments.gov.au/product/LEB/COO/1.5.
Authorship is listed in relative order of contribution.
Copyright
© Commonwealth of Australia 2015 With the exception of the Commonwealth Coat of Arms and where otherwise noted, all material in this publication is provided under a Creative Commons Attribution 3.0 Australia Licence http://www.creativecommons.org/licenses/by/3.0/au/deed.en. The Bioregional Assessment Programme requests attribution as ‘© Commonwealth of Australia (Bioregional Assessment Programme http://www.bioregionalassessments.gov.au)’.
Disclaimer The information contained in this report is based on the best available information at the time of publication. The reader is advised that such information may be incomplete or unable to be used in any specific situation. Therefore decisions should not be made based solely on this information or without seeking prior expert professional, scientific and technical advice. The Bioregional Assessment Programme is committed to providing web accessible content wherever possible. If you are having difficulties with accessing this document please contact [email protected].
Cover photograph Cooper Creek near Innamincka, SA, 23 May 2013
Credit: Dr Anthony Budd, Geoscience Australia
Current water accounts and water quality for the Cooper subregion | iii
Contents
Contributors to the Technical Programme ................................................................................. vi
Acknowledgements ................................................................................................................. viii
Introduction ............................................................................................................................... 1
The Bioregional Assessment Programme ................................................................................... 1
Methodologies ............................................................................................................................ 3
Technical products ...................................................................................................................... 4
About this technical product ...................................................................................................... 7
References .................................................................................................................................. 7
1.5.1 Current water accounts ................................................................................................... 10
1.5.1.1 Surface water............................................................................................................. 11
1.5.1.1.1 Water accounts in the Cooper creek basin......................................................... 13
1.5.1.1.2 Gaps .................................................................................................................... 13
References ................................................................................................................................ 14
Datasets ................................................................................................................................... 15
1.5.1.2 Groundwater ............................................................................................................. 16
1.5.1.2.1 Current water accounts ...................................................................................... 16
1.5.1.2.2 Water management ............................................................................................ 20
1.5.1.2.3 Gaps .................................................................................................................... 21
References ................................................................................................................................ 21
Datasets ................................................................................................................................... 22
1.5.2 Water quality .................................................................................................................. 25
1.5.2.1 Surface water............................................................................................................. 25
1.5.2.1.1 Water quality in the Cooper creek basin ............................................................ 26
1.5.2.1.2 Gaps .................................................................................................................... 27
References ................................................................................................................................ 27
Datasets ................................................................................................................................... 28
1.5.2.2 Groundwater ............................................................................................................. 29
1.5.2.2.1 Total dissolved solids .......................................................................................... 29
1.5.2.2.2 Trace elements.................................................................................................... 31
1.5.2.2.3 Gaps .................................................................................................................... 34
References ................................................................................................................................ 34
Datasets ................................................................................................................................... 36
iv | Current water accounts and water quality for the Cooper subregion
Figures
Figure 1 Schematic diagram of the bioregional assessment methodology ......................................... 2
Figure 2 The simple decision tree indicates the flow of information through a bioregional assessment ........................................................................................................................................... 5
Figure 3 The Cooper subregion and associated nearby river basins showing major streams and water bodies ...................................................................................................................................... 12
Figure 4 Water resource plan (WRP) and groundwater management areas of the Cooper subregion ........................................................................................................................................... 17
Figure 5 Location and identified purpose of bores in the Cooper subregion .................................... 18
Figure 6 Observed electrical conductivity (EC) at gauging station (GS 003202A) Thomson River at Longreach, in the Cooper creek basin. The black solid line indicates the water quality objective trigger value for the Lake Eyre basin ................................................................................................. 27
Figure 7 Total dissolved solids (mg/L) of groundwater in the Cadna-owie – Hooray Aquifer (and equivalents) across the Cooper subregion ........................................................................................ 30
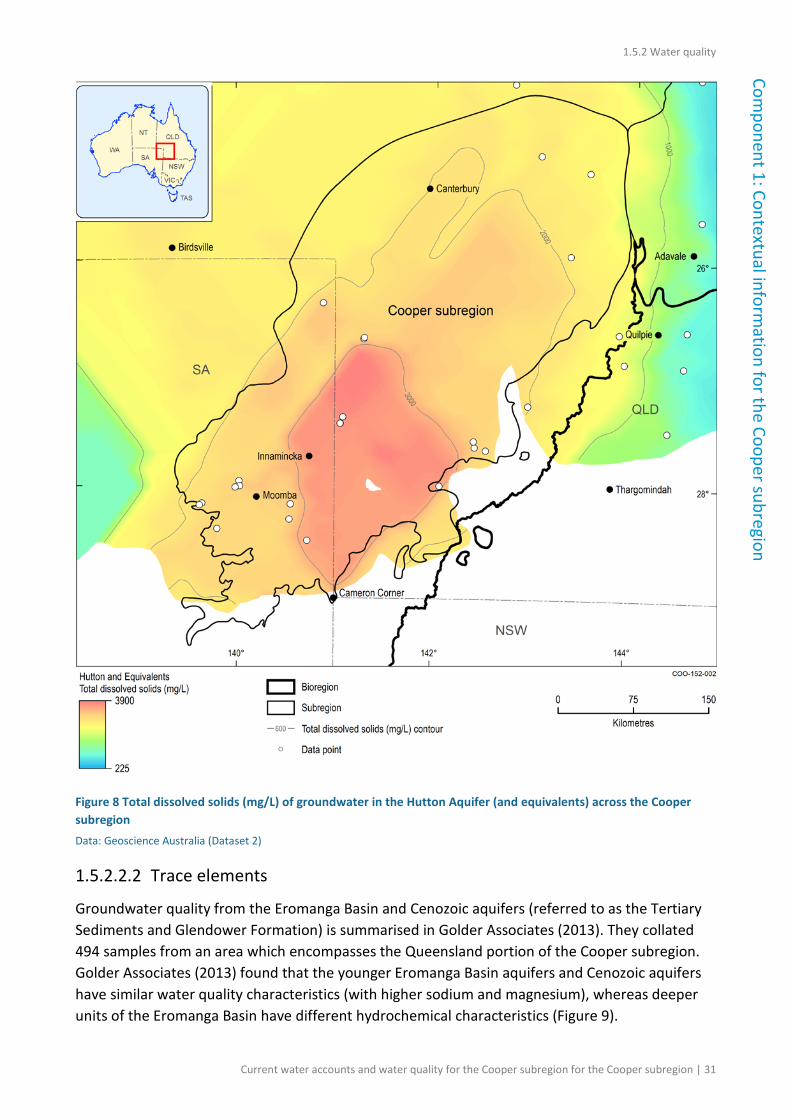
Figure 8 Total dissolved solids (mg/L) of groundwater in the Hutton Aquifer (and equivalents) across the Cooper subregion ............................................................................................................. 31
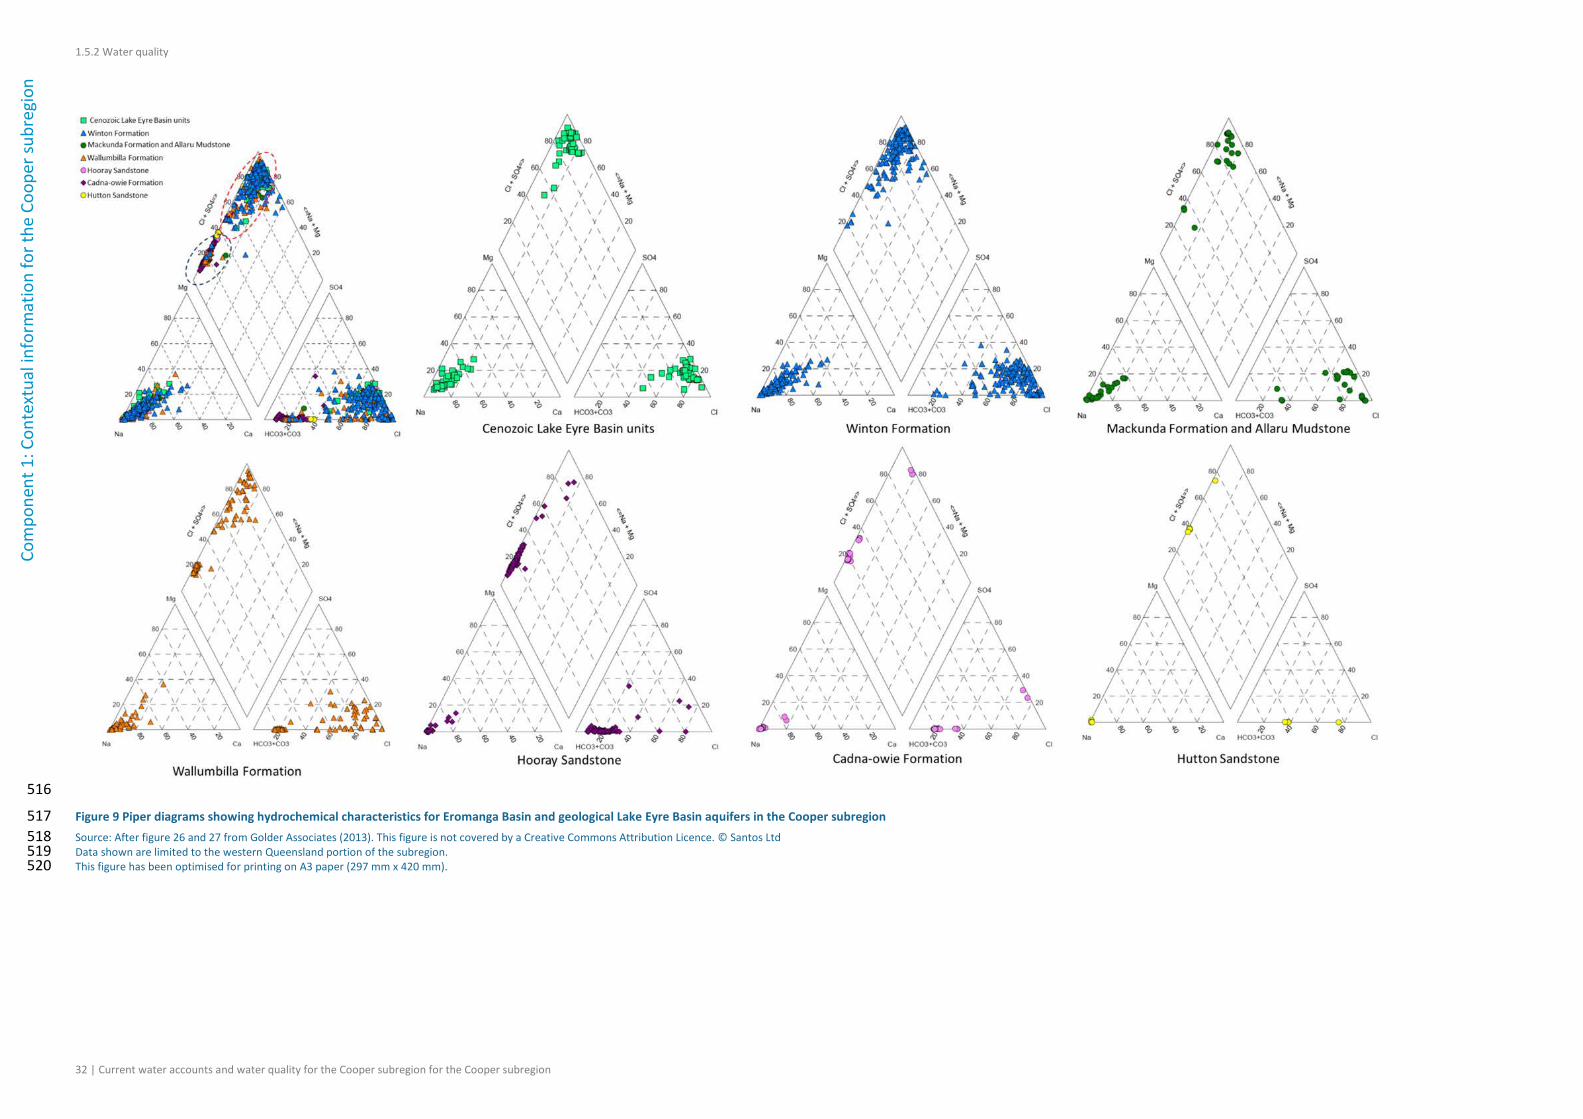
Figure 9 Piper diagrams showing hydrochemical characteristics for Eromanga Basin and geological Lake Eyre Basin aquifers in the Cooper subregion ........................................................... 32
Figure 10 Piper diagram showing hydrochemical characteristics of groundwater in the southern Cooper Basin ...................................................................................................................................... 33
Current water accounts and water quality for the Cooper subregion | v
Tables
Table 1 Methodologies and associated technical products listed in Table 2 ...................................... 3
Table 2 Technical products delivered by the Lake Eyre Basin Bioregional Assessment ...................... 6
Table 3 Queensland water resource plans and groundwater management areas ........................... 19
Table 4 Summary of authorised purposes for licences in Queensland for the Central and Warrego West groundwater management areas of the Great Artesian Basin Water Resource Plan Area ............................................................................................................................................ 20
Table 5 Comparison of groundwater quality from the Cooper subregion with Australian Drinking Water Guidelines ............................................................................................................................... 34
vi | Current water accounts and water quality for the Cooper subregion
Contributors to the Technical Programme
The following individuals have contributed to the Technical Programme, the part of the Bioregional Assessment Programme that undertakes bioregional assessments. Leaders are underlined.
Assistant Secretary Department of the Environment: Matthew Whitfort
Programme Director Department of the Environment: Anthony Swirepik
Technical Programme Director Bureau of Meteorology: Bronwyn Ray
Projects Director CSIRO: David Post
Principal Science Advisor Department of the Environment: Peter Baker
Science Directors CSIRO: Brent Henderson
Geoscience Australia: Steven Lewis
Integration Lead Bureau of Meteorology: Richard Mount
Programme management Bureau of Meteorology: Graham Hawke, Louise Minty
CSIRO: Paul Hardisty, Warwick McDonald
Geoscience Australia: Stuart Minchin
Project Leaders CSIRO: Alexander Herr, Tim McVicar, David Rassam
Geoscience Australia: Hashim Carey, Kriton Glenn, Tim Evans, Martin Smith
Bureau of Meteorology: Natasha Herron
Assets and receptors Bureau of Meteorology: Richard Mount, Eliane Prideaux
Department of the Environment: Larry Guo, Glenn Johnstone, Brad Moore, Wasantha Perera, Jin Wang
Bioregional Assessment Information Platform
Bureau of Meteorology: Derek Chen, Trevor Christie-Taylor, Melita Dahl, Lakshmi Devanathan, Angus MacAulay, Christine Panton, Paul Sheahan, Kellie Stuart, Carl Sudholz
CSIRO: Peter Fitch
Department of the Environment: Geraldine Cusack
Geoscience Australia: Neal Evans
Communications Bureau of Meteorology: Karen de Plater
CSIRO: Chris Gerbing
Department of the Environment: Lea Locke, Milica Milanja
Geoscience Australia: Chris Thompson
Current water accounts and water quality for the Cooper subregion | vii
Coordination Bureau of Meteorology: Julie Burke, Sarah van Rooyen
CSIRO: Ruth Palmer
Department of the Environment: James Hill, Angela Kaplish, Megan Stanford, Craig Watson
Geoscience Australia: Tenai Luttrell
Ecology CSIRO: Tanya Doody, Brendan Ebner, Kate Holland, Craig MacFarlane, Patrick Mitchell, Justine Murray, Anthony O'Grady, Chris Pavey, Jodie Pritchard, Nat Raisbeck-Brown, Ashley Sparrow, Georg Wiehl
Geology CSIRO: Deepak Adhikary, Luke Connell, Emanuelle Frery, Jane Hodgkinson, James Kear, Manoj Khanal, Zhejun Pan, Kaydy Pinetown, Matthias Raiber, Hayley Rohead-O'Brien, Regina Sander, Peter Schaubs, Garth Warren, Paul Wilkes, Andrew Wilkins, Yanhua Zhang
Geoscience Australia: Stephen Hostetler, Steven Lewis, Bruce Radke
Geographic information systems
CSIRO: Caroline Bruce, Jody Bruce, Steve Marvanek, Arthur Read
Geoscience Australia: Adrian Dehelean
Groundwater modelling CSIRO: Olga Barron, Russell Crosbie, Tao Cui, Warrick Dawes, Lei Gao, Sreekanth Janardhanan, Luk Peeters, Praveen Kumar Rachakonda, Wolfgang Schmid, Saeed Torkzaban, Chris Turnadge, Binzhong Zhou
Hydrogeology CSIRO: Konrad Miotlinski
Geoscience Australia: Rebecca Cassel, Steven Hostetler, Jim Kellett, Jessica Northey, Tim Ransley, Baskaran Sundaram, Gabrielle Yates
Information management Bureau of Meteorology: Belinda Allison, Jill McNamara, Brendan Moran, Suzanne Slegers
CSIRO: Nick Car, Phil Davies, Andrew Freebairn, Mick Hartcher, Geoff Hodgson, Brad Lane, Ben Leighton, Trevor Pickett, Ramneek Singh, Matt Stenson
Geoscience Australia: Luke Caruana, Matti Peljo
Products CSIRO: Maryam Ahmad, Daniel Aramini, Heinz Buettikofer, Sonja Chandler, Simon Gallant, Karin Hosking, Frances Marston, Linda Merrin, Becky Schmidt, Sally Tetreault-Campbell, Catherine Ticehurst
Geoscience Australia: Penny Kilgour, Kathryn Owen
Risk and uncertainty CSIRO: Simon Barry, Jeffery Dambacher, Jess Ford, Keith Hayes, Geoff Hosack, Yang Liu, Warren Jin, Dan Pagendam, Carmel Pollino
Surface water hydrology CSIRO: Santosh Aryal, Mat Gilfedder, Fazlul Karim, Lingtao Li, Dave McJannet, Jorge Luis Peña-Arancibia, Xiaogang Shi, Tom Van Niel, Neil Viney, Bill Wang, Ang Yang, Yongqiang Zhang
viii | Current water accounts and water quality for the Cooper subregion
Acknowledgements
This technical product was reviewed by several groups:
• Discipline Leaders: Russell Crosbie (Groundwater modelling, CSIRO) and Neil Viney (Surface water hydrology, CSIRO).
• Senior Science Leaders: David Post (Projects Director, CSIRO), Steven Lewis (Science Director, Geoscience Australia), Brent Henderson (Science Director, CSIRO), Becky Schmidt (Products Manager, CSIRO)
Technical Assurance Reference Group: Chaired by Peter Baker (Principal Science Advisor, Department of the Environment), this group comprises officials from the New South Wales, Queensland, South Australian and Victorian governments
Current water accounts and water quality for the Cooper subregion | 1
Introduction
The Independent Expert Scientific Committee on Coal Seam Gas and Large Coal Mining Development (IESC) was established to provide advice to the federal Minister for the Environment on potential water-related impacts of coal seam gas (CSG) and large coal mining developments.
Bioregional assessments (BAs) are one of the key mechanisms to assist the IESC in developing this advice so that it is based on best available science and independent expert knowledge. Importantly, technical products from BAs are also expected to be made available to the public, providing the opportunity for all other interested parties, including government regulators, industry, community and the general public, to draw from a single set of accessible information. A BA is a scientific analysis, providing a baseline level of information on the ecology, hydrology, geology and hydrogeology of a bioregion with explicit assessment of the potential direct, indirect and cumulative impacts of CSG and coal mining development on water resources.
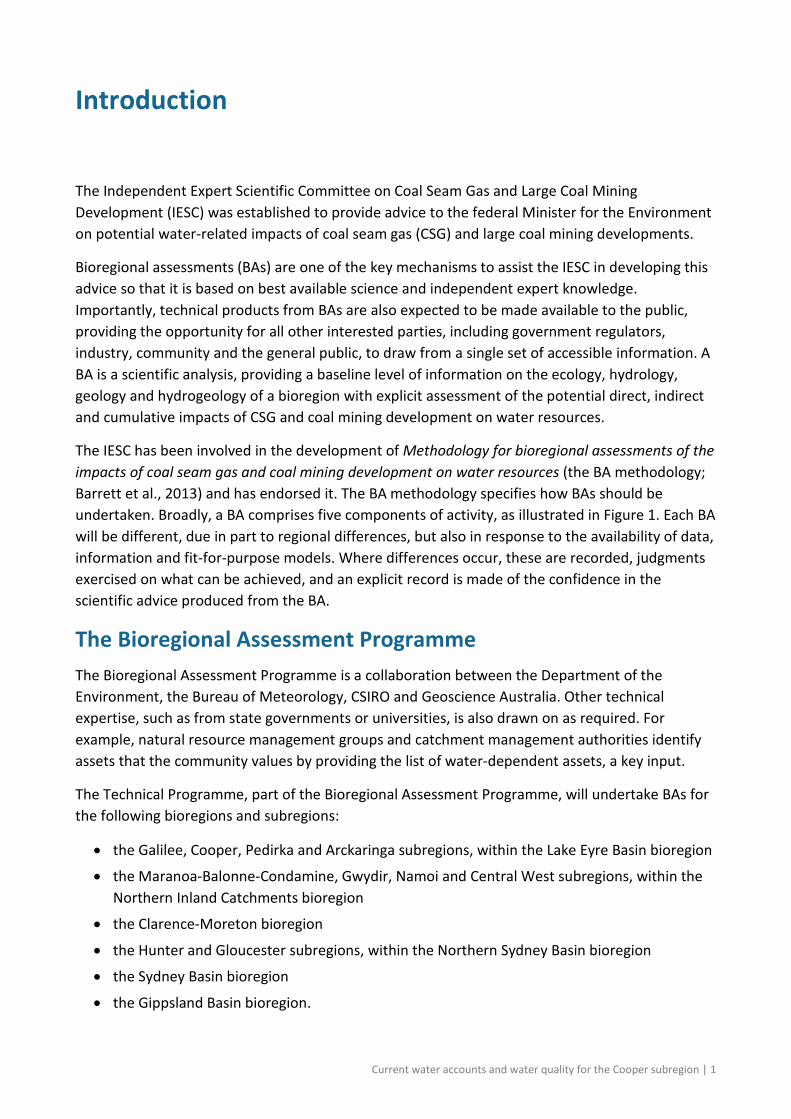
The IESC has been involved in the development of Methodology for bioregional assessments of the impacts of coal seam gas and coal mining development on water resources (the BA methodology; Barrett et al., 2013) and has endorsed it. The BA methodology specifies how BAs should be undertaken. Broadly, a BA comprises five components of activity, as illustrated in Figure 1. Each BA will be different, due in part to regional differences, but also in response to the availability of data, information and fit-for-purpose models. Where differences occur, these are recorded, judgments exercised on what can be achieved, and an explicit record is made of the confidence in the scientific advice produced from the BA.
The Bioregional Assessment Programme The Bioregional Assessment Programme is a collaboration between the Department of the Environment, the Bureau of Meteorology, CSIRO and Geoscience Australia. Other technical expertise, such as from state governments or universities, is also drawn on as required. For example, natural resource management groups and catchment management authorities identify assets that the community values by providing the list of water-dependent assets, a key input.
The Technical Programme, part of the Bioregional Assessment Programme, will undertake BAs for the following bioregions and subregions:
• the Galilee, Cooper, Pedirka and Arckaringa subregions, within the Lake Eyre Basin bioregion
• the Maranoa-Balonne-Condamine, Gwydir, Namoi and Central West subregions, within the Northern Inland Catchments bioregion
• the Clarence-Moreton bioregion
• the Hunter and Gloucester subregions, within the Northern Sydney Basin bioregion
• the Sydney Basin bioregion
• the Gippsland Basin bioregion.
2 | Current water accounts and water quality for the Cooper subregion
Technical products (described in a later section) will progressively be delivered throughout the Programme.
Figure 1 Schematic diagram of the bioregional assessment methodology The methodology comprises five components, each delivering information into the bioregional assessment and building on prior components, thereby contributing to the accumulation of scientific knowledge. The small grey circles indicate activities external to the bioregional assessment. Risk identification and risk likelihoods are conducted within a bioregional assessment (as part of Component 4) and may contribute activities undertaken externally, such as risk evaluation, risk assessment and risk treatment. Source: Figure 1 in Barrett et al. (2013), © Commonwealth of Australia
Current water accounts and water quality for the Cooper subregion | 3
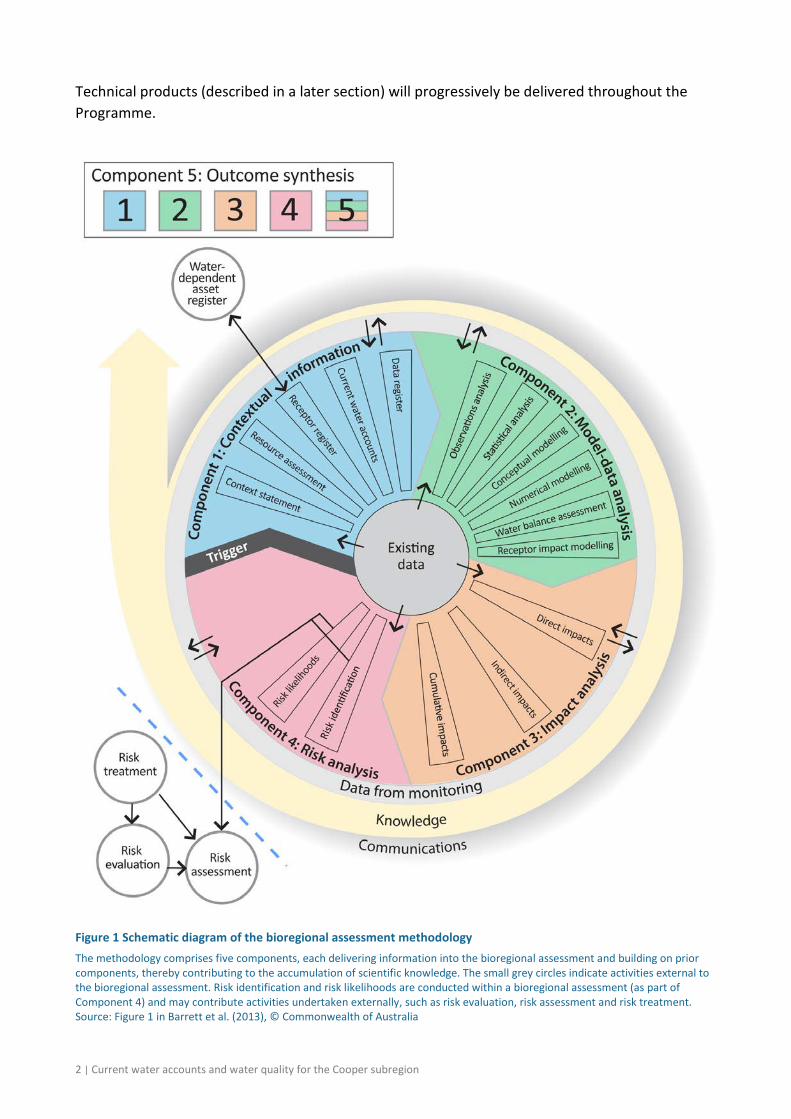
Methodologies For transparency and to ensure consistency across all BAs, submethodologies have been developed to supplement the key approaches outlined in the Methodology for bioregional assessments of the impact of coal seam gas and coal mining development on water resources (Barrett et al., 2013). This series of submethodologies aligns with technical products as presented in Table 1. The submethodologies are not intended to be ‘recipe books’ nor to provide step-by-step instructions; rather they provide an overview of the approach to be taken. In some instances, methods applied for a particular BA may need to differ from what is proposed in the submethodologies – in this case an explanation will be supplied. Overall, the submethodologies are intended to provide a rigorously defined foundation describing how BAs are undertaken.
Table 1 Methodologies and associated technical products listed in Table 2
Code Proposed title Summary of content Associated technical product M01 Methodology for A high-level description of the scientific and All bioregional assessments intellectual basis for a consistent approach of the impacts of coal to all bioregional assessments seam gas and coal mining development on
water resources
M02 Compiling water-dependent assets
Describes the approach for determining water-dependent assets
1.3 Description of the water-dependent asset register
M03 Assigning receptors and impact variables to water-dependent assets
Describes the approach for determining receptors associated with water-dependent assets
1.4 Description of the receptor register
M04 Developing a coal resource development pathway
Specifies the information that needs to be collected and reported in product 1.2 (i.e. known coal and coal seam gas resources as
1.2 Coal and coal seam gas resource assessment
well as current and potential resource developments). Describes the process for determining the coal resource development pathway (reported in product 2.3)
2.3 Conceptual modelling
M05 Developing the conceptual model for causal pathways
Describes the development of the conceptual model for causal pathways, which summarises how the ‘system’ operates and articulates the links between coal resource developments and impacts on receptors
2.3 Conceptual modelling
M06 Surface water modelling Describes the approach taken for surface water modelling across all of the bioregions and subregions. It covers the model(s) used, as well as whether modelling will be quantitative or qualitative.
2.6.1 Surface water numerical modelling
M07 Groundwater modelling Describes the approach taken for groundwater modelling across all of the bioregions and subregions. It covers the model(s) used, as well as whether modelling will be quantitative or qualitative. It also considers surface water – groundwater interactions, as well as how the groundwater modelling is constrained by geology.
2.6.2 Groundwater numerical modelling
4 | Current water accounts and water quality for the Cooper subregion
Code Proposed title Summary of content Associated technical product M08 Receptor impact modelling Describes how to develop the receptor impact
models that are required to assess the potential impacts from coal seam gas and large coal mining on receptors. Conceptual, semi-quantitative and quantitative numerical models are described.
2.7 Receptor impact modelling
M09 Propagating uncertainty through models
Describes the approach to sensitivity analysis and quantifying uncertainty in the modelled hydrological response to coal and coal seam gas development
2.3 Conceptual modelling 2.6.1 Surface water numerical modelling 2.6.2 Groundwater numerical modelling 2.7 Receptor impact modelling
M10 Risk and cumulative Describes the process to identify and 3 Impact analysis
impacts on receptors analyse risk 4 Risk analysis
M11 Hazard identification Describes the process to identify potential 2 Model-data analysis water-related hazards from coal and coal 3 Impact analysis
seam gas development 4 Risk analysis
M12 Fracture propagation Describes the likely extent of both vertical and 2 Model-data analysis and chemical horizontal fractures due to hydraulic stimulation 3 Impact analysis
concentrations and the likely concentration of chemicals after production of coal seam gas
4 Risk analysis
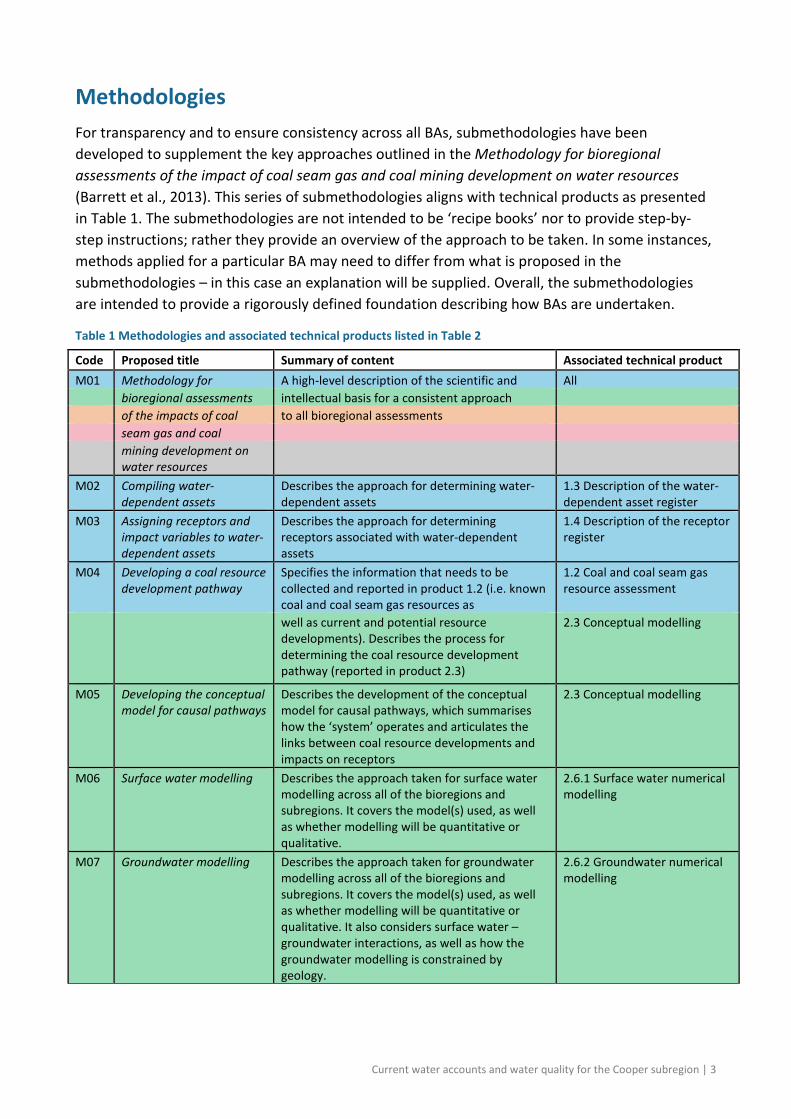
Each submethodology is available online at http://www.bioregionalassessments.gov.au. Submethodologies might be added in the future.
Technical products The outputs of the BAs include a suite of technical products variously presenting information about the ecology, hydrology, hydrogeology and geology of a bioregion and the potential direct, indirect and cumulative impacts of CSG and coal mining developments on water resources, both above and below ground. Importantly, these technical products are available to the public, providing the opportunity for all interested parties, including community, industry and government regulators, to draw from a single set of accessible information when considering CSG and large coal mining developments in a particular area.
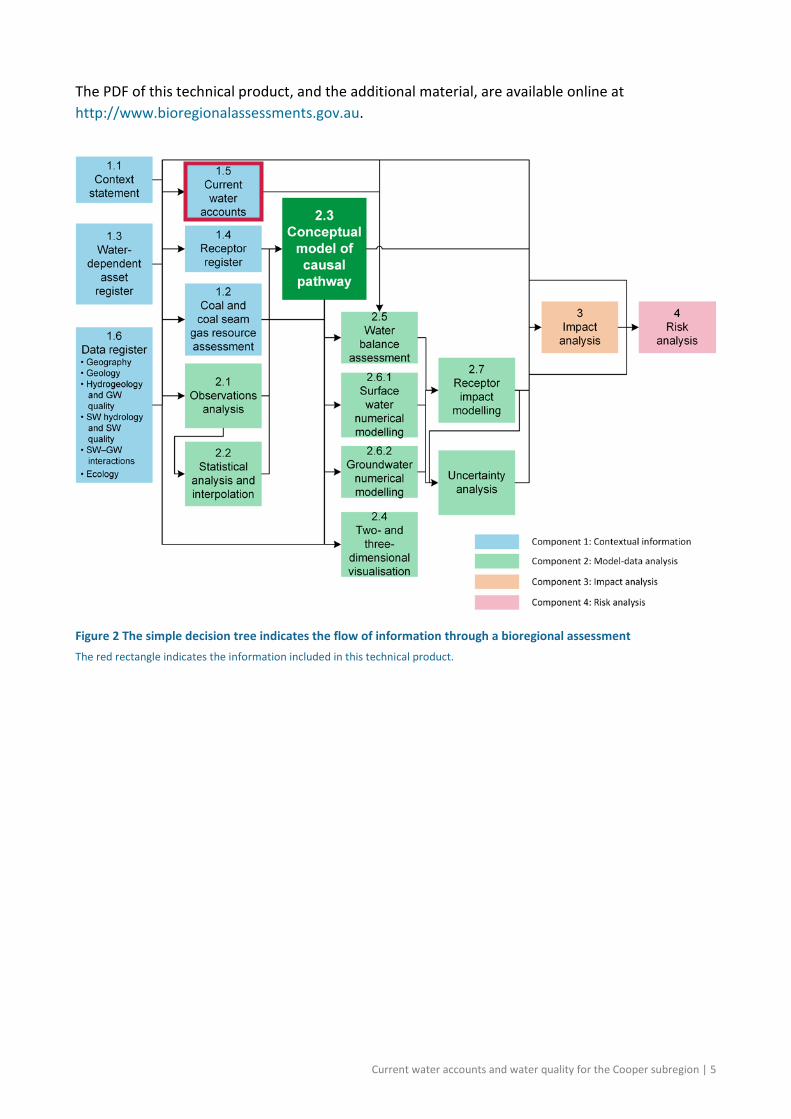
The information included in the technical products is specified in the BA methodology. Figure 2 shows the information flow within a BA. Table 2 lists the content provided in the technical products, with cross-references to the part of the BA methodology that specifies it. The red rectangles in both Figure 2 and Table 2 indicate the information included in this technical product.
This technical product is delivered as a report (PDF). Additional material is also provided, as specified by the BA methodology:
• all unencumbered data syntheses and databases
• unencumbered tools, model code, procedures, routines and algorithms
• unencumbered forcing, boundary condition, parameter and initial condition datasets
• the workflow, comprising a record of all decision points along the pathway towards completion of the BA, gaps in data and modelling capability, and provenance of data.
Current water accounts and water quality for the Cooper subregion | 5
The PDF of this technical product, and the additional material, are available online at http://www.bioregionalassessments.gov.au.
Figure 2 The simple decision tree indicates the flow of information through a bioregional assessment The red rectangle indicates the information included in this technical product.
6 | Current water accounts and water quality for the Cooper subregion
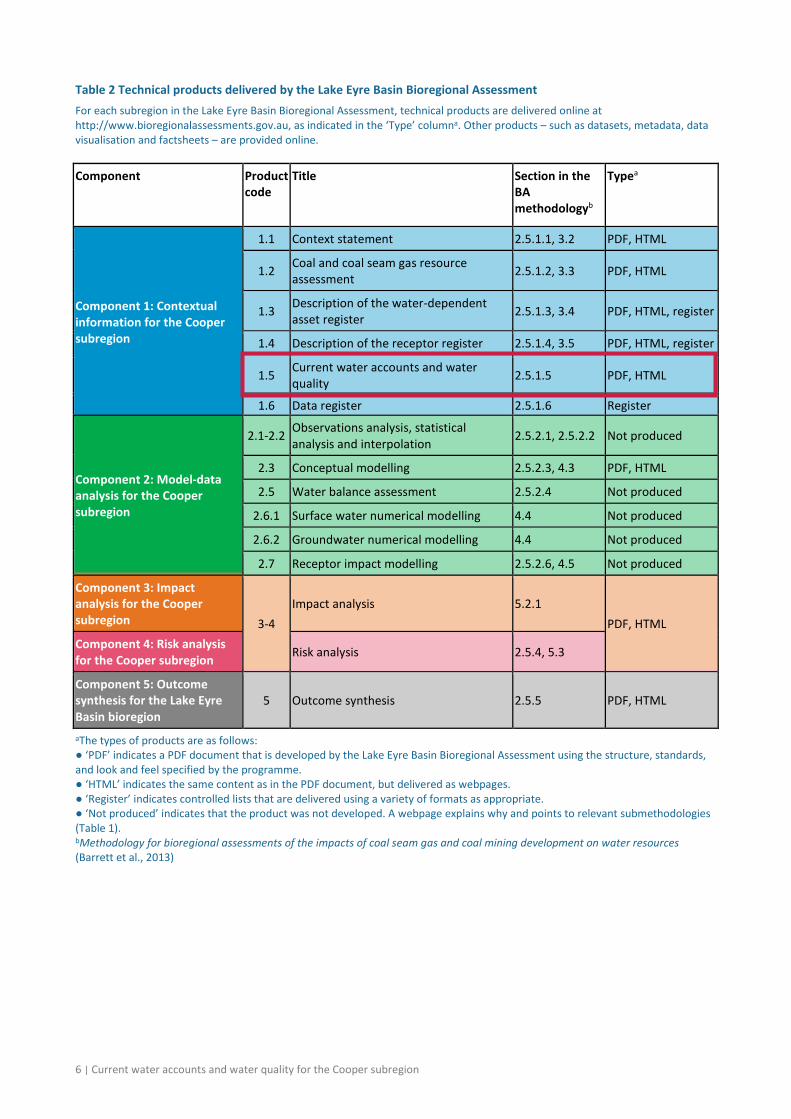
Table 2 Technical products delivered by the Lake Eyre Basin Bioregional Assessment For each subregion in the Lake Eyre Basin Bioregional Assessment, technical products are delivered online at http://www.bioregionalassessments.gov.au, as indicated in the ‘Type’ columna. Other products – such as datasets, metadata, data visualisation and factsheets – are provided online.
Component Product code
Title Section in the BA methodologyb
Typea
Component 1: Contextual information for the Cooper subregion
1.1 Context statement 2.5.1.1, 3.2 PDF, HTML
1.2 Coal and coal seam gas resource assessment 2.5.1.2, 3.3 PDF, HTML
1.3 Description of the water-dependent asset register 2.5.1.3, 3.4 PDF, HTML, register
1.4 Description of the receptor register 2.5.1.4, 3.5 PDF, HTML, register
1.5 Current water accounts and water quality 2.5.1.5 PDF, HTML
1.6 Data register 2.5.1.6 Register
Component 2: Model-data analysis for the Cooper subregion
2.1-2.2 Observations analysis, statistical analysis and interpolation 2.5.2.1, 2.5.2.2 Not produced
2.3 Conceptual modelling 2.5.2.3, 4.3 PDF, HTML
2.5 Water balance assessment 2.5.2.4 Not produced
2.6.1 Surface water numerical modelling 4.4 Not produced
2.6.2 Groundwater numerical modelling 4.4 Not produced
2.7 Receptor impact modelling 2.5.2.6, 4.5 Not produced
Component 3: Impact analysis for the Cooper subregion 3-4
Impact analysis 5.2.1 PDF, HTML
Component 4: Risk analysis for the Cooper subregion Risk analysis 2.5.4, 5.3
Component 5: Outcome synthesis for the Lake Eyre Basin bioregion
5 Outcome synthesis 2.5.5 PDF, HTML
aThe types of products are as follows: ● ‘PDF’ indicates a PDF document that is developed by the Lake Eyre Basin Bioregional Assessment using the structure, standards, and look and feel specified by the programme. ● ‘HTML’ indicates the same content as in the PDF document, but delivered as webpages. ● ‘Register’ indicates controlled lists that are delivered using a variety of formats as appropriate. ● ‘Not produced’ indicates that the product was not developed. A webpage explains why and points to relevant submethodologies (Table 1). bMethodology for bioregional assessments of the impacts of coal seam gas and coal mining development on water resources (Barrett et al., 2013)
Current water accounts and water quality for the Cooper subregion | 7
About this technical product The following notes are relevant only for this technical product.
• All reasonable efforts were made to provide all material under a Creative Commons Attribution 3.0 Australia Licence. The copyright owners of the following figures, however, did not grant permission to do so: Figure 9. It should be assumed that third parties are not entitled to use this material without permission from the copyright owner.
• All maps created as part of this BA for inclusion in this product used the Albers equal area projection with a central meridian of 140.0° East for the Lake Eyre Basin bioregion and two standard parallels of –18.0° and –36.0°.
• Contact [email protected] to access metadata (including copyright, attribution and licensing information) for all datasets cited or used to make figures in this product. At a later date, this information, as well as all unencumbered datasets, will be published online.
• The citation details of datasets are correct to the best of the knowledge of the Bioregional Assessment Programme at the publication date of this product. Readers should use the hyperlinks provided to access the most up-to-date information about these data; where there are discrepancies, the information provided online should be considered correct. The dates used to identify Bioregional Assessment Source Datasets are the dataset’s published date. Where the published date is not available, the last updated date or created date is used. For Bioregional Assessment Derived Datasets, the created date is used.
References
Barrett DJ, Couch CA, Metcalfe DJ, Lytton L, Adhikary DP and Schmidt RK (2013) Methodology for bioregional assessments of the impacts of coal seam gas and coal mining development on water resources. A report prepared for the Independent Expert Scientific Committee on Coal Seam Gas and Large Coal Mining Development through the Department of the Environment. Department of the Environment, Australia. Viewed 2 September 2015, http://www.iesc.environment.gov.au/publications/methodology-bioregional-assessments-impacts-coal-seam-gas-and-coal-mining-development-water.

8 | Current water accounts and water quality for the Cooper subregion
Current water accounts and water quality for the Cooper subregion | 9
1.5 Current water accounts and water quality for the Cooper subregion
Coal resource development potential in this subregion is very low. Therefore numerical modelling is not being undertaken for this subregion, and this product only identifies the sources of information known to be available for current water accounts and water quality.
1.5.1 Current water accounts
10 | Current water accounts and water quality for the Cooper subregion
Com
pone
nt 1
: Con
text
ual i
nfor
mat
ion
for t
he C
oope
r sub
regi
on
1.5.1 Current water accounts
Summary
This product is limited to current publicly available water accounts and water quality information known to be available. This is due to the limited scope of work for the Cooper subregion part of the Lake Eyre Basin Bioregional Assessment Technical Programme (numerical modelling is not being undertaken), and the coal resource development opportunities (see companion product 1.2 for the Cooper subregion (Smith et al., 2015)). Additional information may be held by organisations or companies which is not publicly available.
Water accounts and water quality information is very scant for this bioregion and it may be very difficult to detect changes in either due to coal resource development with the current level of monitoring. For this reason, it would be difficult to assess impacts on water related assets as a result of any coal seam gas (CSG) development (no coal mining is identified in the coal resource development pathway).
This product summarises surface water accounts for the Cooper subregion. The Cooper subregion incorporates a portion of Cooper creek basin and receives water from the two main tributaries of the Cooper Creek: the Thomson and Barcoo rivers. The surface water system in the Cooper subregion is unregulated and has not yet been affected by diversion or major dams. Surface water monitoring stations are relatively dispersed in the Cooper subregion and the mean flow varies between 3150 GL/year at Currareva and about 1430 GL/year at Innamincka. Currently, there are 40 general licences amounting to 17.1 GL and 24 stock and domestic licences amounting to 0.3 GL in the Queensland portion of the Cooper creek basin. There are no surface water licences for the South Australian part of the Cooper creek basin.
This product also summarises groundwater licensing and management for the Cooper subregion. Information presented here represents a compilation of SA and Queensland water licences. These data provide an overview of the water allocations in the subregion. Detailed water accounts are outside the scope of this report. Bores in the Cooper subregion access groundwater for stock and domestic purposes, exploration and industrial purposes (mostly petroleum industry), monitoring, and irrigation. Groundwater is managed according to state management plans. In SA, groundwater extraction from the Great Artesian Basin (GAB) is estimated at around 33.5 ML/day for stock and domestic use, 4 ML/day for town water supply with allowance for up to 60 ML/day for co-produced water from oil and gas extraction. This relates to the entire Far North Prescribed Wells Area (PWA) and, as such, a smaller portion of this groundwater is extracted from the Cooper subregion. Within the Far North PWA, there are 75 licensed groundwater extraction bores, with an approved take of approximately 50 GL/year (based on 2014 groundwater licence information).
There is a total of 168 existing groundwater licences (for 782 bores) within the Central and Warrego West groundwater management areas (GMAs) of the GAB water resource plan in the Queensland portion of the subregion. Of these, groundwater allocations are identified for 13 licences, with an entitlement totalling 3785 ML/year.
1.5.1 Current water accounts
Current water accounts and water quality for the Cooper subregion | 11
Component 1: Contextual inform
ation for the Cooper subregion
1.5.1.1 Surface water
This section presents information on surface water licences and allocations in the Cooper subregion (both SA and Queensland). Detailed water accounts are not required here because water balance modelling will not be undertaken for the Cooper subregion in this iteration of the Bioregional Assessment Technical Programme.
The Cooper Creek is the only major waterway in the Cooper subregion and receives water via the Thomson River from monsoonal rainfall to the north and via the Barcoo River from monsoonal and easterly rain systems to the east (Figure 3). The Cooper surface water system includes an extensive floodplain that dominates the basin south of Windorah and divides into two distinct parts near the Queensland–SA border. The Cooper Creek is an intermittent river, with parts of the river in Queensland exhibiting a seasonal character. Its tributaries are either intermittent or ephemeral (Jaensch, 2009). There are potential coal and coal seam gas resources in the headwater catchments of the Cooper creek basin within the Galilee subregion, which may impact water accounts in the Cooper subregion (Evans et al., 2015; Lewis et al., 2014).
Detailed information on surface water accounts for the Cooper subregion is available from the Queensland Water Monitoring Portal (DNRM, 2015) and SA WaterConnect (Government of South Australia, 2015). The information relating to surface water management (e.g. management plan) and accounting (e.g. water accounting method) may be available from the Queensland Department of Natural Resources and Mines, South Australian Department of Environment, Water and Natural Resources, Natural Resources South Australia Arid Lands, South West Natural Resource Management Limited, or Desert Channels Queensland Incorporated natural resource management (NRM) groups.

1.5.1 Current water accounts
12 | Current water accounts and water quality for the Cooper subregion
Com
pone
nt 1
: Con
text
ual i
nfor
mat
ion
for t
he C
oope
r sub
regi
on
Figure 3 The Cooper subregion and associated nearby river basins showing major streams and water bodies Data: Bureau of Meteorology (Dataset 1)
1.5.1 Current water accounts
Current water accounts and water quality for the Cooper subregion | 13
Component 1: Contextual inform
ation for the Cooper subregion
1.5.1.1.1 Water accounts in the Cooper creek basin
Cooper Creek and its tributaries are unregulated and are characterised by extreme variation in streamflow. The surface water resources in the Cooper subregion have not yet been affected by diversion or dams or weirs (Costelloe, 2013). Furthermore, there is no major public water storage within the entire Cooper creek basin. Surface water monitoring stations are relatively dispersed in the Cooper subregion and the mean flow of Cooper Creek varies between 3150 GL/year at Currareva and about 1430 GL/year at Nappa Merrie – Callyamurra (McMahon et al., 2005). One of the major tributaries of Cooper Creek is the Thomson River, which produces mean annual flow (MAF) of about 2700 GL at Stonehenge. The Barcoo River is another major tributary of Cooper Creek and it produces MAF of about 809 GL at Retreat (McMahon et al., 2005). Streamflow in Cooper Creek and its tributaries is predominantly seasonal and the groundwater contribution is relatively low (the baseflow index is less than 0.2). Currently, the information on total surface water yield is not available for the Cooper creek basin.
Water allocations in the Queensland part of the Cooper creek basin are granted under its six relocateable licence zones (i.e. Torrens Towerhill, Alice, Upper Barcoo, Lower Barcoo, Thomson and Cooper). Currently, there are 40 general licences of nominal entitlements amounting to 17.1 GL/year and 24 stock and domestic licences amounting to 0.3 GL/year (DNRM, 2013). In the 2011 water resource plan for Cooper Creek, the Queensland Government reserved a total of 2000 ML of unallocated water (200 ML for general reserve, 1300 ML for strategic reserve and 500 ML for the town and community reserve) to meet future demand (DERM, 2011).
Water allocations in the SA part of the Cooper creek basin are granted under the water allocation plan for the far north prescribed wells area (SA Arid Lands NRM Board, 2009). Currently, there are no surface water licences and as the use of surface water is insignificant compared to groundwater, it is assumed that all water used for stock and domestic is sourced from groundwater for the accounting of water use (SA Arid Lands NRM Board, 2009).
Surface water management in the Queensland part of the Cooper subregion is summarised in companion product 1.1 for the Cooper subregion (Smith et al., 2015), with more detail provided in relevant legislation from Queensland government agencies (e.g. DERM, 2011; DNRM, 2013).
Surface water resources in the SA portion of the Cooper region are not prescribed and therefore no information is available on licences or allocations. There are very few reliable natural waters in the downstream part of the Cooper subregion. Stock and domestic supplies for early settlement had to be obtained from wells drilled into small local aquifers and the construction of earth tanks and reservoirs (SA Arid Lands NRM Board, 2010). Surface water management in the SA part of the Cooper subregion is described in companion product 1.1 for the Cooper subregion (Smith et al., 2015). Further information on the Far North NRM regions can be obtained from relevant SA government agencies (e.g. SA Arid Lands NRM Board, 2009; Agnew et al., 2014).
1.5.1.1.2 Gaps
The information required to derive a detailed surface water account is not readily available for the Cooper subregion. This limits the capacity of water resource managers to formulate a water allocation plan.
1.5.1 Current water accounts
14 | Current water accounts and water quality for the Cooper subregion
Com
pone
nt 1
: Con
text
ual i
nfor
mat
ion
for t
he C
oope
r sub
regi
on
References
Agnew DC, Lewis S and Hanna H (Eds) (2014) Managing the high value aquatic ecosystems of the Cooper Creek catchment, SA section, Report to the SA Arid Lands Natural Resources Management Board.
Costelloe JF (2013) Hydrological assessment and analysis of the Cooper Creek catchment, South Australia. Report by the University of Melbourne to the SA Arid Lands NRM Board, Port Augusta.
DERM (2011) Cooper Creek water resource plan 2011. Water planning south-west, water allocation and planning. Queensland Department of Environment and Resource Management, Brisbane.
DNRM (2013) Cooper Creek resource operations plan. Water Policy, Queensland Department of Natural Resources and Mines, Brisbane.
DNRM (2015) Water monitoring portal. Queensland Department of Natural Resources and Mines, Brisbane. Viewed 24 March 2015, https://www.dnrm.qld.gov.au/water/water-monitoring-and-data/portal.
Evans T, Cassel R, Harris-Pascal C and Karim F (2015) Current water accounts and water quality for the Galilee subregion. Product 1.5 for the Galilee subregion from the Lake Eyre Basin Bioregional Assessment. Department of the Environment, Bureau of Meteorology, CSIRO and Geoscience Australia, Australia.
Government of South Australia (2015) WaterConnect. Viewed 24 March 2015, https://www.waterconnect.sa.gov.au/Pages/Home.aspx.
Jaensch R (2009) Floodplain wetlands and waterbirds of the channel country. SA Arid Lands NRM Board.
Lewis S, Cassel R and Galinec V (2014) Coal and coal seam gas resource assessment for the Galilee subregion. Product 1.2 for the Galilee subregion from the Lake Eyre Basin Bioregional Assessment. Department of the Environment, Bureau of Meteorology, CSIRO and Geoscience Australia, Australia.
McMahon TA, Murphy R, Little P, Costelloe JF, Peel MC, Chiew FHS, Hays S, Nathan R and Kandel DD (2005) Hydrology of Lake Eyre Basin. Final report. A report to the Australian Government Natural Heritage Trust, Sinclair Knight Merz (SKM) Pty Ltd, Melbourne.
SA Arid Lands NRM Board (2009) Water allocation plan for the far north prescribed wells area.
SA Arid Lands NRM Board (2010) Regional natural resources management plan for the SA arid lands NRM region, Volume 1.
1.5.1 Current water accounts
Current water accounts and water quality for the Cooper subregion | 15
Component 1: Contextual inform
ation for the Cooper subregion
Smith M, Cassel R and Evans T (2015) Coal and coal seam gas resource assessment for the Cooper subregion. Product 1.2 for the Cooper subregion from the Lake Eyre Basin Bioregional Assessment. Department of the Environment, Bureau of Meteorology, CSIRO and Geoscience Australia, Australia. Viewed 3 July 2015, http://data.bioregionalassessments.gov.au/product/LEB/COO/1.2.
Smith M, Karim F, Sparrow A, Cassel R and Hall L (2015) Context statement for the Cooper subregion. Product 1.1 for the Cooper subregion from the Lake Eyre Basin Bioregional Assessment. Department of the Environment, Bureau of Meteorology, CSIRO and Geoscience Australia, Australia. Viewed 24 March 2015, http://data.bioregionalassessments.gov.au/product/LEB/COO/1.1.
Datasets
Dataset 1 Bureau of Meteorology (2013) National Surface Water sites Hydstra. Bioregional Assessment Source Dataset. Viewed 2 September 2015, http://data.bioregionalassessments.gov.au/dataset/f7edc5e5-93ee-4527-bed5-a118b4017623.
1.5.1 Current water accounts
16 | Current water accounts and water quality for the Cooper subregion
Com
pone
nt 1
: Con
text
ual i
nfor
mat
ion
for t
he C
oope
r sub
regi
on
1.5.1.2 Groundwater
This section presents information on groundwater licences and allocations in the Cooper subregion (both SA and Queensland). Detailed water accounts are not required, as modelling and a water balance are not being undertaken for the Cooper subregion in this iteration of the Bioregional Assessment Technical Programme.
Data and information required for water accounts for the Cooper subregion are held in the National Groundwater Information System (NGIS) (Bureau of Meteorology, 2015). Information required to develop detailed water accounts includes:
• location, elevation and construction information for all groundwater bores
• geological logs of groundwater bores (to locate the groundwater use and which aquifer it is coming from)
• groundwater volumes held in aquifers (to determine the aquifer water is coming from)
• groundwater trading volumes (to determine the amount of available groundwater)
• groundwater entitlements, allocations and use, including groundwater for industrial use and town water supply (to determine the allowable extraction and the amount of groundwater used).
Further information on water accounts for the Cooper subregion is available from the Queensland groundwater database (DNRM, 2015a), the Queensland Water Monitoring Portal (DNRM, 2015b) and SA WaterConnect (Government of South Australia, 2014). More information relating to groundwater management and accounting is available from the Queensland Department of Natural Resources and Mines (DNRM), South Australian Department of Environment Water and Natural Resources (DEWNR), Natural Resources South Australia Arid Lands, South West Natural Resource Management Limited, or Desert Channels Queensland Incorporated natural resource management (NRM) groups.
1.5.1.2.1 Current water accounts
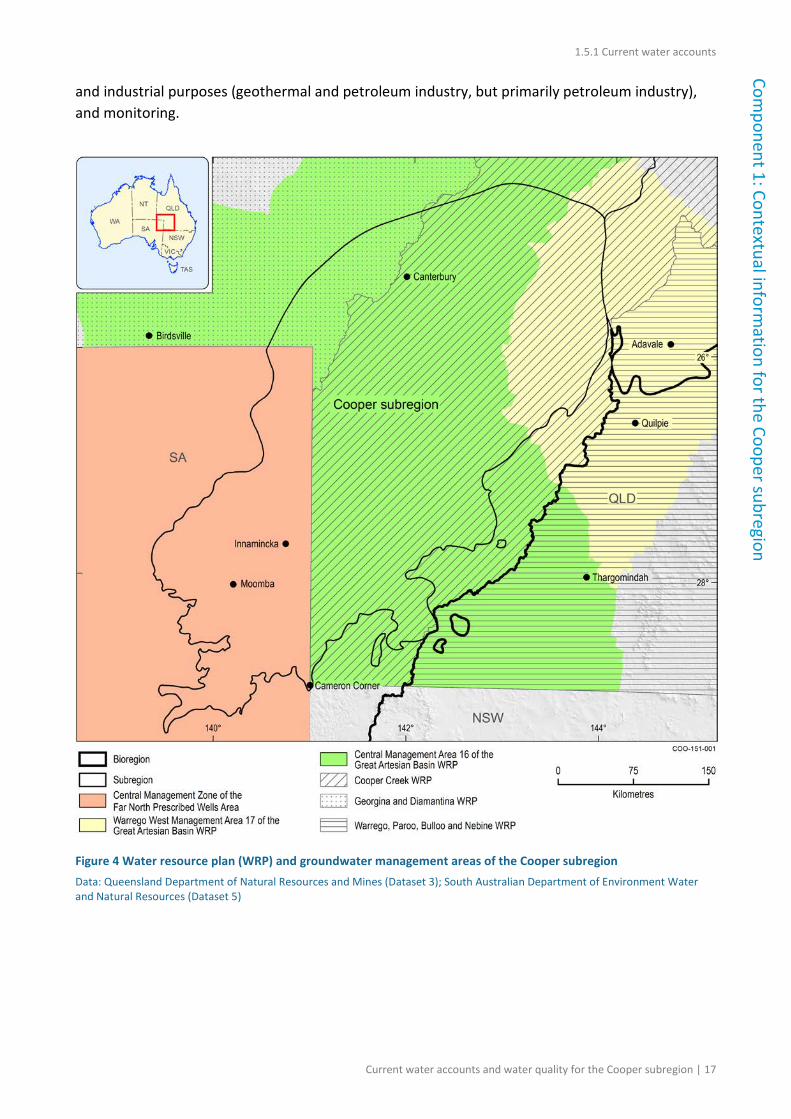
The Cooper subregion straddles the SA–Queensland border. It falls within the following management areas (Figure 4):
• Central Management Zone of the Far North Prescribed Wells Area (PWA) in SA
• Central Great Artesian Basin (GAB) water resource plan groundwater management area
• West Warrego Great Artesian Basin (GAB) water resource plan groundwater management area
• Cooper Creek water resource plan areas in Queensland
• Georgina and Diamantina water resource plan areas in Queensland.
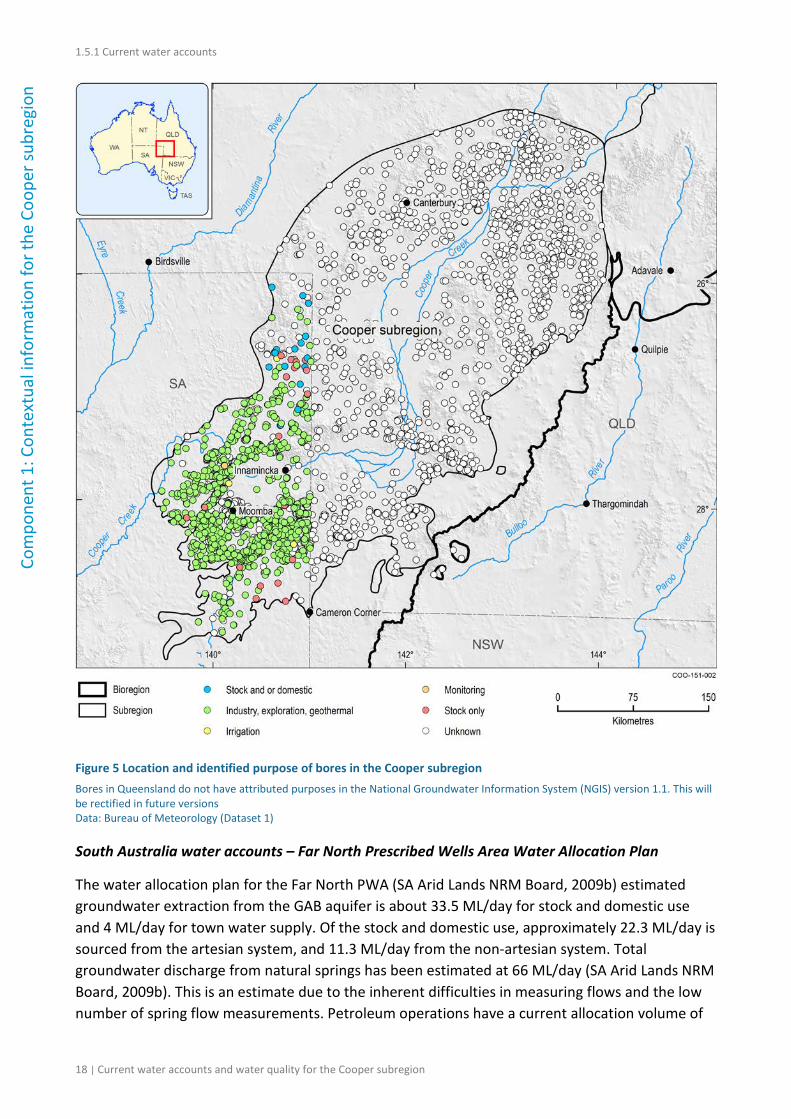
Within the Cooper subregion, there are 3945 bores in the NGIS (Figure 5). Water allocations for these bores are not provided, however they make up a subset of the groundwater volumes allocated from within the groundwater management areas that intersect the Cooper subregion. Bores in the Cooper subregion are used for stock and domestic purposes, irrigation, exploration
1.5.1 Current water accounts
Current water accounts and water quality for the Cooper subregion | 17
Component 1: Contextual inform
ation for the Cooper subregion
and industrial purposes (geothermal and petroleum industry, but primarily petroleum industry), and monitoring.
Figure 4 Water resource plan (WRP) and groundwater management areas of the Cooper subregion Data: Queensland Department of Natural Resources and Mines (Dataset 3); South Australian Department of Environment Water and Natural Resources (Dataset 5)
1.5.1 Current water accounts
18 | Current water accounts and water quality for the Cooper subregion
Com
pone
nt 1
: Con
text
ual i
nfor
mat
ion
for t
he C
oope
r sub
regi
on
Figure 5 Location and identified purpose of bores in the Cooper subregion Bores in Queensland do not have attributed purposes in the National Groundwater Information System (NGIS) version 1.1. This will be rectified in future versions Data: Bureau of Meteorology (Dataset 1)
South Australia water accounts – Far North Prescribed Wells Area Water Allocation Plan
The water allocation plan for the Far North PWA (SA Arid Lands NRM Board, 2009b) estimated groundwater extraction from the GAB aquifer is about 33.5 ML/day for stock and domestic use and 4 ML/day for town water supply. Of the stock and domestic use, approximately 22.3 ML/day is sourced from the artesian system, and 11.3 ML/day from the non-artesian system. Total groundwater discharge from natural springs has been estimated at 66 ML/day (SA Arid Lands NRM Board, 2009b). This is an estimate due to the inherent difficulties in measuring flows and the low number of spring flow measurements. Petroleum operations have a current allocation volume of
1.5.1 Current water accounts
Current water accounts and water quality for the Cooper subregion | 19
Component 1: Contextual inform
ation for the Cooper subregion
60 ML/day for co-produced water (water that is extracted as a by-product of hydrocarbon extraction processes). Mining operations have a current allocation volume of 44.6 ML/day. In addition to this volume, BHP Billiton’s Olympic Dam mine, which is outside the subregion but within the same SA management region, has been granted a special water licence to extract water from the GAB aquifer (DEWNR, 2013).
Within the Far North PWA, there are 75 licences for groundwater extraction. As of October 2014, these licences have an approved take of 49,780 ML/year, and apply to the entire Far North PWA (South Australian Department of Environment Water and Natural Resources, Dataset 4). These data are not available at the level of the Cooper subregion.
Queensland water accounts
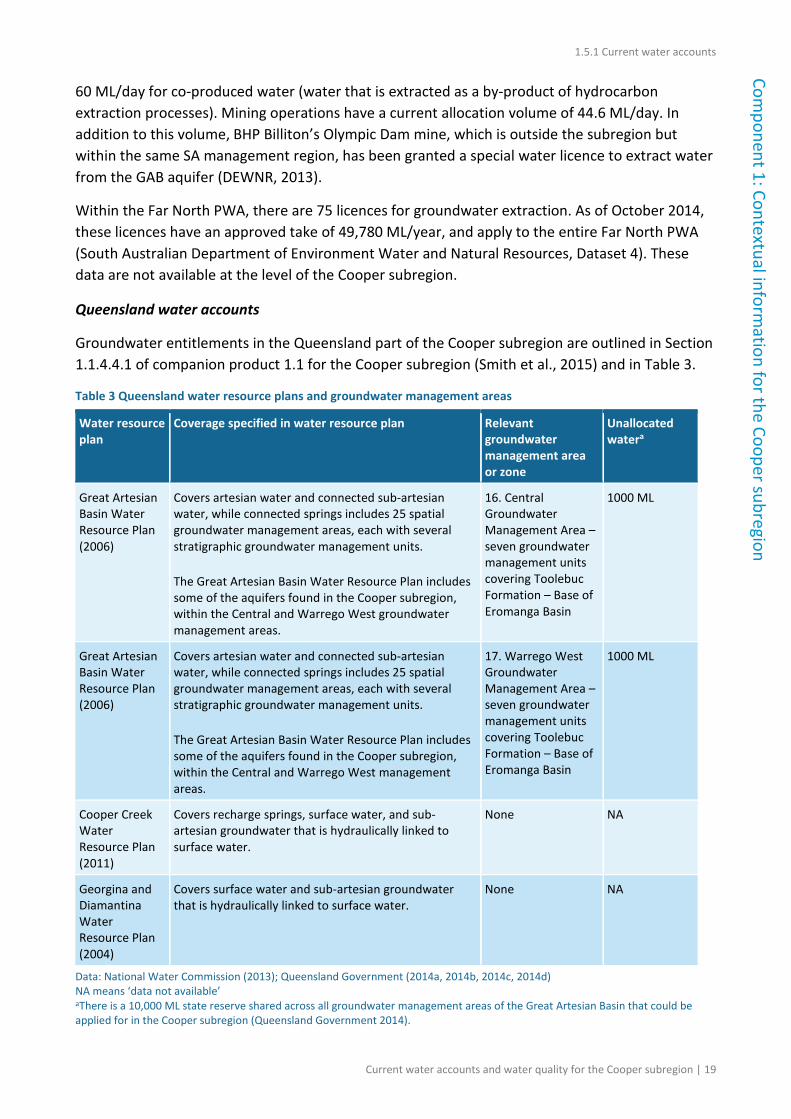
Groundwater entitlements in the Queensland part of the Cooper subregion are outlined in Section 1.1.4.4.1 of companion product 1.1 for the Cooper subregion (Smith et al., 2015) and in Table 3.
Table 3 Queensland water resource plans and groundwater management areas
Water resource plan
Coverage specified in water resource plan Relevant groundwater management area or zone
Unallocated watera
Great Artesian Basin Water Resource Plan (2006)
Covers artesian water and connected sub-artesian water, while connected springs includes 25 spatial groundwater management areas, each with several stratigraphic groundwater management units. The Great Artesian Basin Water Resource Plan includes some of the aquifers found in the Cooper subregion, within the Central and Warrego West groundwater management areas.
16. Central Groundwater Management Area – seven groundwater management units covering Toolebuc Formation – Base of Eromanga Basin
1000 ML
Great Artesian Basin Water Resource Plan (2006)
Covers artesian water and connected sub-artesian water, while connected springs includes 25 spatial groundwater management areas, each with several stratigraphic groundwater management units. The Great Artesian Basin Water Resource Plan includes some of the aquifers found in the Cooper subregion, within the Central and Warrego West management areas.
17. Warrego West Groundwater Management Area – seven groundwater management units covering Toolebuc Formation – Base of Eromanga Basin
1000 ML
Cooper Creek Water Resource Plan (2011)
Covers recharge springs, surface water, and sub-artesian groundwater that is hydraulically linked to surface water.
None NA
Georgina and Diamantina Water Resource Plan (2004)
Covers surface water and sub-artesian groundwater that is hydraulically linked to surface water.
None NA
Data: National Water Commission (2013); Queensland Government (2014a, 2014b, 2014c, 2014d) NA means ‘data not available’ aThere is a 10,000 ML state reserve shared across all groundwater management areas of the Great Artesian Basin that could be applied for in the Cooper subregion (Queensland Government 2014).
1.5.1 Current water accounts
20 | Current water accounts and water quality for the Cooper subregion
Com
pone
nt 1
: Con
text
ual i
nfor
mat
ion
for t
he C
oope
r sub
regi
on
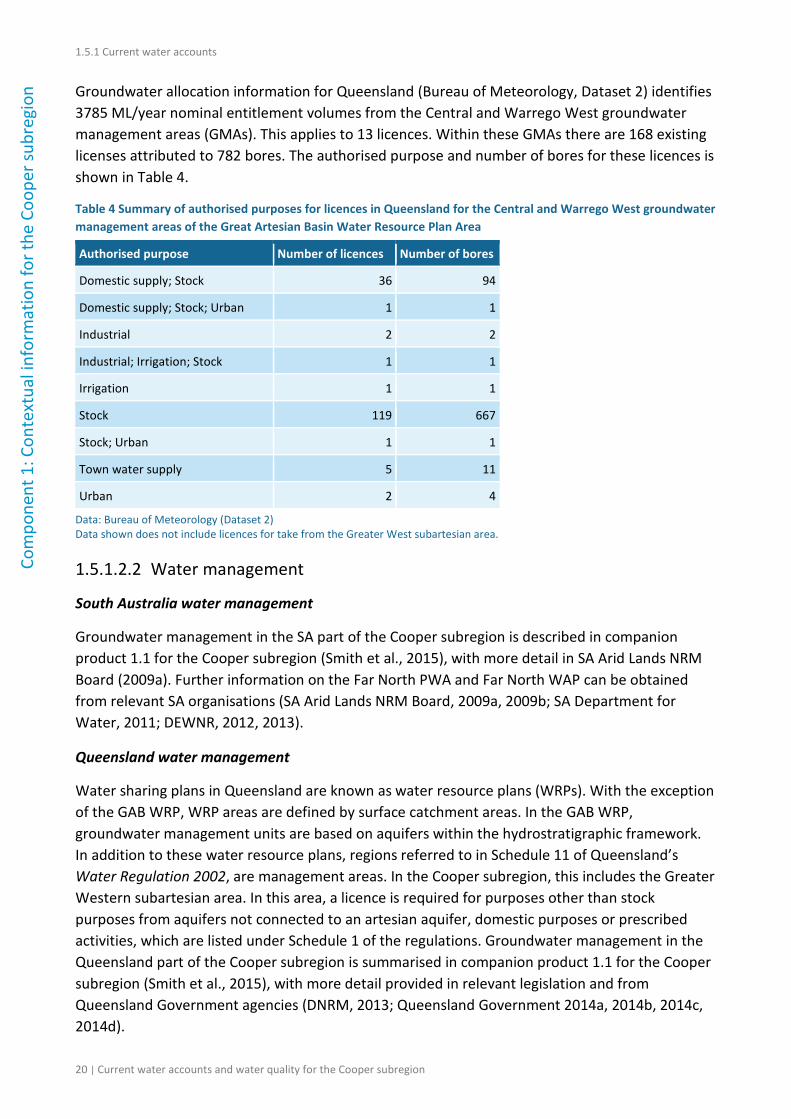
Groundwater allocation information for Queensland (Bureau of Meteorology, Dataset 2) identifies 3785 ML/year nominal entitlement volumes from the Central and Warrego West groundwater management areas (GMAs). This applies to 13 licences. Within these GMAs there are 168 existing licenses attributed to 782 bores. The authorised purpose and number of bores for these licences is shown in Table 4.
Table 4 Summary of authorised purposes for licences in Queensland for the Central and Warrego West groundwater management areas of the Great Artesian Basin Water Resource Plan Area
Authorised purpose Number of licences Number of bores
Domestic supply; Stock 36 94
Domestic supply; Stock; Urban 1 1
Industrial 2 2
Industrial; Irrigation; Stock 1 1
Irrigation 1 1
Stock 119 667
Stock; Urban 1 1
Town water supply 5 11
Urban 2 4
Data: Bureau of Meteorology (Dataset 2) Data shown does not include licences for take from the Greater West subartesian area.
1.5.1.2.2 Water management
South Australia water management
Groundwater management in the SA part of the Cooper subregion is described in companion product 1.1 for the Cooper subregion (Smith et al., 2015), with more detail in SA Arid Lands NRM Board (2009a). Further information on the Far North PWA and Far North WAP can be obtained from relevant SA organisations (SA Arid Lands NRM Board, 2009a, 2009b; SA Department for Water, 2011; DEWNR, 2012, 2013).
Queensland water management
Water sharing plans in Queensland are known as water resource plans (WRPs). With the exception of the GAB WRP, WRP areas are defined by surface catchment areas. In the GAB WRP, groundwater management units are based on aquifers within the hydrostratigraphic framework. In addition to these water resource plans, regions referred to in Schedule 11 of Queensland’s Water Regulation 2002, are management areas. In the Cooper subregion, this includes the Greater Western subartesian area. In this area, a licence is required for purposes other than stock purposes from aquifers not connected to an artesian aquifer, domestic purposes or prescribed activities, which are listed under Schedule 1 of the regulations. Groundwater management in the Queensland part of the Cooper subregion is summarised in companion product 1.1 for the Cooper subregion (Smith et al., 2015), with more detail provided in relevant legislation and from Queensland Government agencies (DNRM, 2013; Queensland Government 2014a, 2014b, 2014c, 2014d).
1.5.1 Current water accounts
Current water accounts and water quality for the Cooper subregion | 21
Component 1: Contextual inform
ation for the Cooper subregion
1.5.1.2.3 Gaps
Given the limited scope of this product, detailed gap identification has not been undertaken.
Provision of licence information for groundwater within the SA part of the Cooper subregion would improve understanding of licenced groundwater allocation.
For bores in Queensland and SA with licenced allocations, if actual usage data were to be collected, that would provide a more accurate representation of groundwater use within the Cooper subregion. Similarly, for uncontrolled artesian bores, actual flow rates would provide a more accurate assessment.
Identified or approved purpose attribution for bores listed as ‘unknown’ in the NGIS would also assist in any future water accounting exercise for the Cooper subregion.
References
Bureau of Meteorology (2015) National Groundwater Information System. Viewed 24 March 2015, http://www.bom.gov.au/water/groundwater/ngis/.
DEWNR (2012) Far North PWA GAB aquifer groundwater level and salinity status report 2012. South Australian Department of Environment, Water and Natural Resources, Adelaide. Viewed 24 March 2015, https://www.waterconnect.sa.gov.au/Content/Publications/DEWNR/Far_North_PWA_GAB_GSR_2012.pdf.
DEWNR (2013) Far North PWA GAB aquifer groundwater level and salinity status report 2013. South Australian Department of Environment, Water and Natural Resources, Adelaide. Viewed 24 March 2015, https://www.waterconnect.sa.gov.au/Content/Publications/DEWNR/Far_North_PWA_GAB_GSR_2013.pdf.
DNRM (2013) Cooper Creek resource operations plan November 2013. Queensland Department of Natural Resources and Mines, Brisbane. Viewed 24 March 2015, https://www.dnrm.qld.gov.au/__data/assets/pdf_file/0006/110787/cooper-creek-resource-operations-plan.pdf.
DNRM (2015a) Groundwater database – Queensland. Queensland Department of Natural Resources and Mines, Brisbane. Viewed 24 March 2015, http://data.qld.gov.au/dataset/groundwater-database-queensland.
DNRM (2015b) Water monitoring portal. Queensland Department of Natural Resources and Mines, Brisbane. Viewed 24 March 2015, http://www.dnrm.qld.gov.au/water/water-monitoring-and-data/portal.
Government of South Australia (2014) WaterConnect. Viewed 24 March 2015, http://www.waterconnect.sa.gov.au/Pages/Home.aspx.
1.5.1 Current water accounts
22 | Current water accounts and water quality for the Cooper subregion
Com
pone
nt 1
: Con
text
ual i
nfor
mat
ion
for t
he C
oope
r sub
regi
on
National Water Commission (2013) National water planning report card 2013. Viewed 28 November 2014, http://www.nwc.gov.au/publications/topic/water-planning/report-card-2013.
Queensland Government (2014a) Water Resource (Cooper Creek) Plan 2011. Viewed 28 November 2014, http://www.legislation.qld.gov.au/LEGISLTN/CURRENT/W/WaterReCCPl11.pdf.
Queensland Government (2014b) Water resource (Georgina and Diamantina) plan 2004. Viewed 28 November 2014, http://www.legislation.qld.gov.au/LEGISLTN/CURRENT/W/WaterReGeP04.pdf.
Queensland Government (2014c) Water Resource (Great Artesian Basin) Plan 2006. Viewed 28 November 2014, http://www.legislation.qld.gov.au/LEGISLTN/CURRENT/W/WaterReGABP06.pdf.
Queensland Government (2014d) Water Resource (Warrego, Paroo, Bulloo and Nebine) Plan 2003. Viewed 28 November 2014, http://www.legislation.qld.gov.au/LEGISLTN/CURRENT/W/WaterReWarP03.pdf.
SA Arid Lands NRM Board (2009a) Explanation of the water allocation plan for the Far North Prescribed Wells Area. Viewed 18 May 2015, http://admin.environment.sa.gov.au/files/7ba7ae4c-951e-4000-a82d-a2c8007a4ea1/far-north-water-allocation-plan-explanation.pdf.
SA Arid Lands NRM Board (2009b) Water allocation plan for the Far North Prescribed Wells Area. Viewed 18 May 2015, http://www.naturalresources.sa.gov.au/files/sharedassets/sa_arid_lands/water/far-north-water-allocation-plan.pdf.
SA Department for Water (2011) Far North PWA groundwater level and salinity status report 2011. South Australian Department for Water, Adelaide, SA. Viewed 24 March 2015, https://www.waterconnect.sa.gov.au/Content/Publications/DEWNR/Far_North_PWA_2011.pdf.
Smith M, Karim F, Sparrow A, Cassel R and Hall L (2015) Context statement for the Cooper subregion. Product 1.1 for the Cooper subregion from the Lake Eyre Basin Bioregional Assessment. Department of the Environment, Bureau of Meteorology, CSIRO and Geoscience Australia, Australia. Viewed 24 March 2015, http://data.bioregionalassessments.gov.au/product/LEB/COO/1.1.
Datasets
Dataset 1 Bureau of Meteorology (2013) National Groundwater Information System (NGIS) v1.1. Bioregional Assessment Source Dataset. Viewed 2 September 2015, http://data.bioregionalassessments.gov.au/dataset/e157b1cd-3cb7-4cf9-a13c-a6bed576b8c7.
1.5.1 Current water accounts
Current water accounts and water quality for the Cooper subregion | 23
Component 1: Contextual inform
ation for the Cooper subregion
Dataset 2 Bioregional Assessment Programme (2015) QLD Dept of Natural Resources and Mines, Groundwater Entitlements linked to bores and NGIS v4 28072014. Bioregional Assessment Derived Dataset. Viewed 2 September 2015, http://data.bioregionalassessments.gov.au/dataset/b1ba5370-2c60-485f-9620-ddad39498999.
Dataset 3 Queensland Department of Natural Resources and Mines (2009) Water resource plan - Great Artesian Basin 2006 - management areas. Bioregional Assessment Source Dataset. Viewed 2 September 2015, http://data.bioregionalassessments.gov.au/dataset/121724dd-c448-41d6-b6b5-246542e92963.
Dataset 4 Department of Environment, Water and Natural Resources (2014a) SA Department of Environment, Water and Natural Resources (DEWNR) Groundwater Licences 141007. Bioregional Assessment Source Dataset. Viewed 2 September 2015, http://data.bioregionalassessments.gov.au/dataset/ce98b07d-1aea-44f6-8900-482ee49565b0.
Dataset 5 South Australian Department for Environment, Water and Natural Resources (2014b) SA Department of Environment, Water and Natural Resources (DEWNR) Water Management Areas 141007. Bioregional Assessment Source Dataset. Viewed 2 September 2015, http://data.bioregionalassessments.gov.au/dataset/d0730582-5225-4293-8da6-43ab3ec3b20d.
1.5.1 Current water accounts
24 | Current water accounts and water quality for the Cooper subregion
Com
pone
nt 1
: Con
text
ual i
nfor
mat
ion
for t
he C
oope
r sub
regi
on
1.5.2 Water quality
Current water accounts and water quality for the Cooper subregion | 25
Component 1: Contextual inform
ation for the Cooper subregion
1.5.2 Water quality
Summary
Surface water quality in the Cooper subregion is monitored under the Surface Water Ambient Network (SWAN) monitoring programme by the Queensland Government, SA Environmental Protection Authority (EPA) and the Lake Eyre Basin Rivers Assessment (LEBRA) programme under the Lake Eyre Basin intergovernmental agreement between Commonwealth, Queensland, SA and NT governments. The water quality indicators included in this product are electrical conductivity (EC), total nitrogen (TN), total phosphorous (TP) and turbidity. The EC values in the Cooper creek basin are generally close to the water quality objective trigger value but TN, TP and turbidity are generally high. However, as the data period and spatial distribution are limited it is difficult to draw conclusions based on the available water quality data. It is also important to note that trigger values could differ locally from a regional value.
Groundwater quality in the Cooper subregion is not widely monitored. Some Great Artesian Basin (GAB) monitoring bores are located in the subregion, and some other bores and petroleum wells have associated groundwater quality data. This product summarises groundwater quality for two areas within the Cooper subregion. The first is an area in the central part of the subregion, in Queensland, and the second is the southern Cooper Basin margin, where coal seam gas development is most likely to occur. Groundwater quality is discussed in terms of salinity (total dissolved solids or TDS) and some other hydrogeochemical parameters. TDS varies across the subregion, ranging from 1000 to 21,000 mg/L. Fresher water occurs in GAB aquifers and the Patchawarra Formation in the southern Cooper Basin. Water chemistry is similar in the near surface Cenozoic aquifers and upper GAB aquifers, and differs from lower GAB aquifers. Groundwater is generally soft to moderately hard, suitable for stock watering and not suitable for irrigation.
1.5.2.1 Surface water
There are three main sources of surface water quality data for the Cooper subregion. This includes the SWAN monitoring programme operated by the Queensland Government (DERM, 2011), Aquatic Ecosystem Condition Reports of the SA Government (EPA, 2015) and information collected under the LEBRA programme (Cockayne et al., 2013; Sternberg et al., 2014). The SWAN monitoring programme has been in operation since 1990 and monitors water quality parameters at selected stream gauge sites using auto-sensor recorders. The LEBRA programme commenced in 2011 and collects water quality data using data loggers and occasional in situ sampling. Water quality indicators included in this report are EC, TN, TP and turbidity, and are based on SWAN’s 2004 to 2008, EPA’s 1972 to 2012 and LEBRA’s 2011 to 2013 data.
Current status of water quality in the Cooper subregion has been assessed against the Queensland Water Quality Guidelines (QWQGs) (DEHP, 2009). The QWQGs were derived from the Australian and New Zealand Environment and Conservation Council (ANZECC) guideline values or descriptive statements for environmental values to protect aquatic ecosystems and human uses of water (ANZECC, 2000). The QWQGs are intended to address the need identified in the ANZECC guidelines by providing guideline values that are specific to Queensland (DEHP, 2009).
1.5.2 Water quality
26 | Current water accounts and water quality for the Cooper subregion
Com
pone
nt 1
: Con
text
ual i
nfor
mat
ion
for t
he C
oope
r sub
regi
on
1.5.2.1.1 Water quality in the Cooper creek basin
The availability of water quality data for the Cooper creek basin is relatively limited. There are five Queensland Government operated water quality monitoring sites (Blackall and Retreat on Barcoo River, Bowen Downs on Cornish Creek, Longreach on Thomson River and Nappa Merrie on Cooper Creek) in the Queensland part of Cooper creek basin. There are two water quality monitoring sites (Cullyamurra and at North West Branch of Cooper Creek) in the SA part of the Cooper subregion operated by the SA Government. Among the sites, continuous auto-sensor records of EC are available for Longreach station (since 1993). In addition there are eight LEBRA operated automatic monitoring sites in the Cooper creek basin (one in the subregion) that have operated since 2011. The LEBRA programme also collects in situ measurements every year at its 50 sites within the Lake Eyre Basin, of which 17 are in the Cooper creek basin (Sternberg et al., 2014).
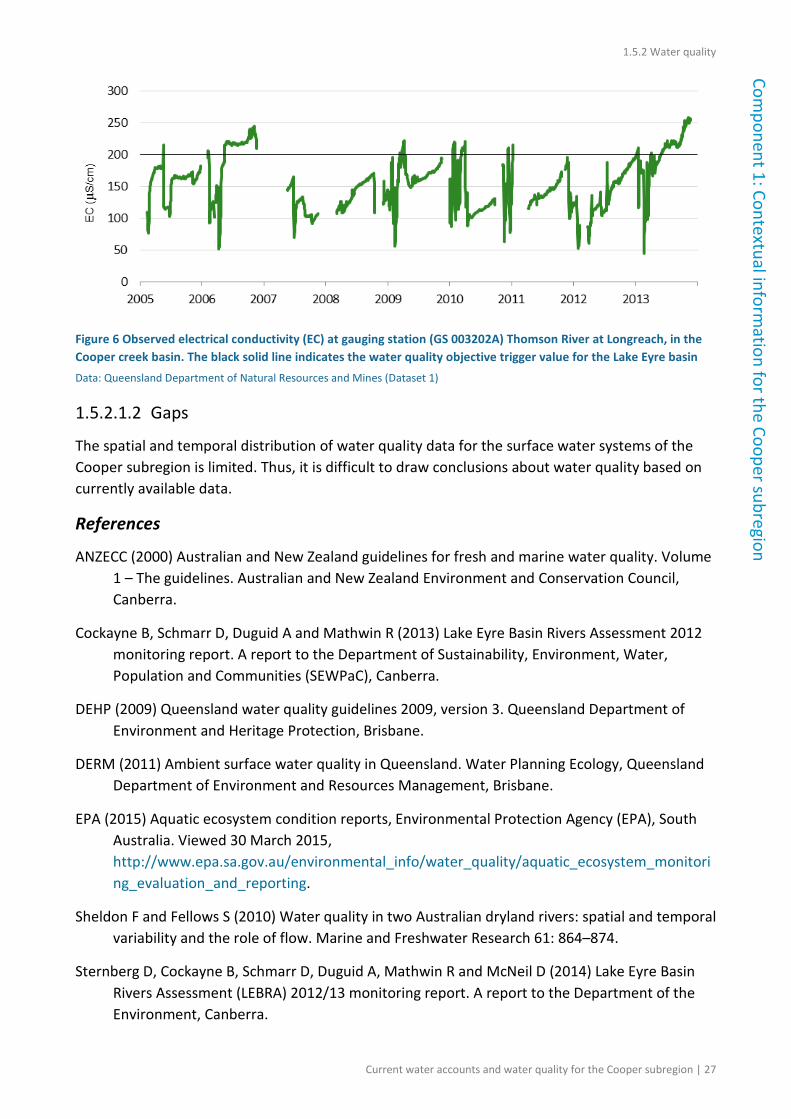
The EC values in the Cooper creek basin are generally lower than the water quality objective trigger value. The 75th percentile baseflow trigger value for EC is 200 μS/cm for the Lake Eyre region (DEHP, 2009). A typical example of auto-sensor data at Longreach gauging site is shown in Figure 6 for 2005 to 2013. Gaps in the measured EC auto-sensor dataset represent periods where data were not collected due to periods of no-flow or monitoring equipment failure. EC varies between 44 to 258 µS/cm with a mean of 155 µS/cm. The median EC for baseflow is about 200 µS/cm and for high flow it is 100 µS/cm with an overall median of 157 µS/cm. However, occasional high EC values occur anomalously at mid-flow ranges, particularly between flow rates of 0.1 and 10 m3/s (DERM, 2011). These may be the result of the ‘first flush’ of a flow event after a dry period, where accumulated salts are cleared from the intermittently flowing watercourse. In general, EC levels are low and stable at each of the gauging stations but subject to occasional high pulses at some sites. Data from the LEBRA logger sites also showed a general pattern of increasing EC throughout the low or no-flow periods, followed by sharp decrease during high-flow events. At some sites there is a distinct initial rise in EC when the first flood water arrives (Cockayne et al., 2013). The EC varies greatly spatially and temporally and reaches its maximum value during the no-flow phase (Sheldon and Fellows, 2010).
Turbidity in the Cooper creek basin is generally high and subject to varying trends across the basin as a result of local influences. It appears to reverse from a declining trend in the north of Cooper Creek to an increasing trend before crossing the Queensland–SA border (DERM, 2011). Due to the tendency towards formation of isolated waterholes during the extended dry seasons in this basin, differing turbidity trends may be more representative of local influences than generally deteriorating water quality further downstream (DERM, 2011). In situ measurements at 17 sites (during spring 2011 and autumn 2012) show the turbidity varies from 4 to 354 NTU (Nephelometric Turbidity Unit), with a mean of 124 NTU across the Cooper creek basin (Cockayne et al., 2013). Turbidity reaches its maximum value during the flood (Sheldon and Fellows, 2010).
The availability of TN and TP data for the Queensland part of the Cooper subregion is very low (less than five data points) to draw any conclusion on nutrients (DERM, 2011). Sampled discrete water quality data (e.g. EC, TN, TP and turbidity) for the Cullyamurra waterhole (GS003501) in the SA part of the Cooper subregion are available since 1972 (EPA, 2015). An analysis based on 120 discrete data sampled between 1972 and 2007 shows that TN varies from 0.72 to 4.75 mg/L with a mean of 1.5 mg/L and TP varies 0.14 to 0.59 mg/L with a mean of 0.38 mg/L.
1.5.2 Water quality
Current water accounts and water quality for the Cooper subregion | 27
Component 1: Contextual inform
ation for the Cooper subregion
Figure 6 Observed electrical conductivity (EC) at gauging station (GS 003202A) Thomson River at Longreach, in the Cooper creek basin. The black solid line indicates the water quality objective trigger value for the Lake Eyre basin Data: Queensland Department of Natural Resources and Mines (Dataset 1)
1.5.2.1.2 Gaps
The spatial and temporal distribution of water quality data for the surface water systems of the Cooper subregion is limited. Thus, it is difficult to draw conclusions about water quality based on currently available data.
References
ANZECC (2000) Australian and New Zealand guidelines for fresh and marine water quality. Volume 1 – The guidelines. Australian and New Zealand Environment and Conservation Council, Canberra.
Cockayne B, Schmarr D, Duguid A and Mathwin R (2013) Lake Eyre Basin Rivers Assessment 2012 monitoring report. A report to the Department of Sustainability, Environment, Water, Population and Communities (SEWPaC), Canberra.
DEHP (2009) Queensland water quality guidelines 2009, version 3. Queensland Department of Environment and Heritage Protection, Brisbane.
DERM (2011) Ambient surface water quality in Queensland. Water Planning Ecology, Queensland Department of Environment and Resources Management, Brisbane.
EPA (2015) Aquatic ecosystem condition reports, Environmental Protection Agency (EPA), South Australia. Viewed 30 March 2015, http://www.epa.sa.gov.au/environmental_info/water_quality/aquatic_ecosystem_monitoring_evaluation_and_reporting.
Sheldon F and Fellows S (2010) Water quality in two Australian dryland rivers: spatial and temporal variability and the role of flow. Marine and Freshwater Research 61: 864–874.
Sternberg D, Cockayne B, Schmarr D, Duguid A, Mathwin R and McNeil D (2014) Lake Eyre Basin Rivers Assessment (LEBRA) 2012/13 monitoring report. A report to the Department of the Environment, Canberra.
1.5.2 Water quality
28 | Current water accounts and water quality for the Cooper subregion
Com
pone
nt 1
: Con
text
ual i
nfor
mat
ion
for t
he C
oope
r sub
regi
on
Datasets
Dataset 1 Queensland Department of Natural Resources and Mines (2014) DNRM Water Measurement Information System Extract April 2014. Bioregional Assessment Source Dataset. Viewed 2 September 2015, http://data.bioregionalassessments.gov.au/dataset/c320a7f8-85c4-48b2-89cf-251d41b9d100.
1.5.2 Water quality
Current water accounts and water quality for the Cooper subregion for the Cooper subregion | 29
Component 1: Contextual inform
ation for the Cooper subregion
1.5.2.2 Groundwater
This section identifies information sources for assessing groundwater quality for the Cooper subregion. It is built on the information provided in companion product 1.1 for the Cooper subregion (Smith et al., 2015). This section also presents groundwater quality data in the area of the Southern Cooper Basin Gas Project. Groundwater chemistry data and information for the Cooper subregion are available from the Queensland groundwater bore database (DNRM, 2015), SA WaterConnect (Government of South Australia, 2014), Cresswell and Duesterberg (2012), Dubsky and McPhail (2001), Radke et al. (2000), Love et al. (2013), and prescribed wells area status reports (SA Department for Water, 2011; DEWNR, 2012, 2013), with some supplementary information available from well completion reports (Geological Survey of Queensland, 2013; DSD, 2015) and environmental approval application documents (Golder Associates, 2013; Hydrogeologic Pty Ltd, 2014; JBS&G Australia Pty Ltd and Strike Energy Limited, 2014). Further information is provided in the Geoscience Australia Great Artesian Basin Hydrogeological Atlas (version 1.0) (e.g. Geoscience Australia (Dataset 1), Geoscience Australia (Dataset 2)).
1.5.2.2.1 Total dissolved solids
This section describes total dissolved solids in the southern Cooper Basin.
Groundwater salinity in the geological Lake Eyre Basin aquifers (most likely the Cenozoic Eyre Formation) ranges from 8500 mg/L to 21,000 mg/L total dissolved solids (TDS), with a pH between 7.0 and 8.0 (Hydrogeologic Pty Ltd, 2014).
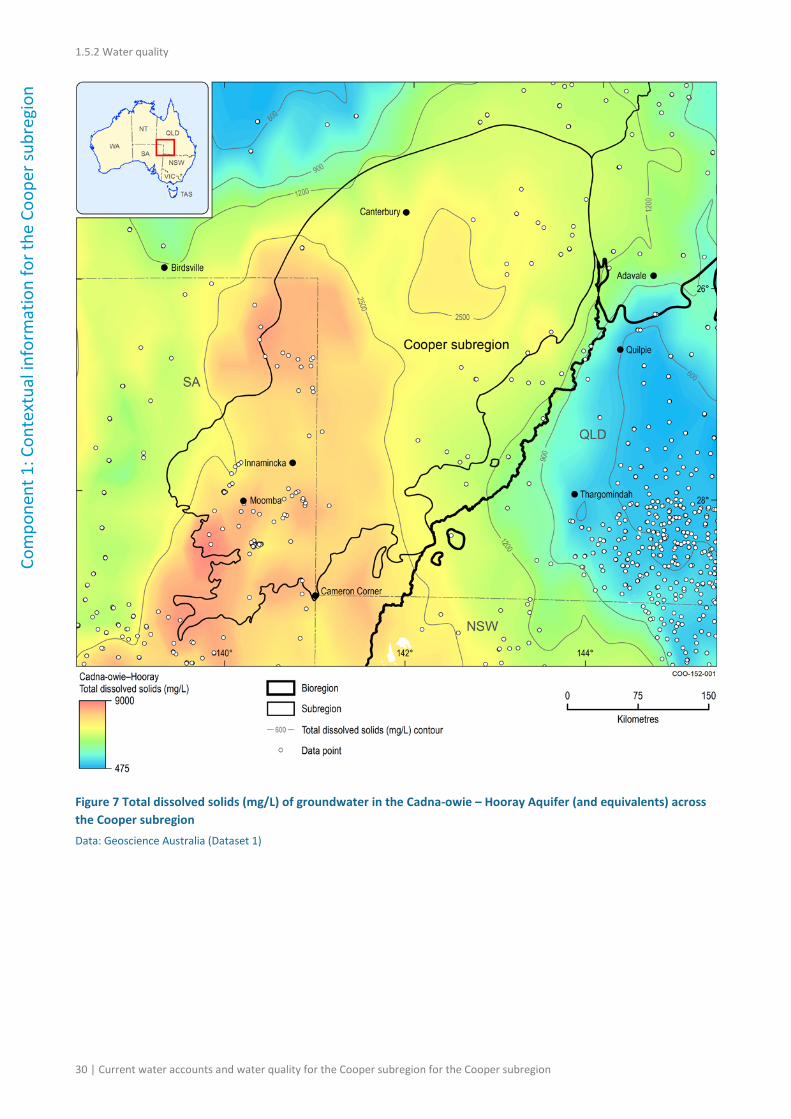
TDS for the Cadna-owie – Hooray Aquifer (and equivalents) is shown for illustrative purposes in Figure 7. This shows that within this Great Artesian Basin (GAB) aquifer, TDS increases along flow paths, from the north-west to the south-east. Figure 8 shows TDS for the Hutton (basal GAB) Aquifer in the Cooper subregion. This map shows higher TDS associated with the deeper parts of the GAB.
TDS in the GAB aquifers within 100 km of the Southern Cooper Basin Gas Project varies. At Montecollina Bore, which taps groundwater from the Cadna-owie Formation, TDS is 5500 to 7100 mg/L. In contrast other bores in the southern Cooper Basin have TDS of 1000 to 1800 mg/L, although bores completed in the Jurassic Bulldog Shale recorded TDS values up to 12,000 mg/L (Hydrogeologic Pty Ltd, 2014).
Groundwater quality data for the deeper and older Permian units of the southern Cooper Basin are of limited extent and number. Hydrogeologic Pty Ltd (2014) identify a range in TDS of approximately 2000 to 7000 mg/L. The upper limits of this range may be the result of hydraulic stimulation fluid influencing analyses. The lower part of this range is defined by analyses from bores in the Patchawarra Formation, where it is in direct contact with, and potentially affected, by downward leakage from the Hutton Sandstone (Dubsky and McPhail, 2001; Hydrogeologic Pty Ltd, 2014).
1.5.2 Water quality
30 | Current water accounts and water quality for the Cooper subregion for the Cooper subregion
Com
pone
nt 1
: Con
text
ual i
nfor
mat
ion
for t
he C
oope
r sub
regi
on
Figure 7 Total dissolved solids (mg/L) of groundwater in the Cadna-owie – Hooray Aquifer (and equivalents) across the Cooper subregion Data: Geoscience Australia (Dataset 1)
1.5.2 Water quality
Current water accounts and water quality for the Cooper subregion for the Cooper subregion | 31
Component 1: Contextual inform
ation for the Cooper subregion
Figure 8 Total dissolved solids (mg/L) of groundwater in the Hutton Aquifer (and equivalents) across the Cooper subregion Data: Geoscience Australia (Dataset 2)
1.5.2.2.2 Trace elements
Groundwater quality from the Eromanga Basin and Cenozoic aquifers (referred to as the Tertiary Sediments and Glendower Formation) is summarised in Golder Associates (2013). They collated 494 samples from an area which encompasses the Queensland portion of the Cooper subregion. Golder Associates (2013) found that the younger Eromanga Basin aquifers and Cenozoic aquifers have similar water quality characteristics (with higher sodium and magnesium), whereas deeper units of the Eromanga Basin have different hydrochemical characteristics (Figure 9).
1.5.2 Water quality
32 | Current water accounts and water quality for the Cooper subregion for the Cooper subregion
Com
pone
nt 1
: Con
text
ual i
nfor
mat
ion
for t
he C
oope
r sub
regi
on
516
Figure 9 Piper diagrams showing hydrochemical characteristics for Eromanga Basin and geological Lake Eyre Basin aquifers in the Cooper subregion 517 Source: After figure 26 and 27 from Golder Associates (2013). This figure is not covered by a Creative Commons Attribution Licence. © Santos Ltd 518 Data shown are limited to the western Queensland portion of the subregion. 519 This figure has been optimised for printing on A3 paper (297 mm x 420 mm). 520
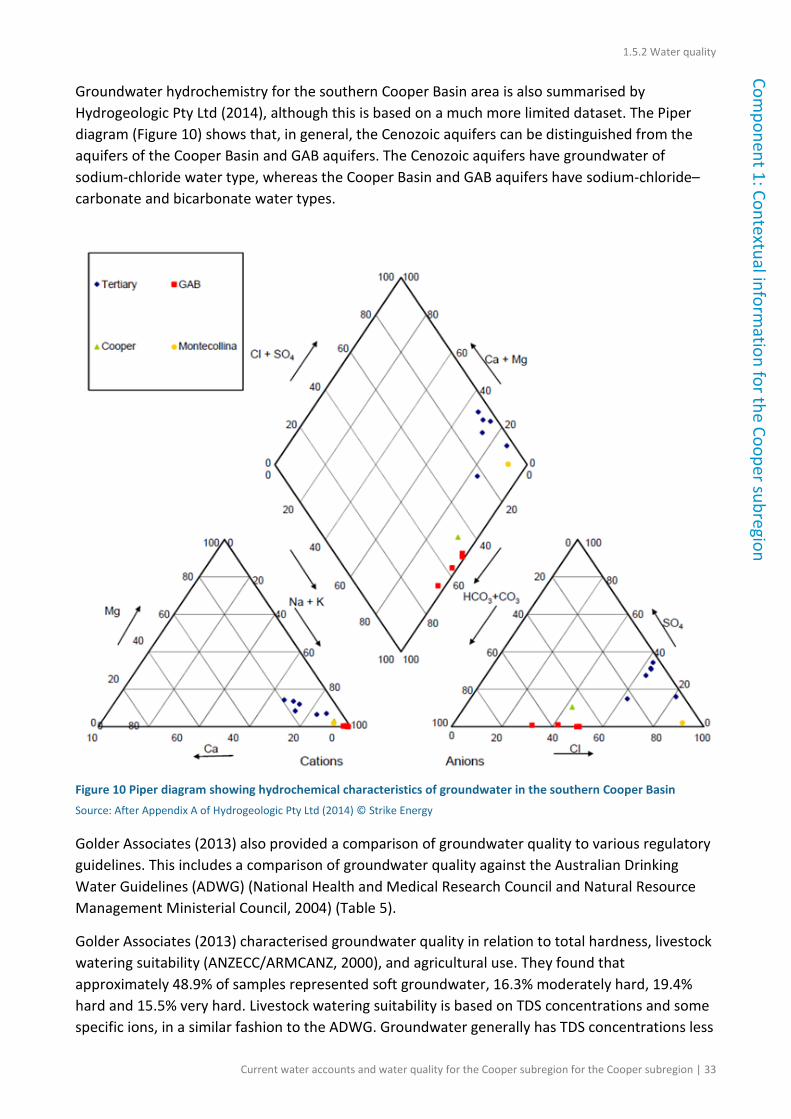
1.5.2 Water quality
Current water accounts and water quality for the Cooper subregion for the Cooper subregion | 33
Component 1: Contextual inform
ation for the Cooper subregion
Groundwater hydrochemistry for the southern Cooper Basin area is also summarised by Hydrogeologic Pty Ltd (2014), although this is based on a much more limited dataset. The Piper diagram (Figure 10) shows that, in general, the Cenozoic aquifers can be distinguished from the aquifers of the Cooper Basin and GAB aquifers. The Cenozoic aquifers have groundwater of sodium-chloride water type, whereas the Cooper Basin and GAB aquifers have sodium-chloride–carbonate and bicarbonate water types.
Figure 10 Piper diagram showing hydrochemical characteristics of groundwater in the southern Cooper Basin Source: After Appendix A of Hydrogeologic Pty Ltd (2014) © Strike Energy
Golder Associates (2013) also provided a comparison of groundwater quality to various regulatory guidelines. This includes a comparison of groundwater quality against the Australian Drinking Water Guidelines (ADWG) (National Health and Medical Research Council and Natural Resource Management Ministerial Council, 2004) (Table 5).
Golder Associates (2013) characterised groundwater quality in relation to total hardness, livestock watering suitability (ANZECC/ARMCANZ, 2000), and agricultural use. They found that approximately 48.9% of samples represented soft groundwater, 16.3% moderately hard, 19.4% hard and 15.5% very hard. Livestock watering suitability is based on TDS concentrations and some specific ions, in a similar fashion to the ADWG. Groundwater generally has TDS concentrations less
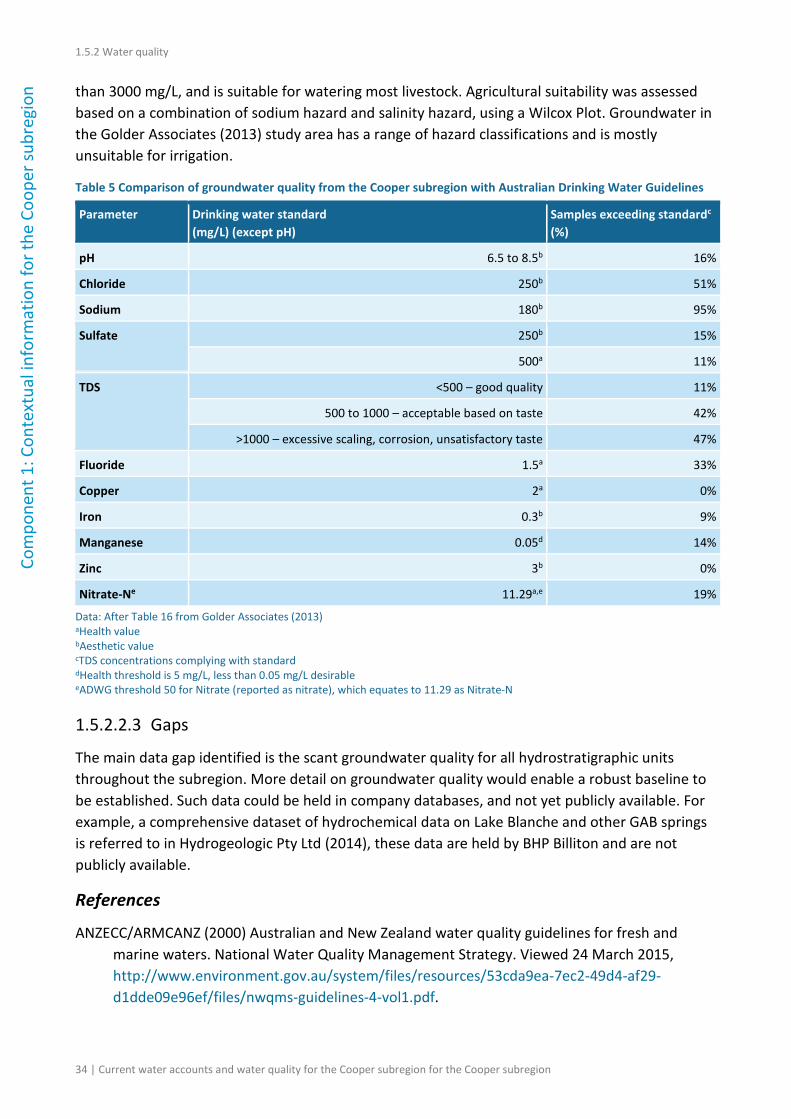
1.5.2 Water quality
34 | Current water accounts and water quality for the Cooper subregion for the Cooper subregion
Com
pone
nt 1
: Con
text
ual i
nfor
mat
ion
for t
he C
oope
r sub
regi
on
than 3000 mg/L, and is suitable for watering most livestock. Agricultural suitability was assessed based on a combination of sodium hazard and salinity hazard, using a Wilcox Plot. Groundwater in the Golder Associates (2013) study area has a range of hazard classifications and is mostly unsuitable for irrigation.
Table 5 Comparison of groundwater quality from the Cooper subregion with Australian Drinking Water Guidelines
Parameter Drinking water standard (mg/L) (except pH)
Samples exceeding standardc (%)
pH 6.5 to 8.5b 16%
Chloride 250b 51%
Sodium 180b 95%
Sulfate 250b 15%
500a 11%
TDS <500 – good quality 11%
500 to 1000 – acceptable based on taste 42%
>1000 – excessive scaling, corrosion, unsatisfactory taste 47%
Fluoride 1.5a 33%
Copper 2a 0%
Iron 0.3b 9%
Manganese 0.05d 14%
Zinc 3b 0%
Nitrate-Ne 11.29a,e 19%
Data: After Table 16 from Golder Associates (2013) aHealth value bAesthetic value cTDS concentrations complying with standard dHealth threshold is 5 mg/L, less than 0.05 mg/L desirable eADWG threshold 50 for Nitrate (reported as nitrate), which equates to 11.29 as Nitrate-N
1.5.2.2.3 Gaps
The main data gap identified is the scant groundwater quality for all hydrostratigraphic units throughout the subregion. More detail on groundwater quality would enable a robust baseline to be established. Such data could be held in company databases, and not yet publicly available. For example, a comprehensive dataset of hydrochemical data on Lake Blanche and other GAB springs is referred to in Hydrogeologic Pty Ltd (2014), these data are held by BHP Billiton and are not publicly available.
References
ANZECC/ARMCANZ (2000) Australian and New Zealand water quality guidelines for fresh and marine waters. National Water Quality Management Strategy. Viewed 24 March 2015, http://www.environment.gov.au/system/files/resources/53cda9ea-7ec2-49d4-af29-d1dde09e96ef/files/nwqms-guidelines-4-vol1.pdf.
1.5.2 Water quality
Current water accounts and water quality for the Cooper subregion for the Cooper subregion | 35
Component 1: Contextual inform
ation for the Cooper subregion
Cresswell R and Duesterberg C (2012) Chapter 8: Regional hydrogeochemistry. In: Ransley TR and Smerdon BD (eds) Hydrostratigraphy, hydrogeology and system conceptualisation of the Great Artesian Basin. A technical report to the Australian Government from the CSIRO Great Artesian Basin Water Resource Assessment. CSIRO Water for a Healthy Country Flagship, Australia, 191–211. Viewed 24 March 2015, https://publications.csiro.au/rpr/pub?pid=csiro:EP132693.
DEWNR (2012) Far North PWA GAB Aquifer Groundwater Level and Salinity Staus Report 2012. Department of Environment, Water and Natural Resources, Adelaide. Viewed 24 March 2015, https://www.waterconnect.sa.gov.au/Content/Publications/DEWNR/Far_North_PWA_GAB_GSR_2012.pdf.
DEWNR (2013) Far North PWA GAB Aquifer Groundwater Level and Salinity Status Report 2013. Department of Environment, Water and Natural Resources, Adelaide. Viewed 25 March 2015, https://www.waterconnect.sa.gov.au/Content/Publications/DEWNR/Far_North_PWA_GAB_GSR_2013.pdf.
DNRM (2015) Groundwater Database – Queensland. Queensland Department of Natural Resources and Mines. Viewed 24 March 2015, https://data.qld.gov.au/dataset/groundwater-database-queensland.
DSD (2015) Resource and Energy Georeference Databases. Viewed 24 March 2015, http://minerals.dmitre.sa.gov.au/mer-landing/petroleum/data_and_publications/wells.
Dubsky M and McPhail A (2001) Environmental Impact Research Report (EIR) SA Cooper Basin Well Operations Statement of Environmental Objectives (SEO) Water Pressure and Salinity Module Report. SA Chamber of Mines and Energy.
Geological Survey of Queensland (2013) QDEX – Queensland Digital Exploration Reports. Viewed 26 March 2013, https://qdexguest.dnrm.qld.gov.au/portal/site/qdex/index.
Golder Associates (2013) Underground water impact report for Santos Cooper basin oil & gas fields SW Queensland. Santos Ltd. Viewed 24 March 2015, https://www.ehp.qld.gov.au/management/coal-seam-gas/pdf/santos-uwir.pdf.
Government of South Australia (2014) WaterConnect. Viewed 24 March 2015, https://www.waterconnect.sa.gov.au/Pages/Home.aspx.
Hydrogeologic Pty Ltd (2014) Hydrogeological Assessment for Multi-Well Exploration and Appraisal Production Testing from Deep Coal in PEL 96 Southern Cooper Basin. Prepared for Strike Energy Limited. Viewed 24 March 2015, http://www.petroleum.dmitre.sa.gov.au/__data/assets/pdf_file/0003/231933/20141216_-_61.017.1e_PEL96_Multiwell_ProdTest_Groundwater_201412163.pdf.
1.5.2 Water quality
36 | Current water accounts and water quality for the Cooper subregion for the Cooper subregion
Com
pone
nt 1
: Con
text
ual i
nfor
mat
ion
for t
he C
oope
r sub
regi
on
JBS&G Australia Pty Ltd and Strike Energy Limited (2014) Environmental Impact Report. Multi-well Exploration and Appraisal Production Testing from Deep Coals in PEL 96, Cooper Basin. December 2014. Viewed 24 March 2015, http://petroleum.dmitre.sa.gov.au/__data/assets/pdf_file/0020/231932/20141216_-_50114-EIR-PEL_96_Multi-well_Production_Test-Rev33.pdf.
Love AJ, Wohling D, Fulton S, Rousseau-Gueutin P and De Ritter S (eds) (2013) Allocating Water and Maintaining Springs in the Great Artesian Basin, Volume II: Groundwater Recharge, Hydrodynamics and Hydrochemistry of the Western Great Artesian Basin. National Water Commission, Canberra. Viewed 25 March 2015, http://archive.nwc.gov.au/library/topic/groundwater/allocating-water-and-maintaining-springs-in-the-great-artesian-basin.
National Health and Medical Research Council and Natural Resource Management Ministerial Council (2004) National Water Quality Management Strategy - Australian Drinking Water Guidelines. National Health and Medical Research Council and the Natural Resource Management Ministerial Council, Canberra. Viewed 24 March 2014, http://www.nhmrc.gov.au/guidelines-publications/eh34.
Radke B, Ferguson J, Cresswell R, Ransley T and Habermehl M (2000) Hydrochemistry and implied hydrodynamics of the Cadna-owie – Hooray Aquifer, Great Artesian Basin. Bureau of Rural Sciences, Canberra.
SA Department for Water (2011) Far North PWA Groundwater Level and Salinity Status Report 2011. South Australian Department for Water, Adelaide, SA. Viewed 24 March 2015, https://www.waterconnect.sa.gov.au/Content/Publications/DEWNR/Far_North_PWA_2011.pdf.
Smith M, Karim F, Sparrow A, Cassel R and Hall L (2015) Context statement for the Cooper subregion. Product 1.1 for the Cooper subregion from the Lake Eyre Basin Bioregional Assessment. Department of the Environment, Bureau of Meteorology, CSIRO and Geoscience Australia, Australia. Viewed 24 March 2015, http://data.bioregionalassessments.gov.au/product/LEB/COO/1.1.
Datasets
Dataset 1 Geoscience Australia (2015a) GABATLAS - Cadna-owie-Hooray Aquifer Total Dissolved Solids map: Data. Bioregional Assessment Source Dataset. Viewed 2 September 2015, http://data.bioregionalassessments.gov.au/dataset/5044a067-35d1-4d6d-98a6-17974aa9226a.
Dataset 2 Geoscience Australia (2015b) Hutton Aquifer and equivalents Total Dissolved Solids map: Data. Bioregional Assessment Source Dataset. Viewed 2 September 2015, http://data.bioregionalassessments.gov.au/dataset/f5f16389-d97e-46b3-bd43-83255acf257d.
1.5.2 Water quality
Current water accounts and water quality for the Cooper subregion for the Cooper subregion | 37
Component 1: Contextual inform
ation for the Cooper subregion
38 | Current water accounts and water quality for the Cooper subregion for the Cooper subregion
www.bioregionalassessments.gov.au