curriculum & instruction craig c. powers assistant superintendent 1
TRANSCRIPT

1
Curriculum & Instruction
Craig C. PowersAssistant Superintendent

2
Budget Overview• FY14 Accomplishments
– Appendix F
• Staffing– Instructional Services
• Appendix E & G
– Support Services
• Instructional Program– Contracted Services
• Adult Education• Professional Development• Curriculum Development
– Tuition• Magnet Schools
– Other Purchased Services• Conference Meetings
(Admin & Admin/BOE)– Textbooks – Dues & Fees
• Next Level of Work

3
FY14 AccomplishmentsCurriculum• Implement New School
Counseling, Music, Art and Language Arts Curriculum
Instruction• Support faculty’s understanding
of Common Core• Continue to align and enhance
Tier 2&3 Support• Build K-8 Math Instruction
Capacity
Staffing• Additional CLMS School Counselor • TAG Math positions at each K-8
school has a Math Coach
Professional Development• Literacy Coaching: Readers &
Writers Workshop, Units of Study, Close Reading and Text Complexity
• Flipped Classroom: offered to secondary; popular in 2012-13 and additional sessions were requested.
• Math Coaching: Ongoing meetings with individual teachers and meet with math curriculum leaders to strengthen math instruction.

4
District Achievement ProfileCMT 2013 % Meeting State Goal
Category Wtfd DRG-D StateGrade 3
Reading 70.8 65.1 56.9Writing 72.2 67.6 60.0Math 72.0 69.6 61.6
Grade 4Reading 73.0 72.2 62.7Writing 74.0 71.7 63.1Math 72.5 74.1 65.4
Grade 5Reading 79.8 74.9 66.9Writing 76.4 72.6 65.6Math 80.4 77.4 69.4Science 70.4 71.9 62.5
CMT 2013 % Meeting State Goal
Category Wtfd DRG-D StateGrade 6
Reading 83.1 80.9 73.3Writing 82.0 73.5 65.2Math 80.2 76.5 67.2
Grade 7Reading 90.1 87.7 78.9Writing 78.9 75.6 65.0Math 77.7 77.1 65.7
Grade 8Reading 92.9 85.6 76.3Writing 85.0 76.3 67.3Math 75.7 74.7 65.2Science 83.3 72.6 60.6
Page 95

5
District Achievement ProfileGrade 10 CAPT 2013 % Meeting State Goal
Category Wtfd DRG-D StateReading Across the Disc 74.1 58.7 48.5
Mathematics 65.4 62.9 52.6Science 62.7 59.6 49.0Writing Across the Disc 78.3 74.3 62.1
SAT Class of 2013 Mean Scores(171 students tested)
Category Wtfd DRG-D StateCritical Reading 526 508 496Mathematics 511 512 514Writing 526 512 488
Advanced Placement Class of 2013
Category Wtfd DRG-D StateEnglish
Lit & Comp 3.47 3.19 2.80English Lang & Comp 3.45 3.52 2.90
World LanguageFrench 4.50 3.66 3.35Spanish 3.50 3.30 3.35
MathematicsCalculus AB 4.65 3.39 2.97
ScienceChemistry 3.57 3.22 2.79Biology 4.08 3.32 2.70Physics B 3.29 3.21 2.93
Social StudiesEuropean History 3.60 3.21 2.83Psychology 3.47 3.29 3.13U.S. History 3.11 3.35 2.80
Page 95

6
Instructional Staff
09-10Actual
10-11Actual
11-12Actual
12-13Actual
13-14 Budget
14-15Proposed
FTE 271.38 269.53 252.66 254.89 256.89 255.89
242.5
247.5
252.5
257.5
262.5
267.5
272.5
Salaries for Certified Teachers, Administrators, and Instructional Tutors comprise 49.8% of the total 2014-15 budget. The total budget increase of $264,573 is a 1.19% increase over the prior year.
Net Change (1.0) FTE
Pages 7-16

7
Instructional Staff
Description 13-14Budget
14-15Requested
FTEChange
Administration 12.00 12.00 0.00
Classroom Teachers 60.00 56.00 -4.00
Core Academics 81.43 80.03 -1.40
Unified Arts 27.96 27.86 -0.10
Career/Technical 9.50 9.50 0.00
Academic Supports 21.00 25.00 +4.00
Special Education 45.00 45.50 +0.50
Totals 256.89 255.89 -1.0
Pages 7-16

8
2014-15 ProjectedElementary Enrollment
School KFY14
K FY15
1FY14
1 FY15
2FY14
2 FY15
3FY14
3 FY15
4FY14
4 FY15
5FY14
5 FY15
TotalFY14
TotalFY15
Great Neck
20 20 18 17 20 18 20 21 18 20 20 24
19 20 17 17 21 18 20 20 18 20 20 24
18 17 18 19 18 19 20 23
18 16 17 17
Totals 39 40 71 67 41 71 59 41 71 59 60 71 341 349
Oswegatchie
19 20 16 20 14 16 18 21 17 18 17 23
20 20 16 19 16 16 19 21 16 18 18 22
16 19 17 16 18 21 17 18 18 22
15 16 15 17 17 18 18
Totals 39 40 63 58 63 63 72 63 67 72 71 67 375 363
Quaker Hill
16 20 20 17 20 21 19 20 20 20 19 21
16 20 20 17 20 20 19 20 21 19 19 21
17 21 17 19 20 20 19 21 19 19 20
16 18
Totals 49 40 61 67 59 61 58 59 62 58 75 62 364 347
District Totals 127 120 195 192 163 195 189 163 200 189 206 200 1,080 1,059
Page 93
Maintain1 Contingency Teacher – To relieve any unreasonably high class sizes.
9
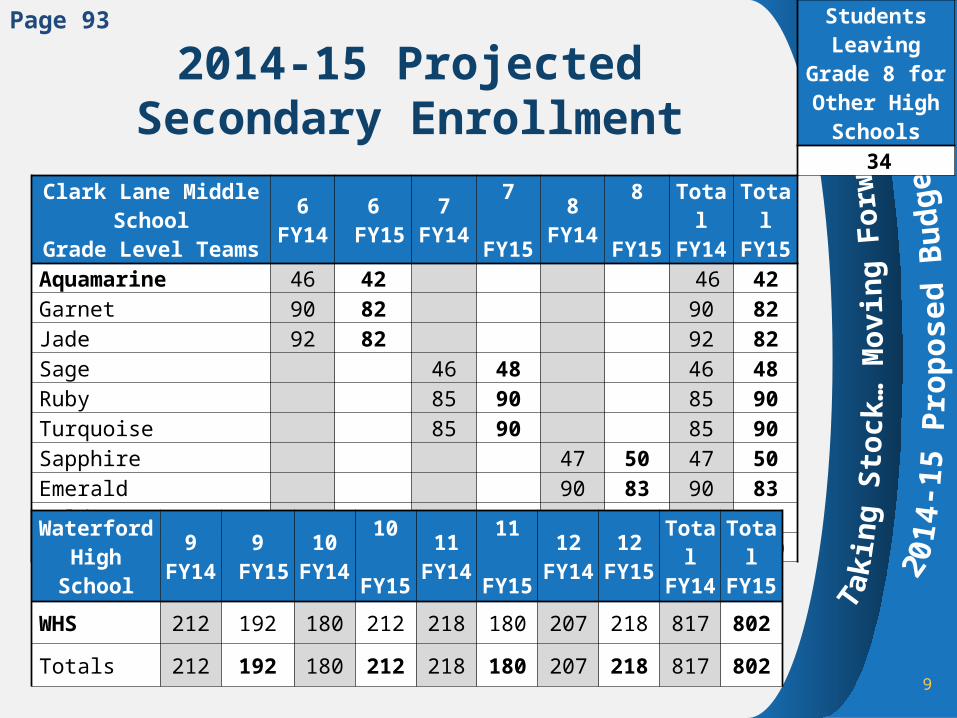
2014-15 ProjectedSecondary Enrollment
Clark Lane Middle SchoolGrade Level Teams
6FY14
6 FY15
7FY14
7 FY15
8FY14
8 FY15
TotalFY14
TotalFY15
Aquamarine 46 42 46 42Garnet 90 82 90 82Jade 92 82 92 82Sage 46 48 46 48Ruby 85 90 85 90Turquoise 85 90 85 90Sapphire 47 50 47 50Emerald 90 83 90 83Gold 89 83 89 83Totals 228 206 216 228 226 216 670 650
Students Leaving Grade 8 for Other
High Schools34
Waterford High School
9FY14
9 FY15
10FY14
10 FY15
11FY14
11 FY15
12FY14
12FY15
TotalFY14
TotalFY15
WHS 212 192 180 212 218 180 207 218 817 802
Totals 212 192 180 212 218 180 207 218 817 802
Page 93

10
Current Elementary Support Model 2013-14
Reading Support• 1 Literacy Specialist / Interventionist• 1 Reading Para• 1 Reading Intern
Math Support• 1 Math Specialist / TAG Teacher• 1 Math Intern

11
Concerns with Current Model
• Difficult for 1 person to be the interventionist, oversee Para and intern and provide coaching to teachers
• Interns change every year requiring a lot of support annually
• Para and Interns need to be overseen by certified teacher

12
Proposed Elementary Support Model 2014-15
Reading Support• 1 Literacy Specialist (Teacher)• 1 Literacy Support Teacher• 1 Reading Intern
Math Support• 1 Math Specialist / TAG Teacher• 1 Math Para

13
Expected Benefits of New Model
• 1 certified teacher dedicated to coaching teachers
• Addition of certified support teacher with sole focus on servicing intervention students
• Replacing Math Intern with Math Para for more stability and stronger skill set
14
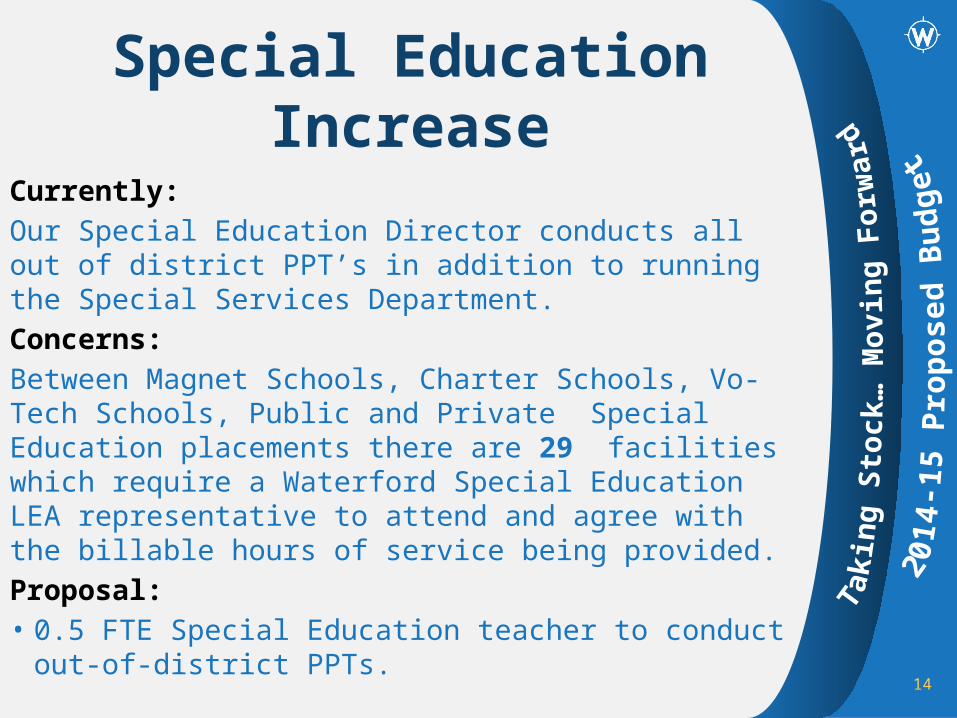
Special Education Increase
Currently: Our Special Education Director conducts all out of district PPT’s in addition to running the Special Services Department.Concerns:Between Magnet Schools, Charter Schools, Vo-Tech Schools, Public and Private Special Education placements there are 29 facilities which require a Waterford Special Education LEA representative to attend and agree with the billable hours of service being provided.Proposal:• 0.5 FTE Special Education teacher to conduct out-of-
district PPTs.

15
Instructional Staffing Summary
256.89 FTE 2013-2014 Budget Book
255.89 FTE 2014-2015 Proposed
Net Change (1.0) FTE

16
Support Staff
09-10Actual
10-11Actual
11-12Actual
12-13Actual
13-14 Budget
14-15Proposed
FTE 152.5 152.5 149.43 145.31 150.06 149.36
141.00
143.00
145.00
147.00
149.00
151.00
153.00
Support salaries represent 11.6% of the proposed 2014-15 budget. The total budget increase of $84,345 is a 1.6% increase over the prior year.
Pages 17-23
Net Change (0.7) FTE

17
Support Staff
Description 13-14Budget
13-14Actual
14-15Requested
FTEChange
Buildings & Grounds 36.00 36.00 36.00 0.00
Information Technology 8.00 8.00 8.00 0.00
Admin Support 8.50 8.50 8.50 0.00
Secretaries 21.88 21.88 20.95 -0.93
Paraprofessionals 60.62 61.00 61.00 0.00
Student Support 2.80 2.80 2.80 0.00
P/T School Staff 8.51 11.88 12.11 +0.23
Totals 146.31 150.06 149.36 -0.70
Pages 17-23
18
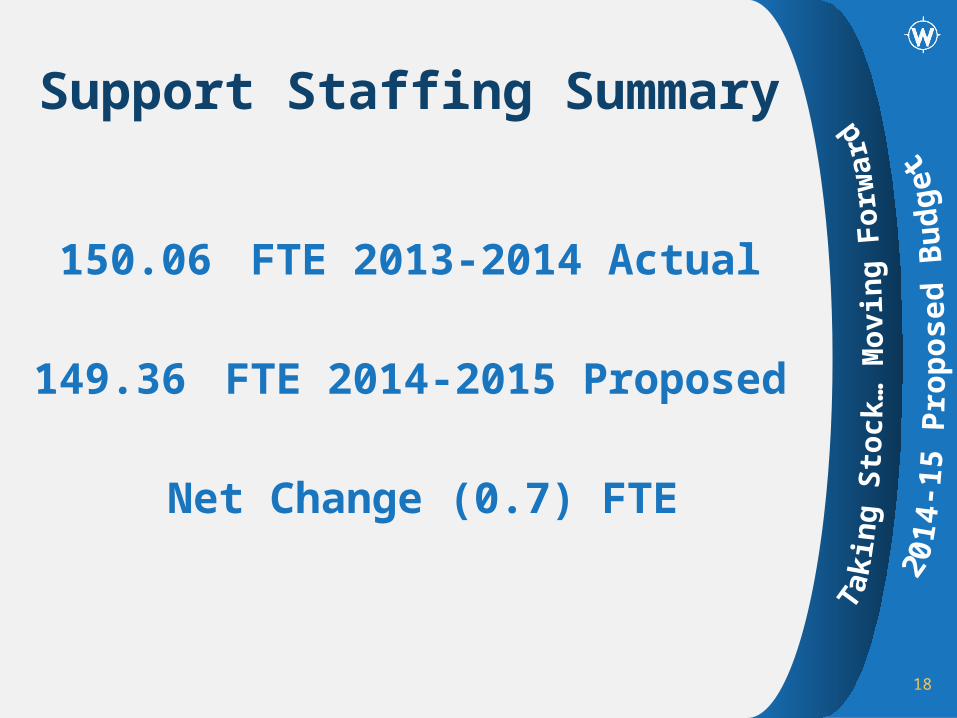
Support Staffing Summary
150.06 FTE 2013-2014 Actual
149.36 FTE 2014-2015 Proposed
Net Change (0.7) FTE

19
Contracted ServicesPages 28-31
Description 13-14Budget
14-15Budget Difference
Instructional Services $87,049 $89,660 $2,611
Professional Development $30,000 $31,050 $1,050
Curriculum Development $20,000 $25,000 $5,000

20
Curriculum Revision Cycle Updated December 2013
Curricular Content Areas RevisionBegins BOE Approval Implementation
English Language Arts (K-12) Winter 13 Winter 14 Fall 14Social Studies (K-12) Summer 13 Spring 14 Fall 14Physical Education (K-12) Summer 13 Spring 14 Fall 14Health (K-12) Summer 13 Spring 14 Fall 14
Art (K-12) Winter 14 Spring 15 Fall 15Science (K-12) Summer 14 Spring 15 Fall 15Gifted & Talented Program (3-8) Summer 14 Spring 15 Fall 15
Business & Finance Tech (6-12) Summer 15 Spring 16 Fall 16Family & Consumer Sciences (6-12) Summer 15 Spring 16 Fall 16Technology Ed & Engineering (6-12) Summer 15 Spring 16 Fall 16
World Languages (K-12) Summer 16 Spring 17 Fall 17Mathematics (K-12) Summer 16 Spring 17 Fall 17 Music (K-12) Summer 17 Spring 18 Fall 18Informational Technologies (K-12) Summer 17 Spring 18 Fall 18School Counseling (6-12) Summer 17 Spring 18 Fall 18
Page 71

21
TuitionThe Friendship School
Pages 38-47
The Friendship
School13-14
Enrollment
13-14Tuition
per Student
13-14Total
Tuition
14-15 Proj.
Enrollment
14-15 Proj.
Tuition per
Student
14-15Total
Budgeted Tuition
TFS (3 year / 4 yrs) 180 N/A $202,946 150 $3,014 N/A
TFS Birth to Three Sp Ed $211,230 26 $4,550 $118,300
TFS (5 yrs) 65 N/A 66 $4,550 $300,300
State Offset ($250,000)
Total TFS Budgeted Tuition $168,600

22
TuitionMagnet Schools K-8
Pages 38-47
Magnet Schools K-8
13-14Enrollment
13-14Tuition per
Student
13-14Total
Tuition
14-15 Proj.
Enrollment
14-15 Proj.
Tuition per
Student
14-15Total
Budgeted Tuition
RMMS 39 $2,758 $66,192 37 $2,813 $67,516
Winthrop STEM 9 $3,000 $27,000 9 $3,060 $27,540
Dual Language 6 $2,358 $14,148 6 $2,405 $15,032
ISAAC School 9 N/A N/A 9 N/A N/A
Total K-8 Magnet School Budgeted Tuition $110,088
23
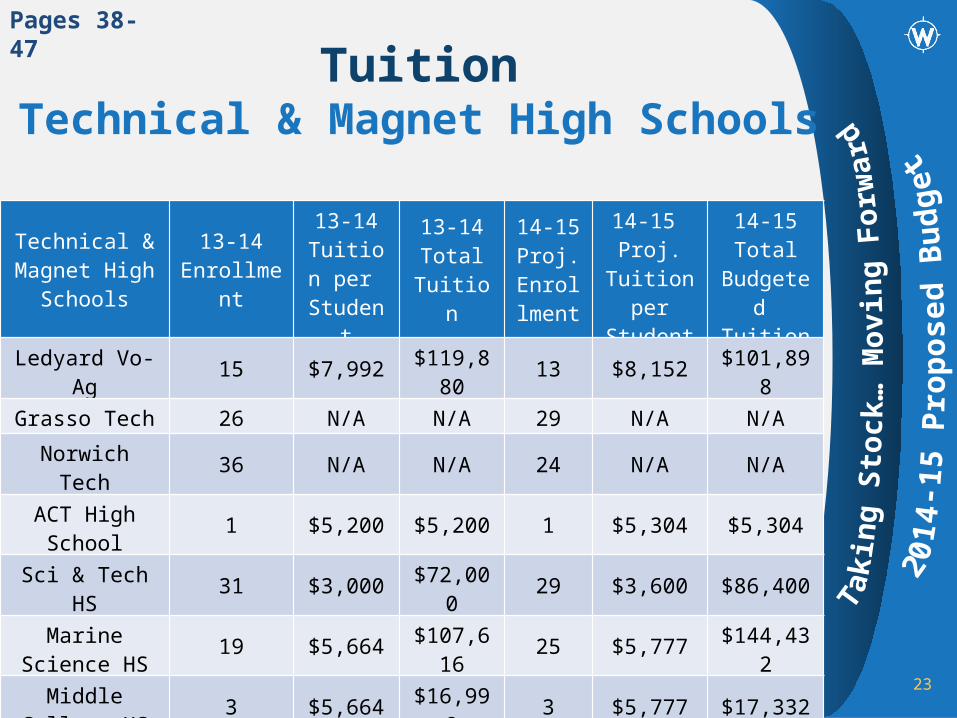
TuitionTechnical & Magnet High Schools
Pages 38-47
Technical & Magnet High
Schools13-14
Enrollment
13-14Tuition
per Student
13-14Total
Tuition
14-15 Proj.
Enrollment
14-15 Proj.
Tuition per
Student
14-15Total
Budgeted Tuition
Ledyard Vo-Ag 15 $7,992 $119,880 13 $8,152 $101,898
Grasso Tech 26 N/A N/A 29 N/A N/A
Norwich Tech 36 N/A N/A 24 N/A N/A
ACT High School 1 $5,200 $5,200 1 $5,304 $5,304
Sci & Tech HS 31 $3,000 $72,000 29 $3,600 $86,400
Marine Science HS 19 $5,664 $107,616 25 $5,777 $144,432
Middle College HS 3 $5,664 $16,992 3 $5,777 $17,332
Total Technical & Magnet High School Budgeted Tuition $355,366

24
TuitionProject Oceanology
Pages 38-47
ProjectOceanology
13-14Total
Tuition
14-15Total
Budgeted Tuition
CLMS $11,186 $11,410
WHS $25,368 $25,875
Total Project Oceanology Budgeted Tuition $37,285

25
Other Purchased Services
Description 13-14Budget
14-15Budget Difference
Conf/Meetings – TAG $1,812 $1,812 $0
Conf/Meetings – Building Admin $1,800 $1,800 $0
Conf/Meetings – Admin/BOE $5,000 $5,000 $0
Pages 48-50

26
Textbooks/Other Supplies
Description 13-14Budget
14-15Budget Difference
Texts New – District $100,000 $100,000 $0
Texts New Suppl – District $20,000 $20,000 $0
Prof Books Central Office $2,500 $2,500 $0
Suppl Other BOE $3,000 $3,000 $0
Suppl – Central Office $16,500 $16,500 $0
Pages 67-71

27
Dues & Fees
Description 13-14Budget
14-15Budget Difference
BOE / Central Office $26,810 $26,810 $0
Elementary $800 $800 $0
Vans $0 $531 $531
Pages 77-78

28
Next Level of Work
Curriculum •Implement LA; Social Studies; Health and PE Curriculum•Begin Renewal of Science and TAG Curriculum
Instruction •Support faculty’s understanding of Common Core•Strengthen our ‘standard track’ of course offerings
Assessment •Support faculty’s understanding of SBAC Summative Assessment