curriculum updated copy june 2016 · curriculum updated copy june 2016 . 2 diagnostic radiology...
TRANSCRIPT

CURRICULUM UPDATED COPY
JUNE 2016
2
Diagnostic Radiology Residents Physics Curriculum
Prepared by
Imaging Physics Curricula Subcommittee AAPM Subcommittee of the Medical Physics Education of Physicians Committee
UPDATED – JUNE 2016
Supported by: AAPM Education Council The following committee members have contributed to this document
William F. Sensakovic, PhD, Chair (2016) Kalpana M. Kanal, PhD, Chair (2009 - 2015) Maxwell Amurao, PhD Richard H. Behrman, PhD Libby F. Brateman, PhD Karen L. Brown, MHP, Vice Chair (2016) Gregory Chambers Jun Deng, PhD Bennett S. Greenspan, MD Philip H. Heintz, PhD Ping Hou, PhD Mary E. Moore, MS Marleen M. Moore, MS Venkataramanan Natarajan, PhD John D. Newell, Jr., MD Ronald Price, PhD Ioannis Sechopoulos, PhD
3
Preface The purpose of this curriculum is to outline the breadth and depth of scientific knowledge underlying the practice of diagnostic radiology that will aid a practicing radiologist in understanding the strengths and limitations of the tools in his/her practice. This curriculum describes the core physics knowledge related to medical imaging that a radiologist should know when graduating from an accredited radiology residency program. The subject material described in this curriculum should be taught in a clinically relevant manner; the depth and order of presentation is left to the institution. Although this curriculum was not developed specifically to prepare residents for the American Board of Radiology (ABR) examination, it is understood that this is one of the aims of this curriculum. The ABR certification in diagnostic radiology is divided into two examinations, the first covering basic/intermediate knowledge of all diagnostic radiology and a second certifying exam covering the practice of diagnostic radiology. The first exam will be broken into three primary categories: (1) fundamental radiologic concepts, (2) imaging methods, and (3) organ systems. This curriculum is designed to address the fundamental radiologic concepts and imaging methods categories directly. The last category on organ systems is not addressed directly within the curriculum; however, the educator needs to associate the concepts within the modules continuously in different organ systems to assure that the clinical applications are evident. The question sets contained in this curriculum were created to provide additional educational materials for teaching residents as well as for resident self-education. The questions are not based on recalls of old American Board of Radiology examination questions. Any similarity with the past or current ABR examination is purely coincidental. This curriculum contains 15 modules covering imaging physics. The first seven modules cover basic radiation physics and biology, and the remaining eight modules utilize this base information to examine clinical applications of physics to each modality. Each module presents its content in three sections: (1) learning objectives, (2) curriculum, and (3) Q&A. The first section of each module presents the learning objectives for the module. These learning objectives are organized into three subsections: (1) fundamental knowledge relating to module concepts, (2) specific clinical applications of this knowledge, and (3) topics to permit demonstration of problem-solving based on the previous sections. The clinical applications and problem-solving subsections contain concepts that a resident should be able to understand and answer, following completion of each module. The second area within each module presents the curriculum that delineates the concepts the module addresses. The curriculum may be used as an outline for a course in imaging physics. Not all areas of each curriculum module need be taught with the same emphasis or weight, as long as the student can demonstrate an understanding of the educational objectives and solve clinically relevant problems. The curriculum is presented as a guide to the instructor providing specific topic details that may be needed to cover a subject more thoroughly. The third area within each module gives examples of questions and answers based on the content in the module to give the student an idea about the type of questions that could be asked on the topic.

4
TABLE OF CONTENTS
Module 1 – Basic Science – Structure of the Atom, Electromagnetic (EM) Radiation, and Particulate Radiation
5
Module 2 – Interactions of Ionizing Radiation with Matter
11
Module 3 – Radiation Units
18
Module 4 – X-ray Production
23
Module 5 – Basic imaging
30
Module 6 – Biological Effects of Ionizing Radiation
43
Module 7 – Radiation Protection and Associated Regulations
51
Module 8 – X-ray Projection Imaging Concepts and Detectors
61
Module 9 – General Radiography
68
Module 10 – Mammography
78
Module 11 – Fluoroscopy and Interventional Imaging
88
Module 12 – CT
96
Module 13 – Ultrasound
110
Module 14 – MRI
124
Module 15 – Nuclear Medicine 142
5
Module 1: Basic Science – Structure of the Atom, Electromagnetic (EM)
Radiation, and Particulate Radiation After completing this module, the resident should be able to apply the “Fundamental Knowledge” and “Clinical Applications” learned from the module to example tasks, such as those found in “Clinical Problem-solving.” Fundamental Knowledge:
1. Describe the components of the atom. 2. Explain the energy levels, binding energy, and electron transitions in an atom. 3. For the nucleus of an atom, describe its properties, how these properties determine its energy
characteristics, and how changes within the nucleus define its radioactive nature. 4. For an atom, describe how its electron/nuclear structure and associated energy levels define its
radiation-associated properties. 5. Explain how different transformation (“decay”) processes within the nucleus of an atom
determine the type of radiation produced and the classification of the nuclide. 6. Describe the wave and particle characteristics of electromagnetic (EM) radiation. 7. Within the EM radiation spectrum, identify the properties associated with energy and the ability
to cause ionization. 8. Identify the different categories and properties of particulate radiation.
Clinical Application:
1. Explain how the relative absorption of electromagnetic radiation in the body varies across the electromagnetic energy spectrum.
2. Introduce the concept of interactions of ionizing photons, e.g., in imaging detectors, biological effects, etc.
3. Give examples of types of EM radiation used in imaging in radiology and nuclear medicine. 4. Understand why particulate radiation is not used for diagnostic imaging.
Clinical Problem-solving:
1. None Curriculum: 1. Structure of the Atom
1.1. Composition 1.1.1. Electrons 1.1.2. Nucleus
1.2. Electronic Structure 1.2.1. Electron Orbits 1.2.2. Orbital Nomenclature 1.2.3. Binding Energy 1.2.4. Electron Transitions 1.2.5. Characteristic Radiation 1.2.6. Auger Electrons
1.3. Nuclear Structure 1.3.1. Composition 1.3.2. Nuclear Force

6
1.3.3. Mass Defect 1.3.4. Binding Energy 1.3.5. Overview of Radioactive Decay 1.3.6. Isotopes and Isomers
2. Electromagnetic (EM) Radiation 2.1. The Photon
2.1.1. Electromagnetic Quanta 2.1.2. Origin of X-rays, Gamma Radiation, and Annihilation Radiation 2.1.3. Properties of Photons
2.1.3.1. Energy Mass Equivalence 2.1.3.2. Speed 2.1.3.3. Energy
2.2. Electromagnetic Spectrum 2.2.1. Electric and Magnetic Components 2.2.2. Ionizing e.g., X-rays, Gamma Rays 2.2.3. Non-Ionizing e.g., RF (MRI), Visible Light
3. Particulate Radiation 3.1. Electrons and Positrons 3.2. Heavy Charged Particles
3.2.1. Protons 3.2.2. Alpha Particles
3.3. Uncharged Particles 3.3.1. Neutrons 3.3.2. Neutrinos and Antineutrino
7
Example Q&A: Q1. Elements which have the same Z (atomic number) but different A (mass number) are called: A. Isobars B. Isomers C. Isotones D. Isotopes Answer: D – Isotopes Explanation: Isotopes are forms of the same element, and thus have the same atomic number Z (the number of protons), but have a different number of neutrons, thus different mass number A (neutrons plus protons). Isobars have the same A but different Z. Isomers have the same A and Z, but different energy states. Isotones have the same number of neutrons but different Z. Isotopes and isomers are common concepts in radiology. Reference:
1. Bushberg, J.T., et al. The Essential Physics of Medical Imaging, 3rd ed. Philadelphia: Lippincott Williams & Wilkins, 2012.
2. Huda, W. Review of Radiologic Physics, 3rd ed. Philadelphia: Lippincott Williams & Wilkins, 2010.
Q2. The mass number (A) of an atom is equal to the number of: A. Neutrons B. Protons C. Neutrons and protons D. Protons and electrons Answer: C – Neutrons and protons Explanation: The mass number is defined as the number of nucleons (protons and neutrons) in the atomic nucleus. Reference:
1. Bushberg, J.T., et al. The Essential Physics of Medical Imaging, 3rd ed. Philadelphia: Lippincott Williams & Wilkins, 2012.
2. Huda, W. Review of Radiologic Physics, 3rd ed. Philadelphia: Lippincott Williams & Wilkins, 2010.

8
Q3. The binding energy of an electron in the K-shell is: A. The energy the electron needs to stay in the K-shell B. The energy needed for an electron to make a transition from the K-shell to L-shell C. The energy needed for an electron to transition from the L-shell to K-shell D. The energy needed to remove an electron from the K-shell Answer: D – The energy needed to remove an electron from the K-shell. Explanation: The binding energy of an electron at a certain shell is defined as the energy needed to remove that electron from the specific shell. Reference:
1. Bushberg, J.T., et al. The Essential Physics of Medical Imaging, 3rd ed. Philadelphia: Lippincott Williams & Wilkins, 2012.
2. Huda, W. Review of Radiologic Physics, 3rd ed. Philadelphia: Lippincott Williams & Wilkins, 2010.
Q4. A proton is electrostatically repelled by: A. Electrons B. Neutrons C. Photons D. Neutrinos E. Alphas Answer: E – Alphas Explanation: As a proton, a positron, and an alpha particle are all positively charged particles (while an electron is negatively charged and a neutron is neutral), a proton will be repelled by both a positron and an alpha particle. Reference:
1. Bushberg, J.T., et al. The Essential Physics of Medical Imaging, 3rd ed. Philadelphia: Lippincott Williams & Wilkins, 2012.
2. Huda, W. Review of Radiologic Physics, 3rd ed. Philadelphia: Lippincott Williams & Wilkins, 2010.
9
Q5. Which of the following modalities uses only non-ionizing radiation to generate an image? A. Fluoroscopy B. Mammography C. MRI E. CT Answer: C – MRI Explanation: MRI uses radio waves, while all other modalities use ionizing radiation. References:
1. Bushberg, J.T., et al. The Essential Physics of Medical Imaging, 3rd ed. Philadelphia: Lippincott Williams & Wilkins, 2012.
2. Huda, W. Review of Radiologic Physics, 3rd ed. Philadelphia: Lippincott Williams & Wilkins, 2010.
Q6. Which of the following is an example of particulate radiation? A. Microwaves B. X-rays C. Alpha particles D. Gamma rays Answer: C – Alpha particles Explanation: Microwaves, x-rays, and gamma rays are all forms of electromagnetic radiation. Only alpha particles are particulate. References:
1. Bushberg, J.T., et al. The Essential Physics of Medical Imaging, 3rd ed. Philadelphia: Lippincott Williams & Wilkins, 2012.
2. Huda, W. Review of Radiologic Physics, 3rd ed. Philadelphia: Lippincott Williams & Wilkins, 2010.
10
Q7. A radiation detector records a reading when an unshielded detector is swept over a spill, but no reading when a shielded detector is swept over the spill. What does this tell us about the spilled substance? A. The substance is not radioactive since it did not register in both orientations. B. The substance emits high-energy photons since it only registered when unshielded. C. The substance emits particulate radiation or very low-energy photons since it only registered when
unshielded. D. The substance has a very long half-life because the meter did not register when shielded. Answer: C – The substance emits particulate radiation or very low-energy photons since it only registered when unshielded. Explanation: Particulate or very low-energy photons will be absorbed in the shielding and will not register (or barely register) in the detector. When unshielded, the energy is deposited in the detector. Particulate radiation has a limited range and will not pass through a shielded detector. References:
1. Bushberg, J.T., et al. The Essential Physics of Medical Imaging, 3rd ed. Philadelphia: Lippincott Williams & Wilkins, 2012.
2. Cherry, S.R., J.A. Sorenson, and M.E. Phelps. Physics in Nuclear Medicine, 4th ed. Philadelphia: Elsevier Saunders, 2012.
Q8. A person accidentally ingests an unknown radioactive substance and lives in close proximity with his or her family. Which of the following types of radiation is the greatest safety concern for the family? A. Photons (364 keV) B. Neutrinos C. Electrons (30 keV) D. Alpha particles Answer: A – Photons (364 keV) Explanation: Low-energy electrons and alpha particles all have relatively short ranges in human tissue, and thus most or all of these particles will be absorbed by the person and will not reach the family to cause radiation damage. Neutrinos have very little interaction with tissue. References:
1. Bushberg, J.T., et al. The Essential Physics of Medical Imaging, 3rd ed. Philadelphia: Lippincott Williams & Wilkins, 2012.
2. Huda, W. Review of Radiologic Physics, 3rd ed. Philadelphia: Lippincott Williams & Wilkins, 2010.

11
Module 2: Interactions of Ionizing Radiation with Matter
After completing this module, the resident should be able to apply the “Fundamental Knowledge” and “Clinical Applications” learned from the module to example tasks, such as those found in “Clinical Problem-solving.” Fundamental Knowledge:
1. Describe how charged particles interact with matter and the resulting effects these interactions can have on the material.
2. Describe the processes by which x-ray and g-ray photons interact with individual atoms in a material and the characteristics that determine which processes are likely to occur.
3. Identify how photons and charged particles are attenuated within a material and the terms used to characterize the attenuation.
Clinical Application: 1. Identify which photon interactions are dominant for each of the following imaging modalities:
mammography, projection radiography, fluoroscopy, CT, and various nuclear medicine radioactive isotopes.
2. Understand how image quality and patient dose are affected by these interactions. 3. Understand which x-ray beam energies are to be used with intravenous iodine and oral barium
contrast agents. 4. Understand how the types of photon interactions change with energy and their associated clinical
significance. 5. Understand why charged particle interactions may result in a high localized dose.
Clinical Problem-solving:
1. What is the purpose of adding filtration in x-ray imaging (e.g., copper, aluminum)? 2. How does half-value layer affect patient dose? 3. What makes a contrast agent radiolucent instead of radio-opaque? 4. What is the effect of backscatter on skin dose? 5. Describe why charged particle interactions would be useful for delivering a therapeutic radiation
dose? Curriculum: 2. Interactions of Ionizing Radiation with Matter
2.1. Charged Particle Interactions 2.1.1. Ionization and Secondary Ionization
2.1.1.1. Specific Ionization 2.1.1.2. Linear Energy Transfer (LET) 2.1.1.3. Range
2.1.2. Excitation 2.1.3. Bremsstrahlung 2.1.4. Positron Annihilation
2.2. Photon Interactions 2.2.1. Coherent Scattering 2.2.2. Photoelectric Effect 2.2.3. Compton Scattering
2.3. Photon Attenuation
12
2.3.1. Linear and Mass Attenuation 2.3.2. Mono-energetic and Poly-energetic Photon Spectra 2.3.3. Half-value Layer (HVL)
2.3.3.1. Effective Energy 2.3.3.2. Beam Hardening
2.3.4. Interactions in Materials of Clinical Interest 2.3.4.1. Tissues 2.3.4.2. Radiographic Contrast Agents 2.3.4.3. Detectors 2.3.4.4. Shielding materials
Example Q&A: Q1. What is the predominant interaction of 120 kV x-rays from a computed tomography scanner with soft tissue? A. Coherent scattering B. Compton scattering C. Photoelectric effect D. Pair production Answer: B – Compton scattering Explanation: Above 25 keV, Compton scatter is the dominant photon interaction in soft tissue. Because CT x-ray beams have higher filtration than radiographic units, the effective energy is closer to one-half of the kV (60 keV). References:
1. Bushberg, J.T., et al. The Essential Physics of Medical Imaging, 3rd ed. Philadelphia: Lippincott Williams & Wilkins, 2012.
2. Huda, W. Review of Radiologic Physics, 3rd ed. Philadelphia: Lippincott Williams & Wilkins, 2010.

13
Q2. If a radiologic technologist uses 80 kV for the AP projection of the lumbar spine, which of the following interactions will be the predominant interaction with bone? A. Coherent scattering B. Compton scattering C. Photoelectric effect D. Pair production Answer: C – Photoelectric effect Explanation: The average energy for an 80 kV spectrum is typically 1/3 to 1/2 of the maximal energy. X-ray photons in this range interact primarily by photoelectric interaction with bone. The primary interaction in this range (25–40 keV) with soft tissue is Compton scattering. References:
1. Bushberg, J.T., et al. The Essential Physics of Medical Imaging, 3rd ed. Philadelphia: Lippincott Williams & Wilkins, 2012.
2. Huda, W. Review of Radiologic Physics, 3rd ed. Philadelphia: Lippincott Williams & Wilkins, 2010.
Q3. During imaging of a patient, the proportion of Compton scatter is increased by increasing which of the following technical parameters? A. Exposure time B. Focal spot size C. kV D. Source-to-image receptor distance Answer: C – kV Explanation: The proportion of Compton scattering compared to photoelectric interactions increases with an increase in x-ray beam energy (kV, filtration). References:
1. Bushberg, J.T., et al. The Essential Physics of Medical Imaging, 3rd ed. Philadelphia: Lippincott Williams & Wilkins, 2012.
2. Huda, W. Review of Radiologic Physics, 3rd ed. Philadelphia: Lippincott Williams & Wilkins, 2010.
14
Q4. Which of the following interactions is primarily responsible for patient dose in the low diagnostic energy range? A. Coherent scattering B. Compton scattering C. Photoelectric effect D. Pair production Answer: C – Photoelectric effect Explanation: Absorbed dose is energy absorbed per unit mass. In photoelectric effect, the incoming photon is completely absorbed locally. References:
1. Bushberg, J.T., et al. The Essential Physics of Medical Imaging, 3rd ed. Philadelphia: Lippincott Williams & Wilkins, 2012.
2. Huda, W. Review of Radiologic Physics, 3rd ed. Philadelphia: Lippincott Williams & Wilkins, 2010.
Q5. The predominant interaction of Tc-99m photons with a sodium iodide crystal is: A. Coherent scattering B. Compton scattering C. Photoelectric effect D. Pair production Answer: C – Photoelectric effect Explanation: Tc-99m gamma photons have energy of 140 keV. At this energy more than 50% of the interactions are photoelectric. (See Figure 3–11 in the Bushberg reference below.) Reference:
1. Bushberg, J.T., et al. The Essential Physics of Medical Imaging, 3rd ed. Philadelphia: Lippincott Williams & Wilkins, 2012.
2. Huda, W. Review of Radiologic Physics, 3rd ed. Philadelphia: Lippincott Williams & Wilkins, 2010.

15
Q6. The unit for linear energy transfer (LET) is: A. keV per µm B. keV per density C. keV per mg D. keV per g Answer: A – keV per µm Explanation: Linear energy transfer is the average amount of energy deposited locally per unit path length. Do not confuse the units of LET with the units of absorbed dose, which is energy absorbed per mass. Increases in LET increase the radiation weighting factor. References:
1. Bushberg, J.T., et al. The Essential Physics of Medical Imaging, 3rd ed. Philadelphia: Lippincott Williams & Wilkins, 2012.
2. Huda, W. Review of Radiologic Physics, 3rd ed. Philadelphia: Lippincott Williams & Wilkins, 2010.
Q7. In interactions of x-ray and gamma ray radiation with matter, the occurrence of a sharp increase in photoelectric absorption is related to: A. density increases B. density decreases C. the photon energy being just above the atomic number of the substance D. the photon energy being just above the electron binding energy Answer: D – the photon energy being just above the electron binding energy. Explanation: Photoelectric absorption is proportional to Z3/E3, and there is a sharp increase in absorption when the incoming photon energy is slightly above the electron binding energy. References:
1. Bushberg, J.T., et al. The Essential Physics of Medical Imaging, 3rd ed. Philadelphia: Lippincott Williams & Wilkins, 2012.
2. Huda, W. Review of Radiologic Physics, 3rd ed. Philadelphia: Lippincott Williams & Wilkins, 2010.
16
Q8. At 80 kV, assume the soft-tissue HVL is 4 cm. What is the approximate radiation dose to an embryo located 8 cm below the anterior surface, expressed as a percentage of the entrance skin dose? A. 100% B. 75% C. 50% D. 25% E. 12.5% Answer: D – 25% Explanation: At 80 kV, the half-value layer for soft tissue is approximately 3 to 4 cm. If the HVL is 3 cm of soft tissue, the embryo radiation dose would be 12.5% of the entrance skin dose. If the HVL is 4 cm of soft tissue, the radiation dose would be 25% of the entrance skin dose. Reference:
1. Bushberg, J.T., et al. The Essential Physics of Medical Imaging, 3rd ed. Philadelphia: Lippincott Williams & Wilkins, 2012.
Q9. Which of the following is the most penetrating of the radiations listed? A. Electrons from I-131 radioactive decay B. Photons from Tc-99m radioactive decay C. Positrons from F-18 radioactive decay D. Photons from F-18 radioactive decay Answer: D – Photons from F-18 radioactive decay Explanation: Penetration increases with energy, and the annihilation radiation at 511 keV is the most penetrating. Between charged particulate radiation and photons of same energy, photons are more penetrating. References:
1. Bushberg, J.T., et al. The Essential Physics of Medical Imaging, 3rd ed. Philadelphia: Lippincott Williams & Wilkins, 2012.
2. Huda, W. Review of Radiologic Physics, 3rd ed. Philadelphia: Lippincott Williams & Wilkins, 2010.
17
Q10. The energy of each photon created when a positron interacts with an electron in an annihilation reaction is: A. 5 eV B. 140 keV C. 511 keV D. 1.022 MeV E. 3 MeV Answer: C – 511 keV Explanation: The rest mass of the electron and positron are each 511 keV for a total of 1.022 MeV. When the annihilation reaction occurs, two 511 keV photons are created. References:
1. Bushberg, J.T., et al. The Essential Physics of Medical Imaging, 3rd ed. Philadelphia: Lippincott Williams & Wilkins, 2012.
2. Huda, W. Review of Radiologic Physics, 3rd ed. Philadelphia: Lippincott Williams & Wilkins, 2010.
Q11. Which of the following is most damaging to tissue? A. Electron (100 keV) B. Photon (diagnostic energy) C. Neutrino D. Proton (100 keV) Answer: D – Proton (100 keV) Explanation: Neutrinos are near massless particles that undergo almost no interactions with any matter (many penetrate Earth without interacting). Photons undergo exponential attenuation, meaning the photon interactions are spread over all depths (some photons will not interact at all). When interactions do occur, either all (photoelectric effect), part (Compton scattering), or no (Rayleigh scattering) energy may be deposited locally. Electrons have a finite range, depositing energy locally by hard and soft collisions. Some energy will be lost due to radiative losses; further, the damage will be spread over the range of the electron. Protons lose little energy due to radiative losses, and the majority of the energy is deposited in a small volume close to the end of their range due to the presence of a Bragg peak.
18
Module 3: Radiation Units
After completing this module, the resident should be able to apply the “Fundamental Knowledge” and “Clinical Applications” learned from the module to example tasks, such as those found in “Clinical Problem-solving.” Fundamental Knowledge:
1. Recognize that there are two different systems for units of measurement (i.e., SI and traditional) used to describe physical quantities.
2. Describe the SI and traditional units for measuring the ionization resulting from radiation interactions in air (e.g., exposure-related quantities).
3. Describe the concepts of dose-related quantities and their SI and traditional units. Clinical Application:
1. Discuss the appropriate use or applicability of radiation quantities in the health care applications of imaging, therapy, and safety.
Clinical Problem-solving:
1. How would you explain radiation exposure and dose to a patient? 2. How do you convert between dosages in MBq and dosages in mCi? 3. How do you convert 1 rad and 1 Gy? 4. When is it appropriate to use effective dose vs. absorbed dose?
Curriculum: 3. Radiation Units
3.1. System of Units 3.1.1. SI
3.1.1.1. Prefixes: Nano- to Tera- 3.1.2. Traditional
3.2. Radioactivity 3.2.1. Dosage 3.2.2. SI – Becquerel (Bq) 3.2.3. Traditional – Curie (Ci)
3.3. Exposure 3.3.1. Coulomb/kilogram 3.3.2. Roentgen (R)
3.4. Kinetic Energy Released in Matter (KERMA) 3.4.1. Gray (Gy) 3.4.2. Rad
3.5. Absorbed Dose 3.5.1. Gray (Gy) 3.5.2. Rad
3.6. Equivalent Dose 3.6.1. Radiation Weighting Factors 3.6.2. Sievert (Sv) 3.6.3. Rem
3.7. Effective Dose 3.7.1. Tissue Weighting Factors
19
3.7.2. Sievert (Sv) 3.7.3. Rem
Example Q&A: Q1. The unit for effective dose is: A. R/min B. mGy C. mR D. mSv Answer: D – mSv Explanation: None References:
1. Bushberg, J.T., et al. The Essential Physics of Medical Imaging, 3rd ed. Philadelphia: Lippincott Williams & Wilkins, 2012.
2. Huda, W. Review of Radiologic Physics, 3rd ed. Philadelphia: Lippincott Williams & Wilkins, 2010.
Q2. The absorbed dose multiplied by a weighting factor appropriate for the type of radiation is: A. Integral absorbed dose B. Equivalent dose C. Effective dose D. Committed equivalent dose Answer: B – Equivalent dose Explanation: By definition. Note that “equivalent dose,” obtained by multiplying the absorbed dose by the radiation weighting factor (WR), which is a function of the type and energy of the radiation, is the definition to be used as given by the International Commission on Radiological Protection. References:
1. Bushberg, J.T., et al. The Essential Physics of Medical Imaging, 3rd ed. Philadelphia: Lippincott Williams & Wilkins, 2012.
2. Hendee, W.R. and E.R. Ritenour. Medical Imaging Physics, 4th ed. New York: Wiley–Liss, 2002.

20
Q3. A medical worker receives 30 mGy to an area of skin on the hand from alpha particles. The equivalent dose to this area of skin is: A. 30 mGy B. 30 mSv C. 600 mGy D. 600 mSv Answer: D – 600 mSv Explanation: Equivalent dose (H) = radiation weighting factor (WR) times absorbed dose (D) where WR = 20 for alpha particles. Equivalent dose is given in Sv. References:
1. Bushberg, J.T., et al. The Essential Physics of Medical Imaging, 3rd ed. Philadelphia: Lippincott Williams & Wilkins, 2012.
2. Huda, W. Review of Radiologic Physics, 3rd ed. Philadelphia: Lippincott Williams & Wilkins, 2010.
Q4. Match the following quantities with their SI units. Units may be used more than once. A. Absorbed dose _______ 1. sievert B. Equivalent dose _______ 2. gray C. Effective dose _______ 3. roentgen D. Air Kerma _______ 4. Coulomb per kilogram E. Exposure _______ Answer: A.2, B.1, C.1, D.2, E.4 References:
1. Bushberg, J.T., et al. The Essential Physics of Medical Imaging, 3rd ed. Philadelphia: Lippincott Williams & Wilkins, 2012.
2. Huda, W. Review of Radiologic Physics, 3rd ed. Philadelphia: Lippincott Williams & Wilkins, 2010.

21
Q5. Which quantity provides a single index that relates to the overall stochastic risk (at diagnostic radiation dose levels) when multiple organs are irradiated? A. Absorbed dose B. Equivalent dose C. Effective dose D. Air kerma E. Exposure Answer: C – Effective dose Explanation: Absorbed dose and equivalent dose are used to assess radiation risks to individual organs and tissues. Air kerma and exposure are both used to quantify the radiation intensity in air, but they do not provide an overall radiation risk index from multiple tissue and organ irradiation. References:
1. Bushberg, J.T., et al. The Essential Physics of Medical Imaging, 3rd ed. Philadelphia: Lippincott Williams & Wilkins, 2012.
2. Huda, W. Review of Radiologic Physics, 3rd ed. Philadelphia: Lippincott Williams & Wilkins, 2010.
Q6. Which statement is true regarding effective dose? A. It is dependent on co-morbidities B. It is restricted only to single individual organ or tissue doses C. It is a weighted sum of equivalent doses over multiple organs and tissues D. It is independent of radiation type Answer: C – It is a weighted sum of equivalent doses over multiple organs and tissues. Explanation: A is incorrect as the tissue weighting factors, WT, used in the definition of effective dose (E) are for an average patients and do not consider co-morbidities. B is incorrect as effective dose can be used for both multiple and single organ and tissue irradiation. D is incorrect as equivalent dose includes the radiation weighting factors, WR. References:
1. Bushberg, J.T., et al. The Essential Physics of Medical Imaging, 3rd ed. Philadelphia: Lippincott Williams & Wilkins, 2012.
2. Huda, W. Review of Radiologic Physics, 3rd ed. Philadelphia: Lippincott Williams & Wilkins, 2010.

22
Q7. Convert a dosage of 20mCi Tc-99m to MBq of Tc-99m A. 0.54 MBq B. 20 MBq C. 37 MBq D. 740 MBq Answer: D – 740 MBq Explanation: 1 mCi is equal to 37 MBq. References:
1. Bushberg, J.T., et al. The Essential Physics of Medical Imaging, 3rd ed. Philadelphia: Lippincott Williams & Wilkins, 2012.
2. Huda, W. Review of Radiologic Physics, 3rd ed. Philadelphia: Lippincott Williams & Wilkins, 2010.
23
Module 4: X-ray Production
After completing this module, the resident should be able to apply the “Fundamental Knowledge” and “Clinical Applications” learned from the module to example tasks, such as those found in “Clinical Problem-solving.” Fundamental Knowledge:
1. Describe the two mechanisms by which energetic electrons produce x-rays and the energy distribution for each mechanism of x-ray production.
2. Describe the function of the cathode and anode of an x-ray tube and how variations in their design influence x-ray production.
3. Define technique factors used in diagnostic imaging kV, mA, exposure time, mAs. 4. Define the attributes of an x-ray beam, including the functions of filtration, spectrum of energies
produced, and beam restriction. 5. Describe the heel effect and how it can be used to improve clinical radiographs.
Clinical Application:
1. Demonstrate how the x-ray tube design, target material, tube voltage, beam filtration, and focal spot size are optimized for a specific imaging task (e.g., mammography, interventional imaging, or CT).
Clinical Problem-solving:
1. How do kV, mAs, filtration, and field size impact x-ray intensity and beam quality? Curriculum: 4. X-ray Production
4.1. Bremsstrahlung 4.2. Characteristic Radiation 4.3. Production of X-rays
4.3.1. X-ray Intensity and Dose 4.3.2. Electron Energy 4.3.3. Target Material 4.3.4. Filtration 4.3.5. Spectrum and Beam Quality
4.4. X-ray Tube 4.4.1. Cathode
4.4.1.1. Filament 4.4.1.2. Focusing Cup 4.4.1.3. Filament Current and Tube Current
4.4.2. Anode 4.4.2.1. Composition 4.4.2.2. Configurations (e.g., Angulation, Stationary vs. Rotating) 4.4.2.3. Line-focus Principle 4.4.2.4. Focal Spot 4.4.2.5. Heel Effect 4.4.2.6. Off-focus Radiation 4.4.2.7. Tube Heating and Cooling
4.4.3. Applications

24
4.4.3.1. Mammography 4.4.3.2. Radiography and Fluoroscopy (R&F) 4.4.3.3. CT 4.4.3.4. Interventional 4.4.3.5. Mobile X-ray 4.4.3.6. Dental
4.5. Generators 4.5.1. High-frequency
4.6. Technique Factors 4.6.1. Tube Voltage (kV) 4.6.2. Tube Current (mA) 4.6.3. Time 4.6.4. Automatic Exposure Control (AEC) 4.6.5. Technique Charts
4.7. X-ray Beam Modification 4.7.1. Beam Filtration
4.7.1.1. Inherent 4.7.1.2. Added (Al, Cu, Mo, Rh, Ag, other) 4.7.1.3. Minimum HVL 4.7.1.4. Shaped Filters
4.7.2. Collimators 4.7.2.1. Field Size Limitation 4.7.2.2. Light Field and X-ray Field Alignment 4.7.2.3. Influence on Image Quality and Dose 4.7.2.4. Beam Shaping in IR
Example Q&A: Q1. What is a direct result of adding filtration to a diagnostic x-ray beam? A. All characteristic radiation is removed B. Image contrast is improved C. Maximum photon energy is increased D. X-ray tube heat loading is reduced E. Patient dose is reduced Answer: E – Patient dose is reduced. Explanation: Added filters reduce the quantity of low-energy x-ray photons and “harden” the x-ray beam. Usually this is desirable because the removal of “soft” x-ray photons reduces patient skin dose. References:
1. Hendee, W.R. and R. Ritenour. Medical Imaging Physics, 3rd ed. St. Louis: Mosby, 1992. 2. Bushberg, J.T., et al. The Essential Physics of Medical Imaging, 3rd ed. Philadelphia: Lippincott
Williams & Wilkins, 2012.
25
Q2. Which of the following always increases as focal spot size increases? A. Field of view B. Patient dose C. Geometric un-sharpness D. Anode diameter Answer: C – Geometric un-sharpness Explanation: The larger the focal spot size, the greater the geometric un-sharpness when combined with magnification. Larger FSS un-sharpness is not observable in contact radiography. References:
1. Bushberg, J.T., et al. The Essential Physics of Medical Imaging, 3rd ed. Philadelphia: Lippincott Williams & Wilkins, 2012.
2. Hendee, W.R. and R. Ritenour. Medical Imaging Physics, 3rd ed. St. Louis: Mosby, 1992. Q3. In projection radiography, which of the following will reduce patient skin dose?
A. Increased filtration B. Higher grid ratio C. Lower kV D. Smaller focal spot size Answer: A – Increased filtration Explanation: Added filters reduce the quantity of low-energy x-ray photons and “harden” the x-ray beam. Usually this is desirable because the removal of “soft” x-ray photons reduces the patient skin dose. References:
1. Hendee, W.R. and R. Ritenour. Medical Imaging Physics, 3rd ed. St. Louis: Mosby, 1992. 2. Bushberg, J.T., et al. The Essential Physics of Medical Imaging, 3rd ed. Philadelphia: Lippincott
Williams & Wilkins, 2012.

26
Q4. With which of the following is the heel effect more pronounced? A. Image receptor farther from the focal spot B. Large focal spot size C. Smaller image size D. No grid E. X-ray tube with a smaller anode angle Answer: E – X-ray tube with a smaller anode angle. Explanation: The x-ray intensity decreases from the cathode to the anode side of the beam. This variation in intensity across an x-ray beam is termed the heel effect. The heel effect is more pronounced when the anode angle is small and the SID is reduced. References:
1. Hendee, W.R. and R. Ritenour. Medical Imaging Physics, 3rd ed. St. Louis: Mosby, 1992. 2. Bushberg, J.T., et al. The Essential Physics of Medical Imaging. 3rd ed. Philadelphia: Lippincott
Williams & Wilkins, 2012.
27
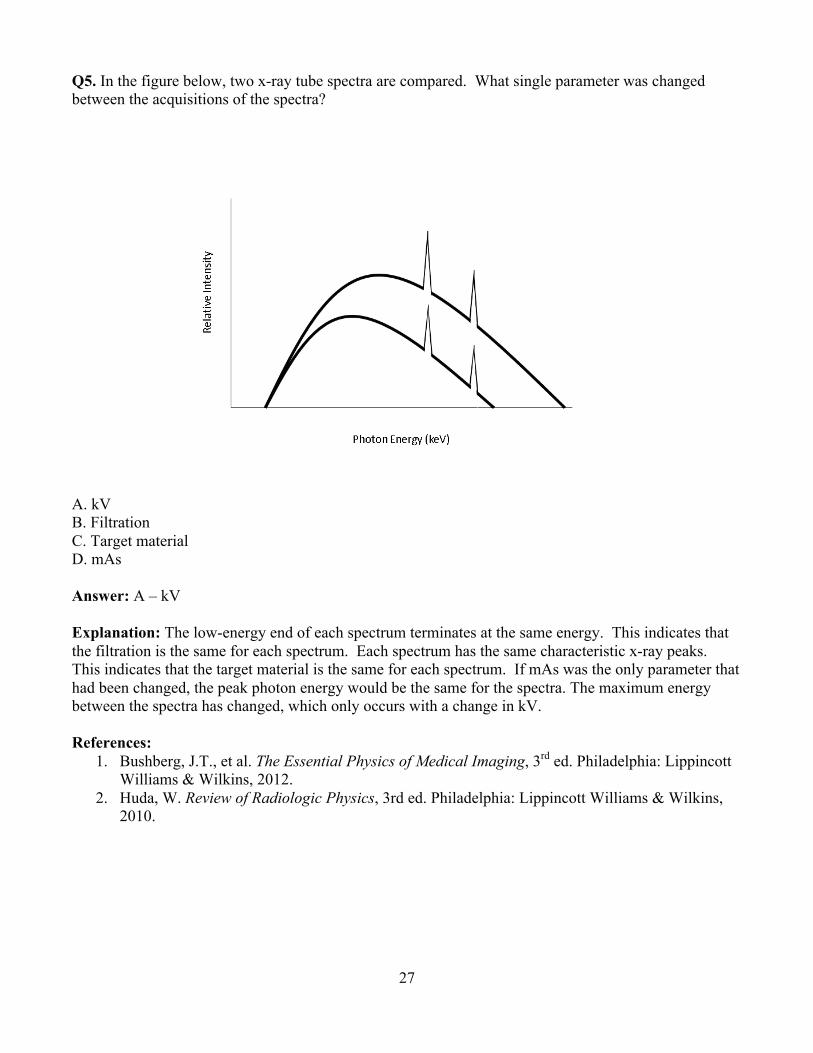
Q5. In the figure below, two x-ray tube spectra are compared. What single parameter was changed between the acquisitions of the spectra?
A. kV B. Filtration C. Target material D. mAs Answer: A – kV Explanation: The low-energy end of each spectrum terminates at the same energy. This indicates that the filtration is the same for each spectrum. Each spectrum has the same characteristic x-ray peaks. This indicates that the target material is the same for each spectrum. If mAs was the only parameter that had been changed, the peak photon energy would be the same for the spectra. The maximum energy between the spectra has changed, which only occurs with a change in kV. References:
1. Bushberg, J.T., et al. The Essential Physics of Medical Imaging, 3rd ed. Philadelphia: Lippincott Williams & Wilkins, 2012.
2. Huda, W. Review of Radiologic Physics, 3rd ed. Philadelphia: Lippincott Williams & Wilkins, 2010.

28
Q6. In the figure below, two x-ray tube spectra are compared. What single parameter was changed between the acquisitions of the spectra?
A. kV B. Filtration C. Target material D. mAs Answer: D – mAs Explanation: The low-energy end of each spectrum terminates at the same energy. This indicates that the filtration is the same for each spectrum. Each spectrum has the same characteristic x-ray peaks. This indicates that the target material is the same for each spectrum. Maximum energy did not change so a change in kV did not occur. The only change in the spectrum is a change in x-ray quantity which indicates a change in mAs. References:
1. Bushberg, J.T., et al. The Essential Physics of Medical Imaging, 3rd ed. Philadelphia: Lippincott Williams & Wilkins, 2012.
2. Huda, W. Review of Radiologic Physics, 3rd ed. Philadelphia: Lippincott Williams & Wilkins, 2010.
29
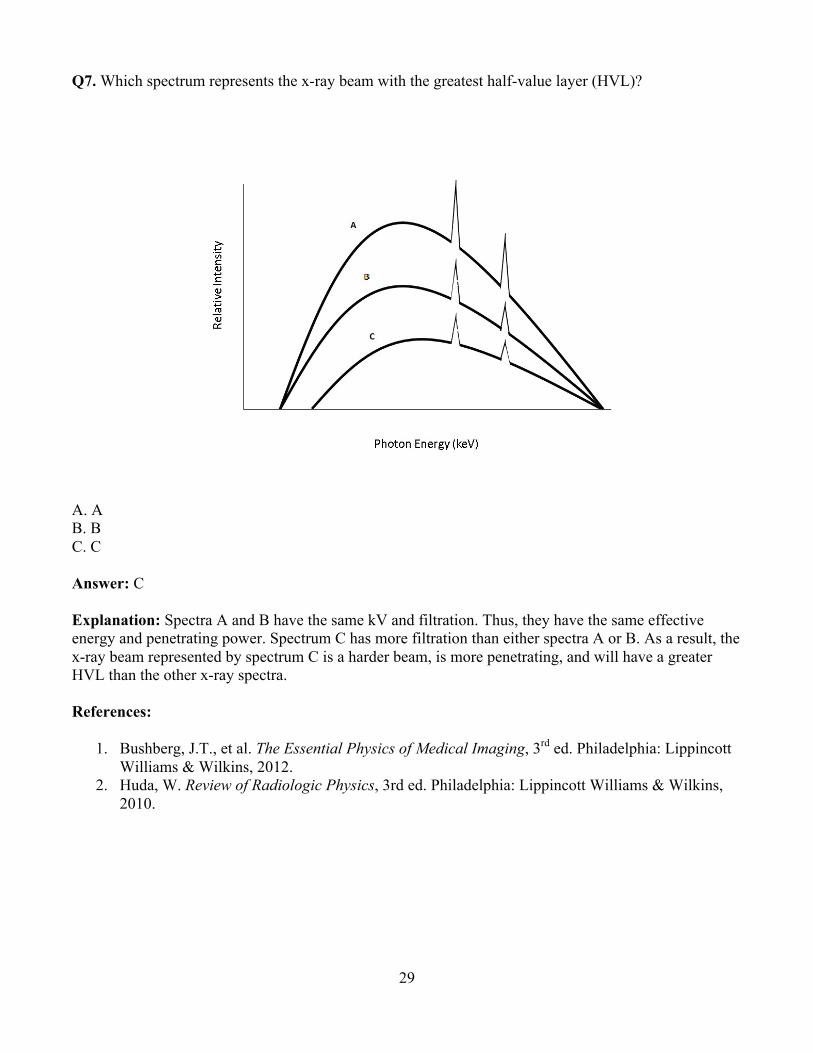
Q7. Which spectrum represents the x-ray beam with the greatest half-value layer (HVL)?
A. A B. B C. C Answer: C Explanation: Spectra A and B have the same kV and filtration. Thus, they have the same effective energy and penetrating power. Spectrum C has more filtration than either spectra A or B. As a result, the x-ray beam represented by spectrum C is a harder beam, is more penetrating, and will have a greater HVL than the other x-ray spectra. References:
1. Bushberg, J.T., et al. The Essential Physics of Medical Imaging, 3rd ed. Philadelphia: Lippincott Williams & Wilkins, 2012.
2. Huda, W. Review of Radiologic Physics, 3rd ed. Philadelphia: Lippincott Williams & Wilkins, 2010.

30
Module 5: Basic Imaging After completing this module, the resident should be able to apply the “Fundamental Knowledge” and “Clinical Applications” learned from the module to example tasks, such as those found in “Clinical Problem-solving.” Fundamental Knowledge:
1. Define common descriptive statistics (e.g., mean, variance, etc.) used in the radiology literature. 2. Define metrics and methods used to measure image quality and assess imaging systems. 3. Define the characteristics of a display and how they interact with the human visual system to
impact perceived image quality. 4. Understand basic concepts of image processing and image archiving.
Clinical Application:
1. Assess the validity of the type of statistical analysis used in the radiology literature. 2. Evaluate how display, ambient lighting, and luminance affect reader performance. 3. Develop custom hanging protocols for display of images. 4. Be familiar with display quality control. 5. Be familiar with the DICOM standard.
Clinical Problem-solving:
1. How would you set up a quality improvement study for a digital radiography system? 2. How would one use ROC analysis to compare performance between systems from different
modalities or manufacturers? 3. Explain to a physician why reading a chest radiograph on a tablet (e.g., ipad) might give a lower
probability of detecting disease than reading the same exam in a reading room. 4. Choose a window and level for detecting a soft-tissue lesion in the mediastinum. 5. Explain why large, high-resolution displays are necessary for mammography. 6. Evaluate the added value of a CAD system for detection of lung nodules.
Curriculum: 5. Basic Imaging
5.1. Basic Statistics 5.1.1. Systematic and Random Error 5.1.2. Precision, Accuracy, and Reproducibility 5.1.3. Statistical Distributions: Poisson and Normal 5.1.4. Central Tendency: Mean, Median, and Mode 5.1.5. Dispersion: Standard Deviation, Variance, Range, and Percentiles 5.1.6. Correlation: Pearson Correlation 5.1.7. Confidence Intervals and Standard Error 5.1.8. Propagation of Error 5.1.9. Statistical Analysis
5.2. Imaging System Properties and Image Quality Metrics 5.2.1. Image Domains
5.2.1.1. Spatial 5.2.1.2. Frequency 5.2.1.3. Temporal
5.2.2. Contrast 5.2.3. Spatial Resolution

31
5.2.3.1. Point and Line Spread Functions 5.2.3.2. Full Width at Half Maximum (FWHM) 5.2.3.3. Modulation Transfer Function (MTF)
5.2.4. Noise 5.2.4.1. Quantum Mottle 5.2.4.2. Other Sources 5.2.4.3. Noise Frequency
5.2.5. Dynamic Range and Latitude 5.2.6. Contrast-to-noise Ratio (CNR), Signal-to-noise Ratio (SNR), Detective Quantum
Efficiency (DQE) 5.2.7. Temporal Resolution
5.3. Image Representations 5.3.1. Pixels, Bytes, Field-of-view, and the Image Matrix 5.3.2. Grayscale and Color Images 5.3.3. Spatial Frequency and Frequency Space
5.3.3.1. Aliasing: Temporal, Spatial, and Bit-depth 5.3.3.2. Nyquist Limit
5.3.4. Axial, Multi-planar, and Curvilinear Reconstructions 5.3.5. Maximum and Minimum Intensity Projections 5.3.6. Surface and Volume Rendering 5.3.7. Multi-modal Imaging 5.3.8. Time-resolved Imaging 5.3.9. Quantitative Imaging and Representation of Physical Data
5.3.9.1. Overlays, Color Maps, and Vectors 5.4. Image Processing
5.4.1. Non-uniformity and Defect Correction 5.4.2. Image Subtraction 5.4.3. Segmentation and the Region-of-interest
5.4.3.1. Automated vs. Semi-automated vs. Manual 5.4.4. Look-up Tables (LUT)
5.4.4.1. Window and Level 5.4.4.2. Nonlinear Tables and Characteristic Curves 5.4.4.3. Histogram and Equalization
5.4.4.3.1. Value of Interest 5.4.4.3.2. Anatomical
5.4.5. Frequency Processing 5.4.5.1. Edge Enhancement
5.4.5.1.1. Un-sharp Masking 5.4.5.2. Smoothing
5.4.6. Digital Magnification (Zoom) 5.4.7. Quantitative Analysis
5.4.7.1. Object Size Measurement 5.4.7.2. Shape and Texture 5.4.7.3. Motion and Flow
5.4.8. Reconstruction 5.4.8.1. Simple Back-projection 5.4.8.2. Filtered Back-projection 5.4.8.3. Iterative Reconstruction Methods
32
5.4.8.4. Sinogram 5.4.9. Computer-aided Detection and Diagnosis
5.5. Display Characteristics and Viewing Conditions 5.5.1. Technologies
5.5.1.1. Gray Scale and Color 5.5.2. Characteristics
5.5.2.1. Luminance 5.5.2.2. Pixel Pitch and Matrix Size 5.5.2.3. Quality Control
5.5.2.3.1. Grayscale Standard Display Function and Just Noticeable Differences
5.5.3. Viewing Conditions 5.5.3.1. Viewing Distance 5.5.3.2. Viewing Angle 5.5.3.3. Ambient Lighting and Illuminance
5.6. The Human Visual System, Perception, and Observer Studies 5.6.1. Visual Acuity, Contrast Sensitivity, and Conspicuity 5.6.2. Metrics of Observer Performance
5.6.2.1. Predictive Values 5.6.2.2. Sensitivity, Specificity, and Accuracy 5.6.2.3. Contrast-detail 5.6.2.4. Receiver Operating Characteristic (ROC) Analysis
5.7. Informatics 5.7.1. Basic Computer Terminology 5.7.2. Importance of Standards and Conformance 5.7.3. Integrating Healthcare Enterprise (IHE), Health Level 7 (HL7), and DICOM
5.7.3.1. Modality Work list 5.7.3.2. Components and Terminology of DICOM
5.7.4. Picture Archiving and Communication System (PACS), Radiology Information System (RIS), and Hospital Information System (HIS)
5.7.5. Electronic Medical Record (EMR) 5.7.6. Networks
5.7.6.1. Bandwidth and Communication Protocols 5.7.7. Storage
5.7.7.1. Storage Requirements and Disaster Recovery 5.7.7.2. Lossy vs. Lossless Data Compression
5.7.8. Security and Privacy 5.7.8.1. Anonymization, Encryption, and Firewalls 5.7.8.2. Research, Health Insurance Portability and Accountability Act (HIPAA),
and Institutional Review Boards (IRB)
33
Example Q&A:
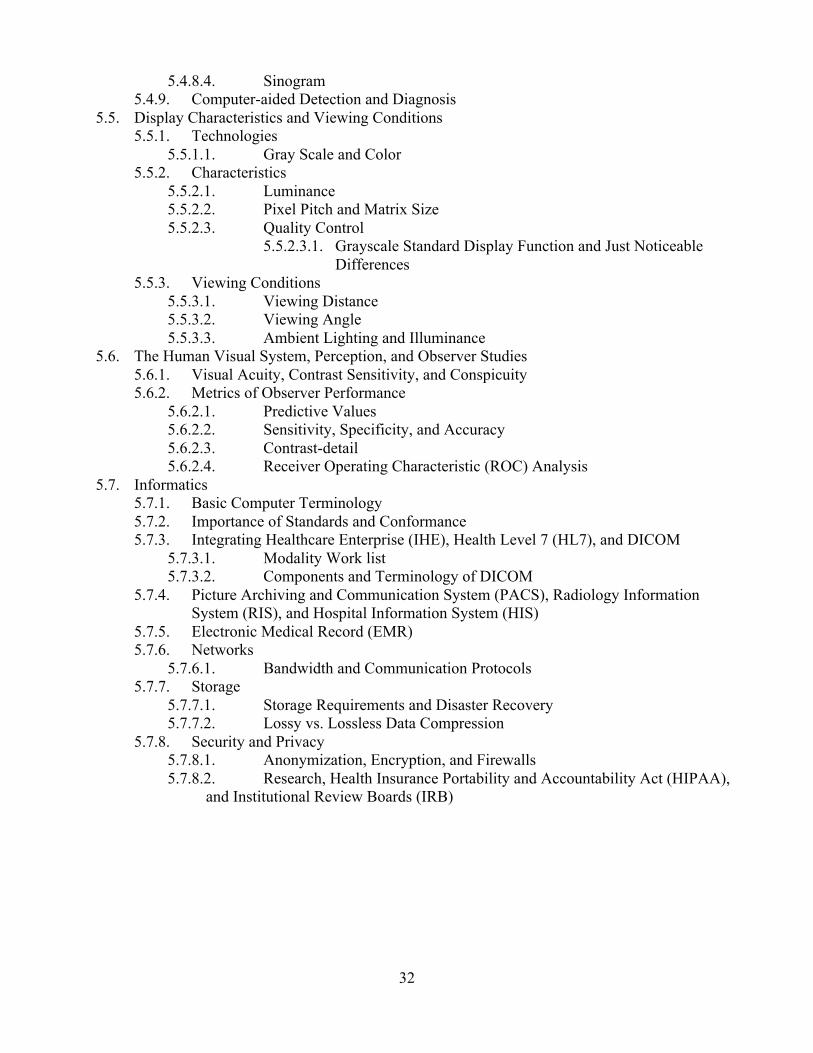
Q1. The image of the CT phantom is used to measure which image property?
A. Spatial resolution B. Noise C. Dose D. Temporal resolution Answer: A – Spatial resolution Explanation: High-contrast spatial resolution or bar phantoms are composed of alternating opaque and translucent bars at increasing spatial frequencies. When imaged, the observer records the highest-frequency set of bars that can be resolved as the limiting spatial resolution of the system. References:
1. Bushberg, J.T., et al. The Essential Physics of Medical Imaging, 3rd ed. Philadelphia: Lippincott Williams & Wilkins, 2012.
2. Huda, W. Review of Radiologic Physics, 3rd ed. Philadelphia: Lippincott Williams & Wilkins, 2010.
3. American College of Radiology. ACR Computed Tomography Quality Control Manual, 2012.

34
Q2. What metric evaluates the spatial resolution of an imaging system with change in spatial frequency? A. Modulation transfer function B. Point spread function C. Noise frequency D. Signal-to-noise ratio Answer: A – Modulation transfer function Explanation: The modulation transfer function (MTF) is a measure of spatial resolution that describes the percentage of output signal contrast from an imaging system to the signal contrast input into the system as a function of spatial frequency. Due to various sources of blur in the imaging chain, the output signal contrast is always reduced compared to the input signal contrast. As spatial frequency, which is inversely related to object size, increases, MTF decreases. The limiting resolution of an imaging system is often given as the spatial frequency at which the MTF reaches 10%. Reference:
1. Bushberg, J.T., et al. The Essential Physics of Medical Imaging, 3rd ed. Philadelphia: Lippincott Williams & Wilkins, 2012.

35
Q3. The CT image shown below is viewed at a window width of 2 HU and level of 2 HU. What single change below could be made to make the image more suitable for diagnostic viewing?
A. Increase window width B. Decrease window width C. Increase window level D. Decrease window level Answer: A – Increase window width Explanation: Soft tissue is 0–100 HU, air -1000 HU, and bone 500 HU–1500 HU. Currently the image is viewed with the level at 2 HU, which is suitable for brain viewing and a window width of 2 HU (i.e., 1 HU below and 1 HU above the 2 HU center) which is not suitable for brain viewing. With this setting, it maps black to any pixel with a value less than 1 HU and white to any pixel with a value greater than 3 HU. This is a poor window because some soft tissue will have the same pixel intensity as bone (bright white). Similarly, some soft tissue and fat tissue will have the same pixel intensity as air (black). Finally, variations within soft-tissue will be lost. Increasing the window width will improve the contrast of different soft tissues in the image. References:
1. Bushberg, J.T., et al. The Essential Physics of Medical Imaging, 3rd ed. Philadelphia: Lippincott Williams & Wilkins, 2012.
2. Hendee, W.R. and E.R. Ritenour. Medical Imaging Physics, 4th ed. New York: Wiley–Liss, 2002.
36
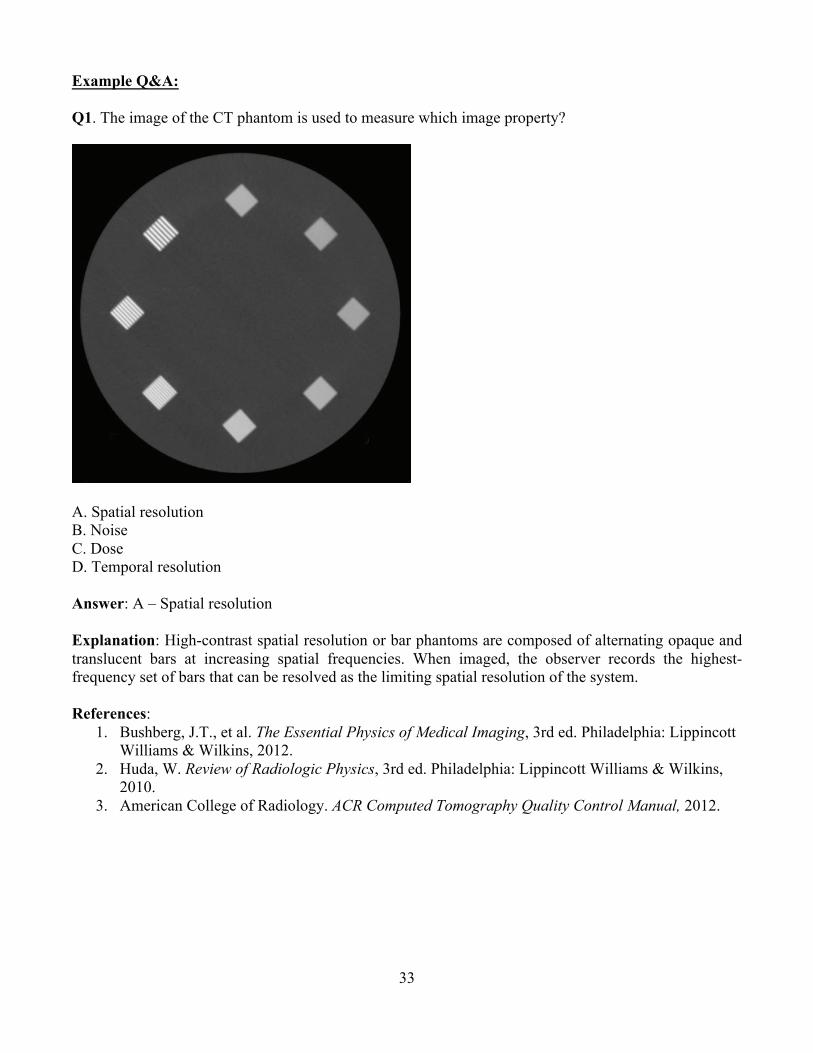
Q4. Which of the following is increased in the image on the right?
A. Noise B. Dose C. Contrast D. Blur Answer: A – Noise Explanation: The grainier appearance indicates that the noise is increased in the image on the right. References:
1. Bushberg, J.T., et al. The Essential Physics of Medical Imaging, 3rd ed. Philadelphia: Lippincott Williams & Wilkins, 2012.
2. Huda, W. Review of Radiologic Physics, 3rd ed. Philadelphia: Lippincott Williams & Wilkins, 2010.
37
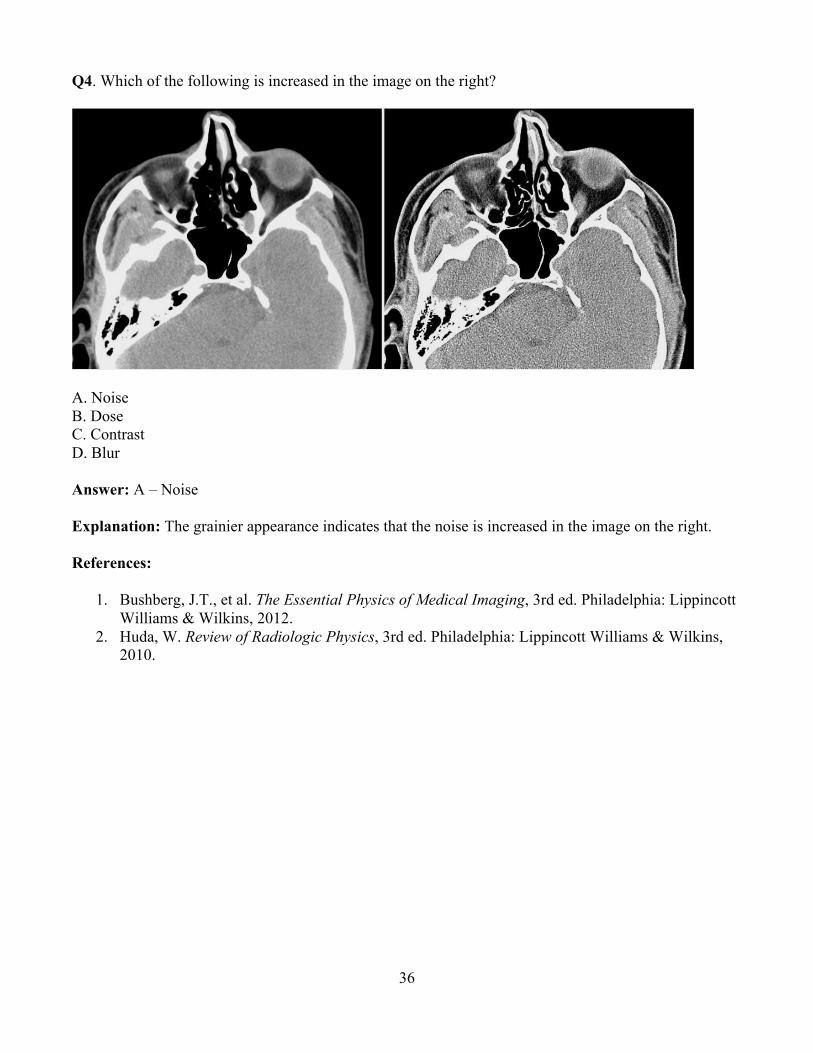
Q5. Match the outlined regions to their corresponding peaks on the histogram.
Answer: 1. A 2. C 3. B
Explanation: The histogram is the number of pixels of a given HU value vs. that value. Pixel values increase from low value on the left (black) to high value on the right (white). 1. Air and Lung (HU < -700) 2. Contrast-enhanced liver (HU ~80). 3. Visceral fat (HU ~ -100). References:
1. Bushberg, J.T., et al. The Essential Physics of Medical Imaging, 3rd ed. Philadelphia: Lippincott Williams & Wilkins, 2012.
2. Pisano, E.D., E.B. Cole, B.M. Hemminger, et al. “Image processing algorithms for digital mammography: a pictorial essay.” RadioGraphics 20:1479–1491, 2000.
38
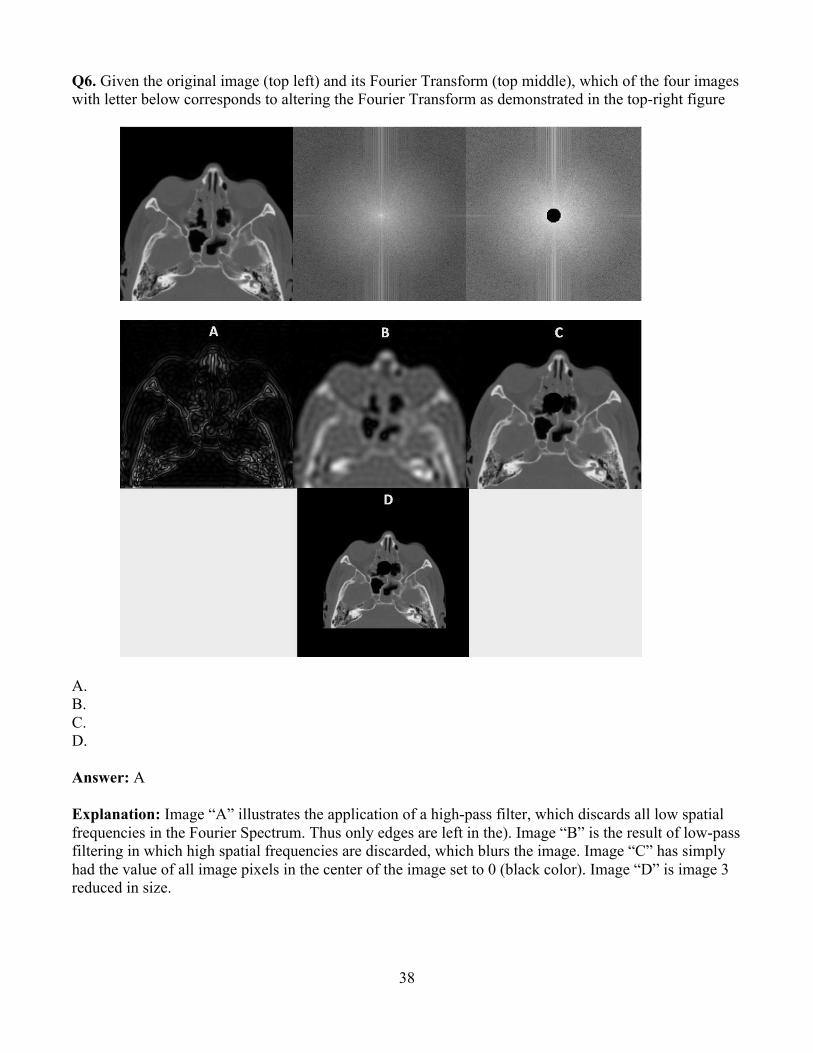
Q6. Given the original image (top left) and its Fourier Transform (top middle), which of the four images with letter below corresponds to altering the Fourier Transform as demonstrated in the top-right figure
A. B. C. D. Answer: A Explanation: Image “A” illustrates the application of a high-pass filter, which discards all low spatial frequencies in the Fourier Spectrum. Thus only edges are left in the). Image “B” is the result of low-pass filtering in which high spatial frequencies are discarded, which blurs the image. Image “C” has simply had the value of all image pixels in the center of the image set to 0 (black color). Image “D” is image 3 reduced in size.

39
References: 1. Bushberg, J.T., et al. The Essential Physics of Medical Imaging, 3rd ed. Philadelphia: Lippincott
Williams & Wilkins, 2012. 2. Hendee, W.R. and E.R. Ritenour. Medical Imaging Physics, 4th ed. New York: Wiley–Liss,
2002.
Q7. The definition of segmentation in medical image processing is: A. Reduction of pixel intensity variations by averaging adjacent pixels B. Identification of the pixels that compose a structure of interest in an image C. Eliminating low spatial frequencies from the image D. Altering the relative intensities of the image pixels Answer: B – Identification of the pixels that compose a structure of interest in an image. Explanation: A is the definition of blurring or low-pass filtering, C is high-pass filtering or edge detection, and D is windowing or altering the look-up table. Segmentation is the identification of those pixels in the image that compose a structure or structures of interest to the observer or system. References:
1. Bankman, I., ed. Handbook of Medical Image Processing and Analysis, 2nd ed. Burlington, MA: Academic Press, 2009.
2. Bick, U., M.L. Giger, R.A. Schmidt, et al. “Automated segmentation of digitized mammograms.” Acad. Radiol. 2:1-9, 1995.
3. Bushberg, J.T., et al. The Essential Physics of Medical Imaging, 3rd ed. Philadelphia: Lippincott Williams & Wilkins, 2012
40
Q8. Detection of a large, low-contrast object in a noisy image can be improved by: A. Applying edge enhancement B. Applying image smoothing C. Increasing window width D. Digitally magnifying the image Answer: B – Applying image smoothing Explanation: Edge enhancement will increase noise and will likely make detection more difficult. Applying smoothing reduces noise without reducing contrast (since the object is large) thus improving detectability. Increasing window width will decrease the apparent noise, but it also decreases display contrast, making detection more difficult. Digitally magnifying the object forces the eye to concentrate on the noise instead of the already large object, making detection more difficult. Often it is better to reduce zoom (magnification), which increases averaging of pixels in the eye and effectively smooths the image. References:
1. Bushberg, J.T., et al. The Essential Physics of Medical Imaging, 3rd ed. Philadelphia: Lippincott Williams & Wilkins, 2012.
2. Sprawls, P. “Image Characteristics and Quality” at http://www.sprawls.org/ppmi2/IMGCHAR/#Compromises. Accessed 04/27/2015.

41
Q9. The CT image below is:
A. MIP B. Surface render C. Volume render D. MPR E. Fused image Answer: A – MIP Explanation: A maximum-intensity projection looks at several CT sections and displays the brightest value for each pixel. This is why several layers of rib and entire lung vessels can be visualized on one section. A surface-rendered image shows a 3D rendering of one or several organ surfaces. A volume render shows a semitransparent 3D rendering of one or more organs. Both surface and volume renderings are usually color images to aid in visualization. Fused images are the combination of more than one image, usually from different modalities (e.g., PET and CT). A multi-planar reconstruction involves reconstructing the information in a different plane (usually coronal). References:
1. Bushberg, J.T., et al. The Essential Physics of Medical Imaging, 3rd ed. Philadelphia: Lippincott Williams & Wilkins, 2012.
2. Beigelman-Aubry, C., C. Hill, A. Guibal, et al. “Multi-detector row CT and postprocessing techniques in the assessment of diffuse lung disease.” Radiographics 25:1639–1652, 2005.
42
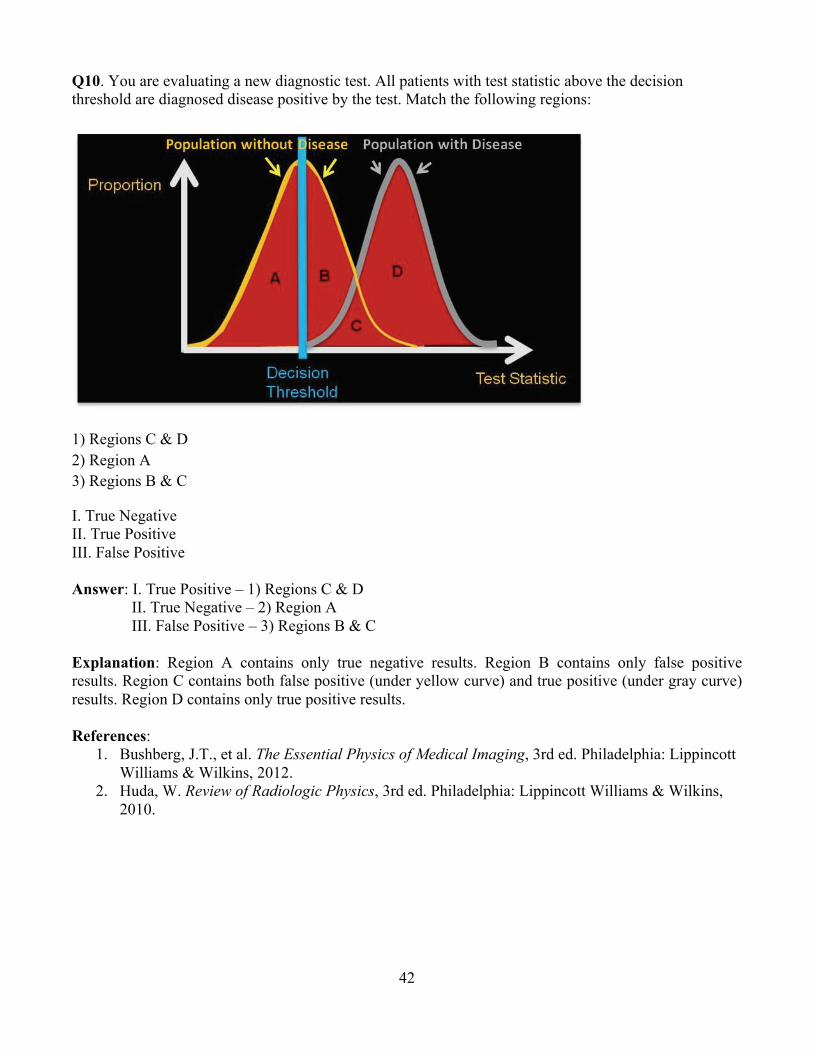
Q10. You are evaluating a new diagnostic test. All patients with test statistic above the decision threshold are diagnosed disease positive by the test. Match the following regions:
1) Regions C & D 2) Region A 3) Regions B & C
I. True Negative II. True Positive III. False Positive Answer: I. True Positive – 1) Regions C & D
II. True Negative – 2) Region A III. False Positive – 3) Regions B & C
Explanation: Region A contains only true negative results. Region B contains only false positive results. Region C contains both false positive (under yellow curve) and true positive (under gray curve) results. Region D contains only true positive results. References:
1. Bushberg, J.T., et al. The Essential Physics of Medical Imaging, 3rd ed. Philadelphia: Lippincott Williams & Wilkins, 2012.
2. Huda, W. Review of Radiologic Physics, 3rd ed. Philadelphia: Lippincott Williams & Wilkins, 2010.

43
Module 6: Biological Effects of Ionizing Radiation After completing this module, the resident should be able to apply the “Fundamental Knowledge” and “Clinical Applications” learned from the module to example tasks, such as those found in “Clinical Problem-solving.” Fundamental Knowledge:
1. Describe the cell cycle, and discuss the radiosensitivity of each phase. 2. Discuss how the dependence of cell survival is related to LET. 3. Define the principles of how radiation deposits energy that can cause biological effects. 4. Explain the difference between direct and indirect effects, how radiation affects DNA, and how
radiation damage can be repaired. 5. Compare the radiosensitivities of different organs in the body. 6. Understand the thresholds for deterministic effects, including cutaneous radiation injury,
cataracts, sterility, and whole-body acute radiation syndromes. 7. Explain the risk of carcinogenesis due to radiation. 8. Understand the latencies for different cancers. 9. Describe the effect of radiation on mutagenesis and teratogenesis. 10. List the most probable in utero radiation effects at different stages of gestation. 11. Describe the different dose response models for radiation effects. 12. Recognize the risk vs. benefit in radiation uses, and recognize the information sources that can
be used to assist in assessing these risks. Clinical Application:
1. Understand the risks to patients from high-dose fluoroscopy regarding deterministic effects, such as cutaneous radiation injury and cataractogenesis, and the importance of applying radiation protection principles in clinical protocols to avoid damage.
2. Understand the risks to the female breast (including age dependence). 3. Counsel a pregnant woman on the potential radiation risks to the fetus. 4. Explain the effects of massive whole-body irradiation and how it is managed.
Clinical Problem-solving:
1. How would you plan an interventional procedure to minimize the risk of deterministic effects? 2. How do you select the most appropriate radiological exam for a pregnant patient? 3. How would you estimate the risk vs. benefit for a new procedure?
Syllabus: 6. Radiation Biology
6.1. Principles 6.1.1. Linear Energy Transfer (LET) 6.1.2. Relative Biological Effectiveness (RBE) 6.1.3. Tissue Weighting Factors
6.2. Molecular Effects of Radiation 6.2.1. Direct Effects 6.2.2. Indirect Effects 6.2.3. Effects of Radiation on DNA
6.3. Cellular Effects of Radiation 6.3.1. Law of Bergonié and Tribondeau 6.3.2. Radiosensitivity of Different Cell Types

44
6.3.3. Cell Cycle Radiosensitivity 6.3.4. Cell Damage and Death 6.3.5. Cell Survival Curves 6.3.6. Repair
6.4. Systemic Effects of Radiation 6.4.1. Tissues 6.4.2. Organs 6.4.3. Whole Body 6.4.4. Population (Age and Gender) 6.4.5. Common Drugs (Sensitizers/Protectors)
6.5. Deterministic (Non-stochastic) Effects 6.5.1. Acute Radiation Syndromes
6.5.1.1. Sequence of Events 6.5.1.2. Hematopoietic 6.5.1.3. Gastrointestinal 6.5.1.4. Neurovascular 6.5.1.5. LD50/60 6.5.1.6. Monitoring and Treatment
6.5.2. Skin Effects 6.5.3. Cataracts 6.5.4. Sterility
6.6. Stochastic Radiation Effects 6.6.1. Radiation Epidemiological Studies 6.6.2. Carcinogenesis
6.6.2.1. Radiation-induced Cancers 6.6.2.1.1. Leukemia 6.6.2.1.2. Solid Tumors
6.6.2.2. Spontaneous Rate 6.6.2.3. Latency
6.6.3. Mutagenesis 6.6.3.1. Baseline Mutation Rate
6.6.4. Teratogenesis 6.6.4.1. Developmental Effects 6.6.4.2. Childhood Leukemia 6.6.4.3. Gestational Sensitivity
6.7. Radiation Risk 6.7.1. Risk vs Benefit in Radiology 6.7.2. Risk Models
6.7.2.1. Relative 6.7.2.2. Absolute 6.7.2.3. Radiation Risk Comparison 6.7.2.4. Communication of Risk
6.7.3. Dose-response Models 6.7.3.1. Linear, No-threshold (LNT) 6.7.3.2. Linear-quadratic 6.7.3.3. Radiation Hormesis/Adaptive Response 6.7.3.4. Bystander Effect
6.8. Information Sources

45
6.8.1.1. Biological Effects of Ionizing Radiation Reports (e.g., BEIR VII) 6.8.1.2. International Council on Radiation Protection (ICRP) 6.8.1.3. National Council on Radiation Protection (e.g., NCRP 116, 168) 6.8.1.4. United Nations Scientific Committee on the Effects of Atomic Radiation
Reports (UNSCEAR) 6.8.1.5. Nuclear Regulatory Commission (NRC) 6.8.1.6. National Cancer Institute (NCI) Common Toxicity Criteria for
Dermatology/Skin 6.8.1.7. American College of Radiology (ACR) Appropriateness Criteria for
Medical Procedures Example Q&A: Q1. Which of the following has the highest LET? A. Alpha particle B. Gamma ray C. X-ray D. Beta particle Answer: A – Alpha particle Explanation: Linear energy transfer, or LET, refers to the amount of energy deposited locally in tissue per unit path length. The energy deposition of an alpha particle is much higher per unit path length than gamma rays, x-rays, or a beta particle. References:
1. Bushberg, J.T., et al. The Essential Physics of Medical Imaging, 3rd ed. Philadelphia: Lippincott Williams & Wilkins, 2012.
2. Hall, E.J. and A.M. Giaccia. Radiobiology for the Radiologist, 7th ed. Philadelphia: Lippincott William & Wilkins, 2011.
46
Q2. In which phase of the reproductive cycle are cells most sensitive to the damaging effects of radiation? A. Pre DNA synthesis (G1 phase) B. DNA synthesis (S phase) C. Post DNA synthesis (G2 phase) D. Mitosis (M phase) Answer: D – Mitosis Explanation: Cells are generally most sensitive to radiation damage when they are in mitosis. They tend to be most resistant to radiation damage in the DNA synthesis phase (S phase). Radiation sensitivity in the gap phases (G1 and G2) tend to be intermediate between the sensitivity in mitosis and the sensitivity in the S phase. References:
1. Bushberg, J.T., et al. The Essential Physics of Medical Imaging, 3rd ed. Philadelphia: Lippincott Williams & Wilkins, 2012.
2. Hall, E.J. and A.M. Giaccia. Radiobiology for the Radiologist, 6th ed. Philadelphia: Lippincott William & Wilkins, 2006.
Q4. Most radiation-induced injury is due to damage to which type of molecules? A. Deoxyribonucleic acid B. Ribonucleic acid C. DNA polymerase D. Hemoglobin Answer: A – Deoxyribonucleic acid Explanation: There is strong evidence that the biologic effects of radiation damage—including cell killing, carcinogenesis, and mutation—result from double stranded breaks (DSB) in the double helical structure of DNA. References:
1. Bushberg, J.T., et al. The Essential Physics of Medical Imaging, 3rd ed. Philadelphia: Lippincott Williams & Wilkins, 2012.
2. Hall, E.J. and A.M. Giaccia. Radiobiology for the Radiologist, 7th ed. Philadelphia: Lippincott William & Wilkins, 2011.
47
Q5. Which of the following is a stochastic effect of radiation? A. Hair loss B. Skin erythema C. Cataract D. Carcinogenesis Answer: D – Carcinogenesis Explanation: Risk is calculated as a stochastic or statistical probability, so increased risk of cancer is a non-deterministic (stochastic) effect. References:
1. Bushberg, J.T., et al. The Essential Physics of Medical Imaging, 3rd ed. Philadelphia: Lippincott Williams & Wilkins, 2012.
2. Hall, E.J. and A.M. Giaccia. Radiobiology for the Radiologist, 7th ed. Philadelphia: Lippincott William & Wilkins, 2011.
Q6. What is the LD50/60 for humans? A. 1 gray B. 2 gray C. 3 gray D. 4 gray Answer: A – 4 gray Explanation: The LD50/60 for humans is 4 Gy. Lethal dose 50/60 is the dose of radiation to the whole body that causes 50% of irradiated subjects to die within 60 days. References:
1. Bushberg, J.T., et al. The Essential Physics of Medical Imaging, 3rd ed. Philadelphia: Lippincott Williams & Wilkins, 2012.
2. Hall, E.J. and A.M. Giaccia. Radiobiology for the Radiologist, 7th ed. Philadelphia: Lippincott William & Wilkins, 2011.

48
Q7. What is a potential risk to the fetus from a pelvic CT exam following a motor vehicle accident acquired during the 30th week of gestation? A. Fetal malformation B. Prenatal death C. Childhood cancer D. Cataracts Answer: C – Childhood cancer Explanation: At 30 weeks of pregnancy the woman is well into the third trimester, and the risk to the fetus from low levels of radiation is minimal. During this stage of gestation, the only potential risk is from a stochastic effect, which is childhood cancer. The potential for reaching dose thresholds causing deterministic effects is negligible. References:
1. Bushberg, J.T., et al. The Essential Physics of Medical Imaging, 3rd ed. Philadelphia: Lippincott Williams & Wilkins, 2012.
2. Hall, E.J. and A.M. Giaccia. Radiobiology for the Radiologist, 7th ed. Philadelphia: Lippincott William & Wilkins, 2011.
Q8. What is the most radiosensitive organ in a young adult woman 18 years of age? A. Breast B. Brain C. Gonads D. Skin Answer: A – Breast Explanation: Of the tissues listed, breast tissue is the most radiosensitive organ in female children and young adult women. The tissue weighting factor is 0.12 for breast, 0.01 for brain, 0.08 for gonads, and 0.01 for skin. The tissue weighting factors are based on population averages. Radiosensitivity is higher for younger women. References:
1. Bushberg, J.T., et al. The Essential Physics of Medical Imaging, 3rd ed. Philadelphia: Lippincott Williams & Wilkins, 2012.
2. Hall, E.J. and A.M. Giaccia. Radiobiology for the Radiologist, 7th ed. Philadelphia: Lippincott William & Wilkins, 2011.

49
Q9. What dose-response model does the BEIR VII report recommend for calculating the risk of solid tumor induction from ionizing radiation? A. Linear-quadratic B. Linear, threshold C. Linear, no threshold D. Radiation hormesis Answer: C – Linear, no threshold Explanation: The BEIR VII report uses the no threshold linear dose response model for solid tumor induction. References:
1. Bushberg, J.T., et al. The Essential Physics of Medical Imaging, 3rd ed. Philadelphia: Lippincott Williams & Wilkins, 2012.
2. National Research Council of the National Academies. Health Risks from Exposure to Low Levels of Ionizing Radiation: BEIR VII, Phase 2. Washington, D.C.: National Academies Press, 2006.
Q10. Match the radiation dose to the corresponding stage of acute radiation syndrome? A. 3 Gy 1. Hematopoietic Syndrome B. 12 Gy 2. Neurovascular Syndrome C. 50 Gy 3. Gastrointestinal Syndrome Answer: A.1, B.3, C.2 Explanation: At 3 Gy, death from hematopoietic syndrome becomes a risk (about a month). At 10 Gy, the patient still has hematopoietic syndrome, however, gastrointestinal syndrome is also present and is lethal in less time (about a week) than hematopoietic syndrome. Finally, at 50 Gy, a patient will have hematopoietic, gastrointestinal, and neurovascular (AKA, cerebrovascular (CNS)) syndromes. References:
1. Hall, E.J. and Giaccia, A.J. Radiobiology for the Radiologist, 7th ed. Philadelphia: Lippincott Williams & Wilkins, 2011.
2. Bushberg, J.T., et al. The Essential Physics of Medical Imaging, 3rd ed. Philadelphia: Lippincott Williams & Wilkins, 2012.
50
Q11. Which of the organs below is at greatest risk for deterministic damage when a Y-90 injection is accidently infiltrated? A. Skin B. Brain C. Liver D. Heart Answer: A – Skin Explanation: Y-90 is a beta emitter. The electrons have a short finite range and are unlikely to penetrate to deep organs of the body. Infiltration results in the Y-90 being in close proximity to the skin. References:
1. Bushberg, J.T., et al. The Essential Physics of Medical Imaging, 3rd ed. Philadelphia: Lippincott Williams & Wilkins, 2012.
2. Cherry, S.R., J.A. Sorenson, and M.E. Phelps. Physics in Nuclear Medicine, 4th ed. Philadelphia: Elsevier Saunders, 2012.

51
Module 7: Radiation Protection and Associated Regulations
After completing this module, the resident should be able to apply the “Fundamental Knowledge” and “Clinical Applications” learned from the module to example tasks, such as those found in “Clinical Problem-solving.” Fundamental Knowledge:
1. Identify the sources of background radiation and the contribution from each source. 2. State the maximum permissible dose equivalent limits to the public and radiation workers. 3. Identify the advisory bodies, accrediting organizations, and regulatory organizations for
radioactive materials and radiation-generating equipment, and recognize their respective roles. 4. Define the principles of time, distance, shielding, and contamination control in radiation
protection. 5. Define ALARA and its application in radiation protection. 6. Identify the methods used to monitor occupational exposure. 7. Discuss appropriate equipment used to monitor radiation areas or contamination.
Clinical Application:
1. Understand the safety considerations for patients and staff, including pregnant staff. 2. Use your knowledge of radiation effects in triaging patients during a radiological emergency. 3. Discuss the contributions of medical sources to the collective effective dose. 4. Define the responsibilities and qualifications of an authorized user (all categories). 5. Define the responsibilities and qualifications of a radiation safety officer. 6. Explain the types of occupational radiation protection equipment available. 7. Understand the importance of applying radiation protection principles in clinical protocols. 8. Understand the best use of gonad shielding and breast shields for patients. 9. Describe the requirements for wipe tests and contamination surveys. 10. Provide clinical examples that demonstrate ALARA principles. 11. Differentiate between controlled and uncontrolled areas. 12. Discuss the appropriate written instructions provided to breast-feeding patients receiving a
nuclear medicine study. Clinical Problem-solving:
1. What factors determine dose to a pregnant person seated next to a patient injected with a radionuclide for a diagnostic or therapeutic procedure?
2. Describe the steps used in applying procedure appropriateness criteria. 3. What must be done before administering a radioactive material to a patient? 4. What are the release criteria for patients receiving a radioactive material? 5. What are the criteria for a medical event? What is the required response? 6. What is the risk to the fetus of an eight-week pregnant patient undergoing a pelvis CT?
Curriculum: 7. Radiation Protection and Associated Regulations
7.1. National Council on Radiation Protection (NCRP) 160 7.1.1. Natural Background 7.1.2. Medical Dose to Patients 7.1.3. Consumer Products and Activities 7.1.4. Industrial, Security, Medical, Educational, and Research
52
7.1.5. Occupational 7.2. Medical Sources: Occupational Doses
7.2.1. Projection Radiography 7.2.2. Mammography 7.2.3. Fluoroscopy 7.2.4. Interventional Radiology and Diagnostic Angiography 7.2.5. CT 7.2.6. Sealed Source Radioactive Material 7.2.7. Unsealed Source Radioactive Material
7.3. Monitoring Patient Dose 7.3.1. Regulatory Dose Limits, Diagnostic Reference Levels (DRL), and “Trigger” Levels 7.3.2. Joint Commission Sentinel Events 7.3.3. Nuclear Regulatory Commission (NRC) Medical Event 7.3.4. Patient Dose Tracking
7.4. Dose limits 7.4.1. Occupational Dose Limits
7.4.1.1. Effective Dose 7.4.1.2. Specific Organ 7.4.1.3. Pregnant Workers 7.4.1.4. Limit to Minors
7.4.2. Members of the Public 7.4.2.1. General 7.4.2.2. Caregivers
7.5. Radiation Detectors 7.5.1. Personnel Dosimeters
7.5.1.1. Thermoluminescent Dosimeters (TLDs) 7.5.1.2. Optically Stimulated Luminescent (OSL) Dosimeters 7.5.1.3. Direct-ion Storage Dosimeters 7.5.1.4. Real-time Dosimeters 7.5.1.5. Applications: Appropriate Use and Wearing 7.5.1.6. Limitations and Challenges in Use
7.5.2. Area Monitors 7.5.2.1. Dosimeters 7.5.2.2. Ion Chambers 7.5.2.3. Geiger–Müeller (GM) 7.5.2.4. Scintillators
7.6. Principles of Radiation Protection 7.6.1. Time 7.6.2. Distance 7.6.3. Shielding (Personal) 7.6.4. Shielding (Structural)
7.6.4.1. Uncontrolled vs Controlled 7.6.5. Contamination Control 7.6.6. As Low as Reasonably Achievable (ALARA) 7.6.7. Procedure Appropriateness (Justification)
7.7. Advisory Bodies 7.7.1.1. International Commission on Radiological Protection (ICRP) 7.7.1.2. National Council on Radiation Protection and Measurements (NCRP)
53
7.7.1.3. Conference of Radiation Control Program Directors (CRCPD) 7.7.1.4. International Atomic Energy Agency (IAEA) 7.7.1.5. American College of Radiology (ACR) 7.7.1.6. National Electrical Manufacturers Association (NEMA) (Medical Imaging
and Technology Alliance or MITA) 7.7.1.7. International Commission on Radiation Units
7.8. Regulatory Agencies 7.8.1. U.S. Nuclear Regulatory Commission and Agreement States
7.8.1.1. 10 CFR Parts 19, 20, 30, 32, 35, 110 7.8.1.2. The Joint Commission (TJC) 7.8.1.3. Guidance Documents (NUREG 1556, Vols. 9 & 11) 7.8.1.4. Regulatory Guides
7.8.2. States: for Machine-produced Sources 7.8.2.1. Suggested State Regulations
7.8.3. U.S. Food and Drug Administration (FDA) 7.8.4. U.S. Office of Human Research Protections (OHRP) 7.8.5. U.S. Department of Transportation (DOT) 7.8.6. U.S. Department of Labor (OSHA) 7.8.7. International Electro-Technical Commission (IEC)
7.9. Radiation Safety with Radioactive Materials 7.9.1. Surveys
7.9.1.1. Area 7.9.1.2. Wipe Test 7.9.1.3. Spills
7.9.2. Ordering, Receiving, and Unpacking Radioactive Materials 7.9.3. Contamination Control 7.9.4. Radioactive Waste Management 7.9.5. Qualifications for Using Radioactive Materials
7.9.5.1. Diagnostic Authorized User (10 CFR 35.200 and 35.100, or Equivalent Agreement State Regulations)
7.9.5.2. Therapeutic Authorized User (10 CFR 35.300 and 35.1000, or Equivalent Agreement State Regulations)
7.9.5.3. Radiation Safety Officer 7.9.6. Medical Events
7.9.6.1. Reportable 7.9.6.2. Person or Agency to Receive Report
7.9.7. Special Considerations 7.9.7.1. Pregnant Patients 7.9.7.2. Breast-feeding Patients 7.9.7.3. Caregivers 7.9.7.4. Patient Release 7.9.7.5. Written Instructions
7.10. Estimating Effective Fetal Dose (Procedure-specific Doses) 7.10.1. Radiography 7.10.2. Mammography 7.10.3. Fluoroscopy 7.10.4. Computed Tomography 7.10.5. Nuclear Medicine

54
7.11. Radiological Emergencies 7.11.1. Triage: Evaluation, Dispensation, and Initial Treatment
Example Q&A: Q1. What is the yearly effective dose limit for radiologists under current regulations? A. 10 mSv B. 50 mSv C. 100 mSv D. 0.5 mSv E. 1.0 mSv Answer: B – 50 mSv Explanation: The annual effective dose limit for occupational workers is 50 mSv. Reference:
1. Table 23-10. Nuclear Regulatory Commission (NRC) Regulatory Requirements: Maximum Permissible Dose Equivalent Limits. In Bushberg, J.T., et al. The Essential Physics of Medical Imaging, 3rd ed. Philadelphia: Lippincott Williams & Wilkins, 2012.
2. Bushberg, J.T., et al. The Essential Physics of Medical Imaging, 3rd ed. Philadelphia: Lippincott Williams & Wilkins, 2012.
Q2. By what factor has the yearly natural background radiation received per capita changed over time (NCRP Reports 93 (1987) and 160 (2006)? A. Increased by a factor of two B. Increased by a factor of four C. Increased by a factor of six D. Stayed the same E. Decreased Answer: D – Stayed the same Explanation: Background effective dose has approximately stayed the same over time at about 3 mSv per year. References:
1. National Council on Radiation Protection & Measurements. NCRP Report 93 – Ionizing Radiation Exposure of the Population of United States. Bethesda, MD: NCRP, 1987.
2. National Council on Radiation Protection & Measurements. NCRP Report 160 – Ionizing Radiation Exposure of the Population of the United States. Bethesda, MD: NCRP, 2009.

55
Q3. What percentage of average yearly effective dose to the U.S. population is from medical sources? A. 10% B. 25% C. 50% D. 75% E. 90% Answer: C – 50% Explanation: The total contribution from medical sources is approximately 3.0 mSv per capita per year in NCRP Report 160 (2009), a six-fold increase from 0.5 mSv per year. The total from all sources is approximately 6.2 mSv. References:
1. National Council on Radiation Protection & Measurements. NCRP Report 160 – Ionizing Radiation Exposure of the Population of the United States. Bethesda, MD: NCRP, 2009.
2. Bushberg, J.T., et al. The Essential Physics of Medical Imaging, 3rd ed. Philadelphia: Lippincott Williams & Wilkins, 2012.
Q4. Which of the following organizations is an advisory body? A. U.S. Nuclear Regulatory Commission (NRC) B. Food and Drug Administration (FDA) C. National Council on Radiation Protection and Measurement (NCRP) D. U.S. Department of Transportation (DOT) Answer: C. – National Council on Radiation Protection and Measurement (NCRP) Explanation: Regulatory Agencies:
• U.S. Nuclear Regulatory Commission (NRC) regulates special nuclear material, source material, by-product material of nuclear fission, and the maximum permissible dose equivalent limits.
• 10 CFR Parts 20 (standards for protection against radiation) • 10 CFR Parts 19, 30, 32, 35, 110
• Food and Drug Administration (FDA) regulates radiopharmaceutical development, manufacturing, performance, and radiation safety requirements associated with the production of commercial x-ray equipment and mammography.
• U.S. Department of Transportation (DOT) regulates the transportation of radioactive materials used in nuclear medicine and radiation oncology.
Advisory Bodies: • National Council on Radiation Protection and Measurements (NCRP) collects, analyzes,
develops, and disseminates information in the public interest. The NCRP makes non-regulatory recommendations about radiation protection, radiation measurements, quantities, and units.

56
Reference: 1. Bushberg, J.T., et al. The Essential Physics of Medical Imaging, 3rd ed. Philadelphia: Lippincott
Williams & Wilkins, Chapter 21, 2012. Q5. As reported in NRCP Report 160, which category contributes the highest percentage to the total annual dose per capita? A. Internal B. Radon C. Cosmic D. Medical Answer: D – Medical Explanation: Medical includes the sum of the computed tomography (1.5 mSv per year), interventional fluoroscopy, conventional rad/fluoro, and nuclear medicine (0.80 mSv per year) contributions to the total annual dose per capita. Medical contributes 3.0 mSv per year, whereas radon contribution is about 2.3 mSv per year. Therefore, the medical category is the highest percentage of the total. Cosmic radiation only contributes roughly 0.34 mSv per year. References:
1. National Council on Radiation Protection & Measurements. NCRP Report 160 – Ionizing Radiation Exposure of the Population of the United States. Bethesda, MD: NCRP, 2009.
2. Bushberg, J.T., et al. The Essential Physics of Medical Imaging, 3rd ed. Philadelphia: Lippincott Williams & Wilkins, Chapter 21, 2012.
Q6. What type of radiation badge is typically worn by a radiologist? A. Block dosimeter B. Scintillation detector C. Geiger–Müller (GM) detector D. Optically stimulated luminescence (OSL) dosimeter Answer: D – Optically stimulated luminescence (OSL) dosimeter Explanation: Personnel monitors are usually film badges (an old method), OSLs (optically stimulated luminescence) or TLDs (thermoluminescent dosimeters, usually used for ring badges). The most common badge is an OSL. Reference:
1. Bushberg, J.T., et al. The Essential Physics of Medical Imaging, 3rd ed. Philadelphia: Lippincott Williams & Wilkins, Chapter 21, 2012.
57
Q7. What would be the first thing to do when a critically injured person, who may have been contaminated with radioactive material, enters the emergency department? A. Remove clothing and wrap in a sheet B. Rinse the person with lukewarm water C. Respond and treat the injury D. Do blood work to determine the possible dose
Answer: C – Respond and treat the injury Explanation: As given in the reference: “treatment of life or limb threatening medical conditions should take precedence over decontamination. Standard Precautions are generally adequate to provide protection for first responders, emergency medical personnel, and clinicians.” References:
1. Center for Disease Control. Population Monitoring in Radiation Emergencies: A Guide for State and Local Public Health Officials, 2nd ed. Department of Health and Human Services, CDC, 2014, Section 3.0, p. 3 Guiding Principles.
2. Bushberg, J.T., et al. The Essential Physics of Medical Imaging, 3rd ed. Philadelphia: Lippincott Williams & Wilkins, Chapter 21, 2012.
Q8. Which of the following constitutes a medical event? A. 5 mCi of Tc99m sulfur colloid to the wrong patient B. 0.3 mCi of I-131 NaI rather than 0.3 mCi I-123 NaI for uptake on a hyperthyroid patient C. 30 mCi rather than the standard 8 mCi of Tc99m sestamibi for a cardiac study D. 20 mCi of sestamibi (cardiac agent) rather than 20 mCi of MDP (bone agent) to the correct patient Answer: B – 0.3 mCi of I-131 NaI rather than 0.3 mCi I-123 NaI for uptake on a hyperthyroid patient Explanation: A medical event is defined as wrong patient, radionuclide, route of administration, or radiopharmaceutical, a greater than 20% difference between prescribed and administered dosage AND the effective dose equivalent exceeds 0.05 Sv or 0.5 Sv to an organ or tissue, or 0.5 Sv dose equivalent to the skin. The administration of diagnostic amounts of radioactive materials, other than I-131 sodium iodide (NaI), will not, in general, result in exceeding the dose thresholds. Reference:
1. 10 CFR Part 35.3045. Definition of medical event.

58
Q9. Which of the following studies requires more than a 24 hour interruption in breastfeeding? A. 10 mCi F-18 FDG B. 4 mCi Tc 99m pertechnetate C. 20 mCi Rb 82 chloride D. 0.5 mCi In-111 White blood cells
Answer: D – 0.5 mCi In-111 White blood cells Explanation: For all other choices, either the radioisotope physically decays away too quickly to injure a breastfeeding infant or it is expelled from the mother’s body through other routes and is not substantially expressed in the breast milk. Reference:
1. Bushberg, J.T., et al. The Essential Physics of Medical Imaging, 3rd ed. Philadelphia: Lippincott Williams & Wilkins, Chapter 21, 2012.
Q10. What would be the instrument of choice for determining the location of a Tc 99m radioactive spill? A. NaI well counter B. Portable ionization chamber C. Geiger–Muller survey meter D. Radionuclide calibrator Answer: C – Geiger–Müller survey meter Explanation: A Geiger–Müller Survey Meter is the most sensitive handheld detector that can be used. This allows it to detect minute spills with very low levels of contamination. Reference:
1. Bushberg, J.T., et al. The Essential Physics of Medical Imaging, 3rd ed. Philadelphia: Lippincott Williams & Wilkins, Chapter 21, 2012.
Q11. If a written directive is required for a procedure, the radiologist ordering the procedure must be approved for which category of use: A. 10 CFR 35.100 B. 10 CFR 35.200 C. 10 CFR 35.300 D. 10 CFR 35.500
Answer: C – 10 CFR 35.300 Explanation: 10 CFR 35.300 Subpart E: Unsealed Byproduct Material–Written Directive Required. 35.100 is uptake applications, 35.200 is imaging and localization, and 35.500 is authorization for transmission sources such as Gadolinium 153.
59
Reference: 1. 10 CFR Part 35 Subpart E.
Q12. Which of the following may be held for decay in storage until background levels are obtained? A. Cobalt 57 marker source B. Cesium 137 reference source for well counter C. Gadolinium 153 transmission rod D. Iodine 125 seed for breast localization
Answer: D – Iodine 125 seed for breast localization Explanation: I-125 has a half-life of 60 days. Decay in storage may be used for radioactive materials with a half-life of 120 days or less. All the others listed have a half-life greater than 120 days. References:
1. 10 CFR Part 35.92. 2. Bushberg, J.T., et al. The Essential Physics of Medical Imaging, 3rd ed. Philadelphia: Lippincott
Williams & Wilkins, 2012. Q13. To authorize the release of a patient treated with a therapeutic dosage of radioactive material, the dose to the most likely exposed individual must be less than what value? A. 0.1 mSv B. 0.5 mSv C. 1 mSv D. 5 mSv
Answer: D – 5 mSv Explanation: As given in 10 CFR Part 35.75, “the licensee may authorize release if...total effective dose to any other individual from exposure to the released individual is not likely to exceed 5 mSv.” If the exposure from the individual could result in total effective dose equivalent greater than 1 mSv, written instructions on minimizing exposure to others must also be given. Reference:
1. 10 CFR Part 35.75

60
Q14. A patient has an endoleak, with imaging repeated three more times in six months. The system-measured values for cumulative air kerma (Ka,r) are recorded each time and are 5 Gy, 5.5 Gy, 7 Gy, and 4.5 Gy. Which of the following agencies may require reporting of this? A. Nuclear Regulatory Commission B. Food and Drug Administration, Center for Devices and Radiological Health C. Joint Commission D. National Council on Radiation Protection and Measurements
Answer: C – Joint Commission. Explanation: This may be a reviewable sentinel event, which is defined as prolonged fluoroscopy with peak skin dose >15 Gy over some period of time which Joint Commission gives as six months to one year. Reference:
1. http://www.jointcommission.org/assets/1/18/Radiation_Overdose.pdf

61
Module 8: X-Ray Projection Imaging Concepts and Detectors After completing this module, the resident should be able to apply the “Fundamental Knowledge” and “Clinical Applications” learned from the module to example tasks, such as those found in “Clinical Problem-solving.” Fundamental Knowledge:
1. Describe the fundamental characteristics of all projection imaging systems that determine the capabilities and limitations in producing an x-ray image.
2. Review the detector types used to acquire an x-ray image. Describe how radiation is detected by each detector type and the different attributes of each detector for recording information.
Clinical Application:
1. Describe how variations in the projection imaging system affect the image. 2. Describe how each detector type influences image quality.
Clinical Problem-solving:
1. How does the difference in detector performance affect patient dose? 2. When is the use of a grid not appropriate? 3. What are some of the common artifacts seen in a portable chest x-ray image? How can they be
minimized? 4. How does imaging chain geometry affect patient dose? 5. What are the properties (size, detection efficiency, etc.) of a detector system that determines its
suitability for pediatric procedures? Curriculum: 8. X-ray Projection Imaging Concepts and Detectors
8.1. Geometry 8.1.1. Source-to-image Receptor Distance (SID), Source-to-object Distance (SOD), and
Object-to-image Receptor Distance (OID) 8.1.1.1. Magnification 8.1.1.2. Inverse-square Law 8.1.1.3. Radiographic Contrast 8.1.1.4. Subject (differential absorption) 8.1.1.5. Image 8.1.1.6. Detector
8.1.2. Scatter and Scatter Reduction 8.1.2.1. Scatter-to-primary Ratio 8.1.2.2. Collimation 8.1.2.3. Anti-scatter Grids 8.1.2.4. Bucky Factor 8.1.2.5. Air Gap
8.1.3. Artifacts and Image Degradation 8.1.3.1. Geometrical Distortion 8.1.3.2. Focal Spot: Blur and Penumbra 8.1.3.3. Grid: Artifacts and Cutoff 8.1.3.4. Motion 8.1.3.5. Anatomical Superposition
8.2. Radiographic Detectors

62
8.2.1. Detector Characteristics 8.2.1.1. Phosphors 8.2.1.2. Latent Image Formation 8.2.1.3. Speed 8.2.1.4. H & D Characteristic Curve (Latitude and Dynamic Range) 8.2.1.5. Exposure Index
8.2.2. Computed Radiography (CR, Photostimulable Phosphor) 8.2.2.1. Storage Phosphors 8.2.2.2. Latent Image Formation 8.2.2.3. Image Digitization 8.2.2.4. Pre-processing (e.g., Gain and Bad Pixel Correction) 8.2.2.5. Image Quality 8.2.2.6. Artifacts
8.2.3. Direct and Indirect Digital Radiography (DR) 8.2.3.1. Detector Technology 8.2.3.2. Image Formation and Readout 8.2.3.3. Pre-processing (e.g., Gain and Bad Pixel Correction) 8.2.3.4. Image Quality 8.2.3.5. Artifacts
8.2.4. Charged-coupled Devices (CCD)
63
Example Q&A: Q1. Which of the following exams would most likely be performed without the use of a grid? A. PA chest B. Lateral lumbar spine C. AP wrist D. AP abdomen Answer: C – AP wrist Explanation: The purpose of the grid is to remove scatter radiation generated in the patient prior to absorption in the image receptor. The amount of scatter generated in the patient increases with increased kVp, field size, and patient thickness. Of the exams listed, the AP wrist would involve the lowest kVp, smallest field size, and thinnest anatomy, therefore generating the least amount of scatter radiation. Extremity radiographs are often taken on the table top with the extremity placed directly on the detector. References:
1. Bushberg, J.T., et al. The Essential Physics of Medical Imaging, 3rd ed. Philadelphia: Lippincott Williams & Wilkins, 2012.
2. Bushong, S.C. Radiologic Science for Technologists, 9th ed. St. Louis: Mosby Elsevier, 2008. Q2. Which of the following will increase subject contrast? A. Decreasing tube voltage B. Increasing tube current C. Increasing patient size D. Decreasing focal spot size Answer: A – Decreasing tube voltage Explanation: Decreasing tube voltage will increase photoelectric absorption, which will increase subject contrast. The other factors will not increase subject contrast. References:
1. Bushberg, J.T., et al. The Essential Physics of Medical Imaging, 3rd ed. Philadelphia: Lippincott Williams & Wilkins, 2012.
2. Bushong, S.C. Radiologic Science for Technologists, 9th ed. St. Louis: Mosby Elsevier, 2008.

64
Q3. How would the effect of geometric blur on a radiographic image be minimized?
A. Use highest mA and shortest exposure time available B. Use small focal spot C. Use detector with the smallest available pixel size D. Utilize immobilization devices Answer: B – Use small focal spot Explanation: Geometric blur, also called focal spot blur, increases with focal spot size and magnification. References:
1. Bushberg, J.T., et al. The Essential Physics of Medical Imaging, 3rd ed. Philadelphia: Lippincott Williams & Wilkins, 2012.
2. Bushong, S.C. Radiologic Science for Technologists, 9th ed. St. Louis: Mosby Elsevier, 2008. Q4. What is the actual size of an object located half way between the x-ray tube and the image receptor if the object measures 10 mm on the image? A. 1 mm B. 5 mm C. 15 mm D. 20 mm Answer: B – 5 mm Explanation: The factor by which an object is magnified in a radiographic image is determined by the ratio of the source-to-image distance (SID) to the source-to-object distance (SOD). If the SOD is half of the SID, then the magnification factor would be 2 and the object would appear twice as large in the image compared to its actual size. References:
1. Bushberg, J.T., et al. The Essential Physics of Medical Imaging, 3rd ed. Philadelphia: Lippincott Williams & Wilkins, 2012.
2. Bushong, S.C. Radiologic Science for Technologists, 9th ed. St. Louis: Mosby Elsevier, 2008.
65
Q5. What is a definition of a Bucky factor? A. Percent contrast improvement with a grid B. Relative increase in intensity when a grid is used C. Ratio of grid height to width D. Number of grid lines per centimeter Answer: B – Relative increase in intensity when a grid is used Explanation: The Bucky factor is the relative increase in x-ray intensity (or mAs) when a grid is used vs. when a grid is not used. References:
1. Bushberg, J.T., et al. The Essential Physics of Medical Imaging, 2nd ed. Philadelphia: Lippincott Williams & Wilkins, 2002.
2. Bushong, S.C. Radiologic Science for Technologists, 9th ed. St. Louis: Mosby Elsevier, 2008. Q6. If the distance from the x-ray tube to the image receptor is changed from 72” to 40”, which of the following will occur? A. Radiation dose to the patient will decrease B. Image spatial resolution will increase C. Image noise will increase D. The object of interest will appear larger on the image Answer: D – The object of interest will appear larger on the image. Explanation: The factor by which an object is magnified in a radiographic image is determined by the ratio of the source-to-image distance (SID) to the source-to-object distance (SOD). Decreasing the SID also decreases the SOD, with a resulting increase in the ratio of SID over SOD, thereby increasing magnification. References:
1. Bushberg, J.T., et al. The Essential Physics of Medical Imaging, 3rd ed. Philadelphia: Lippincott Williams & Wilkins, 2012.
2. Bushong, S.C. Radiologic Science for Technologists, 9th ed. St. Louis: Mosby Elsevier, 2008.
66
Q7. Which of the following will improve low-contrast resolution in a radiographic image? A. Change from a 10:1 to an 8:1 grid B. Move the patient closer to the image receptor C. Reduce tube current D. Use a smaller field of view Answer: D – Use a smaller field of view Explanation: Using a smaller field of view results in less scatter production in the patient and less scatter reaching the image receptor. As scatter in the image decreases, low-contrast resolution increases. References:
1. Bushberg, J.T., et al. The Essential Physics of Medical Imaging, 3rd ed. Philadelphia: Lippincott Williams & Wilkins, 2012.
2. Bushong, S.C. Radiologic Science for Technologists, 9th ed. St. Louis: Mosby Elsevier, 2008. Q8. Which of the following uses a storage phosphor to capture the x-ray signal? A. Indirect DR B. Direct DR C. Computed radiography D. Film-screen radiography Answer: C – Computed radiography Explanation: The phosphor used in CR is barium fluorohalide. Electrons in the phosphor layer are excited by the absorption of x-rays into traps where they remain until released by the application of laser energy, which occurs in the CR reader. References:
1. Bushberg, J.T., et al. The Essential Physics of Medical Imaging, 3rd ed. Philadelphia: Lippincott Williams & Wilkins, 2012.
2. Bushong, S.C. Radiologic Science for Technologists, 9th ed. St. Louis: Mosby Elsevier, 2008.
67
Q9. Which of the following affects spatial resolution in direct radiography flat panel detector systems? A. Phosphor thickness B. Detector element size C. Laser spot size D. Field of view Answer: B – Detector element size Explanation: The signal recorded in each detector element (dexel) is converted to a single shade of gray pixel value in the image. Smaller dexels result in better spatial resolution. References:
1. Bushberg, J.T., et al. The Essential Physics of Medical Imaging, 3rd ed. Philadelphia: Lippincott Williams & Wilkins, 2012.
2. Dance D.R. Diagnostic Radiology Physics. IAEA, 2014. Q10. What is the structured phosphor used to convert x-rays to visible light in indirect digital radiography flat panel detector systems? A. Gadolinium oxysulfide B. Sodium iodide C. Barium fluorohalide D. Cesium iodide Answer: D – Cesium iodide Explanation: Cesium iodide is grown in columnar structures that act as light pipes and help to reduce the lateral spread of light, improving spatial resolution compared to gadolinium oxysulfide, which is an unstructured phosphor. Sodium iodide is the phosphor material used in nuclear medicine detectors. Barium fluorohalide is a storage phosphor that is used in computed radiography detectors. References:
1. Bushberg, J.T., et al. The Essential Physics of Medical Imaging, 3rd ed. Philadelphia: Lippincott Williams & Wilkins, 2012.
2. Dance D.R. Diagnostic Radiology Physics. IAEA, 2014.

68
Module 9: General Radiography After completing this module, the resident should be able to apply the “Fundamental Knowledge” and “Clinical Applications” learned from the module to example tasks, such as those found in “Clinical Problem-solving.” Fundamental Knowledge:
1. Describe the components of a radiographic imaging system. 2. List and describe the factors affecting radiographic image quality. 3. Explain how the geometric features of a general radiographic system affect the resulting image. 4. Describe the different types of acquisition systems used in general radiography. 5. Distinguish among the basic imaging requirements for specific body parts or views acquired in
general radiography. 6. Define entrance skin exposure and how it relates to patient dose.
Clinical Application:
1. Develop appropriate technique factors used in common radiographic procedures. 2. Analyze the radiation dose from a medical procedure, and communicate the benefits and risks to
the referring physician. Clinical Problem-solving:
1. Why is image quality frequently compromised in mobile radiography? 2. What are the geometric requirements for image acquisition that affect image quality? 3. What system components affect patient radiation dose? How do they reduce patient dose? 4. How can collimation impact image processing? 5. Which factors determine the appropriate grid to use for different radiographic exams?
Curriculum: 9. General Radiography
9.1. System Components 9.1.1. Tube 9.1.2. Filtration 9.1.3. Collimator 9.1.4. Automatic Exposure Control (AEC) 9.1.5. Grid and Bucky Factor 9.1.6. Compensation Filters
9.2. Geometrical Requirements 9.2.1. Focal Spot Size 9.2.2. Collimation 9.2.3. Heel Effect
9.3. Acquisition Systems 9.3.1. Dual-energy 9.3.2. Tomosynthesis
9.4. Image Characteristics 9.4.1. Spatial Resolution 9.4.2. Contrast Sensitivity 9.4.3. Noise 9.4.4. Temporal Resolution 9.4.5. Artifacts

69
9.4.6. Image Processing 9.4.7. Computer-aided Detection (CAD)
9.5. Applications 9.5.1. Head/Neck 9.5.2. Chest 9.5.3. Abdomen/Pelvis 9.5.4. Spine 9.5.5. Extremities 9.5.6. Pediatrics and Neonatal 9.5.7. Portable/Mobile
9.6. Dosimetry 9.6.1. Entrance Skin Air Kerma 9.6.2. Effective Dose 9.6.3. Organ Dose 9.6.4. Reference Levels
9.7. Factors Affecting Patient Dose 9.7.1. Technique Optimization (e.g., kVp, mA, Time, etc.) 9.7.2. Imaging Geometry 9.7.3. Beam Filtration 9.7.4. Grid 9.7.5. Field Size 9.7.6. Receptor Speed
9.8. Quality Assurance and Quality Control
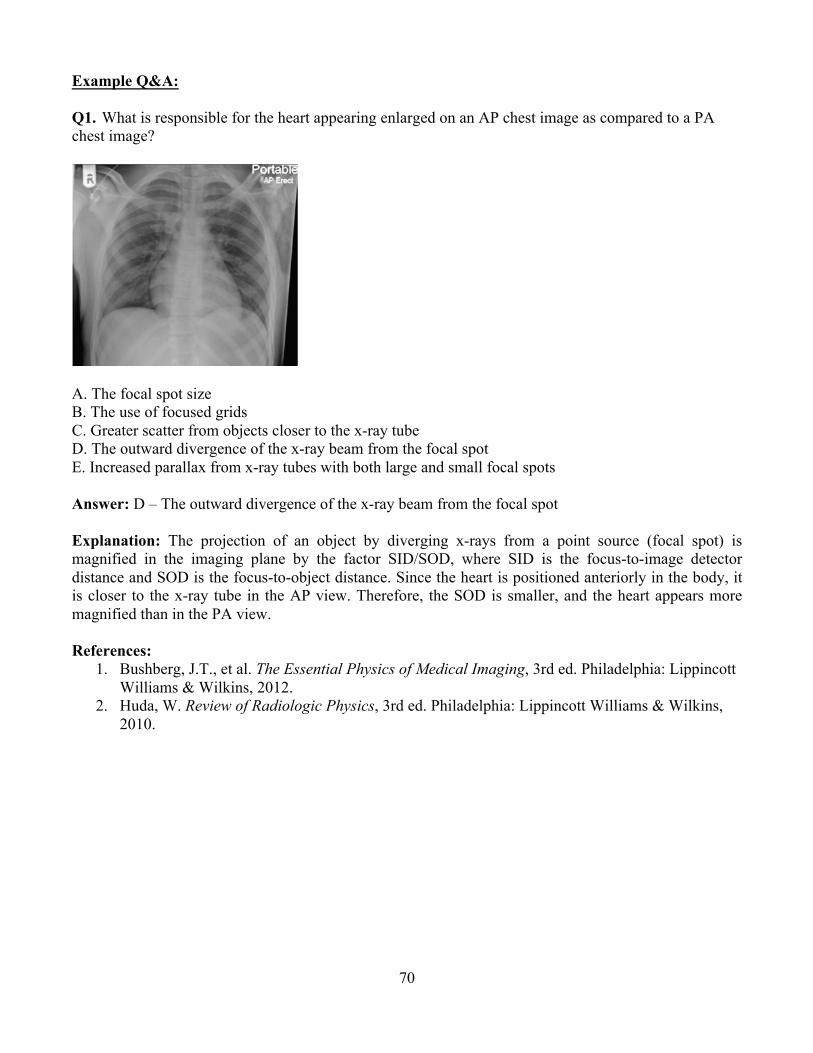
70
Example Q&A:
Q1. What is responsible for the heart appearing enlarged on an AP chest image as compared to a PA chest image?
A. The focal spot size B. The use of focused grids C. Greater scatter from objects closer to the x-ray tube D. The outward divergence of the x-ray beam from the focal spot E. Increased parallax from x-ray tubes with both large and small focal spots
Answer: D – The outward divergence of the x-ray beam from the focal spot Explanation: The projection of an object by diverging x-rays from a point source (focal spot) is magnified in the imaging plane by the factor SID/SOD, where SID is the focus-to-image detector distance and SOD is the focus-to-object distance. Since the heart is positioned anteriorly in the body, it is closer to the x-ray tube in the AP view. Therefore, the SOD is smaller, and the heart appears more magnified than in the PA view. References:
1. Bushberg, J.T., et al. The Essential Physics of Medical Imaging, 3rd ed. Philadelphia: Lippincott Williams & Wilkins, 2012.
2. Huda, W. Review of Radiologic Physics, 3rd ed. Philadelphia: Lippincott Williams & Wilkins, 2010.

71
Q2. What is the reason for excluding high-ratio grid use for mobile radiography? A. High-ratio grids have poorer scatter rejection than low-ratio grids B. High-ratio grids are more difficult to align with the focal spot C. High-ratio grids are more easily mis-positioned upside down as compared with low-ratio grids E. High-ratio grids cannot be manufactured with short enough focal lengths Answer: B – High-ratio grids are more difficult to align with the focal spot. Explanation: High-ratio grids are more difficult to center under the x-ray tube focal spot than low-ratio grids due to the lack of an accurate alignment system on most portable x-ray units. This leads to mis-centering and, therefore, grid cutoff, which degrades image quality by lowering the SNR. This is why low-ratio grids are generally used for portable work. References:
1. Bushberg, J.T., et al. The Essential Physics of Medical Imaging, 3rd ed. Philadelphia: Lippincott Williams & Wilkins, 2012.
2. Huda, W. Review of Radiologic Physics, 3rd ed. Philadelphia: Lippincott Williams & Wilkins, 2010.
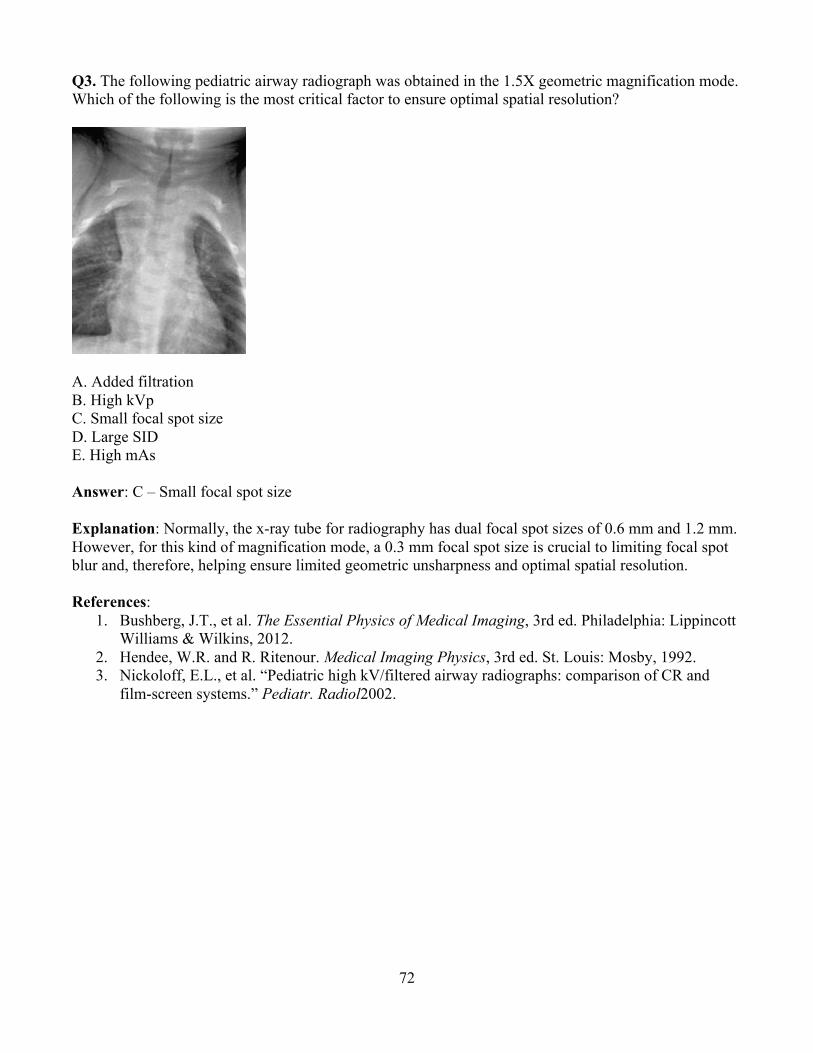
72
Q3. The following pediatric airway radiograph was obtained in the 1.5X geometric magnification mode. Which of the following is the most critical factor to ensure optimal spatial resolution?
A. Added filtration B. High kVp C. Small focal spot size D. Large SID E. High mAs Answer: C – Small focal spot size Explanation: Normally, the x-ray tube for radiography has dual focal spot sizes of 0.6 mm and 1.2 mm. However, for this kind of magnification mode, a 0.3 mm focal spot size is crucial to limiting focal spot blur and, therefore, helping ensure limited geometric unsharpness and optimal spatial resolution. References:
1. Bushberg, J.T., et al. The Essential Physics of Medical Imaging, 3rd ed. Philadelphia: Lippincott Williams & Wilkins, 2012.
2. Hendee, W.R. and R. Ritenour. Medical Imaging Physics, 3rd ed. St. Louis: Mosby, 1992. 3. Nickoloff, E.L., et al. “Pediatric high kV/filtered airway radiographs: comparison of CR and
film-screen systems.” Pediatr. Radiol2002.

73
Q4. Identify the artifact in the digital radiography image below.
A. A corrupted point in k-space B. Grid line interference C. Grid inserted upside down D. Patient motion Answer: B – Grid line interference Explanation: When the number of grid lines per cm (grid frequency) is comparable to the number of detector pixels per cm, an interference (or moiré) pattern such as this can be generated. This is most likely to occur for low-frequency stationary grids due to aliasing when the grid frequency just exceeds the pixel sampling rate. Reference:
1. Bushberg, J.T., et al. The Essential Physics of Medical Imaging, 3rd ed. Philadelphia: Lippincott Williams & Wilkins, 2012.
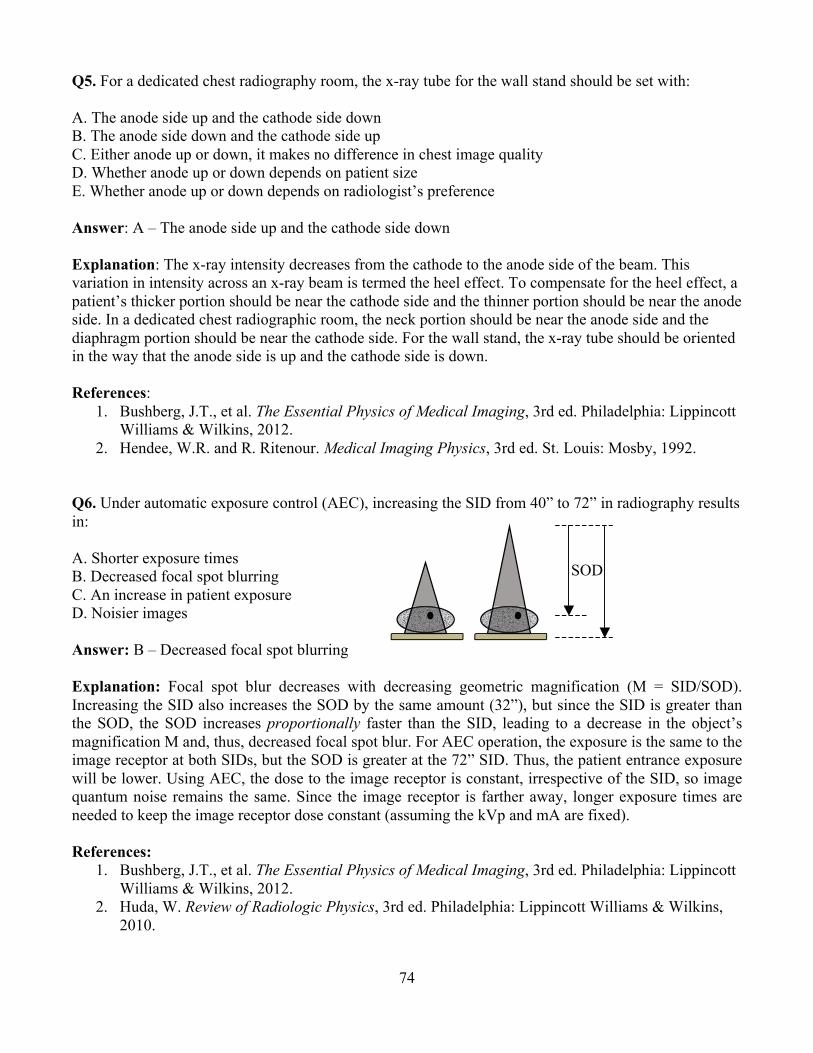
74
Q5. For a dedicated chest radiography room, the x-ray tube for the wall stand should be set with:
A. The anode side up and the cathode side down B. The anode side down and the cathode side up C. Either anode up or down, it makes no difference in chest image quality D. Whether anode up or down depends on patient size E. Whether anode up or down depends on radiologist’s preference Answer: A – The anode side up and the cathode side down
Explanation: The x-ray intensity decreases from the cathode to the anode side of the beam. This variation in intensity across an x-ray beam is termed the heel effect. To compensate for the heel effect, a patient’s thicker portion should be near the cathode side and the thinner portion should be near the anode side. In a dedicated chest radiographic room, the neck portion should be near the anode side and the diaphragm portion should be near the cathode side. For the wall stand, the x-ray tube should be oriented in the way that the anode side is up and the cathode side is down. References:
1. Bushberg, J.T., et al. The Essential Physics of Medical Imaging, 3rd ed. Philadelphia: Lippincott Williams & Wilkins, 2012.
2. Hendee, W.R. and R. Ritenour. Medical Imaging Physics, 3rd ed. St. Louis: Mosby, 1992. Q6. Under automatic exposure control (AEC), increasing the SID from 40” to 72” in radiography results in: A. Shorter exposure times B. Decreased focal spot blurring C. An increase in patient exposure D. Noisier images Answer: B – Decreased focal spot blurring Explanation: Focal spot blur decreases with decreasing geometric magnification (M = SID/SOD). Increasing the SID also increases the SOD by the same amount (32”), but since the SID is greater than the SOD, the SOD increases proportionally faster than the SID, leading to a decrease in the object’s magnification M and, thus, decreased focal spot blur. For AEC operation, the exposure is the same to the image receptor at both SIDs, but the SOD is greater at the 72” SID. Thus, the patient entrance exposure will be lower. Using AEC, the dose to the image receptor is constant, irrespective of the SID, so image quantum noise remains the same. Since the image receptor is farther away, longer exposure times are needed to keep the image receptor dose constant (assuming the kVp and mA are fixed). References:
1. Bushberg, J.T., et al. The Essential Physics of Medical Imaging, 3rd ed. Philadelphia: Lippincott Williams & Wilkins, 2012.
2. Huda, W. Review of Radiologic Physics, 3rd ed. Philadelphia: Lippincott Williams & Wilkins, 2010.
SOD

75
Q7. Match the x-ray procedure to the effective dose: 1. Abdomen A. 0.001 mSv
2. Extremities B. 0.7 mSv 3. Two view mammogram (both breasts) C. 0.02 mSv 4. Posteroanterior chest D. 0.01 mSv 5. Shoulder E. 0.4 mSv
Answer: 1.B, 2.A, 3.E, 4.C, and 5.D Explanation: Approximate average effective doses: extremities = 0.001 mSv, shoulder = 0.01 mSv, PA chest = 0.02 mSv, two view mammogram exam = 0.4 mSv, and abdomen = 0.7 mSv. Reference:
1. Bushberg, J.T., et al. The Essential Physics of Medical Imaging, 3rd ed. Philadelphia: Lippincott Williams & Wilkins, 2012.
Q8. The resolution of an indirect conversion digital radiography system is: A. Better than a direct conversion digital radiography system B. Equivalent to a direct conversion digital radiography system C. Worse than a direct conversion digital radiography system Answer: C – Worse than a direct conversion digital radiography system Explanation: The spread of light in the scintillator of an indirect conversion digital radiography system adds blurring to the image, which reduces resolution. Reference:
1. Bushberg, J.T., et al. The Essential Physics of Medical Imaging, 3rd ed. Philadelphia: Lippincott Williams & Wilkins, 2012.
76
Q9. In taking radiographs of a pregnant patient, what is the single most important thing that you can do to ensure the lowest dose to the fetus while acquiring the most appropriate image? A. Use a high kVp since this will result in a lower mAs and decreased dose using AEC B. Wrap the patient’s abdomen in a lead apron to cover the fetus C. Collimate the x-ray field to cover the smallest area of anatomy required to be imaged D. Have the patient lie prone, as opposed to supine, on the examination table E. Remove the anti-scatter grid Answer: C – Collimate the x-ray field to cover the smallest area of anatomy required to be imaged. Explanation: High kVp leads to lower doses, but to decreased image contrast as well. Wrapping the patient in lead does not reduce the greatest source of radiation to the fetus, which is internal scatter from the mother. Although the lead does protect the fetus from x-ray tube leakage and scatter off the collimators, these are negligible compared with the internal scatter from nearby irradiated tissue. Scatter is directly proportional to the volume of tissue being irradiated. Collimating down to only three quarters of each of the original field dimensions results in a 44% reduction in irradiated area, and thus a 44% reduction in scatter. Collimate down to half the field dimensions and the scatter reduction is 75%. Reduction of scatter also improves the image contrast. Prone or supine makes little difference with regard to internal scatter to the fetus. Removing the grid will reduce the exposure to the mother, and hence the amount of internal scatter to the fetus, by factors of 1.5 to 2.5, depending upon the grid’s Bucky factor. However, without the grid to help block much of the scatter to the image receptor, the image will be dominated by scatter and be considered unacceptable. References:
1. Bushberg, J.T., et al. The Essential Physics of Medical Imaging, 3rd ed. Philadelphia: Lippincott Williams & Wilkins, 2012.
2. Wagner, L.K., R.G. Lester, and L.R. Saldana. Exposure of the Pregnant Patient to Diagnostic Radiations: A Guide to Medical Management, 2nd ed. Madison, WI: Medical Physics Publishing, 1997.
77
Q10. For a KUB on an average-sized patient, what would be a reasonable technique to acquire the radiograph? A. 75 kV, 20 mAs, 40” SID B. 120 kV, 12 mAs, 40” SID C. 50 kV, 50 mAs, 72” SID D. 75 kV, 2.5 mAs, 72” SID Answer: A – 75 kV, 20 mAs, 40” SID Explanation: We know that patient dose decreases with increasing kV, but so does subject contrast. Further, very low mAs values lead to noisy images. Knowing this, we can eliminate answer B because 120 kV gives too low contrast. We can eliminate answer C because of the large SID and the higher dose from the 50 kV beam (but contrast would be high). Answer D can be eliminated because of the low mAs and large SID. Answer A is a reasonable compromise at 20 mAs, a typical SID, and a moderate kV. Reference:
1. Bushberg, J.T., et al. The Essential Physics of Medical Imaging, 3rd ed. Philadelphia: Lippincott Williams & Wilkins, 2012.

78
Module 10: Mammography
After completing this module, the resident should be able to apply the “Fundamental Knowledge” and Clinical Applications” learned from the module to example tasks, such as those found in “Clinical Problem-solving.” Fundamental Knowledge:
1. Describe unique features of mammography tubes and how they affect the x-ray spectrum produced.
2. Describe automatic exposure control (AEC) performance. 3. Explain the benefits of breast compression. 4. Review magnification techniques. 5. Describe the characteristics of the different detectors used in digital mammography. 6. Discuss breast radiation dosimetry. 7. Discuss the requirement for facility and physician certification under Mammography Quality
Standards Act (MQSA), accreditation, and their effects on image quality and dose.
Clinical Application: 1. Describe appropriate uses of the different targets and filters available in mammography systems. 2. Associate image quality changes with radiation dose changes (with and without magnification). 3. Be familiar with the QA/QC requirements of MQSA for digital mammography 4. Understand the mechanism of breast tomosynthesis. 5. Discuss risk-benefits analysis of mammography with referring physicians and patients.
Clinical Problem-solving: 1. What factors influence image contrast and detail as they relate to the visualization of lesions in
mammography? 2. What are possible image artifacts in mammography? How can they be corrected? 3. What are the positive and negative attributes of using CAD in mammography? 4. What are the advantages and disadvantages of breast tomosynthesis?
Curriculum: 10. Mammography
10.1. Clinical Importance 10.1.1. Benefits and Risks 10.1.2. Purpose of Screening Mammography 10.1.3. Diagnosis and Detection Requirements 10.1.4. Breast Composition
10.1.4.1. Attenuation Characteristics of Breast Tissue and Lesions 10.1.4.2. Compression
10.2. System Components 10.2.1. Target Material 10.2.2. Filter Material 10.2.3. Automatic Exposure Control (AEC) 10.2.4. Compression Paddles 10.2.5. Grid 10.2.6. Magnification Stand

79
10.3. Breast Anatomy 10.4. Geometric Requirements
10.4.1. Source-to-image Receptor Distance (SID), Source-to-object Distance (SOD), and Object-to-Image Receptor Distance (OID)
10.4.2. Focal Spot Size 10.4.3. Collimation 10.4.4. Chest Wall Coverage 10.4.5. Heel Effect 10.4.6. Grid vs. Air Gap 10.4.7. Magnification 10.4.8. Tomosynthesis
10.5. Acquisition Systems 10.5.1. Full-field Digital Mammography
10.5.1.1. Computed Radiography 10.5.1.2. Fixed Detector
10.5.1.2.1. Direct Conversion 10.5.1.2.2. Indirect Conversion
10.5.2. Stereotactic Biopsy Systems 10.5.2.1. Prone vs. Upright
10.5.3. Tomosynthesis 10.6. Dose
10.6.1. Entrance Air KERMA (Skin Exposure) 10.6.2. Average Glandular Dose 10.6.3. Half-value Layer (HVL) 10.6.4. Technique Optimization
10.6.4.1. AEC, kV, and Target/Filter 10.6.5. Factors Affecting Patient Dose 10.6.6. Full-field Digital Mammography versus Tomosynthesis Dose
10.7. Digital Image Processing 10.7.1. Raw, For-processing, and For-display Images 10.7.2. Computer-aided Detection (CAD)
10.8. Workstations, PACS, and Display 10.9. Artifacts 10.10. Mammography Quality Standards Act (MQSA) Regulations and Accreditation Bodies
10.10.1. Responsibilities of Radiologist, Technologist, and Physicist 10.10.2. Dose Limits 10.10.3. Image Quality and Accreditation Phantom 10.10.4. QC Testing in Digital Mammography 10.10.5. Workstation QC

80
Example Q&A: Q1. What could be the cause of the degraded image quality seen in the mammogram on the left compared to the image on the right?
A. Low kV B. Motion C. Contrast D. Noise Answer: B – Motion Explanation: Longer exposure times can lead to detection of patient motion in digital mammography. To verify that an artifact is caused by motion, the technologist should review the exposure parameters and technical factors to rule out other causes, such as poor technique or long exposure. References:
1. Ayyala, R.S., M. Chorlton, R.H. Behrman, P.J. Kornguth, and P.J. Slanetz. “Digital mammographic artifacts on full-field systems: what are they and how do I fix them?” Radiographics 28:1999–2008, 2008.
2. Bushberg, J.T., et al. The Essential Physics of Medical Imaging, 3rd ed. Philadelphia: Lippincott Williams & Wilkins, 2012.

81
Q2. An increase in what factor would reduce the probability of motion? A. Focal spot size B. kV C. Exposure time D. mAs Answer: B – kV Explanation: To avoid a motion unsharpness artifact and ensure optimal image quality, it is important to instruct the patient to remain still during imaging. Other ways to decrease motion unsharpness include increasing compression, increasing the kilovolt, or using a rhodium target rather than a molybdenum target. However, the latter two solutions can result in lower image contrast, although this may not be clinically significant in digital mammography due to its higher image contrast compared with screen-film mammography. References:
1. Ayyala, R.S., M. Chorlton, R.H. Behrman, P.J. Kornguth, and P.J. Slanetz. “Digital mammographic artifacts on full-field systems: what are they and how do I fix them?” Radiographics 28:1999–2008, 2008.
2. Bushberg, J.T., et al. The Essential Physics of Medical Imaging, 3rd ed. Philadelphia: Lippincott Williams & Wilkins, 2012.
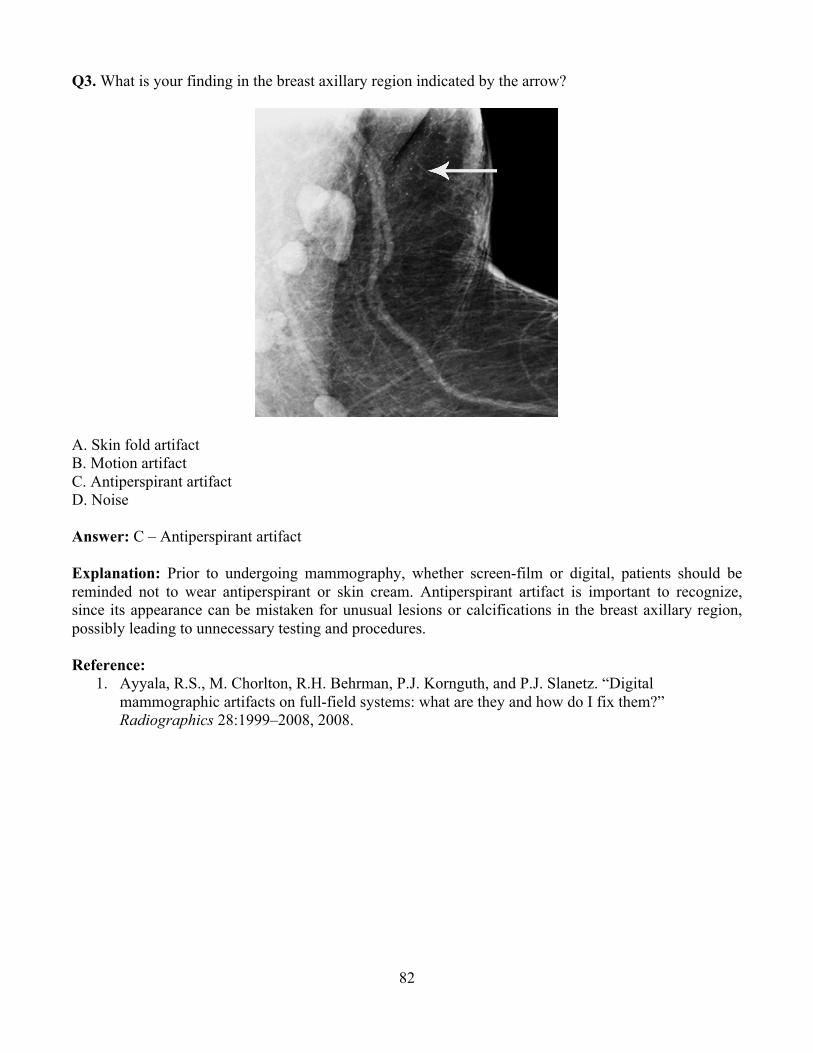
82
Q3. What is your finding in the breast axillary region indicated by the arrow?
A. Skin fold artifact B. Motion artifact C. Antiperspirant artifact D. Noise Answer: C – Antiperspirant artifact Explanation: Prior to undergoing mammography, whether screen-film or digital, patients should be reminded not to wear antiperspirant or skin cream. Antiperspirant artifact is important to recognize, since its appearance can be mistaken for unusual lesions or calcifications in the breast axillary region, possibly leading to unnecessary testing and procedures. Reference:
1. Ayyala, R.S., M. Chorlton, R.H. Behrman, P.J. Kornguth, and P.J. Slanetz. “Digital mammographic artifacts on full-field systems: what are they and how do I fix them?” Radiographics 28:1999–2008, 2008.
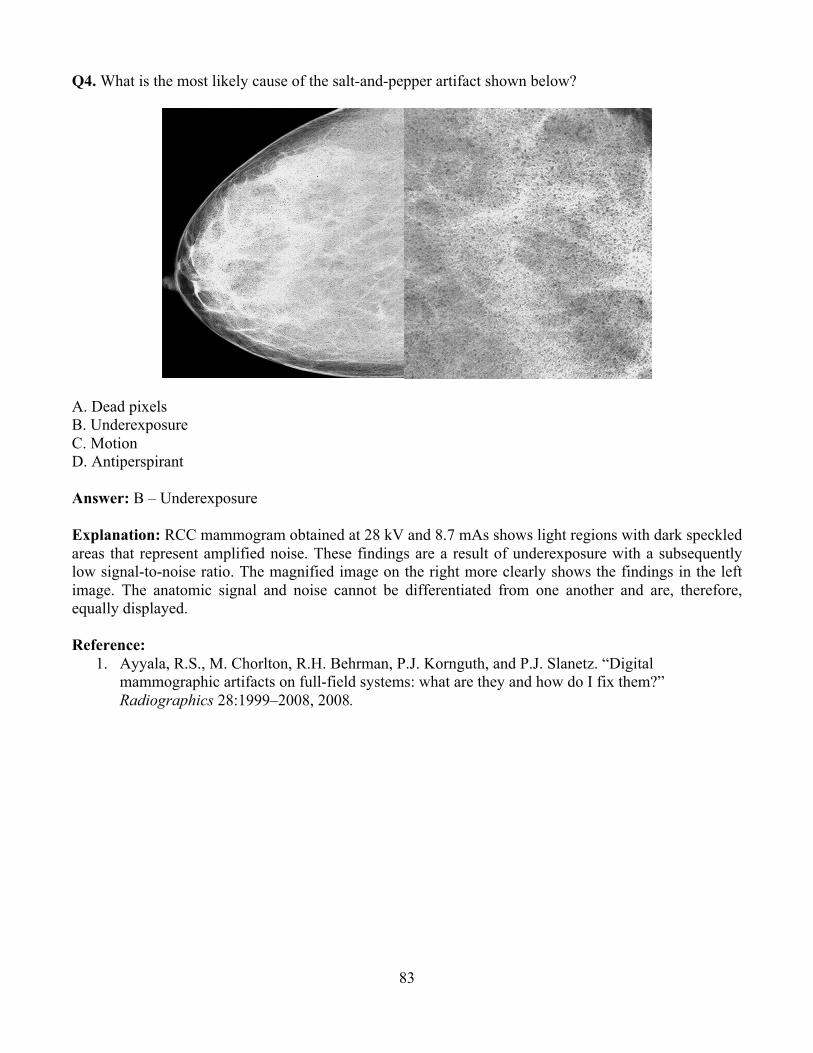
83
Q4. What is the most likely cause of the salt-and-pepper artifact shown below?
A. Dead pixels B. Underexposure C. Motion D. Antiperspirant Answer: B – Underexposure Explanation: RCC mammogram obtained at 28 kV and 8.7 mAs shows light regions with dark speckled areas that represent amplified noise. These findings are a result of underexposure with a subsequently low signal-to-noise ratio. The magnified image on the right more clearly shows the findings in the left image. The anatomic signal and noise cannot be differentiated from one another and are, therefore, equally displayed. Reference:
1. Ayyala, R.S., M. Chorlton, R.H. Behrman, P.J. Kornguth, and P.J. Slanetz. “Digital mammographic artifacts on full-field systems: what are they and how do I fix them?” Radiographics 28:1999–2008, 2008.
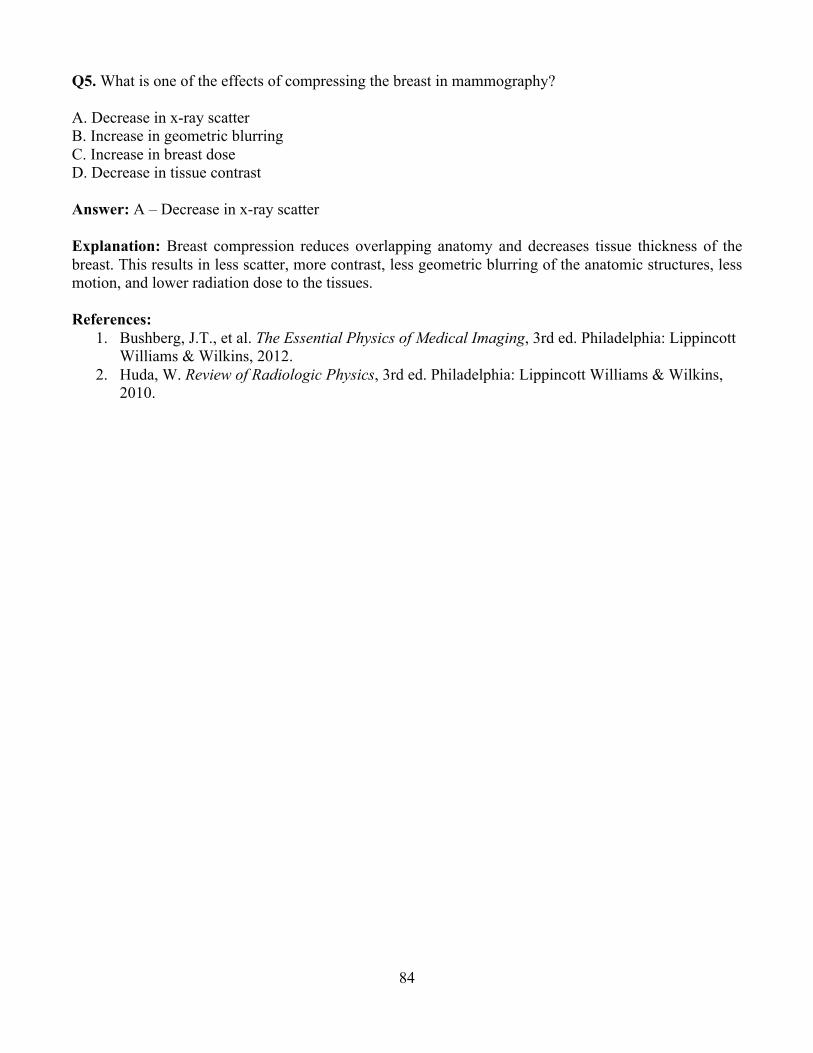
84
Q5. What is one of the effects of compressing the breast in mammography? A. Decrease in x-ray scatter B. Increase in geometric blurring C. Increase in breast dose D. Decrease in tissue contrast Answer: A – Decrease in x-ray scatter Explanation: Breast compression reduces overlapping anatomy and decreases tissue thickness of the breast. This results in less scatter, more contrast, less geometric blurring of the anatomic structures, less motion, and lower radiation dose to the tissues. References:
1. Bushberg, J.T., et al. The Essential Physics of Medical Imaging, 3rd ed. Philadelphia: Lippincott Williams & Wilkins, 2012.
2. Huda, W. Review of Radiologic Physics, 3rd ed. Philadelphia: Lippincott Williams & Wilkins, 2010.
85
Q6. What is the purpose placing the cathode-anode axis from the chest wall to nipple as shown?
A. Achieves a more uniform exposure at the image receptor B. Decreases the focal spot size C. Minimizes motion artifact D. Reduces acquisition time Answer: A – Achieves a more uniform exposure at the image receptor Explanation: This position takes advantage of the heel effect, which places the greatest x-ray intensity over the thickest, densest portion of the breast, i.e., the chest wall. This results in a more uniform exposure at the image receptor. References:
1. Bushberg, J.T., et al. The Essential Physics of Medical Imaging, 3rd ed. Philadelphia: Lippincott Williams & Wilkins, 2012.
2. Huda, W. Review of Radiologic Physics, 3rd ed. Philadelphia: Lippincott Williams & Wilkins, 2010.

86
Q7. The ACR phantom contains how many fibers, specks, and masses?
A. 5 fibers, 5 speck groups, 5 masses B. 6 fibers, 5 speck groups, 5 masses C. 4 fibers, 5 speck groups, 5 masses D. 5 fibers, 4 speck groups, 4 masses Answer: B – 6 fibers, 5 speck groups, 5 masses Explanation: Mammography phantoms are used to assess mammographic image quality and to detect temporal changes in image quality. Phantom images should be read under optimal viewing conditions and scored. The phantom image shall achieve at least the minimum score established by the accredited body and accepted by FDA. References:
1. Bushberg, J.T., et al. The Essential Physics of Medical Imaging, 3rd ed. Philadelphia: Lippincott Williams & Wilkins, 2012.
2. American College of Radiology. Mammography Quality Control Manual. Reston, VA: American College of Radiology, 1999.
Q8. What dose metric is required to be measured annually by regulatory and accreditation agencies? A. Absorbed dose to the whole breast B. Effective dose to the whole body C. Absorbed dose to the glandular tissue of the breast D. Equivalent dose to the lungs from x-ray scatter Answer: C – Absorbed dose to the glandular tissue of the breast Explanation: The vast majority of the dose deposition in mammography takes place only in the imaged breast, so the dose to the rest of the body is usually ignored. Also, risk for cancer development in the adipose tissue is minimal. Therefore, the absorbed dose to the glandular tissue of the imaged breast is the only one of interest. Reference:
1. Bushberg, J.T., et al. The Essential Physics of Medical Imaging, 3rd ed. Philadelphia: Lippincott Williams & Wilkins, 2012.
2. Sechopoulos, I., S. Suryanarayanan, S. Vedantham, C.J. D’Orsi, and A. Karellas (2008). Radiation Dose to Organs and Tissues from Mammography: Monte Carlo and Phantom Study. Radiology, 246(2), 434–443.
87
Q9. If during a complete screening mammographic examination (2 views, 2 breasts) a patient gets a dose of 1 mGy per view, what is the absorbed dose to the breast tissue? A. 1/4 mGy B. 1 mGy C. 2 mGy D. 4 mGy Answer: C – 2 mGy Explanation: The definition of absorbed dose is total energy deposited divided by the mass of tissue where the dose is deposited. So, assuming the same amount of tissue in both breasts and both views, the dose to the same breast due to two views should be added together, while the dose to the two breasts should be averaged. Reference:
1. Bushberg, J.T., et al. The Essential Physics of Medical Imaging, 3rd ed. Philadelphia: Lippincott Williams & Wilkins, 2012.
Q10. What is the federal limit for dose to a patient during breast cancer screening? A. 50 mSv per screening exam B. 3 mGy per view C. 1 mGy per view D. There is no limit of dose to a patient Answer: D – There is no limit of dose to a patient Explanation: The MQSA limit of 3 mGy per view applies only to imaging of the ACR accreditation phantom, not to any patient. There is no limit of any kind to the dose to patients from mammography. References:
1. Bushberg, J.T., et al. The Essential Physics of Medical Imaging, 3rd ed. Philadelphia: Lippincott Williams & Wilkins, 2012.
2. Huda, W. Review of Radiologic Physics, 3rd ed. Philadelphia: Lippincott Williams & Wilkins, 2010.

88
Module 11: Fluoroscopy and Interventional Imaging After completing this module, the resident should be able to apply the “Fundamental Knowledge” and “Clinical Applications” learned from the module to example tasks, such as those found in “Clinical Problem-solving.” Fundamental Knowledge:
1. Describe and identify the basic components of a fluoroscopic system. 2. Explain how the geometric features of a fluoroscopic system contribute to the resulting image. 3. Explain the features of image intensifier (II) systems used for fluoroscopy. 4. Explain the features of flat-panel detector systems used for fluoroscopy. 5. Describe the different operating modes used in fluoroscopy imaging. 6. Identify the components that determine image quality in a fluoroscopy system. 7. Discuss basic image processing methods used in fluoroscopy, and describe how they are used
clinically. 8. Review the various clinical applications of fluoroscopic and interventional radiology systems. 9. Name the factors that affect patient dose during a fluoroscopic or interventional procedure. 10. Describe concepts of exposure and how patient radiation dose is estimated in fluoroscopy and
interventional procedures. 11. Describe the artifacts that can occur with image-intensified and flat-panel fluoroscopy systems. 12. Be familiar with federal and state regulations regarding fluoroscopy output rate and potential
skin injury.
Clinical Application: 1. Differentiate among the various image acquisition parameters used in specific clinical
applications of fluoroscopy and interventional radiology. 2. Describe where the operator should stand to minimize personnel dose when performing an
interventional fluoroscopy procedure with the C-arm positioned laterally. 3. Describe optimal geometry when positioning patients for fluoroscopy procedure. 4. Discuss radiation safety considerations and methods to modify a procedure to minimize the dose
for operators. 5. Describe the clinical equipment settings which can be implemented to minimize patient peak
skin dose in fluoroscopy and interventional radiology. 6. Describe how peak skin dose varies from pediatric to bariatric patient sizes.
Clinical Problem-solving:
1. What are dose management options during prolonged fluoroscopy procedures? 2. What steps can be taken to minimize the dose to the fetus of a pregnant patient who needs a
fluoroscopic or interventional procedure? 3. What are the dose thresholds and potential skin effects that may occur from a prolonged
interventional procedure? 4. What are the advantages and disadvantages of using cone-beam CT imaging?
Curriculum: 11. Fluoroscopy and Interventional Imaging
11.1. System Components 11.1.1. Tube 11.1.2. Filtration 11.1.3. Collimation
89
11.1.4. Grids 11.1.5. Automatic Brightness Control (ABC) 11.1.6. Automatic Exposure Rate Control (AERC) 11.1.7. Compensation Filters
11.2. Geometry 11.2.1. Source-to-image Receptor Distance (SID), Source-to-object Distance (SOD), and
Object-to-image Receptor Distance (OID) 11.2.2. Focal Spot Size 11.2.3. Magnification 11.2.4. Under-table vs. Over-table X-ray Tube 11.2.5. C-arms, O-rings, and Bi-plane
11.3. Acquisition Systems 11.3.1. Image Intensifier (II)
11.3.1.1. II Structure 11.3.1.2. Brightness Gain
11.3.1.2.1. Minification (Geometric) Gain 11.3.1.2.2. Flux Gain
11.3.1.3. Field of View (FOV), Magnification, and Spatial Resolution 11.3.1.4. Image Distortion
11.3.1.4.1. Lag 11.3.1.4.2. Veiling Glare 11.3.1.4.3. Vignetting 11.3.1.4.4. Pincushion, Barreling, “S”-distortion
11.3.2. Flat-panel 11.3.2.1. Detectors 11.3.2.2. Binning, Magnification, and Spatial Resolution 11.3.2.3. Image Artifacts
11.3.2.3.1. Correlated Noise 11.3.2.3.2. Lag 11.3.2.3.3. Ghosting 11.3.2.3.4. Dead Pixels 11.3.2.3.5. Flat Field
11.4. Real-time Imaging 11.4.1. Continuous Fluoroscopy 11.4.2. High-dose Rate Fluoroscopy 11.4.3. Variable Frame-rate Pulsed Fluoroscopy 11.4.4. Digital Spot Images 11.4.5. Cine
11.5. Image Quality 11.5.1. Low-contrast Sensitivity 11.5.2. High-contrast (Spatial) Resolution 11.5.3. Temporal Resolution 11.5.4. Noise 11.5.5. Blur
11.6. Image Processing 11.6.1. Temporal Recursive Filtering/Frame Averaging 11.6.2. Last-image Hold and Last-series Hold 11.6.3. Edge Enhancement and Smoothing

90
11.6.4. Digital Subtraction Angiography (DSA) 11.6.5. Road Mapping
11.7. Applications 11.7.1. Conventional Fluoroscopy (e.g., GI, GU) 11.7.2. Contrast Imaging (e.g., Iodine and Barium) 11.7.3. Cinefluorography 11.7.4. DSA 11.7.5. Bi-plane 11.7.6. Cardiac 11.7.7. Pediatric 11.7.8. Bolus Chasing 11.7.9. Cone-beam CT Imaging (3D Rotational Angiography)
11.8. Dose and Dosimetry 11.8.1. Federal and State Regulations
11.8.1.1. Dose Rate Limits 11.8.1.2. Audible Alarms 11.8.1.3. Recording of “Beam-on” Time 11.8.1.4. Minimum Source-to-patient Distance (Cone) 11.8.1.5. The Joint Commission Sentinel Event 11.8.1.6. Interventional Reference Point
11.8.2. Dose-area-product (DAP) and KERMA-area-product (KAP) Meters 11.8.3. Entrance Air Kerma 11.8.4. Peak Skin Dose 11.8.5. Cumulative Dose 11.8.6. Patient Dose for Various Acquisition Modes 11.8.7. Operator and Staff Dose 11.8.8. Personnel Protection
11.9. Protocol Optimization and Factors Affecting Patient Dose 11.9.1.1. Patient Positioning/Geometry 11.9.1.2. Protocols 11.9.1.3. Filters 11.9.1.4. Acquisition Mode 11.9.1.5. Beam-on Time 11.9.1.6. Last-image Hold 11.9.1.7. Pulsed Exposure and Pulse Duration 11.9.1.8. Magnification 11.9.1.9. Collimation 11.9.1.10. Operator Training 11.9.1.11. Dose Monitoring and QC
91
Example Q&A: Q1. Which of the following statements about fluoroscopic radiation dose is TRUE? A. Fluoroscopic exposure time is the best estimate for a patient’s fluoroscopic dose. B. Air Kerma at the reference point is equivalent to the patient entrance skin dose. C. Air Kerma Area Product may be used to estimate stochastic risk. D. Peak Skin Dose can be easily and accurately calculated in real time. Answer: C – Air Kerma Area Product may be used to estimate stochastic risk Explanation: Fluoroscopic exposure time is not the best estimate for a patient’s fluoroscopic radiation dose (NCRP 168, Figure 2.2). Air Kerma needs to take into account several factors, including an inverse-square correction as well as an air kerma to skin dose conversion, backscatter factor, etc., to correctly calculate the entrance skin dose. Air Kerma Area Product provides a good estimate of the total x-ray energy imparted to the tissues of the patient, which relates to stochastic effects (NCRP 168, p. 198). Currently, measurement of peak skin dose cannot be easily and accurately calculated in real time unless special instruments (real-time dosimetry) are used. References:
1. NCRP. NCRP Report No. 168, Radiation Dose Management for Fluoroscopically-Guided Interventional Medical Procedures. Bethesda, MD: National Council on Radiation Protection and Measurements, 2011.
2. Bushberg, J.T., et al. The Essential Physics of Medical Imaging, 3rd ed. Philadelphia: Lippincott Williams & Wilkins, 2012.
Q2. Which of the following is a stochastic effect that could occur in a high-dose fluoroscopic procedure? A. Erythema B. Epilation C. Desquamation D. Dermal necrosis E. Carcinogenesis Answer: E – Carcinogenesis Explanation: Carcinogenesis is a stochastic radiation effect. Erythema, epilation, desquamation, and dermal necrosis are deterministic effects from excessive radiation exposure. References:
1. Huda, W. Review of Radiologic Physics, 3rd ed. Philadelphia: Lippincott Williams & Wilkins, 2010.
2. Bushberg, J.T., et al. The Essential Physics of Medical Imaging, 3rd ed. Philadelphia: Lippincott Williams & Wilkins, 2012.
92
Q3. According to The Joint Commission, a sentinel event occurs in fluoroscopy when: A. Greater than 2 Gy is delivered to a single field B. Greater than 2 Gy is delivered over all fields C. Greater than 15 Gy is delivered to a single field D. Greater than 15 Gy is delivered to all fields Answer: C – Greater than 15 Gy is delivered to a single field. Reference:
1. Bushberg, J.T., et al. The Essential Physics of Medical Imaging, 3rd ed. Philadelphia: Lippincott Williams & Wilkins, 2012.
Q4. Which of the following fluoroscopic modes results in the highest air kerma rate? A. Pulsed, 30 pps B. Pulsed, 15 pps C. Continuous D. Cine/Digital Run Answer: D – Cine/Digital Run Explanation: Cine/digital run results in the highest patient radiation exposure rate and should be used sparingly. Of this list, pulsed fluoroscopy at 15 pulses per second provides the lowest patient radiation exposure. Typically, continuous fluoroscopy delivers higher patient radiation exposure rates than pulsed fluoroscopy.
References:
1. Bushberg, J.T., et al. The Essential Physics of Medical Imaging, 3rd ed. Philadelphia: Lippincott Williams & Wilkins, 2012.
2. Huda, W. Review of Radiologic Physics, 3rd ed. Philadelphia: Lippincott Williams & Wilkins, 2010.
93
Q5. Which of the following is an example of POOR clinical practice with fluoroscopy? A. Requiring the use of radiation dosimeters and personal protective equipment B. Positioning the image receptor close to the patient surface C. Selecting the appropriate magnification mode D. Using tight collimation E. Placing a lead-gloved hand in the path of the primary beam Answer: E – Placing a lead gloved hand in the path of the primary beam
Explanation: Placing a lead glove, or any highly attenuating object, in the radiation field can result in a higher radiation technique (higher kVp or mA, or both) resulting in higher patient dose due to compensation by the automatic exposure rate control system. The other options are examples of GOOD clinical practice. References:
1. Bushberg, J.T., et al. The Essential Physics of Medical Imaging, 3rd ed. Philadelphia: Lippincott Williams & Wilkins, 2012.
2. Huda, W. Review of Radiologic Physics, 3rd ed. Philadelphia: Lippincott Williams & Wilkins, 2010.
Q6. Image intensifier (II) type image receptors are susceptible to which of the following? A. Pincushion distortion B. Conebeam errors C. Pulse pile-up D. Ring artifact E. K-space errors Answer: A – Pincushion Distortion Explanation: Pincushion distortion is a geometric nonlinear magnification difference at the periphery of the image resulting from the projection of the x-ray beam onto a curved input surface. Pincushion distortion is specific to image intensifier-based fluoroscopic systems. Pulse pile-up is specific to nuclear medicine systems. Conebeam errors and ring artifacts are CT artifacts. K-space errors are found in MRI. References:
1. Bushberg, J.T., et al. The Essential Physics of Medical Imaging, 3rd ed. Philadelphia: Lippincott Williams & Wilkins, 2012.
2. Huda, W. Review of Radiologic Physics, 3rd ed. Philadelphia: Lippincott Williams & Wilkins, 2010.

94
Q7. Flat panel fluoroscopy systems are susceptible to which of the following? A. Pincushion Distortion B. S-distortion C. Vignetting D. Dead Pixels Answer: D – Dead Pixels Explanation: Pincushion distortion, vignetting, and s-distortion are specific to image intensifier-based fluoroscopic systems. Only dead pixels are specific to flat panel-based fluoroscopic systems. Reference:
1. Bushberg, J.T., et al. The Essential Physics of Medical Imaging, 3rd ed. Philadelphia: Lippincott Williams & Wilkins, 2012.
Q8. What is the FDA limit for entrance skin exposure rate in high dose rate exposure mode (i.e., “boost” mode)? A. 87 mGy/s (10 R/s) B. 87 mGy/min (10 R/min) C. 174 mGy/s (20 R/s) D. 174 mGy/min (20 R/min) Answer: D – 174 mGy/min (20 R/min) Explanation: The FDA limits the maximum entrance skin exposure rate to 174 mGy/min (20 R/min) when using high dose rate exposure mode (AKA, boost mode). References:
1. Bushberg, J.T., et al. The Essential Physics of Medical Imaging, 3rd ed. Philadelphia: Lippincott Williams & Wilkins, 2012.
2. Huda, W. Review of Radiologic Physics, 3rd ed. Philadelphia: Lippincott Williams & Wilkins, 2010.
95
Q9. What is a typical effective dose from an upper gastrointestinal series? A. 0.06 mSv B. 0.6 mSv C. 6 mSv D. 60 mSv Answer: C – 6 mSv Explanation: The typical effective dose delivered by an upper GI series is 6 mSv (Range 1.5 mSv to 12 mSv). References:
1. Bushberg, J.T., et al. The Essential Physics of Medical Imaging, 3rd ed. Philadelphia: Lippincott Williams & Wilkins, 2012.
2. Mettler, FA, et al. Effective doses in radiology and diagnostic nuclear medicine: A catalogue. Radiology 2008;248: 254-263.
Q10. Which dose metric typically used in fluoroscopy may have units of Gy*cm2? A. Cumulative dose B. Peak skin dose C. Dose-area product D. Effective dose Answer: C – Dose-area product Explanation: The units for Dose-area product are dose (e.g., mGy) times area (e.g., cm2) so, mGy*cm2. Reference:
1. Bushberg, J.T., et al. The Essential Physics of Medical Imaging, 3rd ed. Philadelphia: Lippincott Williams & Wilkins, 2012.
96
Module 12: CT After completing this module, the resident should be able to apply the “Fundamental Knowledge” and “Clinical Applications” learned from the module to example tasks, such as those found in “Clinical Problem-solving.” Fundamental Knowledge:
1. Identify the major components of a CT system. 2. Describe the differences between axial and helical scanning. 3. Explain the difference between reconstructing and reformatting an image. 4. Explain how dose modulation affects patient dose. 5. List the image acquisition parameters, and explain how each affects CT image quality. 6. Describe how a CT image is formed. 7. Define the Hounsfield unit. 8. Compare image characteristics of CT to projection radiography. 9. Describe the concepts of CT Dose Index (CTDI), Dose-length Product (DLP), and Size-specific
Dose Estimate (SSDE). 10. Understand how the reconstruction kernel selected affects image quality. 11. Describe common artifacts, their causes, and methods to minimize them. 12. Describe the relationship between contrast resolution and radiation dose and the effect of
imaging parameters on both. 13. Explain over-beaming and over-ranging and how each affects patient dose. 14. Discuss advantages and disadvantages of iterative reconstruction. 15. Discuss the differences between prospective and retrospective cardiac CT. 16. Describe dual-energy CT and its application
Clinical Application: 1. List typical CT numbers for tissues such as air, water, fat, blood, brain, and bone. 2. Describe the modes of CT operation and their clinical applications. 3. Determine when retrospective versus prospective CT gating would be used. 4. Describe how iterative reconstruction affects image quality and the potential implications for
acquisition technique. 5. Discuss the radiation dose to patients and personnel during CT procedures.
Clinical Problem-solving:
1. What image acquisition parameters affect patient radiation dose? How can they be used to optimize dose and image quality?
2. What needs to be considered when a CT scan needs to be performed on a pregnant patient? 3. What are the methods of shielding a patient in CT? 4. What are appropriate protocols for pediatric CT and bariatric patients?
Curriculum: 12. Computed Tomography (CT)
12.1. System Components 12.1.1. System Geometry 12.1.2. Tube (Fixed and Flying Focal Spot) 12.1.3. Beam Filtration and Shaping (Bow-tie) Filters 12.1.4. Collimation

97
12.1.5. Detector Types and Arrays 12.2. System Types
12.2.1. Dual Source/Energy 12.2.2. Cone-Beam
12.3. Image Acquisition Parameters 12.3.1. Tube Voltage (kV) 12.3.2. Tube Current-time Product (mAs) and Effective mAs 12.3.3. Rotation Time 12.3.4. Pitch 12.3.5. Detector Configuration and Beam Width
12.4. Image Formation 12.4.1. Filtered-back Projection 12.4.2. Reconstruction Filters/Convolution Kernel 12.4.3. Helical Reconstruction 12.4.4. Statistical Iterative and Model Based Reconstruction 12.4.5. Linear Attenuation Coefficient 12.4.6. Hounsfield Unit Definition 12.4.7. Typical CT Numbers (Hounsfield Units)
12.5. Modes of Operation 12.5.1. Axial and Helical Modes 12.5.2. Fixed/Automatic mA 12.5.3. Fixed/Automatic kV 12.5.4. Dose-reduction Techniques 12.5.5. CT Fluoroscopy 12.5.6. Localizer Image (Scout) 12.5.7. Perfusion 12.5.8. Cardiac CT 12.5.9. Dual-energy 12.5.10. CT Angiography
12.6. Image Characteristics and Artifacts 12.6.1. Spatial, Contrast, and Temporal Resolution 12.6.2. Signal-to-noise Ratio (SNR) and Contrast-to-noise Ratio (CNR) 12.6.3. Common Artifacts
12.6.3.1. Beam-hardening 12.6.3.2. Motion 12.6.3.3. Partial-volume 12.6.3.4. Truncation 12.6.3.5. Photon Starvation 12.6.3.6. Detector Miscalibration Ring 12.6.3.7. Aliasing/Undersampling
12.7. Image Processing and Display 12.7.1. Window and Level 12.7.2. Multi-planar Reconstruction (MPR) 12.7.3. Maximum Intensity Projection (MIP) 12.7.4. 3D Volume and Surface Rendering 12.7.5. Overlays (Dual Energy and Perfusion) 12.7.6. Virtual Fly Through
12.8. Clinical Application and Protocols

98
12.9. Dose Descriptors 12.9.1. CT Dose Indices 12.9.2. Dose-length Product (DLP) 12.9.3. Organ Dose and Effective Dose (k-factors) 12.9.4. Size-specific Dose Estimate (SSDE) 12.9.5. Adult and Pediatric Technique Optimization
12.10. Factors Affecting Patient Dose 12.10.1. Beam Width and Pitch 12.10.2. kV, mA, and Time 12.10.3. Patient Size and Centering 12.10.4. Scan Length 12.10.5. Number of Phases (e.g., Pre- and Post-contrast) 12.10.6. Tube-current Modulation 12.10.7. Respiratory/Cardiac Gating 12.10.8. Dual Source/Dual Energy 12.10.9. Patient Shielding (Bismuth)
12.11. Special Applications of CT 12.12. Technical Assessment and Equipment Purchase Recommendations 12.13. The Joint Commission and Accreditation 12.14. Dose Monitoring and Quality Assurance
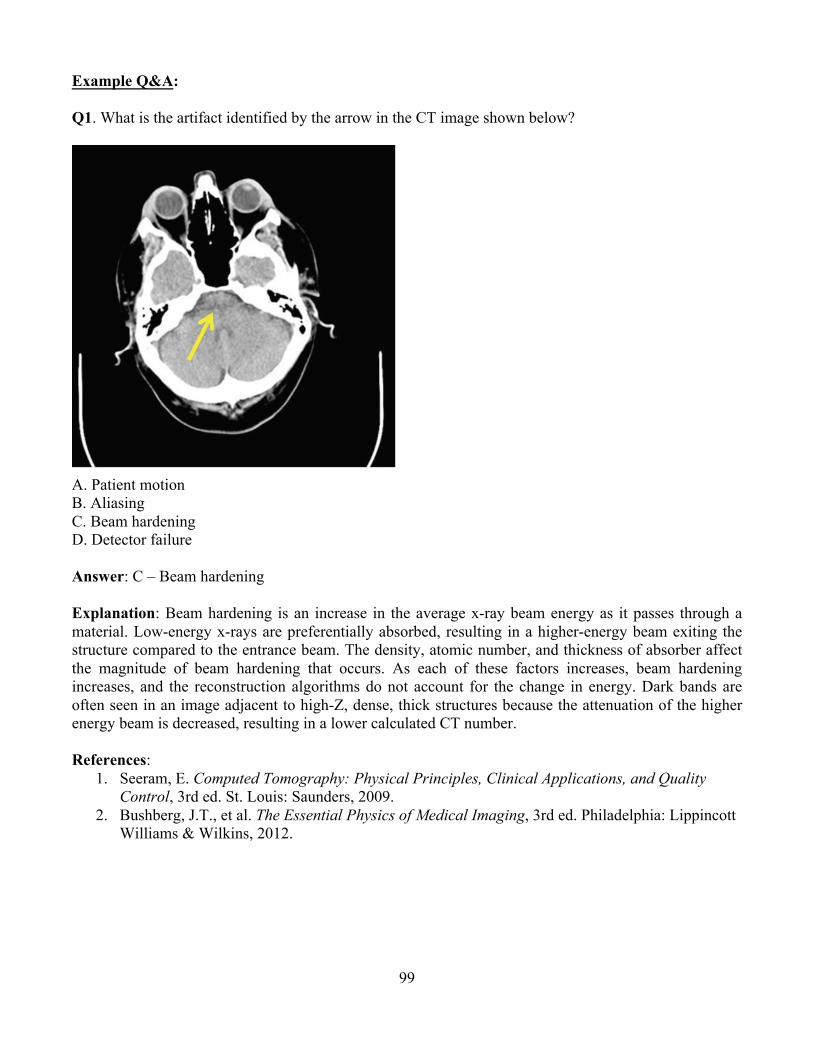
99
Example Q&A:
Q1. What is the artifact identified by the arrow in the CT image shown below?
A. Patient motion B. Aliasing C. Beam hardening D. Detector failure Answer: C – Beam hardening Explanation: Beam hardening is an increase in the average x-ray beam energy as it passes through a material. Low-energy x-rays are preferentially absorbed, resulting in a higher-energy beam exiting the structure compared to the entrance beam. The density, atomic number, and thickness of absorber affect the magnitude of beam hardening that occurs. As each of these factors increases, beam hardening increases, and the reconstruction algorithms do not account for the change in energy. Dark bands are often seen in an image adjacent to high-Z, dense, thick structures because the attenuation of the higher energy beam is decreased, resulting in a lower calculated CT number. References:
1. Seeram, E. Computed Tomography: Physical Principles, Clinical Applications, and Quality Control, 3rd ed. St. Louis: Saunders, 2009.
2. Bushberg, J.T., et al. The Essential Physics of Medical Imaging, 3rd ed. Philadelphia: Lippincott Williams & Wilkins, 2012.
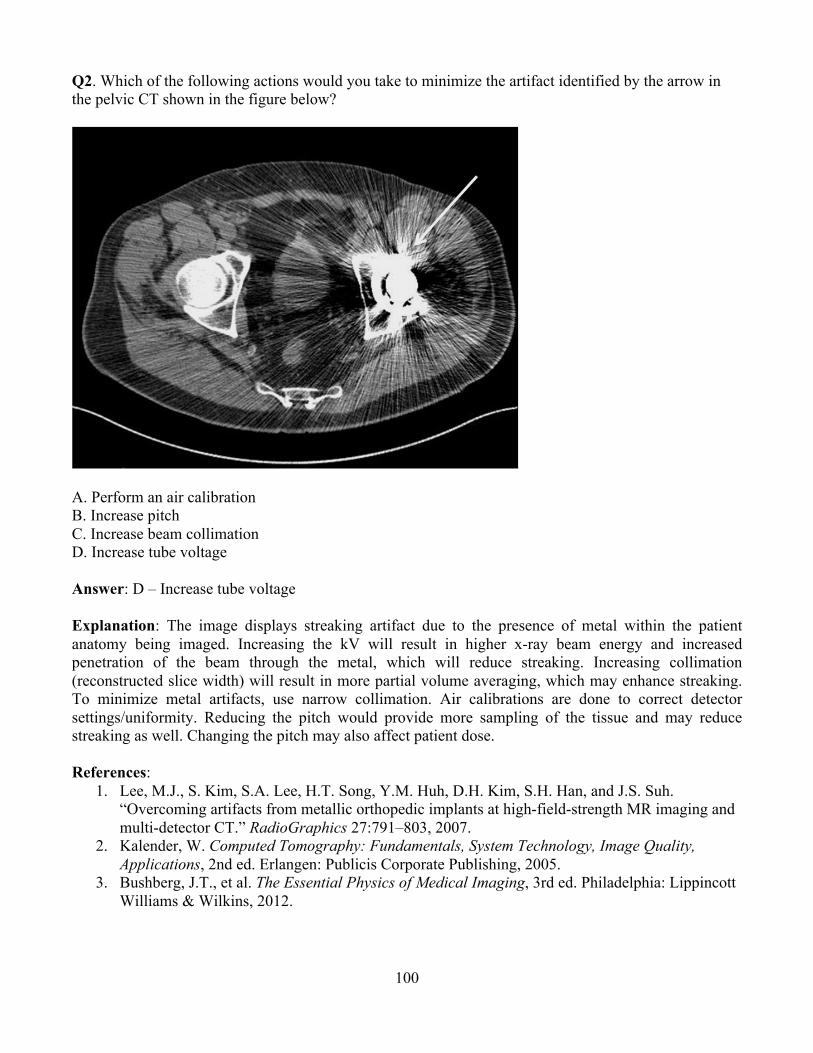
100
Q2. Which of the following actions would you take to minimize the artifact identified by the arrow in the pelvic CT shown in the figure below?
A. Perform an air calibration B. Increase pitch C. Increase beam collimation D. Increase tube voltage Answer: D – Increase tube voltage Explanation: The image displays streaking artifact due to the presence of metal within the patient anatomy being imaged. Increasing the kV will result in higher x-ray beam energy and increased penetration of the beam through the metal, which will reduce streaking. Increasing collimation (reconstructed slice width) will result in more partial volume averaging, which may enhance streaking. To minimize metal artifacts, use narrow collimation. Air calibrations are done to correct detector settings/uniformity. Reducing the pitch would provide more sampling of the tissue and may reduce streaking as well. Changing the pitch may also affect patient dose. References:
1. Lee, M.J., S. Kim, S.A. Lee, H.T. Song, Y.M. Huh, D.H. Kim, S.H. Han, and J.S. Suh. “Overcoming artifacts from metallic orthopedic implants at high-field-strength MR imaging and multi-detector CT.” RadioGraphics 27:791–803, 2007.
2. Kalender, W. Computed Tomography: Fundamentals, System Technology, Image Quality, Applications, 2nd ed. Erlangen: Publicis Corporate Publishing, 2005.
3. Bushberg, J.T., et al. The Essential Physics of Medical Imaging, 3rd ed. Philadelphia: Lippincott Williams & Wilkins, 2012.
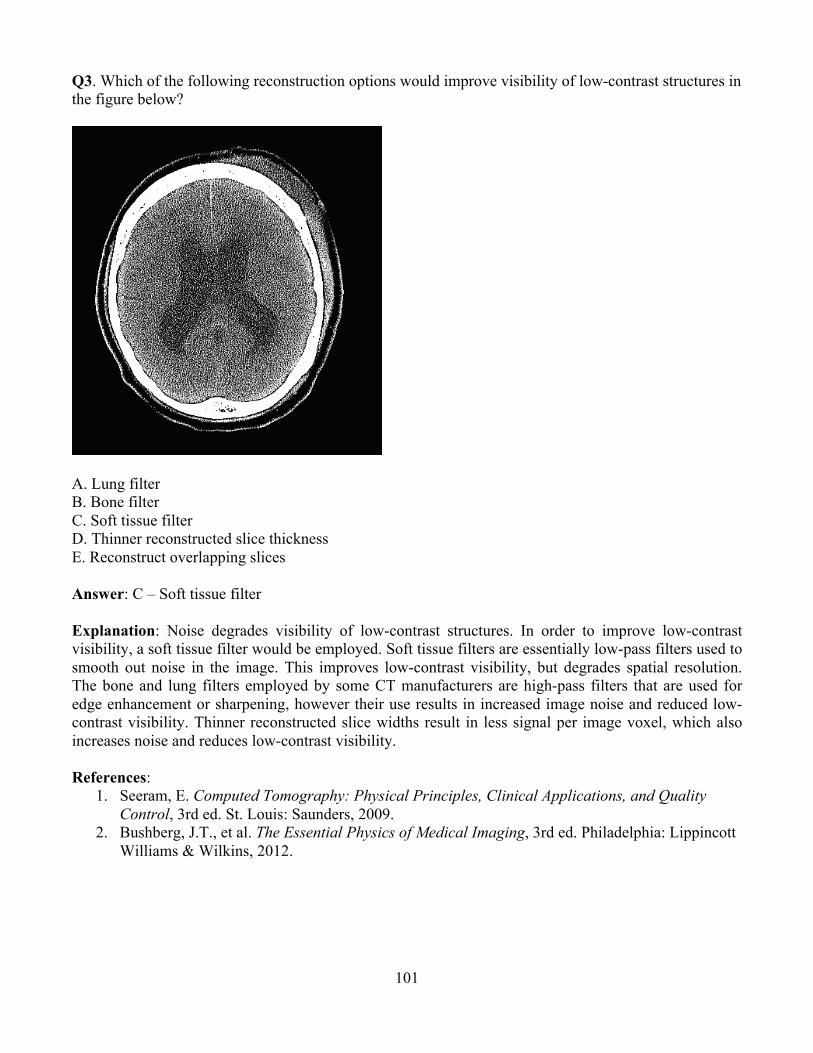
101
Q3. Which of the following reconstruction options would improve visibility of low-contrast structures in the figure below?
A. Lung filter B. Bone filter C. Soft tissue filter D. Thinner reconstructed slice thickness E. Reconstruct overlapping slices Answer: C – Soft tissue filter Explanation: Noise degrades visibility of low-contrast structures. In order to improve low-contrast visibility, a soft tissue filter would be employed. Soft tissue filters are essentially low-pass filters used to smooth out noise in the image. This improves low-contrast visibility, but degrades spatial resolution. The bone and lung filters employed by some CT manufacturers are high-pass filters that are used for edge enhancement or sharpening, however their use results in increased image noise and reduced low-contrast visibility. Thinner reconstructed slice widths result in less signal per image voxel, which also increases noise and reduces low-contrast visibility. References:
1. Seeram, E. Computed Tomography: Physical Principles, Clinical Applications, and Quality Control, 3rd ed. St. Louis: Saunders, 2009.
2. Bushberg, J.T., et al. The Essential Physics of Medical Imaging, 3rd ed. Philadelphia: Lippincott Williams & Wilkins, 2012.

102
Q4. Which of the following would improve visibility of low-contrast structures in the image below without increasing radiation dose to the patient?
A. Increase mA B. Increase tube rotation time C. Increase reconstructed slice thickness D. Increase kV
Answer: C – Increase reconstructed slice thickness Explanation: All of the options listed above will improve visibility of low-contrast resolution. The product of mA and tube rotation time equals the scan mAs. As mAs increases, patient dose increases proportionally. Therefore, an increase in either factor will result in a proportional increase in patient dose. Radiation dose is proportional to the square of the kV. Increasing kV from 120 to 140 will result in almost a 40% increase in dose. Increasing the reconstructed slice width will result in more signal per voxel, which will reduce noise and improve low-contrast visibility. The disadvantage of a larger reconstructed slice width is reduced spatial resolution. Often, when thinner slice thickness is desired, dose is increased to compensate for higher noise with thinner slices. In this case, slice thickness is increased, which will reduce noise, so dose would not be expected to increase. References:
1. Seeram, E. Computed Tomography: Physical Principles, Clinical Applications, and Quality Control, 3rd ed. St. Louis: Saunders, 2009.
2. Bushberg, J.T., et al. The Essential Physics of Medical Imaging, 3rd ed. Philadelphia: Lippincott Williams & Wilkins, 2012.
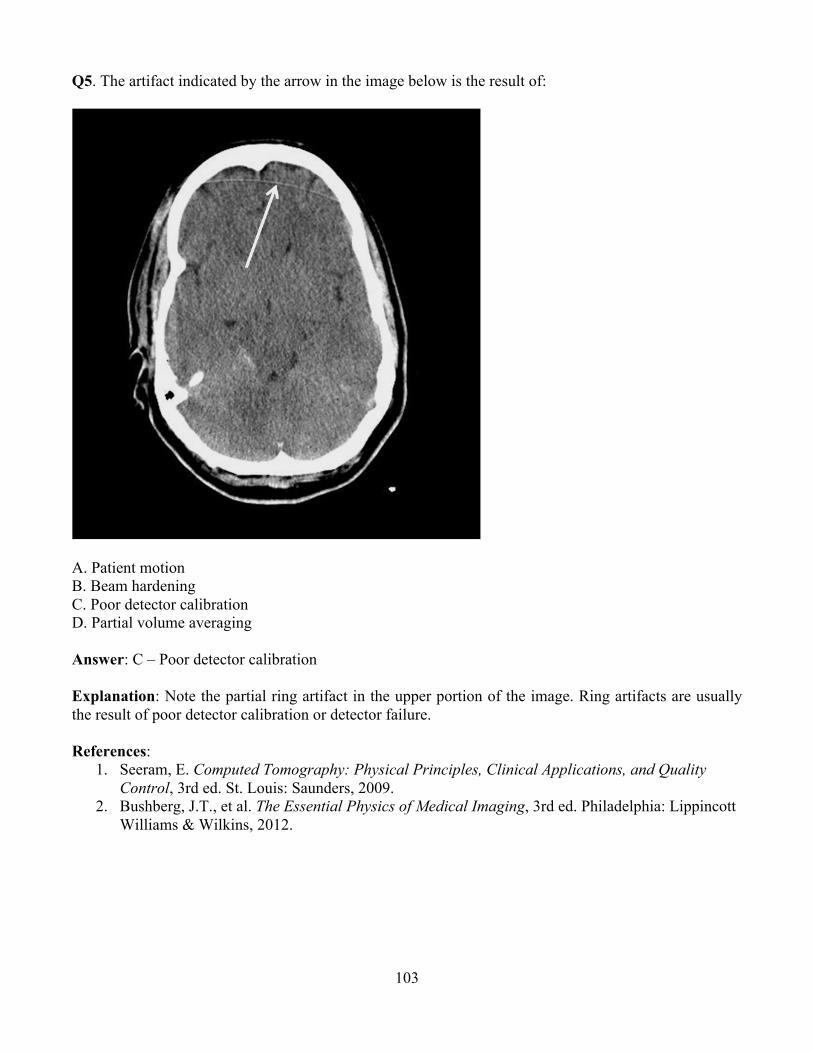
103
Q5. The artifact indicated by the arrow in the image below is the result of:
A. Patient motion B. Beam hardening C. Poor detector calibration D. Partial volume averaging Answer: C – Poor detector calibration Explanation: Note the partial ring artifact in the upper portion of the image. Ring artifacts are usually the result of poor detector calibration or detector failure. References:
1. Seeram, E. Computed Tomography: Physical Principles, Clinical Applications, and Quality Control, 3rd ed. St. Louis: Saunders, 2009.
2. Bushberg, J.T., et al. The Essential Physics of Medical Imaging, 3rd ed. Philadelphia: Lippincott Williams & Wilkins, 2012.
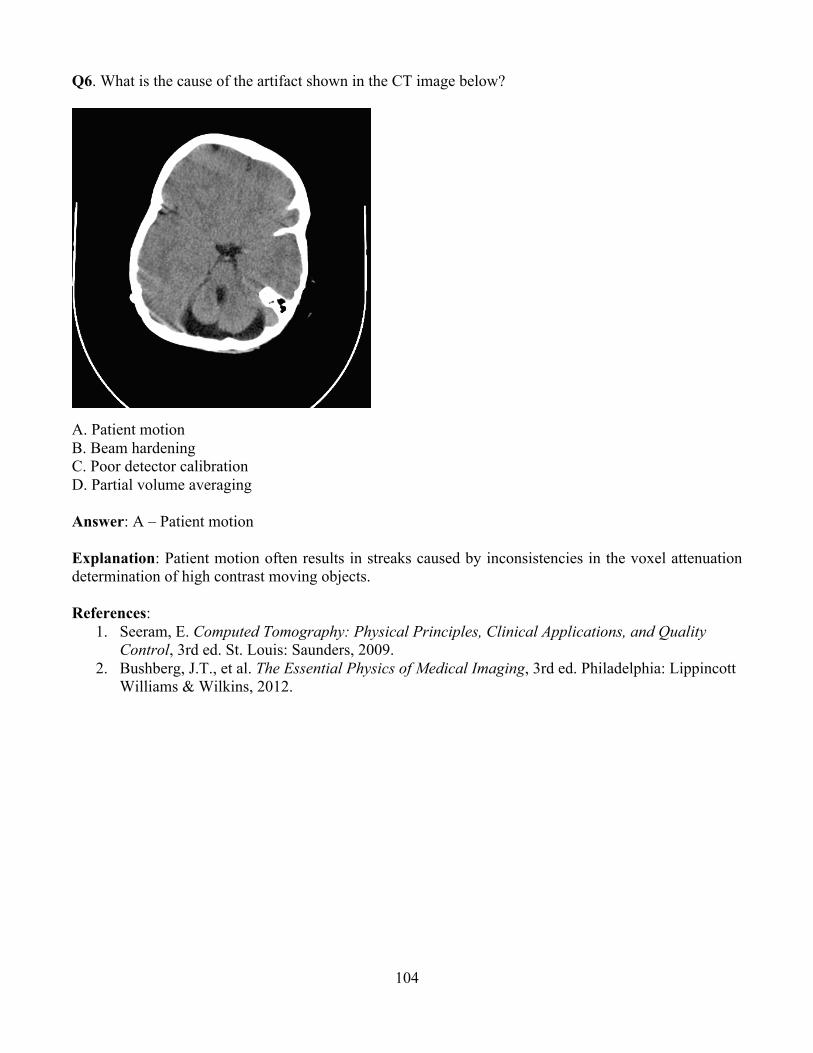
104
Q6. What is the cause of the artifact shown in the CT image below?
A. Patient motionB. Beam hardening C. Poor detector calibration D. Partial volume averaging Answer: A – Patient motion Explanation: Patient motion often results in streaks caused by inconsistencies in the voxel attenuation determination of high contrast moving objects. References:
1. Seeram, E. Computed Tomography: Physical Principles, Clinical Applications, and Quality Control, 3rd ed. St. Louis: Saunders, 2009.
2. Bushberg, J.T., et al. The Essential Physics of Medical Imaging, 3rd ed. Philadelphia: Lippincott Williams & Wilkins, 2012.
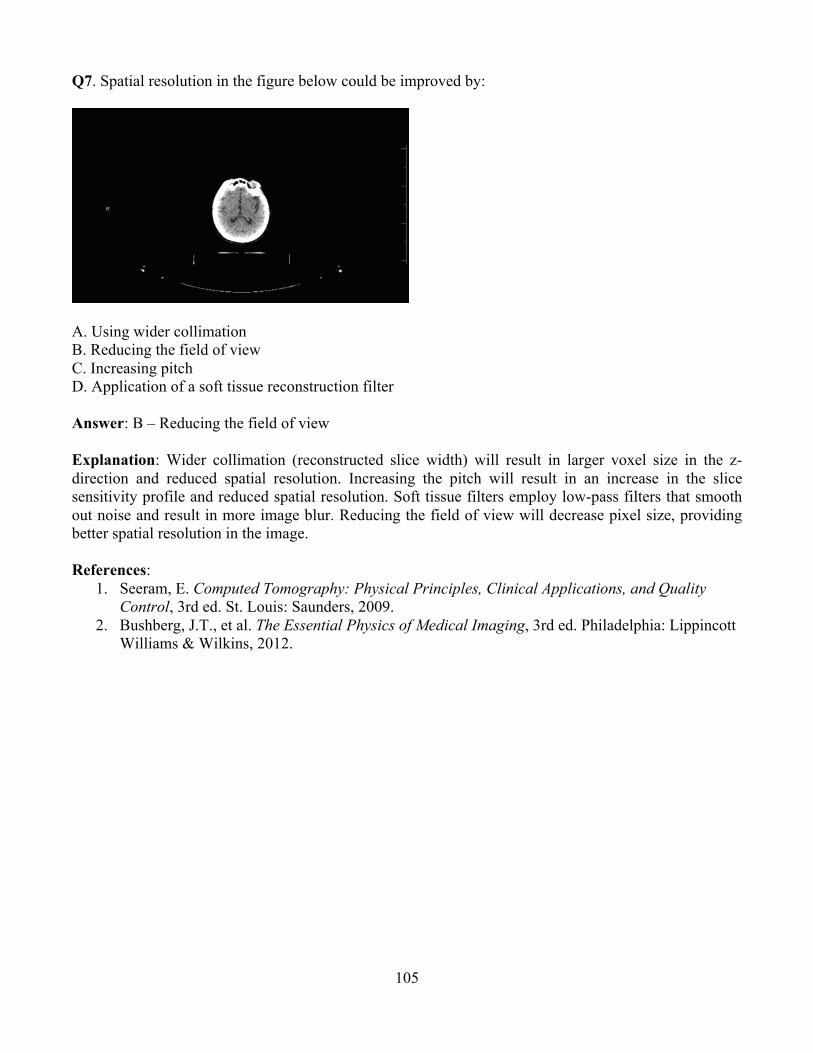
105
Q7. Spatial resolution in the figure below could be improved by:
A. Using wider collimation B. Reducing the field of viewC. Increasing pitch D. Application of a soft tissue reconstruction filter Answer: B – Reducing the field of view Explanation: Wider collimation (reconstructed slice width) will result in larger voxel size in the z-direction and reduced spatial resolution. Increasing the pitch will result in an increase in the slice sensitivity profile and reduced spatial resolution. Soft tissue filters employ low-pass filters that smooth out noise and result in more image blur. Reducing the field of view will decrease pixel size, providing better spatial resolution in the image. References:
1. Seeram, E. Computed Tomography: Physical Principles, Clinical Applications, and Quality Control, 3rd ed. St. Louis: Saunders, 2009.
2. Bushberg, J.T., et al. The Essential Physics of Medical Imaging, 3rd ed. Philadelphia: Lippincott Williams & Wilkins, 2012.

106
Q8. What difference in CT number (HU) is expected between tissue A and tissue B as shown in the figure below?
A. 0 HU B. 500 HU C. 1000 HU
D. 2000 HU Answer: D – 2000 HU Explanation: Tissue A is bone. The CT number of bone is approximately 1000. Tissue B is air with a CT number of approximately -1000. The variation in CT number between the two tissues is approximately 2000 HU. (NOTE: HU and CT number are synonymous.) References:
1. Bushberg, J.T., et al. The Essential Physics of Medical Imaging, 3rd ed. Philadelphia: Lippincott Williams & Wilkins, 2012.
2. Seeram, E. Computed Tomography: Physical Principles, Clinical Applications, and Quality Control, 3rd ed. St. Louis: Saunders, 2009.
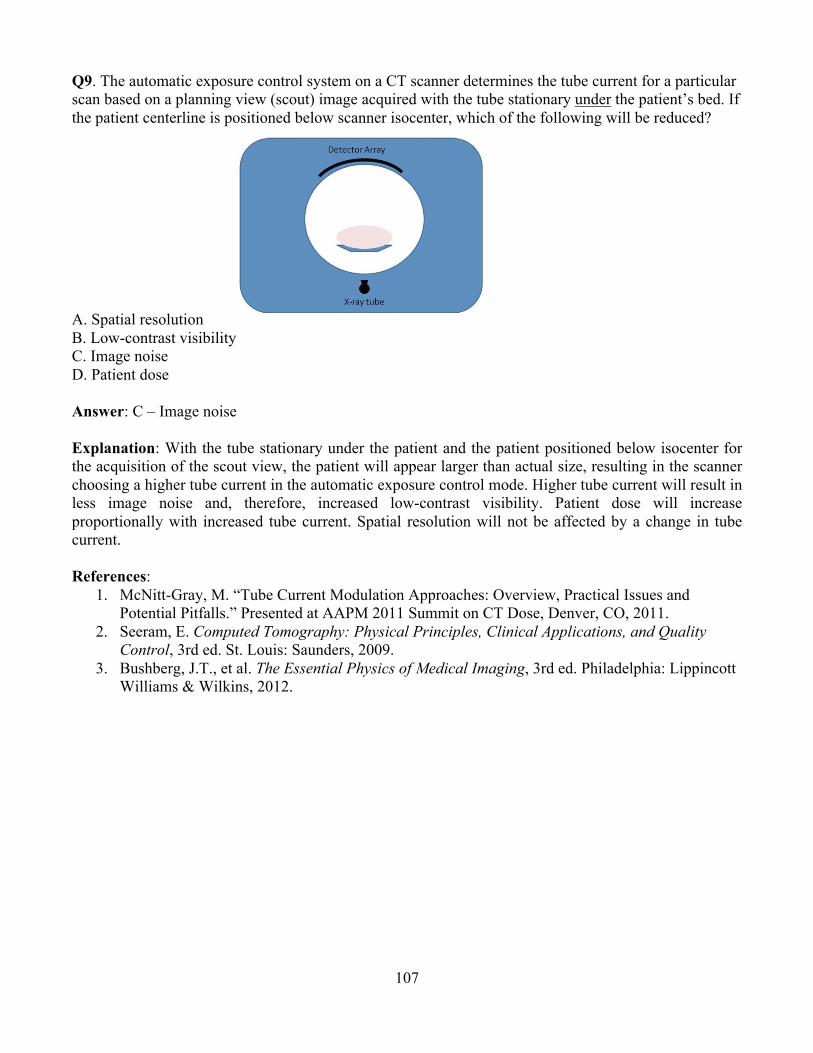
107
Q9. The automatic exposure control system on a CT scanner determines the tube current for a particular scan based on a planning view (scout) image acquired with the tube stationary under the patient’s bed. If the patient centerline is positioned below scanner isocenter, which of the following will be reduced?
A. Spatial resolution B. Low-contrast visibility C. Image noise D. Patient dose Answer: C – Image noise
Explanation: With the tube stationary under the patient and the patient positioned below isocenter for the acquisition of the scout view, the patient will appear larger than actual size, resulting in the scanner choosing a higher tube current in the automatic exposure control mode. Higher tube current will result in less image noise and, therefore, increased low-contrast visibility. Patient dose will increase proportionally with increased tube current. Spatial resolution will not be affected by a change in tube current. References:
1. McNitt-Gray, M. “Tube Current Modulation Approaches: Overview, Practical Issues and Potential Pitfalls.” Presented at AAPM 2011 Summit on CT Dose, Denver, CO, 2011.
2. Seeram, E. Computed Tomography: Physical Principles, Clinical Applications, and Quality Control, 3rd ed. St. Louis: Saunders, 2009.
3. Bushberg, J.T., et al. The Essential Physics of Medical Imaging, 3rd ed. Philadelphia: Lippincott Williams & Wilkins, 2012.

108
Q10. Match the American College of Radiology CT Accreditation CTDIvol Dose Reference Values to the appropriate facility protocol. A. 75 mGy 1. Adult Body B. 35 mGy 2. Adult Head C. 25 mGy 3. Pediatric Body (40–50 lbs) D. 15 mGy 4. Pediatric Head (1 yo) Answer: A.2, B.4, C.1, D.3 Explanation: The American College of Radiology reference values are set at levels above expected values and are used to help facilities identify situations where dose reduction measures may be indicated. Reference:
1. American College of Radiology, CT Accreditation Program Requirements, November 2013.

109
Q11. What parameter change is the most likely cause of the increased noise, right image, and decreased resolution, left image, below?
A. Different kV B. Different mAs C. Different gantry angle D. Different convolution kernel Answer: D – Different convolution kernel Explanation: The image on the left is less noisy, but it also demonstrates a higher degree of blurring (lower resolution). Increasing kV or mAs will decrease image noise; however, neither substantially changes spatial resolution. Changing the gantry angle would create oblique sections, but not impact image quality. Changing the convolution kernel (AKA reconstruction filter) changes the spatial frequencies left out during image reconstruction. This simultaneously alters both noise and resolution. References:
1. Bushberg, J.T., et al. The Essential Physics of Medical Imaging, 3rd ed. Philadelphia: Lippincott Williams & Wilkins, 2012.
2. Huda, W. Review of Radiologic Physics, 3rd ed. Philadelphia: Lippincott Williams & Wilkins, 2010.
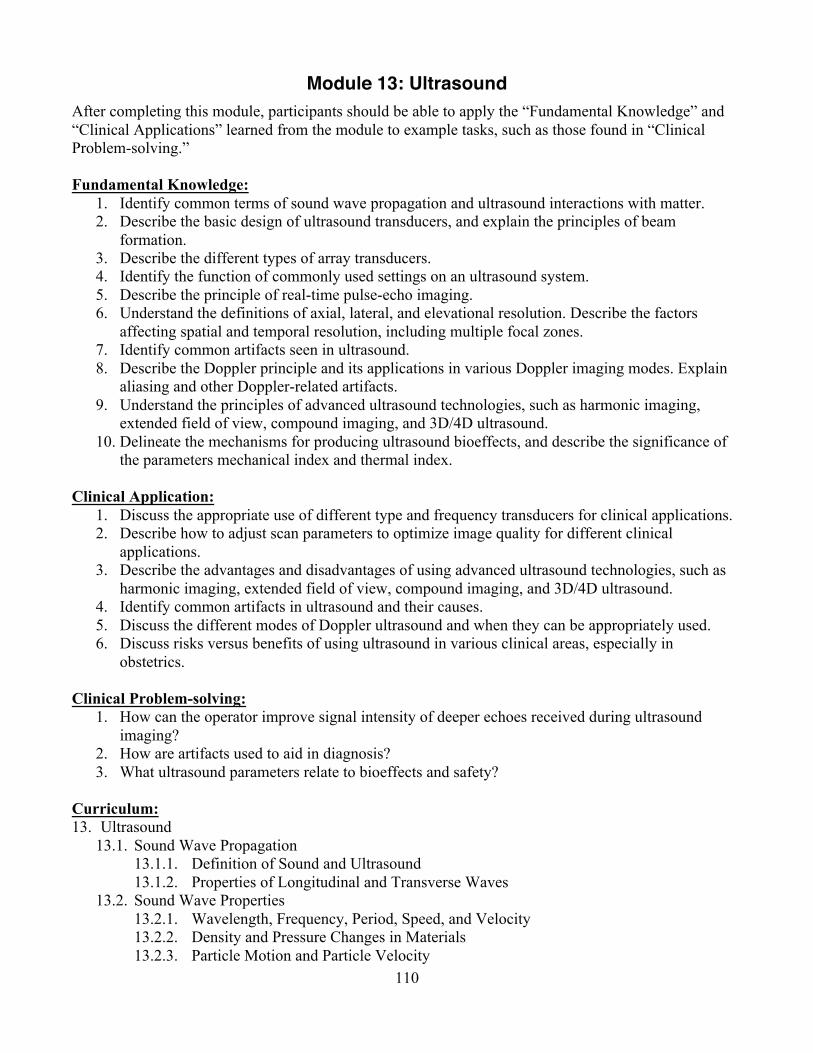
110
Module 13: Ultrasound After completing this module, participants should be able to apply the “Fundamental Knowledge” and “Clinical Applications” learned from the module to example tasks, such as those found in “Clinical Problem-solving.” Fundamental Knowledge:
1. Identify common terms of sound wave propagation and ultrasound interactions with matter. 2. Describe the basic design of ultrasound transducers, and explain the principles of beam
formation. 3. Describe the different types of array transducers. 4. Identify the function of commonly used settings on an ultrasound system. 5. Describe the principle of real-time pulse-echo imaging. 6. Understand the definitions of axial, lateral, and elevational resolution. Describe the factors
affecting spatial and temporal resolution, including multiple focal zones. 7. Identify common artifacts seen in ultrasound. 8. Describe the Doppler principle and its applications in various Doppler imaging modes. Explain
aliasing and other Doppler-related artifacts. 9. Understand the principles of advanced ultrasound technologies, such as harmonic imaging,
extended field of view, compound imaging, and 3D/4D ultrasound. 10. Delineate the mechanisms for producing ultrasound bioeffects, and describe the significance of
the parameters mechanical index and thermal index. Clinical Application:
1. Discuss the appropriate use of different type and frequency transducers for clinical applications. 2. Describe how to adjust scan parameters to optimize image quality for different clinical
applications. 3. Describe the advantages and disadvantages of using advanced ultrasound technologies, such as
harmonic imaging, extended field of view, compound imaging, and 3D/4D ultrasound. 4. Identify common artifacts in ultrasound and their causes. 5. Discuss the different modes of Doppler ultrasound and when they can be appropriately used. 6. Discuss risks versus benefits of using ultrasound in various clinical areas, especially in
obstetrics. Clinical Problem-solving:
1. How can the operator improve signal intensity of deeper echoes received during ultrasound imaging?
2. How are artifacts used to aid in diagnosis? 3. What ultrasound parameters relate to bioeffects and safety?
Curriculum: 13. Ultrasound
13.1. Sound Wave Propagation 13.1.1. Definition of Sound and Ultrasound 13.1.2. Properties of Longitudinal and Transverse Waves
13.2. Sound Wave Properties 13.2.1. Wavelength, Frequency, Period, Speed, and Velocity 13.2.2. Density and Pressure Changes in Materials 13.2.3. Particle Motion and Particle Velocity

111
13.2.4. Compressibility and Elasticity 13.2.5. Dependence of Sound Speed on Medium and Properties
13.3. Power and Intensity 13.3.1. Decibel Scale 13.3.2. Relationship between Intensity and Pressure
13.4. Interactions of Ultrasound Waves with Matter 13.4.1. Acoustic Impedance
13.4.1.1. Relationship to Density, Speed, and Compressibility 13.4.1.2. Impedance Changes at Tissue Interfaces
13.4.2. Reflection, Refraction, and Transmission 13.4.2.1. Role of Impedance 13.4.2.2. Reflection Coefficient 13.4.2.3. Normal and Oblique Incidence 13.4.2.4. Specular and Diffuse Reflection 13.4.2.5. Transmission 13.4.2.6. Refraction and Snell’s Law
13.4.3. Scattering 13.4.3.1. Hyperechoic and Hypoechoic Regions 13.4.3.2. Relationship to Frequency and Scatterer Size 13.4.3.3. Rayleigh Scattering (Blood Cells) 13.4.3.4. Constructive and Destructive Interference 13.4.3.5. Speckle
13.4.4. Attenuation and Absorption 13.4.4.1. Causes and Relationship to Sound Properties 13.4.4.2. Attenuation and Absorption Coefficients
13.5. Transducer Components 13.5.1. Piezoelectric Materials 13.5.2. Transducer Construction
13.6. Transducer Arrays 13.6.1. Linear and Curvilinear Arrays 13.6.2. Phased Arrays 13.6.3. Annular Arrays 13.6.4. 1.5D, 2D, and 3D Arrays 13.6.5. Special-purpose Transducer Assemblies
13.6.5.1. Intra-cavitary Transducers 13.6.5.2. Intra-vascular Transducers
13.7. Beam properties 13.7.1. Near Field 13.7.2. Far Field 13.7.3. Focused Transducers 13.7.4. Side and Grating Lobes
13.8. Transducer Array Beam Formation and Focusing 13.8.1. Linear and Sector Scanning 13.8.2. Transmit Focusing 13.8.3. Receive Focusing 13.8.4. Beam Steering 13.8.5. Beam Shaping
13.9. Image Quality
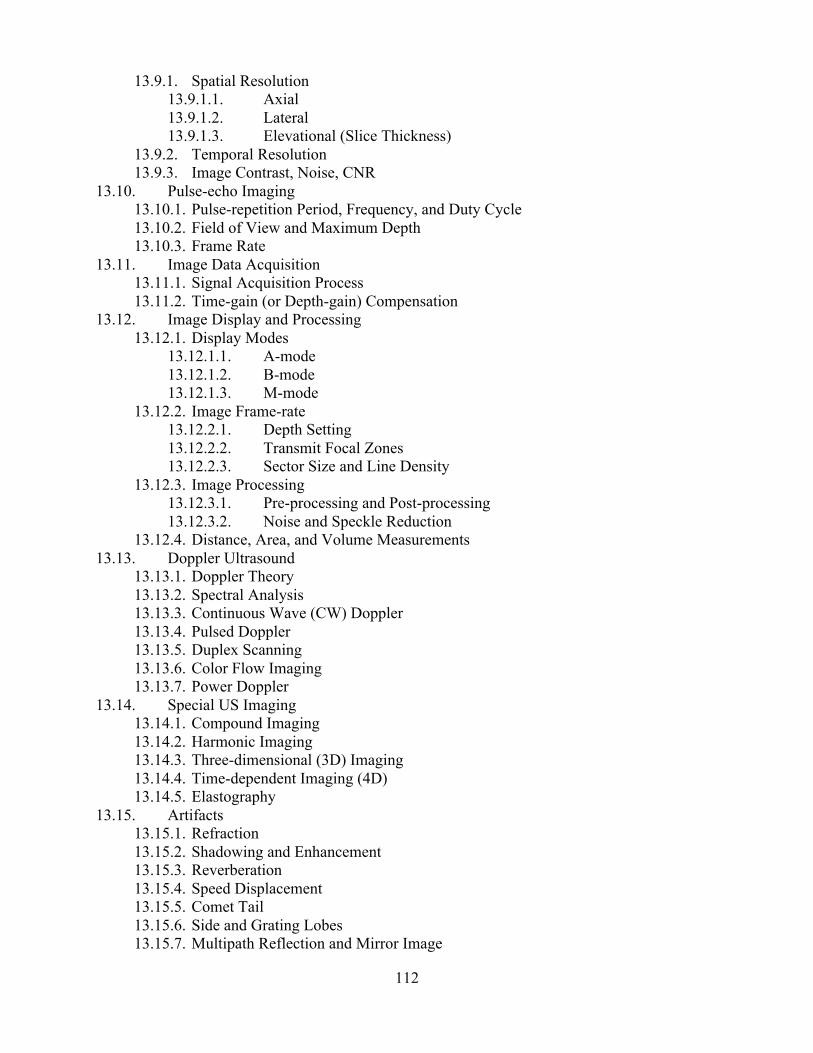
112
13.9.1. Spatial Resolution 13.9.1.1. Axial 13.9.1.2. Lateral 13.9.1.3. Elevational (Slice Thickness)
13.9.2. Temporal Resolution 13.9.3. Image Contrast, Noise, CNR
13.10. Pulse-echo Imaging 13.10.1. Pulse-repetition Period, Frequency, and Duty Cycle 13.10.2. Field of View and Maximum Depth 13.10.3. Frame Rate
13.11. Image Data Acquisition 13.11.1. Signal Acquisition Process 13.11.2. Time-gain (or Depth-gain) Compensation
13.12. Image Display and Processing 13.12.1. Display Modes
13.12.1.1. A-mode 13.12.1.2. B-mode 13.12.1.3. M-mode
13.12.2. Image Frame-rate 13.12.2.1. Depth Setting 13.12.2.2. Transmit Focal Zones 13.12.2.3. Sector Size and Line Density
13.12.3. Image Processing 13.12.3.1. Pre-processing and Post-processing 13.12.3.2. Noise and Speckle Reduction
13.12.4. Distance, Area, and Volume Measurements 13.13. Doppler Ultrasound
13.13.1. Doppler Theory 13.13.2. Spectral Analysis 13.13.3. Continuous Wave (CW) Doppler 13.13.4. Pulsed Doppler 13.13.5. Duplex Scanning 13.13.6. Color Flow Imaging 13.13.7. Power Doppler
13.14. Special US Imaging 13.14.1. Compound Imaging 13.14.2. Harmonic Imaging 13.14.3. Three-dimensional (3D) Imaging 13.14.4. Time-dependent Imaging (4D) 13.14.5. Elastography
13.15. Artifacts 13.15.1. Refraction 13.15.2. Shadowing and Enhancement 13.15.3. Reverberation 13.15.4. Speed Displacement 13.15.5. Comet Tail 13.15.6. Side and Grating Lobes 13.15.7. Multipath Reflection and Mirror Image

113
13.15.8. Range Ambiguity 13.15.9. Mirror Artifact 13.15.10. Doppler and Color Flow Aliasing 13.15.11. Flow Ambiguity 13.15.12. Twinkle
13.16. Safety and Bioeffects 13.16.1. Mechanisms and Limits for Bioeffects
13.16.1.1. Heating 13.16.1.2. Cavitation 13.16.1.3. Thermal Indices (TI) 13.16.1.4. Mechanical Index (MI)
13.16.2. Acoustic Power 13.16.3. Intensity Measures of Ultrasound Energy Deposition
13.16.3.1. Spatial Average/Temporal Average Intensity [I(SATA)] 13.16.3.2. Spatial Peak /Temporal Average Intensity [I(SPTA)] 13.16.3.3. Spatial Peak/Pulse Average Intensity [I(SPPA)] 13.16.3.4. Spatial Peak/Temporal Peak Intensity [I(SPTP)]
13.16.4. Pregnant Patient and Pediatric Protocols 13.16.4.1. Acceptable Thermal Index of Bone (TIB) and Thermal Index of Cranial
Bone (TIC) limits 13.16.4.2. Current Clinical Statements on Ultrasound Safety
13.17. Ultrasound Quality Control and Quality Assurance 13.18. Accreditation
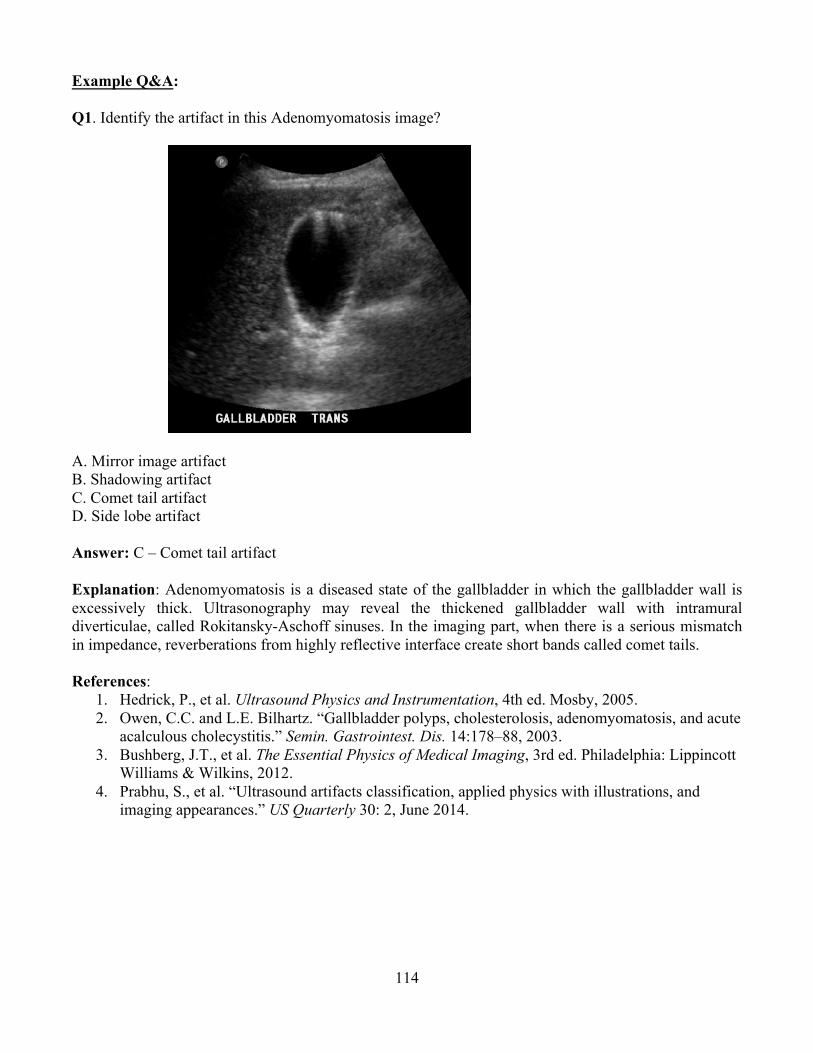
114
Example Q&A: Q1. Identify the artifact in this Adenomyomatosis image?
A. Mirror image artifact B. Shadowing artifact C. Comet tail artifact D. Side lobe artifact Answer: C – Comet tail artifact Explanation: Adenomyomatosis is a diseased state of the gallbladder in which the gallbladder wall is excessively thick. Ultrasonography may reveal the thickened gallbladder wall with intramural diverticulae, called Rokitansky-Aschoff sinuses. In the imaging part, when there is a serious mismatch in impedance, reverberations from highly reflective interface create short bands called comet tails. References:
1. Hedrick, P., et al. Ultrasound Physics and Instrumentation, 4th ed. Mosby, 2005. 2. Owen, C.C. and L.E. Bilhartz. “Gallbladder polyps, cholesterolosis, adenomyomatosis, and acute
acalculous cholecystitis.” Semin. Gastrointest. Dis. 14:178–88, 2003. 3. Bushberg, J.T., et al. The Essential Physics of Medical Imaging, 3rd ed. Philadelphia: Lippincott
Williams & Wilkins, 2012. 4. Prabhu, S., et al. “Ultrasound artifacts classification, applied physics with illustrations, and
imaging appearances.” US Quarterly 30: 2, June 2014.
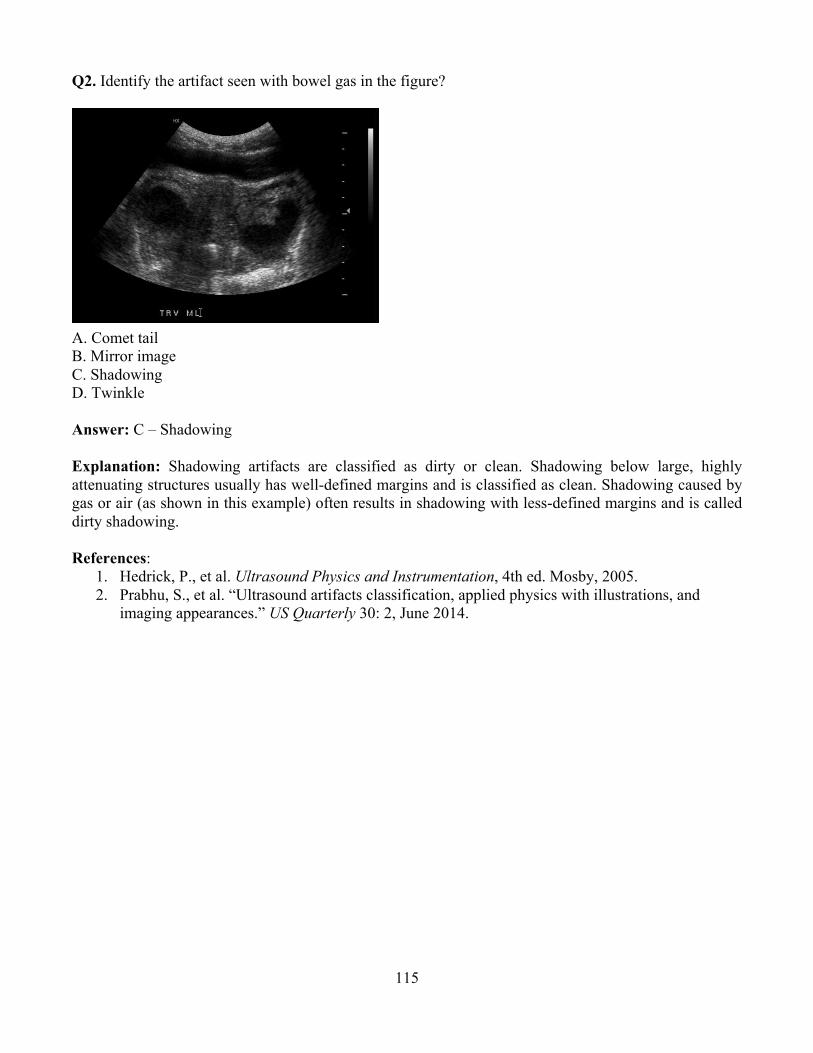
115
Q2. Identify the artifact seen with bowel gas in the figure?
A. Comet tail B. Mirror image C. Shadowing D. Twinkle
Answer: C – Shadowing Explanation: Shadowing artifacts are classified as dirty or clean. Shadowing below large, highly attenuating structures usually has well-defined margins and is classified as clean. Shadowing caused by gas or air (as shown in this example) often results in shadowing with less-defined margins and is called dirty shadowing.
References:
1. Hedrick, P., et al. Ultrasound Physics and Instrumentation, 4th ed. Mosby, 2005. 2. Prabhu, S., et al. “Ultrasound artifacts classification, applied physics with illustrations, and
imaging appearances.” US Quarterly 30: 2, June 2014.

116
Q3. Identify the artifact in the image?
A. Aliasing B. Mirror image C. Reverberation D. Range Ambiguity
Answer: A – Aliasing Explanation: In the pulsed Doppler imaging, sampling rate or pulse repetition frequency (PRF) is set by the sonographer. Sampling rate (PRF) must be at least twice the maximum frequency shift present and is the Nyquist criterion. One half of the PRF is called Nyquist frequency limit (PRF of at least 20 Khz is required for a Doppler shift of 10 Khz). Doppler shifts above the Nyquist frequencies are displayed as a low-frequency shift—an artifact. Some ways to avoid this artifact include moving the color baseline up or down, increasing the velocity scale, etc. References:
1. Kruskal, J.B., P.A. Newman, L.G. Sammons, and R.A. Kane. “Optimizing Doppler and color flow US: application to hepatic sonography. Radiographics 24:657–75, 2004.
2. Hedrick, P., et al. Ultrasound Physics and Instrumentation, 4th ed. Mosby, 2005. 3. Bushberg, J.T., et al. The Essential Physics of Medical Imaging, 3rd ed. Philadelphia: Lippincott
Williams & Wilkins, 2012. 4. Prabhu, S., et al. “Ultrasound artifacts classification, applied physics with illustrations, and
imaging appearances.” US Quarterly 30: 2, June 2014.
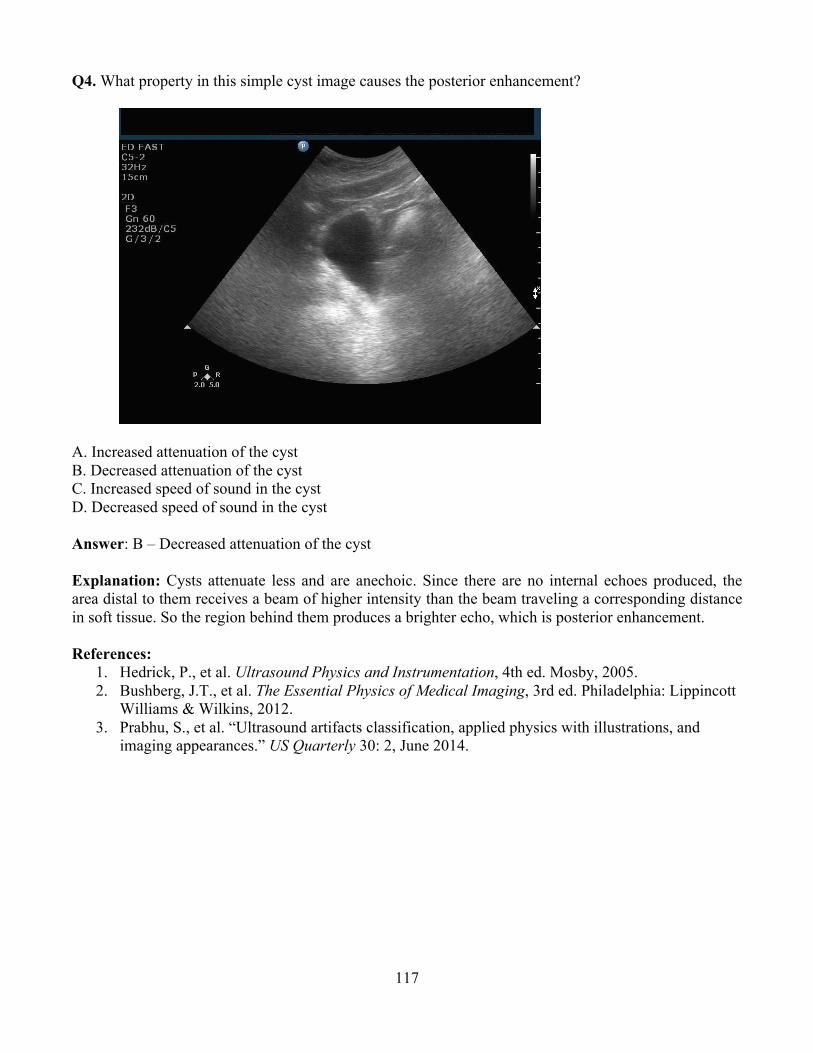
117
Q4. What property in this simple cyst image causes the posterior enhancement?
A. Increased attenuation of the cyst B. Decreased attenuation of the cyst C. Increased speed of sound in the cyst D. Decreased speed of sound in the cyst
Answer: B – Decreased attenuation of the cyst Explanation: Cysts attenuate less and are anechoic. Since there are no internal echoes produced, the area distal to them receives a beam of higher intensity than the beam traveling a corresponding distance in soft tissue. So the region behind them produces a brighter echo, which is posterior enhancement. References:
1. Hedrick, P., et al. Ultrasound Physics and Instrumentation, 4th ed. Mosby, 2005. 2. Bushberg, J.T., et al. The Essential Physics of Medical Imaging, 3rd ed. Philadelphia: Lippincott
Williams & Wilkins, 2012.3. Prabhu, S., et al. “Ultrasound artifacts classification, applied physics with illustrations, and
imaging appearances.” US Quarterly 30: 2, June 2014.
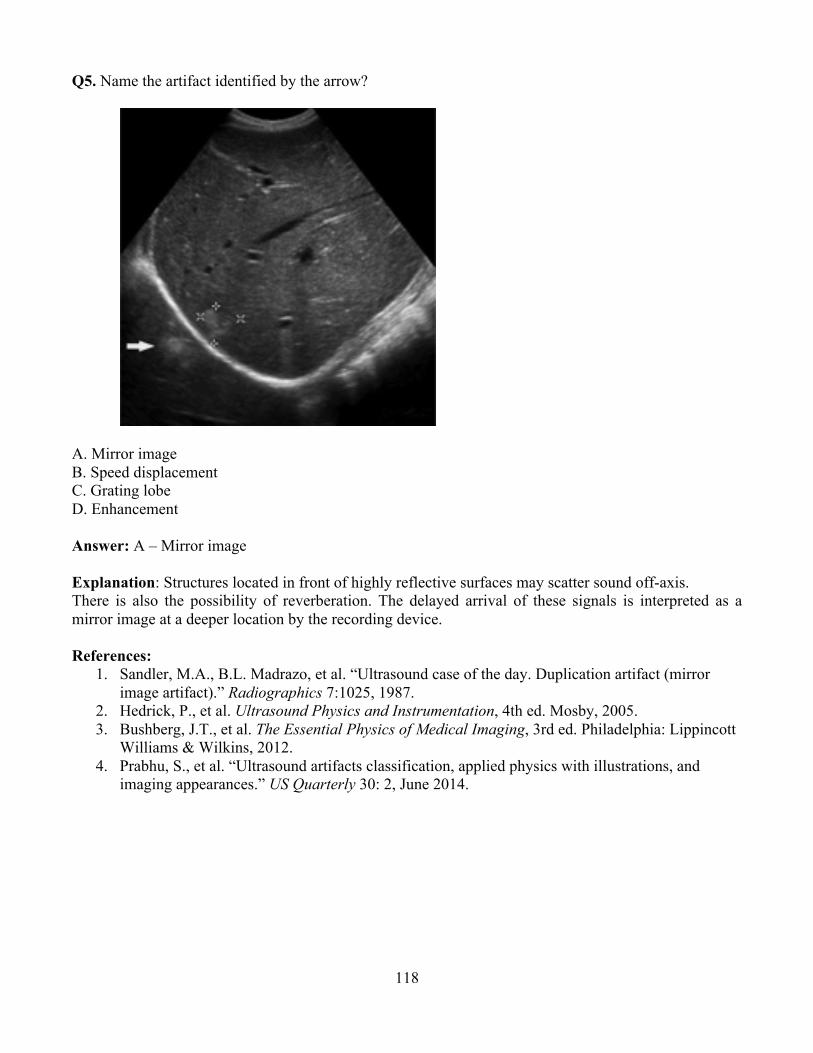
118
Q5. Name the artifact identified by the arrow?
A. Mirror image B. Speed displacement C. Grating lobe D. Enhancement Answer: A – Mirror image Explanation: Structures located in front of highly reflective surfaces may scatter sound off-axis. There is also the possibility of reverberation. The delayed arrival of these signals is interpreted as a mirror image at a deeper location by the recording device. References:
1. Sandler, M.A., B.L. Madrazo, et al. “Ultrasound case of the day. Duplication artifact (mirror image artifact).” Radiographics 7:1025, 1987.
2. Hedrick, P., et al. Ultrasound Physics and Instrumentation, 4th ed. Mosby, 2005. 3. Bushberg, J.T., et al. The Essential Physics of Medical Imaging, 3rd ed. Philadelphia: Lippincott
Williams & Wilkins, 2012. 4. Prabhu, S., et al. “Ultrasound artifacts classification, applied physics with illustrations, and
imaging appearances.” US Quarterly 30: 2, June 2014.

119
Q6. In Ultrasound, what is the benefit of using harmonic imaging (right image) compared to conventional imaging (left image)?
A. Increased MI B. Enhanced contrast C. Higher frame rates Answer: B – Enhanced contrast Explanation: When ultrasound waves interact with the tissue, different tissues distort the wave differently. For example, fat distorts more than muscle or liver or kidney. The resultant wave has a harmonic frequency, which is selectively listened to by the transducer receiver. The ultrasound system generates a high-contrast image with improved spatial resolution and with less artifact components. Reference:
1. Bushberg, J.T., et al. The Essential Physics of Medical Imaging, 2nd ed. Philadelphia: Lippincott Williams & Wilkins, 2002.

120
Q7. What is the advantage of using a curvilinear transducer instead of a linear transducer?
A. Increased attenuation B. Improved resolution C. Expanded field of view D. Higher frame rates Answer: C – Expanded field of view Explanation: Curved-array transducers have a large field of view and better penetration of soft tissue. References:
1. Bushberg, J.T., et al. The Essential Physics of Medical Imaging, 3rd ed. Philadelphia: Lippincott Williams & Wilkins, 2012.
2. Kruskal, J.B., P.A. Newman, L.G. Sammons, and R.A. Kane. “Optimizing Doppler and color flow US: application to hepatic sonography.” Radiographics 24:657–75, 2004.
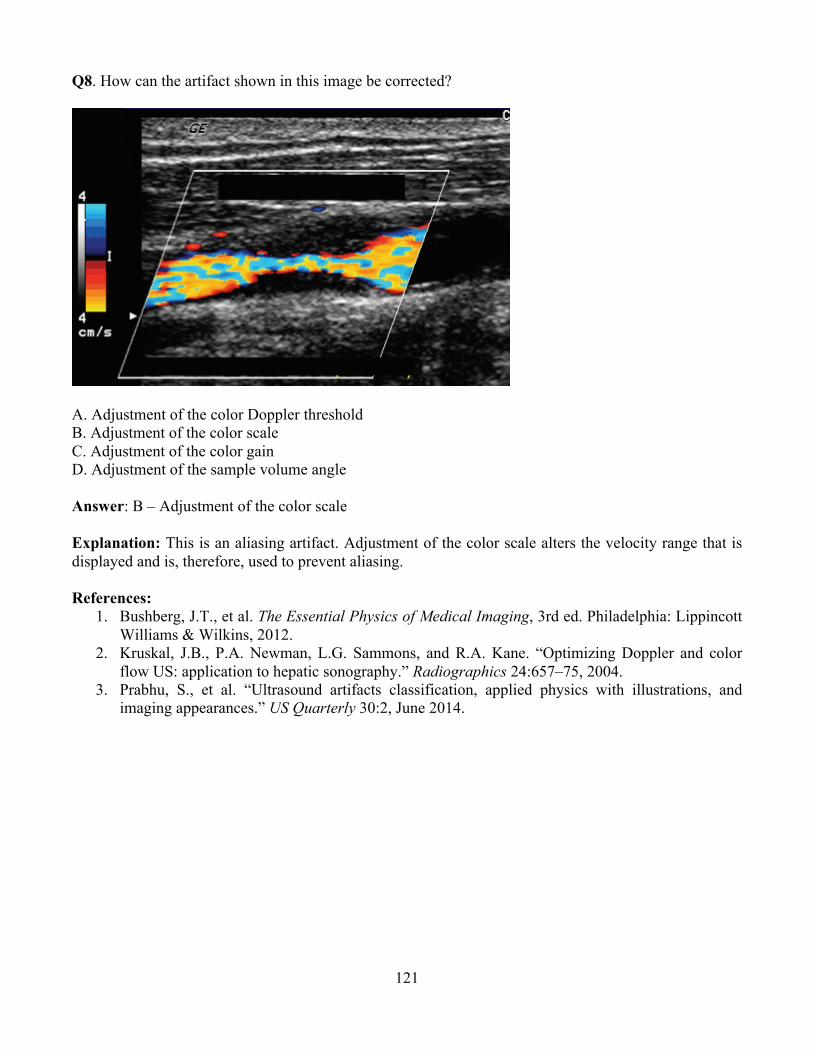
121
Q8. How can the artifact shown in this image be corrected?
A. Adjustment of the color Doppler threshold B. Adjustment of the color scale C. Adjustment of the color gain D. Adjustment of the sample volume angle Answer: B – Adjustment of the color scale
Explanation: This is an aliasing artifact. Adjustment of the color scale alters the velocity range that is displayed and is, therefore, used to prevent aliasing.
References: 1. Bushberg, J.T., et al. The Essential Physics of Medical Imaging, 3rd ed. Philadelphia: Lippincott
Williams & Wilkins, 2012. 2. Kruskal, J.B., P.A. Newman, L.G. Sammons, and R.A. Kane. “Optimizing Doppler and color
flow US: application to hepatic sonography.” Radiographics 24:657–75, 2004. 3. Prabhu, S., et al. “Ultrasound artifacts classification, applied physics with illustrations, and
imaging appearances.” US Quarterly 30:2, June 2014.
122
Q9. In Doppler ultrasound, what angle is within the preferred range to obtain accurate velocity measurements? A. 15 degrees B. 25 degrees C. 55 degrees D. 75 degrees Answer: C – 55 degrees Explanation: Within a 45 to 60-degree angle, a linear relation exists between the Doppler shift and velocity. Outside this range the velocity estimate will be inaccurate. References:
1. Bushberg, J.T., et al. The Essential Physics of Medical Imaging, 3rd ed. Philadelphia: Lippincott Williams & Wilkins, 2012.
2. Kruskal, J.B., P.A. Newman, L.G. Sammons, R.A. Kane. “Optimizing Doppler and color flow US: application to hepatic sonography.” Radiographics 24:657–75, 2004.
Q10. Determine the attenuation of a 5 MHz ultrasound beam in soft tissue travelling round trip to a depth of 2 cm assuming 100% reflection at the interface. A. 3 dB B. 5 dB C. 7.5 dB D. 10 dB Answer: D – 10 dB Explanation: Using the rule of the thumb for attenuation in soft tissue of 0.5 dB/cm/MHz, the attenuation would be:
0.5 dB/cm/Hz × 5 MHz × 4 cm = 10 dB References:
1. Bushberg, J.T., et al. The Essential Physics of Medical Imaging, 3rd ed. Philadelphia: Lippincott Williams & Wilkins, 2012.
2. Hedrick, P., et al. Ultrasound Physics and Instrumentation, 4th ed. Mosby, 2005.

123
Q11. What do the changes in brightness of the spectral Doppler waveform shown in the image below represent?
A. Changes blood velocity B. Variations in signal intensity C. Pulsatile flow D. Larger calculated Doppler shift Answer: B – Variations in signal intensity Explanation: In spectral Doppler, changes in blood velocity calculated from the Doppler shift are displayed along the vertical axis and time along the horizontal axis. The brightness of the grayscale or color displayed at a particular point in time represents the intensity of the Doppler signal, which is proportional to the number of blood cells moving at the displayed velocity. References:
1. Bushberg, J.T., et al. The Essential Physics of Medical Imaging, 3rd ed. Philadelphia: Lippincott Williams & Wilkins, 2012.
2. Hedrick, P., et al. Ultrasound Physics and Instrumentation, 4th ed. Mosby, 2005.
124
Module 14: MRI
After completing this module, the resident should be able to apply the “Fundamental Knowledge” and “Clinical Applications” learned from the module to example tasks, such as those found in “Clinical Problem-solving.” Fundamental Knowledge:
1. Describe the properties of magnetism and how materials react to and interact with magnetic fields.
2. Describe how the magnetic resonance signal is created. 3. Describe magnet designs and typical magnetic field strengths employed for clinical imaging. 4. Define the physical properties of a material that determine the MR signal. 5. Compare the basic pulse sequences used to produce contrast between tissues in MRI. 6. List the components of an MR system and how they are used. 7. Describe how spatial localization is achieved in MRI. 8. Review the principles of k-space generation and describe how to “fill k-space” to optimize signal
strength (signal-to-noise ratio) or acquisition time. 9. Describe how T1, T2, proton density, and T2* contrast can be achieved in MRI. 10. Explain how secondary tissue properties like diffusion, perfusion, and flow can be distinguished
in MRI. 11. Distinguish between phase contrast, 2D, and 3D time of flight MRA. 12. Review the important concepts of functional MRI. 13. Describe the types of contrast agents used in MR and how they affect the signal relative to the
pulse sequence used. 14. Identify how image acquisition parameters impact image quality, tissue contrast, and acquisition
time. 15. Identify the source and appearance of MRI artifacts. 16. Review the safety and bioeffects of concern in MR systems.
Clinical Application:
1. Determine how the magnetic properties of a material affect the overall signal obtained in an MR image.
2. Identify the most appropriate pulse sequences for a specific diagnostic task. 3. Describe contrast-induced nephropathy and methods to reduce risk of such an outcome. 4. Describe the risks and benefits when MR imaging is used on a pregnant patient. 5. Discuss clinical situations in which MRI procedures are contra-indicated. 6. Determine the source of an artifact, and describe a change or changes to the acquisition
parameters to reduce the appearance of the artifact. Clinical Problem-solving:
1. How do different field strength systems change the acquisition parameters and image quality in MRI?
2. What MR parameter relates to biosafety and what does it depend on?
Curriculum: 14.1. Magnetism and Magnetic Fields
14.1.1. Magnetic Susceptibility 14.1.2. Types of Magnetic Materials

125
14.1.3. Magnetic Fields (B) 14.1.3.1. Units for Magnetic Field Strength 14.1.3.2. Magnetic Dipole 14.1.3.3. Magnetic Moment 14.1.3.4. Nuclear Magnetism (Protons and Biologically Relevant Nuclei)
14.1.4. Magnetic Moment Interaction with an External Field (B0) 14.1.4.1. Alignment (Low-energy and High-energy States) 14.1.4.2. Precession 14.1.4.3. Larmor Equation and Frequency
14.1.5. Net Magnetization Due to B0 14.1.5.1. Equilibrium Magnetization (M0) 14.1.5.2. Longitudinal Magnetization (Mz) 14.1.5.3. Transverse Magnetization (Mxy) 14.1.5.4. Proton Density (Spin-density) 14.1.5.5. Field Strength Dependence
14.2. Nuclear Magnetic Resonance and Excitation 14.2.1. Radiofrequency (RF) Field (B1) 14.2.2. Flip Angle 14.2.3. Free-induction Decay (FID)
14.3. Magnetic Resonance Signal Properties 14.3.1. Proton Density (Spin Density) 14.3.2. T2 (Transverse) Relaxation
14.3.2.1. Intrinsic Spin-spin Interactions 14.3.2.2. Transverse Magnetization Decay 14.3.2.3. Typical Tissue T2 Values
14.3.3. T2* Relaxation 14.3.3.1. Dependence on Field Inhomogeneity 14.3.3.2. Susceptibility Induced Dephasing (e.g., Tissue-air Interfaces)
14.3.4. T1 (Longitudinal) Relaxation 14.3.4.1. Spin-lattice Interactions 14.3.4.2. Longitudinal Recovery 14.3.4.3. Typical Tissue T1 values 14.3.4.4. Field-strength Dependence
14.4. Pulse Sequences and Contrast Mechanisms 14.4.1. Spin-echo (SE) Pulse Sequence
14.4.1.1. Pulse Sequence Basics (Timing Diagrams) 14.4.1.2. Echo Time (TE) 14.4.1.3. Repetition Time (TR) 14.4.1.4. SE Signal Intensity Dependence on TE and TR 14.4.1.5. SE Contrast (T1, Proton Density, T2)
14.4.2. Inversion-recovery Spin-echo Pulse Sequence 14.4.2.1. Inversion Time (TI) 14.4.2.2. Short (Inversion) Time Inversion-recovery (STIR) 14.4.2.3. Fluid-attenuated Inversion-recovery (FLAIR)
14.4.3. Gradient-echo Pulse Sequence 14.4.3.1. Different Types of Gradient-echo Pulse Sequence (Steady State, Spoiled) 14.4.3.2. Advantages and Disadvantages 14.4.3.3. Gradient-echo, Signal-intensity, and Effect of Flip Angle
126
14.4.3.4. Cumulative Phase Correction by Crusher Gradient and RF-pulse Spoiling 14.4.3.5. Gradient Echo Contrast (T2*/T1, T2*, and T1 Weighting)
14.4.4. Echo-planar (EPI) 14.4.4.1. Single-shot Method 14.4.4.2. Multi-shot Method 14.4.4.3. T2* Contrast
14.4.5. Fast or Turbo Spin-echo 14.4.5.1. Echo Train Length 14.4.5.2. Echo Spacing 14.4.5.3. Effective TE 14.4.5.4. Contrast (T2 and T1 Weighting)
14.4.6. Specifications of Pulse Sequences 14.4.6.1. Factors that Affect Acquisition Time 14.4.6.2. Multi-slice Acquisition 14.4.6.3. 2D and 3D Acquisitions 14.4.6.4. Timing Diagrams 14.4.6.5. Flow Compensation Methods
14.5. MR Instrumentation 14.5.1. Static Magnetic Field (B0) Systems
14.5.1.1. Types of Magnets 14.5.1.2. Fringe Field 14.5.1.3. Main Magnetic Field Shielding (Fringe Field Reduction)
14.5.2. Gradient Field Subsystem 14.5.2.1. Gradient Coil Geometry (X,Y, and Z) 14.5.2.2. Gradient Strength (mT/m) 14.5.2.3. Slew-rate: Specification (mT/m/s), Eddy Currents, and Effects on
Gradient Performance 14.5.3. Shim Coils 14.5.4. RF Transmitter (B1) Subsystem
14.5.4.1. RF-pulse Bandwidth 14.5.4.2. Control of Flip Angle
14.5.5. RF Receiver Subsystem 14.5.5.1. Receive Bandwidth 14.5.5.2. Parallel (and Phased-array) Receive Channels
14.5.6. RF Coils 14.5.6.1. Transmit-and-receive Coils 14.5.6.2. Volume vs. Surface Coils 14.5.6.3. Receive-only Coils 14.5.6.4. Quadrature vs. Linear Coils 14.5.6.5. Birdcage Coils 14.5.6.6. Phased-array Coils
14.6. Spatial Localization 14.6.1. Slice Selection 14.6.2. Phase Encoding 14.6.3. Frequency Encoding
14.7. Two-dimensional Fourier Transform (2DFT) Image Reconstruction 14.7.1. k-Space Description 14.7.2. Methods of “Filling k-Space”
127
14.8. Image Characteristics 14.8.1. Factors Affecting Spatial Resolution
14.8.1.1. Field-of-view (FOV) 14.8.1.2. Receiver (Sampling) Bandwidth 14.8.1.3. Slice Thickness 14.8.1.4. Image Matrix Dimensions
14.8.2. Factors Affecting Signal-to-noise Ratio (SNR) 14.8.2.1. Voxel Size 14.8.2.2. Signal Averages 14.8.2.3. Receiver (Sampling) Bandwidth 14.8.2.4. Magnetic Field Strength 14.8.2.5. Slice “Cross-talk” 14.8.2.6. Reconstruction Algorithms 14.8.2.7. RF Coils 14.8.2.8. Pulse Sequence Specific Effects 14.8.2.9. Parallel Imaging Acceleration Factors 14.8.2.10. Saturation and Flow
14.8.3. Tradeoffs among Spatial Resolution, SNR, and Acquisition Time 14.8.4. Factors Affecting Image Contrast
14.8.4.1. Proton Density, T1, T2 14.8.4.2. Susceptibility 14.8.4.3. Blood Flow and Blood Products
14.9. Paramagnetic and Other Contrast Agents 14.10. Suppression Methods and Effects
14.10.1. Spatial 14.10.2. Chemical (e.g., Fat, Silicone)
14.10.2.1. Hybrid Sequences (SPIR, SPAIR) 14.10.3. Inversion Recovery 14.10.4. Dixon Method and Opposed Phase
14.11. Special Acquisition Techniques 14.11.1. Angiography
14.11.1.1. Effect of Blood Flow on Signal Intensity 14.11.1.2. Time-of-flight (2D and 3D) Techniques 14.11.1.3. Phase-contrast Techniques 14.11.1.4. Contrast-agent Enhanced MRA Techniques
14.11.2. Diffusion, Perfusion, and Neuro Imaging 14.11.2.1. Basic Principles 14.11.2.2. Diffusion-weighted Imaging (DWI) Techniques 14.11.2.3. Apparent Diffusion Coefficient (ADC) 14.11.2.4. Diffusion-tensor Imaging (DTI) Techniques
14.11.3. Functional MRI (fMRI) 14.11.3.1. Blood Oxygen Level-dependent (BOLD) Principles 14.11.3.2. Clinical Applications
14.11.4. Magnetization Transfer Contrast (MTC) 14.11.4.1. Basic Principles 14.11.4.2. Clinical Applications
14.11.5. Parallel Imaging MRI 14.11.5.1. Basic Principles
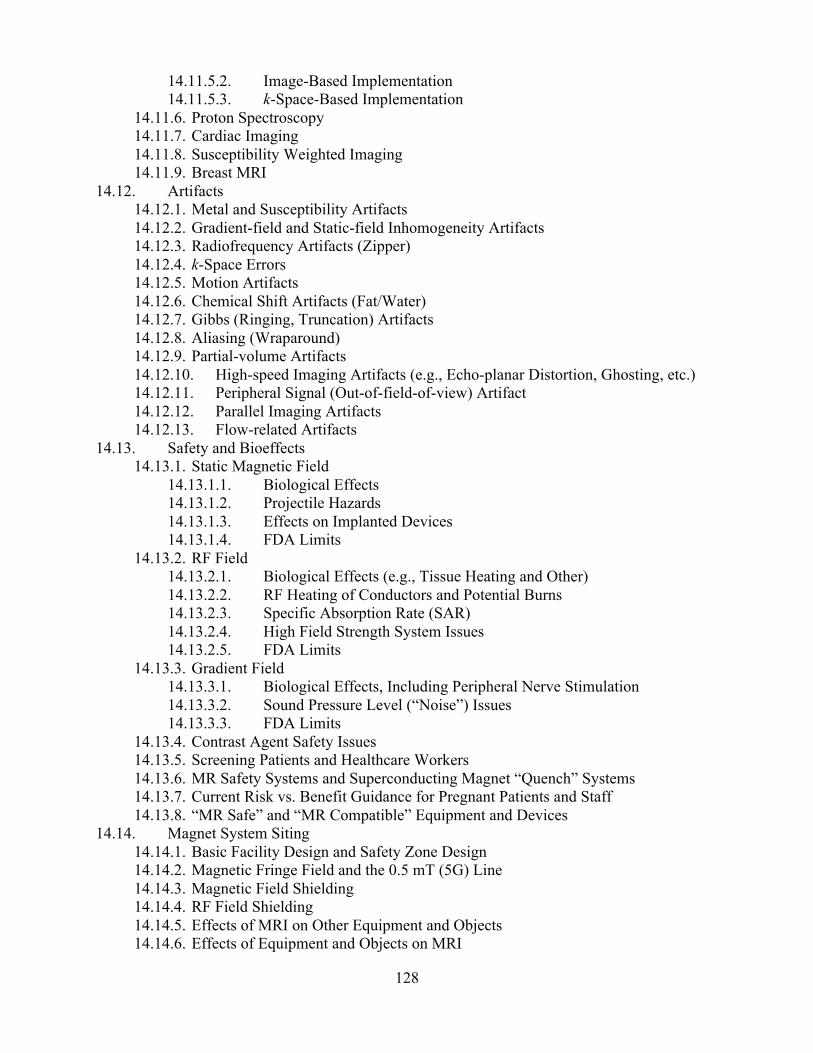
128
14.11.5.2. Image-Based Implementation 14.11.5.3. k-Space-Based Implementation
14.11.6. Proton Spectroscopy 14.11.7. Cardiac Imaging 14.11.8. Susceptibility Weighted Imaging 14.11.9. Breast MRI
14.12. Artifacts 14.12.1. Metal and Susceptibility Artifacts 14.12.2. Gradient-field and Static-field Inhomogeneity Artifacts 14.12.3. Radiofrequency Artifacts (Zipper) 14.12.4. k-Space Errors 14.12.5. Motion Artifacts 14.12.6. Chemical Shift Artifacts (Fat/Water) 14.12.7. Gibbs (Ringing, Truncation) Artifacts 14.12.8. Aliasing (Wraparound) 14.12.9. Partial-volume Artifacts 14.12.10. High-speed Imaging Artifacts (e.g., Echo-planar Distortion, Ghosting, etc.) 14.12.11. Peripheral Signal (Out-of-field-of-view) Artifact 14.12.12. Parallel Imaging Artifacts 14.12.13. Flow-related Artifacts
14.13. Safety and Bioeffects 14.13.1. Static Magnetic Field
14.13.1.1. Biological Effects 14.13.1.2. Projectile Hazards 14.13.1.3. Effects on Implanted Devices 14.13.1.4. FDA Limits
14.13.2. RF Field 14.13.2.1. Biological Effects (e.g., Tissue Heating and Other) 14.13.2.2. RF Heating of Conductors and Potential Burns 14.13.2.3. Specific Absorption Rate (SAR) 14.13.2.4. High Field Strength System Issues 14.13.2.5. FDA Limits
14.13.3. Gradient Field 14.13.3.1. Biological Effects, Including Peripheral Nerve Stimulation 14.13.3.2. Sound Pressure Level (“Noise”) Issues 14.13.3.3. FDA Limits
14.13.4. Contrast Agent Safety Issues 14.13.5. Screening Patients and Healthcare Workers 14.13.6. MR Safety Systems and Superconducting Magnet “Quench” Systems 14.13.7. Current Risk vs. Benefit Guidance for Pregnant Patients and Staff 14.13.8. “MR Safe” and “MR Compatible” Equipment and Devices
14.14. Magnet System Siting 14.14.1. Basic Facility Design and Safety Zone Design 14.14.2. Magnetic Fringe Field and the 0.5 mT (5G) Line 14.14.3. Magnetic Field Shielding 14.14.4. RF Field Shielding 14.14.5. Effects of MRI on Other Equipment and Objects 14.14.6. Effects of Equipment and Objects on MRI

129
14.15. Accreditation and Quality Improvement

130
Example Q&A:
Q1. What artifact is present in this MR image?
A. Patient motion B. Aliasing C. Truncation D. Flow artifacts Answer: C – Truncation Explanation: Truncation artifacts are also known as Gibbs-ringing artifacts. They typically present as multiple parallel lines adjacent to high-contrast interfaces. Those artifacts come from using a finite number of sampling points in the frequency or phase-encoding direction in the image acquisition. The Fourier transform of a signal will result in overshoot and undershoot oscillations (ringing) when a sharp border is encountered in the image. The ringing could happen in both the frequency and phase directions. However, it is commonly seen in the phase direction since phase step usually is reduced to save scan time. The solution for this artifact is to increase the imaging matrix, which usually will increase scan time and reduce SNR.
References: 1. Zhuo, J. and R.P. Gullapalli. AAPM/RSNA Physics Tutorial for Residents, MR Artifacts, Safety
and Quality Control. RadioGraphics 26:275–297, 2006. http://pubs.rsna.org/doi/full/10.1148/rg.261055134
2. Elster, A.D. and J.H. Burdette. Questions and Answers in Magnetic Resonance Imaging, 2nd ed. St. Louis: Mosby, 2001.
3. Edelman, R.R, J.R. Hesselink, M.B. Zlatkin, and J.V. Crues, eds. Clinical Magnetic Resonance Imaging, 3rd ed., v1. Philadelphia: Saunders Elsevier, 2006.

131
Q2. How would you correct the following wrap-around artifact?
A. Increase TR B. Increase TE C. Swap phase and frequency direction D. Increase FOV Answer: D – Increase FOV
Explanation: Aliasing artifacts happen because the size of the object is larger than the FOV. It is a consequence of Nyquist theory: the sampling rate has to be at least twice that of the highest frequency expected, faliased = ftrue – 2fNyquist. This could happen in frequency and phase direction, but it is often seen in the phase-encoding direction because in frequency direction, this is avoided by increasing the sampling and using high-pass filters. Using larger FOV will remove aliasing at the cost of spatial resolution. References:
1. Arena, L., H. Morehouse, and J. Safir. “MR Imaging Artifacts that Simulate Disease: How to Recognize and Eliminate Them.” Radiographics 15:1373–1394, 1995. http://pubs.rsna.org/doi/pdf/10.1148/radiographics.15.6.8577963
2. Elster, A.D. and J.H. Burdette. Questions and Answers in Magnetic Resonance Imaging, 2nd ed. St. Louis: Mosby, 2001.
3. Edelman, R.R, J.R. Hesselink, M.B. Zlatkin, and J.V. Crues, eds. Clinical Magnetic Resonance Imaging, 3rd ed., v1. Philadelphia: Saunders Elsevier, 2006.
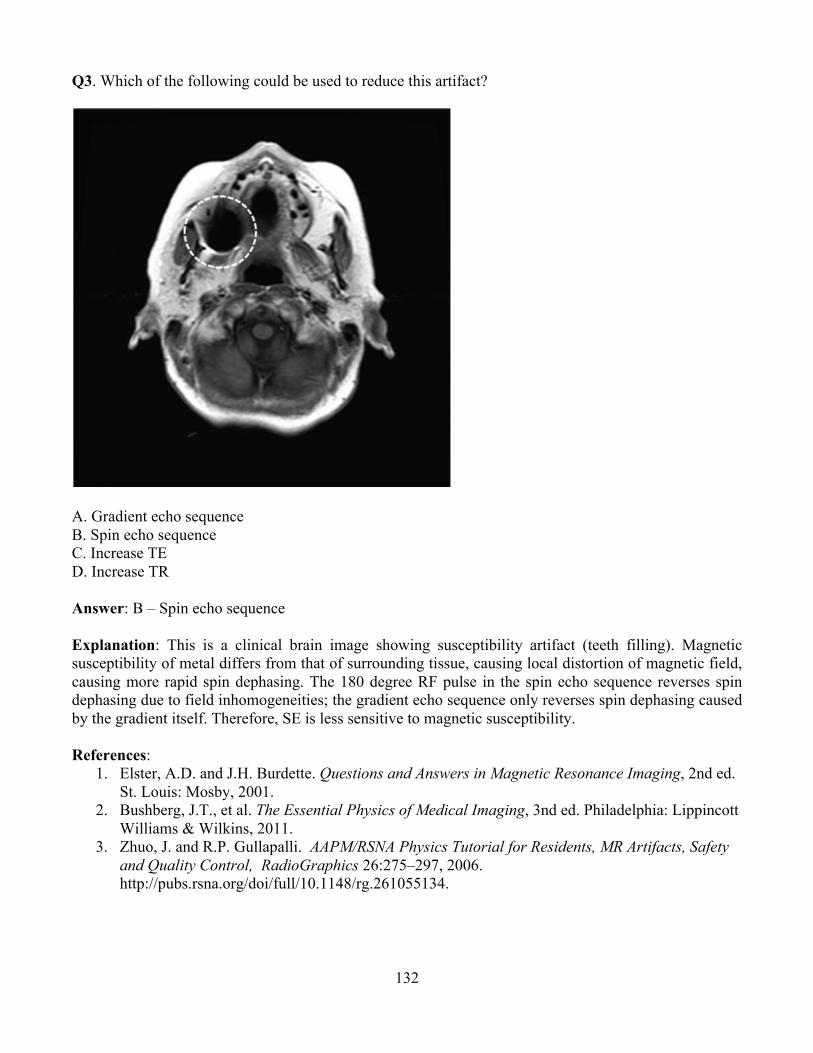
132
Q3. Which of the following could be used to reduce this artifact?
A. Gradient echo sequence B. Spin echo sequence C. Increase TE D. Increase TR Answer: B – Spin echo sequence Explanation: This is a clinical brain image showing susceptibility artifact (teeth filling). Magnetic susceptibility of metal differs from that of surrounding tissue, causing local distortion of magnetic field, causing more rapid spin dephasing. The 180 degree RF pulse in the spin echo sequence reverses spin dephasing due to field inhomogeneities; the gradient echo sequence only reverses spin dephasing caused by the gradient itself. Therefore, SE is less sensitive to magnetic susceptibility. References:
1. Elster, A.D. and J.H. Burdette. Questions and Answers in Magnetic Resonance Imaging, 2nd ed. St. Louis: Mosby, 2001.
2. Bushberg, J.T., et al. The Essential Physics of Medical Imaging, 3nd ed. Philadelphia: Lippincott Williams & Wilkins, 2011.
3. Zhuo, J. and R.P. Gullapalli. AAPM/RSNA Physics Tutorial for Residents, MR Artifacts, Safety and Quality Control, RadioGraphics 26:275–297, 2006. http://pubs.rsna.org/doi/full/10.1148/rg.261055134.
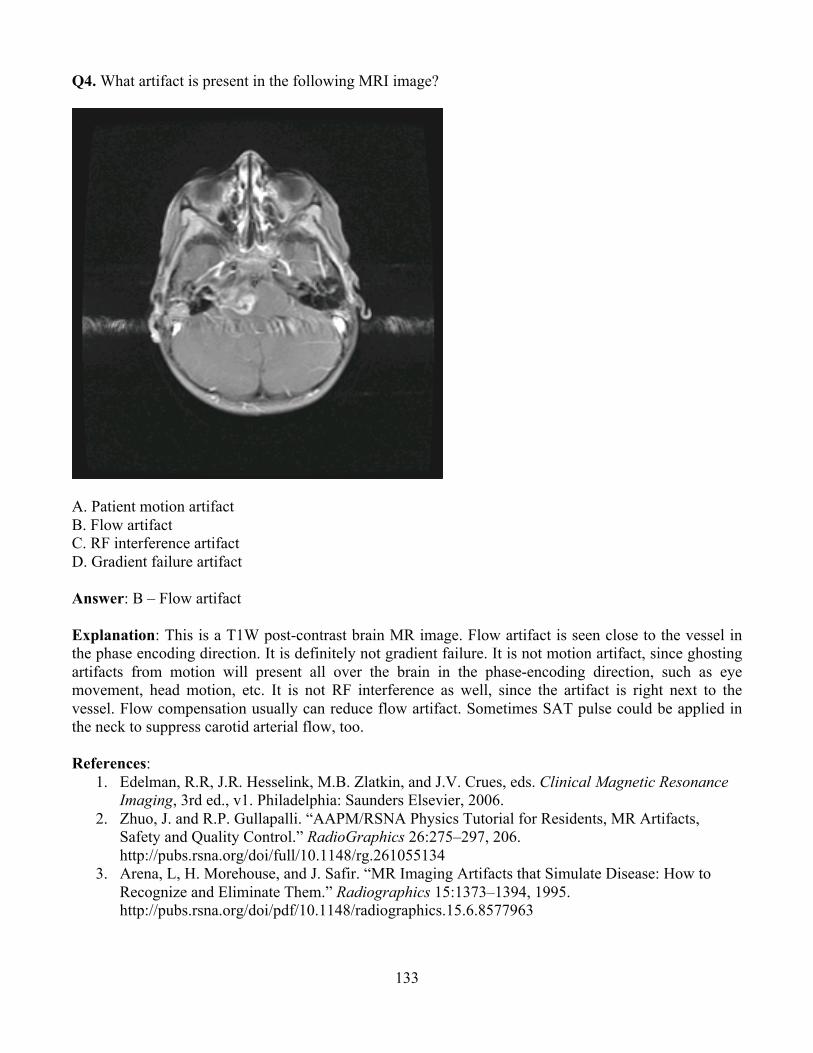
133
Q4. What artifact is present in the following MRI image?
A. Patient motion artifact B. Flow artifact C. RF interference artifact D. Gradient failure artifact Answer: B – Flow artifact Explanation: This is a T1W post-contrast brain MR image. Flow artifact is seen close to the vessel in the phase encoding direction. It is definitely not gradient failure. It is not motion artifact, since ghosting artifacts from motion will present all over the brain in the phase-encoding direction, such as eye movement, head motion, etc. It is not RF interference as well, since the artifact is right next to the vessel. Flow compensation usually can reduce flow artifact. Sometimes SAT pulse could be applied in the neck to suppress carotid arterial flow, too. References:
1. Edelman, R.R, J.R. Hesselink, M.B. Zlatkin, and J.V. Crues, eds. Clinical Magnetic Resonance Imaging, 3rd ed., v1. Philadelphia: Saunders Elsevier, 2006.
2. Zhuo, J. and R.P. Gullapalli. “AAPM/RSNA Physics Tutorial for Residents, MR Artifacts, Safety and Quality Control.” RadioGraphics 26:275–297, 206. http://pubs.rsna.org/doi/full/10.1148/rg.261055134
3. Arena, L, H. Morehouse, and J. Safir. “MR Imaging Artifacts that Simulate Disease: How to Recognize and Eliminate Them.” Radiographics 15:1373–1394, 1995. http://pubs.rsna.org/doi/pdf/10.1148/radiographics.15.6.8577963

134
Q5. What artifact is present in the following MR image?
A. Motion artifact B. Gibbs ringing artifact C. Susceptibility artifact D. Chemical shift artifact Answer: D – Chemical shift artifact
Explanation: Chemical shift artifacts present in this coronal T1W abdominal image. Protons in the water and protons in fat have different resonance frequencies (3.4 ppm difference). This corresponds to a 220 Hz or 440 Hz difference at 1.5T or 3.0T. This shift in Larmor frequency is called chemical shift. It can cause artifacts in the frequency encoding direction. The pixel shift is inversely proportional to the receiver frequency, the bright shift corresponds to the sum of water and fat signal and the dark shift corresponds to the subtraction of water and fat signal. References:
1. Zhuo, J. and R.P. Gullapalli. “AAPM/RSNA Physics Tutorial for Residents, MR Artifacts, Safety and Quality Control.” RadioGraphics 26:275–297, 2006. http://pubs.rsna.org/doi/full/10.1148/rg.261055134
2. Arena, L., H. Morehouse, and J. Safir. “MR Imaging Artifacts that Simulate Disease: How to Recognize and Eliminate Them.” Radiographics 15:1373–1394, 1995. http://pubs.rsna.org/doi/pdf/10.1148/radiographics.15.6.8577963
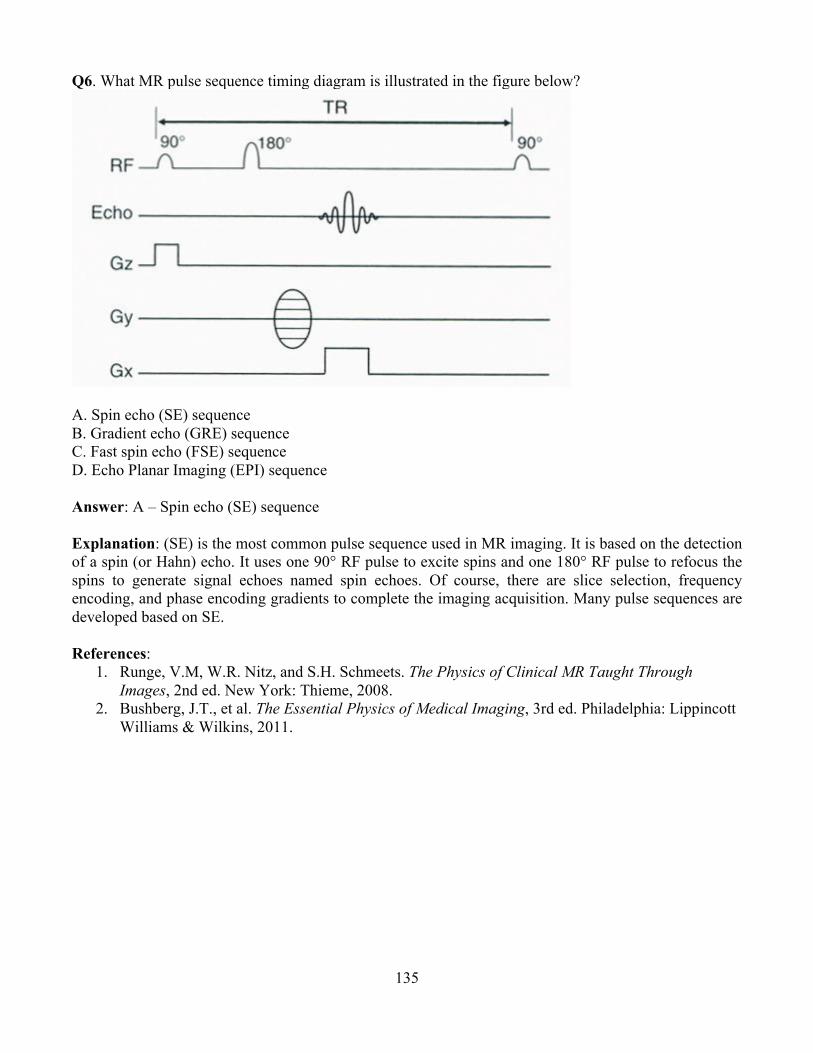
135
Q6. What MR pulse sequence timing diagram is illustrated in the figure below?
A. Spin echo (SE) sequence B. Gradient echo (GRE) sequence C. Fast spin echo (FSE) sequence D. Echo Planar Imaging (EPI) sequence Answer: A – Spin echo (SE) sequence Explanation: (SE) is the most common pulse sequence used in MR imaging. It is based on the detection of a spin (or Hahn) echo. It uses one 90° RF pulse to excite spins and one 180° RF pulse to refocus the spins to generate signal echoes named spin echoes. Of course, there are slice selection, frequency encoding, and phase encoding gradients to complete the imaging acquisition. Many pulse sequences are developed based on SE. References:
1. Runge, V.M, W.R. Nitz, and S.H. Schmeets. The Physics of Clinical MR Taught Through Images, 2nd ed. New York: Thieme, 2008.
2. Bushberg, J.T., et al. The Essential Physics of Medical Imaging, 3rd ed. Philadelphia: Lippincott Williams & Wilkins, 2011.

136
Q7. Using a spin-echo pulse sequence, which combination of TE and TR can be used to generate a T1-weighted image of the brain?
A. Short TR, Short TE B. Long TR, Long TE C. Short TR, Long TE D. Long TR, Short TE Answer: A – Short TR, Short TE Explanation: For spin echo sequence, TR primarily controls the amount of T1-weighting, whereas TE primarily controls the amount of T2-weighting. The signal is proportional to (1-e-TR/T1) ´ e-TE/T2. Therefore, a relatively short TR and very short TE should be used (so that the T2 effect can be ignored) to generate T1W image. Long TR and long TE generate T2-weighted image. Long TR and short TE generate proton density image. References:
1. Runge, V.M, W.R. Nitz, and S.H. Schmeets. The Physics of Clinical MR Taught Through Images, 2nd ed. New York: Thieme, 2008.
2. Bushberg, J.T., et al. The Essential Physics of Medical Imaging, 3nd ed. Philadelphia: Lippincott Williams & Wilkins, 2011.

137
Q8. Which of the following quantities is typically used to assess the potential for RF heating from an MRI scan? A. Effective dose (mSv) B. Absorbed dose (mGy) C. Specific absorption rate (W/kg) D. Thermal index (TI) Answer: C – Specific absorption rate (W/kg) Explanation: The Specific Absorption Rate (SAR) is defined as the RF power absorbed per unit of mass of an object, and it is measured in watts per kilogram. The SAR describes the potential for heating of the patient's tissue due to the application of the RF energy necessary to produce the MR signal. It increases with field strength, radio frequency power, duty cycle, transmitter coil type, and body size. The heating could cause tissue damage. Therefore, there are limitations for head coil, body coil, and patient size, as well as scan time. References:
1. Bushberg, J.T., et al. The Essential Physics of Medical Imaging, 3nd ed. Philadelphia: Lippincott Williams & Wilkins, 2011.
2. Physics of MRI Safety. http://www.aapm.org/meetings/amos2/pdf/59-17207-59975-979.pdf.

138
Q9. By what factor is time reduced when scanning with an echo train length of four in FSE compared to a single echo conventional SE sequence?
A. Time reduced by 1/4 B. Time reduced by 1/3 C. Time reduced by 3/4 D. Time is not reduced Answer: A – Time reduced by 1/4 Explanation: Time reduction is proportional to echo train length for FSE sequence compared to conventional SE sequence. An echo train of four reduces time by a factor of four. That means the k-space is filled four times faster than the SE sequence. References:
1. Runge, V.M, W.R. Nitz, and S.H. Schmeets. The Physics of Clinical MR Taught Through Images, 2nd ed. New York: Thieme, 2008.
2. Bushberg, J.T., et al. The Essential Physics of Medical Imaging, 3rd ed. Philadelphia: Lippincott Williams & Wilkins, 2011.
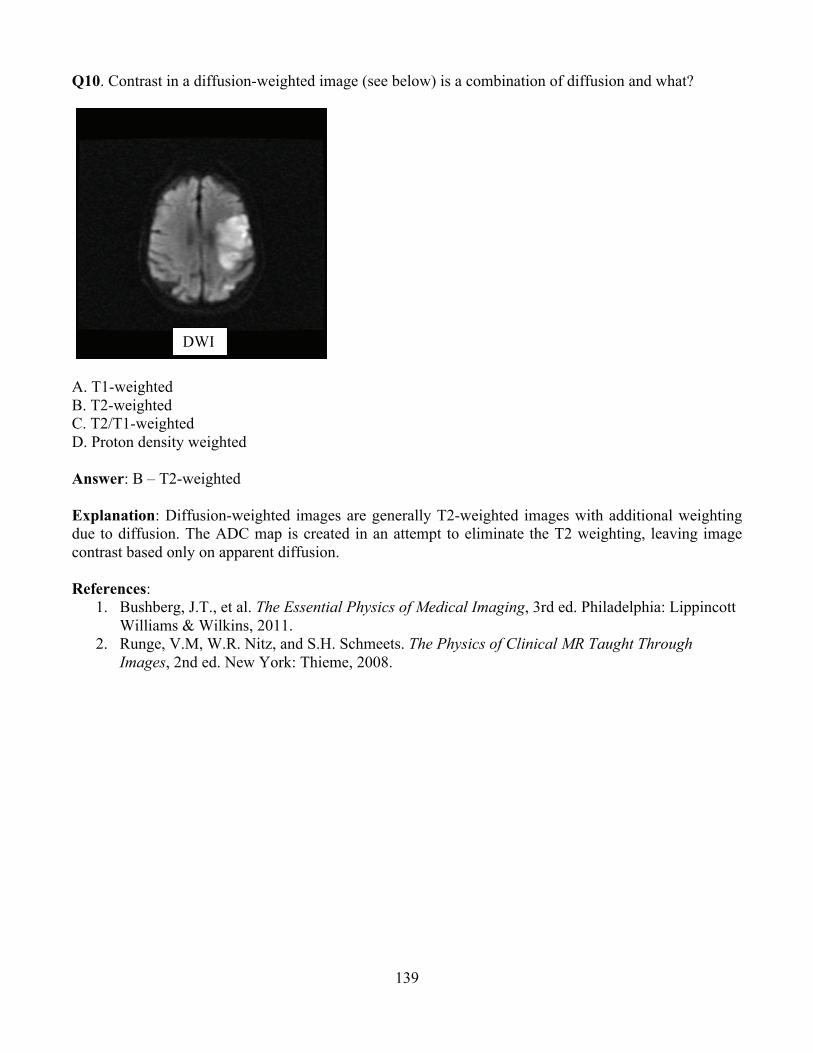
139
Q10. Contrast in a diffusion-weighted image (see below) is a combination of diffusion and what?
A. T1-weighted B. T2-weighted C. T2/T1-weighted D. Proton density weighted Answer: B – T2-weighted Explanation: Diffusion-weighted images are generally T2-weighted images with additional weighting due to diffusion. The ADC map is created in an attempt to eliminate the T2 weighting, leaving image contrast based only on apparent diffusion. References:
1. Bushberg, J.T., et al. The Essential Physics of Medical Imaging, 3rd ed. Philadelphia: Lippincott Williams & Wilkins, 2011.
2. Runge, V.M, W.R. Nitz, and S.H. Schmeets. The Physics of Clinical MR Taught Through Images, 2nd ed. New York: Thieme, 2008.
DWI

140
Q11. Identify the following MR image acquired with long TR and long TE.
A. T1W L-spine image B. T2W L-spine image with fat suppression C. Proton density weighted L-spine image with fat suppression D. T1W T-spine image Answer: B – T2W L-spine MR image with fat suppression Explanation: This is a T2-weighted image since it is acquired using long TR and long TE. Fat is hypointense due to suppression. Reference:
1. Bushberg, J.T., et al. The Essential Physics of Medical Imaging, 3rd ed. Philadelphia: Lippincott Williams & Wilkins, 2011.

141
Q12. The following is a typical k-space (left) and its corresponding image (right) by inverse Fourier Transform (FT). Which part of the k-space controls the image sharpness?
A. Center of k-space B. Peripheral part of k-space C. All of the k-space D. Half of the k-space Answer: B – Peripheral part of the k-space Explanation: MR signal is acquired in the frequency domain (time domain) and stored in a k-space matrix. Its inverse Fourier Transform generates the image. The center of the k-space controls the signal-to-noise ratio (SNR) and contrast-to-noise ratio (CNR). The periphery of k-space contributes to the high frequency detail of the image. Reference:
1. Bushberg, J.T., et al. The Essential Physics of Medical Imaging, 3rd ed. Philadelphia: Lippincott Williams & Wilkins, 2011.
142
Module 15: Nuclear Medicine After completing this module, the radiology resident should be able to apply the “Fundamental Knowledge” and “Clinical Applications” learned from the module to example tasks, such as those found in “Clinical Problem-solving.” Fundamental Knowledge:
1. Describe the structure of matter, modes of radioactive decay, particle and photon emissions, and interactions of radiation with matter.
2. Describe the instrumentation, major components, and principles of operation for instruments commonly used for detecting, measuring, and imaging radioactivity.
3. Describe the instrumentation and software required for image generation and display. 4. Describe recommended instrumentation QC tests and test frequencies. 5. Describe the factors that affect image quality. 6. Describe radionuclide production and the principles of radiochemistry. 7. Identify common radionuclides and their characteristics, such as energy, half-life, and modes
of decay. 8. Identify commonly used radiopharmaceuticals, indications for use, and appropriate adult and
pediatric dosages. 9. Describe radiopharmaceutical QC tests and test frequencies. 10. Describe the methods of determining organ dose and whole body dose to patients. Describe
radiopharmaceutical bio-distribution and the impact on radiation dose and risk. 11. Describe probability distributions, nuclear counting statistics, and statistics applicable to
nuclear imaging. 12. Describe the methods of image processing, and quality control of image acquisition and
processing. 13. Describe the required radiation protection practices for implementing laboratory tests,
diagnostic imaging procedures, and therapeutic applications of radiopharmaceuticals. Clinical Application:
1. Compare ideal characteristics of imaging versus therapeutic radiopharmaceuticals. 2. Determine the radiopharmaceutical activity administered to adults and pediatric patients for
various imaging procedures. 3. Describe common nuclear medicine image artifacts, and methods to minimize them. 4. Describe the types and uses of common nuclear medicine instrumentation. 5. Describe how the selection of image acquisition parameters, including collimator selection,
affects image quality.
Clinical Problem-solving: 1. How could a miscalibrated photomultiplier tube affect a nuclear medicine study? 2. What is the appropriate imaging order for multiple patient examinations including x-ray, US,
CT, MRI, and multiple nuclear medicine studies? 3. What is the impact of contrast agents used in non-nuclear imaging procedures on the nuclear
medicine image? 4. For what period of time should a lactating patient be instructed to interrupt or cease
breastfeeding following a radiopharmaceutical imaging or therapeutic procedure? 5. What is the risk of performing a nuclear imaging or therapeutic procedure on a pregnant
patient? Which radiopharmaceuticals cross the placenta?

143
6. What are the typical external dose rates from patients who have been administered radiopharmaceuticals?
7. How would you conduct an organ dose calculation for a patient administered 20 mCi of 99mTcMDP for a bone scan or 4 mCi of MAA for a perfusion lung scan?
8. What is the radiation dose and risk from various nuclear medicine procedures? How do they compare to other types of radiologic exams such as CT and fluoroscopy?
9. What is the appropriate collimator to use when imaging with 99mTc? 10. What factors affect the reliability and accuracy of calculated standard uptake values in PET
imaging? Curriculum: 15. Nuclear Medicine
15.1. Radionuclide Decay 15.1.1. Radioactivity
15.1.1.1. Definition 15.1.1.2. Units 15.1.1.3. Decay Constant 15.1.1.4. Decay Equation 15.1.1.5. Half-life (Physical, Biological and Effective) 15.1.1.6. Specific Activity
15.1.2. Nuclear Transformation 15.1.2.1. N/Z Ratio and Nuclear Stability 15.1.2.2. Beta (Negative Electron) Decay 15.1.2.3. Positron (Positive Electron) Decay 15.1.2.4. Electron Capture 15.1.2.5. Isomeric Transition 15.1.2.6. Alpha Decay 15.1.2.7. Internal Conversion 15.1.2.8. Nuclear Fission
15.1.3. Radioactive Equilibrium 15.1.3.1. Transient 15.1.3.2. Secular
15.2. Radioisotope Production 15.2.1. Linear Accelerator and Cyclotron 15.2.2. Reactor
15.2.2.1. Fission Products 15.2.2.2. Neutron-activation Products
15.2.3. Radionuclide Generators 15.2.3.1. 99Mo – 99mTc 15.2.3.2. Other (e.g.,82Sr – 82Rb PET) 15.2.3.3. Elution and Quality Control
15.3. Radiopharmaceuticals 15.3.1. Preparation 15.3.2. Range of Required Activities for Clinical Studies 15.3.3. Localization 15.3.4. Uptake, Distribution, and Decay 15.3.5. Quality Assurance and Quality Control Procedures
15.4. Radiation Detection Instrumentation

144
15.4.1. Gas-filled Detectors 15.4.1.1. Mechanisms of Operation 15.4.1.2. Applications and Limitations 15.4.1.3. Survey Meters (e.g., GM Counter, Ionization Chamber) 15.4.1.4. Dose Calibrator 15.4.1.5. Quality Control
15.4.2. Scintillation Detectors 15.4.2.1. Mechanisms of Operation 15.4.2.2. Applications and Limitations 15.4.2.3. Pulse-height Spectroscopy 15.4.2.4. Thyroid Probe 15.4.2.5. Well Counter 15.4.2.6. Survey Meter 15.4.2.7. Quality Control
15.4.3. Solid State Detectors and Intra-operative Probes 15.5. Scintillation Camera
15.5.1. Clinical Utilization 15.5.2. Camera Design
15.5.2.1. Crystal Parameters 15.5.2.2. Spatial Localization 15.5.2.3. Energy Discrimination 15.5.2.4. Camera Corrections
15.5.3. Collimator Types and Characteristics 15.5.3.1. Parallel Hole, Pinhole, and Other Geometries 15.5.3.2. Sensitivity 15.5.3.3. Resolution 15.5.3.4. Energy Specification (e.g., LEHR )
15.5.4. Image Acquisition 15.5.4.1. Static 15.5.4.2. Dynamic 15.5.4.3. Gated 15.5.4.4. List-mode
15.5.5. Image Processing 15.5.5.1. Normalization and Subtraction 15.5.5.2. Region of Interest (ROI) 15.5.5.3. Time–activity Curves 15.5.5.4. Spatial Filtering 15.5.5.5. Count Rate and Administered Activity Considerations
15.5.6. QC Measures of Performance (Extrinsic and Intrinsic) 15.5.6.1. Uniformity 15.5.6.2. Spatial Resolution 15.5.6.3. Energy Resolution 15.5.6.4. Spatial Linearity 15.5.6.5. Sensitivity 15.5.6.6. Count-rate Performance 15.5.6.7. Dead-time
15.5.7. Artifacts 15.5.7.1. Damaged or Broken Crystal

145
15.5.7.2. Nonuniformity 15.5.7.3. Malfunctioning Phototube 15.5.7.4. Improper Energy Peaking 15.5.7.5. Mechanical Separation of Coupling Elements 15.5.7.6. Damaged Collimators 15.5.7.7. Motion 15.5.7.8. Collimator Selection/Septal Penetration
15.5.8. Clinical Quantitative Imaging 15.5.8.1. Thyroid and Parathyroid 15.5.8.2. Renal 15.5.8.3. Cardiac (Ejection Fraction, Myocardial Perfusion) 15.5.8.4. Ventilation Perfusion (VQ) 15.5.8.5. Multi-energy Imaging 15.5.8.6. Gall Bladder (Ejection Fraction) 15.5.8.7. Gastric Emptying
15.6. Single Photon Emission Computed Tomography (SPECT) and SPECT/CT 15.6.1. Clinical Utilization 15.6.2. Mechanisms of Operation
15.6.2.1. Single- and Multi-head Units 15.6.2.2. Rotational Arc
15.6.2.2.1. Continuous Motion 15.6.2.2.2. Step-and-shoot 15.6.2.2.3. Noncircular Orbits 15.6.2.2.4. Number of Steps (Views and Frames)
15.6.2.3. Use of CT in SPECT Imaging 15.6.3. Attenuation Correction 15.6.4. Image Reconstruction and Filtering 15.6.5. Sensitivity and Resolution 15.6.6. Matrix Size 15.6.7. Count Rate and Administered Activity Considerations 15.6.8. Quality Assurance and Quality Control
15.6.8.1. QC Phantoms 15.6.8.2. Attenuation Correction 15.6.8.3. Center of Rotation 15.6.8.4. Uniformity 15.6.8.5. CT Registration
15.6.9. Artifacts 15.6.9.1. Attenuation Correction and Truncation 15.6.9.2. Center of Rotation 15.6.9.3. Non-uniformity 15.6.9.4. Bull’s Eye 15.6.9.5. Partial Volume 15.6.9.6. Motion 15.6.9.7. Misregistration
15.7. Positron Emission Tomography (PET) and PET/CT 15.7.1. Clinical Utilization 15.7.2. Detector
15.7.2.1. Type and Materials
146
15.7.2.2. Configuration 15.7.3. Coincidence Detection
15.7.3.1. Line of Response (LOR) 15.7.3.2. Trues, Scatter, and Randoms 15.7.3.3. Time-of-flight
15.7.4. Attenuation Correction 15.7.5. Standardized Uptake Value (SUV) and Contributing Factors 15.7.6. 2D vs. 3D Operation 15.7.7. Count Rate and Administered Activity Considerations 15.7.8. Image Reconstruction 15.7.9. Sensitivity and Resolution 15.7.10. Quality Assurance and Quality Control 15.7.11. Accreditation 15.7.12. Artifacts
15.7.12.1. Attenuation Correction and Truncation 15.7.12.2. Motion 15.7.12.3. Detector Loss, Block Loss, or Miscalibration 15.7.12.4. Misregistration 15.7.12.5. Physiological (e.g., High Serum Glucose)
15.8. Technical Assessment and Equipment Purchase Recommendations 15.9. Nuclear Medicine Therapy
15.9.1. Regulatory Considerations 15.9.2. Clinical Utilization 15.9.3. Written Directive 15.9.4. Patient Safety and Release Considerations (See Also Module 7)
15.10. Factors Affecting Public, Staff, and Unintended Patient Dose (See Also Module 7) 15.10.1. Radioactive Material Spills
15.11. Internal Dose Assessment 15.11.1. MIRD and OLINDA
147
Example Q&A: Q1. Excessive Mo-99 in the Tc-99m pertechnetate eluate is an example of a problem with what type of purity? A. Physical purity B. Radionuclidic purity C. Radiochemical purity D. Chemical purity Answer: B – Radionuclidic purity Explanation: Any radionuclide in the Mo-99/Tc-99m eluate other than the Tc-99m is a radionuclidic impurity. References:
1. Mettler, F.A., Jr. and M.J. Guiberteau. Essentials of Nuclear Medicine Imaging. 6th ed. Philadelphia: Elsevier Saunders, 2012.
2. Ziessman, H.A, J.P. O’Malley, and J.H. Thrall. Nuclear Medicine: The Requisites, 4th ed. Mosby Elsevier, 2013.
Q2. What is the regulatory limit for the amount of Mo-99 per mCi of Tc-99m radiopharmaceutical at the time of administration? A. 0.15 µCi B. 0.5 µCi C. 0.15 mCi D. 0.5 mCi Answer: A – 0.15 µCi per mCi of Tc-99m Explanation: Mo-99 in the eluate will increase radiation dose without any benefit to the patient. Also, the half-life of Mo-99 (67 hours) is longer than that of Tc-99m (6 hours). Increasing the time between elution and administration of Tc-99m will cause degradation of the images. References:
1. Mettler, F.A., Jr. and M.J. Guiberteau. Essentials of Nuclear Medicine Imaging. 6th ed. Philadelphia: Elsevier Saunders, 2012.
2. Ziessman, H.A, J.P. O’Malley, and J.H. Thrall. Nuclear Medicine: The Requisites, 4th ed. Mosby Elsevier, 2013.
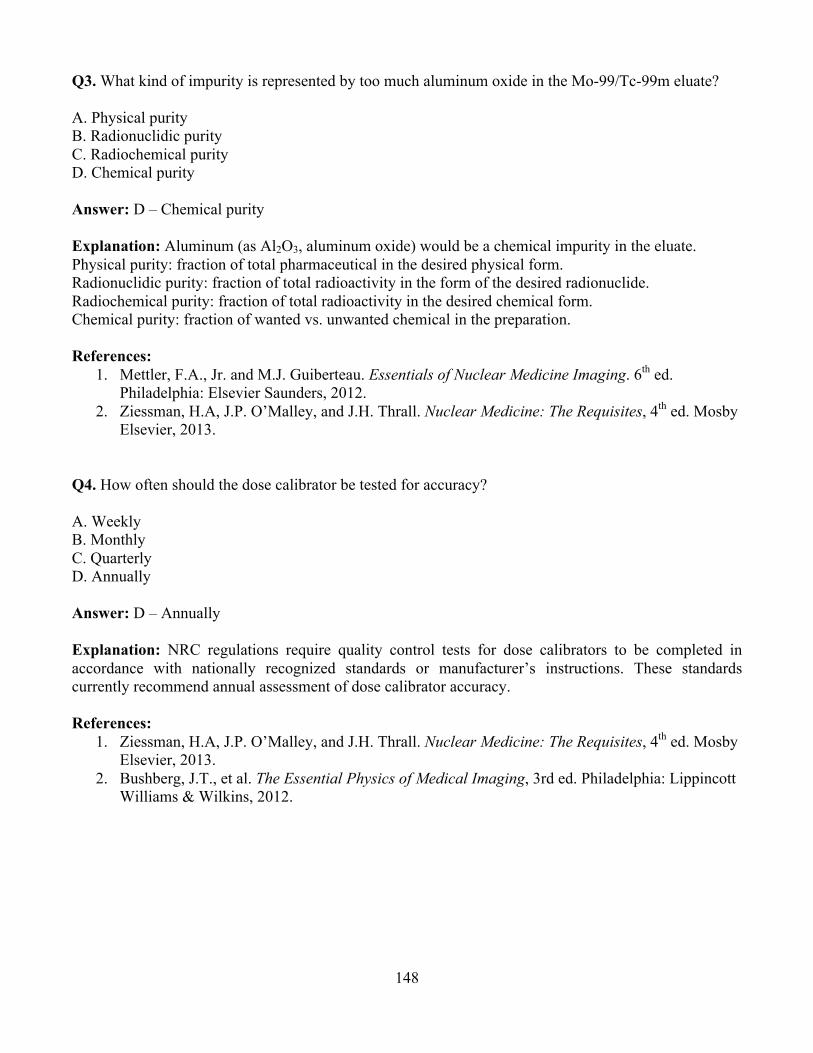
148
Q3. What kind of impurity is represented by too much aluminum oxide in the Mo-99/Tc-99m eluate? A. Physical purity B. Radionuclidic purity C. Radiochemical purity D. Chemical purity Answer: D – Chemical purity Explanation: Aluminum (as Al2O3, aluminum oxide) would be a chemical impurity in the eluate. Physical purity: fraction of total pharmaceutical in the desired physical form. Radionuclidic purity: fraction of total radioactivity in the form of the desired radionuclide. Radiochemical purity: fraction of total radioactivity in the desired chemical form. Chemical purity: fraction of wanted vs. unwanted chemical in the preparation. References:
1. Mettler, F.A., Jr. and M.J. Guiberteau. Essentials of Nuclear Medicine Imaging. 6th ed. Philadelphia: Elsevier Saunders, 2012.
2. Ziessman, H.A, J.P. O’Malley, and J.H. Thrall. Nuclear Medicine: The Requisites, 4th ed. Mosby Elsevier, 2013.
Q4. How often should the dose calibrator be tested for accuracy? A. Weekly B. Monthly C. Quarterly D. Annually Answer: D – Annually Explanation: NRC regulations require quality control tests for dose calibrators to be completed in accordance with nationally recognized standards or manufacturer’s instructions. These standards currently recommend annual assessment of dose calibrator accuracy. References:
1. Ziessman, H.A, J.P. O’Malley, and J.H. Thrall. Nuclear Medicine: The Requisites, 4th ed. Mosby Elsevier, 2013.
2. Bushberg, J.T., et al. The Essential Physics of Medical Imaging, 3rd ed. Philadelphia: Lippincott Williams & Wilkins, 2012.

149
Q5. How often should the dose calibrator be tested for constancy? A. Daily B. Weekly C. Monthly D. Quarterly Answer: A – Daily Explanation: For constancy or precision, the dose calibrator should be tested daily before first clinical use per nationally recognized standards and manufacturer’s instructions. Dose calibrators should be checked for accuracy at installation, annually, and after major repair. References:
1. Ziessman, H.A, J.P. O’Malley, and J.H. Thrall. Nuclear Medicine: The Requisites, 4th ed. Mosby Elsevier, 2013.
2. Bushberg, J.T., et al. The Essential Physics of Medical Imaging, 3rd ed. Philadelphia: Lippincott Williams & Wilkins, 2012.
Q6. How often should the dose calibrator be tested for linearity? A. Daily B. Weekly C. Monthly D. Quarterly Answer: D – Quarterly Explanation: Testing should be done quarterly per nationally recognized standards and manufacturer’s instructions. References:
1. Ziessman, H.A, J.P. O’Malley, and J.H. Thrall. Nuclear Medicine: The Requisites, 4th ed. Mosby Elsevier, 2013.
2. Bushberg, J.T., et al. The Essential Physics of Medical Imaging, 3rd ed. Philadelphia: Lippincott Williams & Wilkins, 2012.

150
Q7. A patient requires both an I-123 radioiodine scan and a bone scan using Tc99m MDP for thyroid imaging. What would be the optimum sequence to perform the scans? A. Administer the I-123 and Tc-99m simultaneously. B. Administer the I-123 first. C. Administer the Tc-99m MDP first.
Answer: C – Administer the Tc-99m MDP first. Explanation: Tc99m has a half-life of 6.02 hours and an energy of 140 keV. The typical activity administered for thyroid imaging is 20 mCi. I-123 has a half-life of 13.2 hours and an energy of 159 keV, with the typical activity administered for thyroid cancer workup between 2 and 5 mCi. Since I-123 has higher energy, but overlapping with Tc99m, it should be administered after Tc99m imaging is done. The half-life of Tc is also shorter, and I-123 imaging is typically done at 24 hours post administration for thyroid cancer workup. The Tc99m MDP may therefore be administered and imaging performed at 3 to 4 hours. If the I-123 is administered the next day and imaged at 24 hours, which is now at 48 hours post Tc-99m, the activity of the Tc-99m at that time will be less than 50 µCi and will not impact thyroid imaging. References:
1. Bushberg, J.T., et al. The Essential Physics of Medical Imaging, 3rd ed. Philadelphia: Lippincott Williams & Wilkins, 2012, Appendix F–2.
2. American College of Radiology. “ACR–SNM–SPR Practice Guideline for the Performance of Thyroid Scintigraphy and Uptake Measurement.” On-line at http://interactive.snm.org/docs/Thyroid_Scintigraphy.pdf.

151
Q8. What is the Cs-137 source shown below used for?
A. Daily check of survey meter B. Dose calibrator linearityC. Calibration of well counter D. Dose calibrator accuracy Answer: D – Dose calibrator accuracy Explanation: The dose calibrator must have an accuracy test performed annually, using sources that are traceable to the National Institute of Standards and Technology (NIST), such as the vial shown above.Note that in the image, the labeling shows that this is a reference source and that it is Cs-137. This source is likely also used for the daily constancy check. The survey meter would use a point source that is attached to the meter. Linearity is performed with a clinical source of 30 to 200 mCi, depending on the operation of the department. References:
1. American Association of Physicists in Medicine. AAPM Report 181: The Selection, Use, Calibration, and Quality Assurance of Radionuclide Calibrators Used in Nuclear Medicine. College Park, MD: AAPM, 2012.
2. Bushberg, J.T., et al. The Essential Physics of Medical Imaging, 3rd ed. Philadelphia: Lippincott Williams & Wilkins, 2012, p. 665.
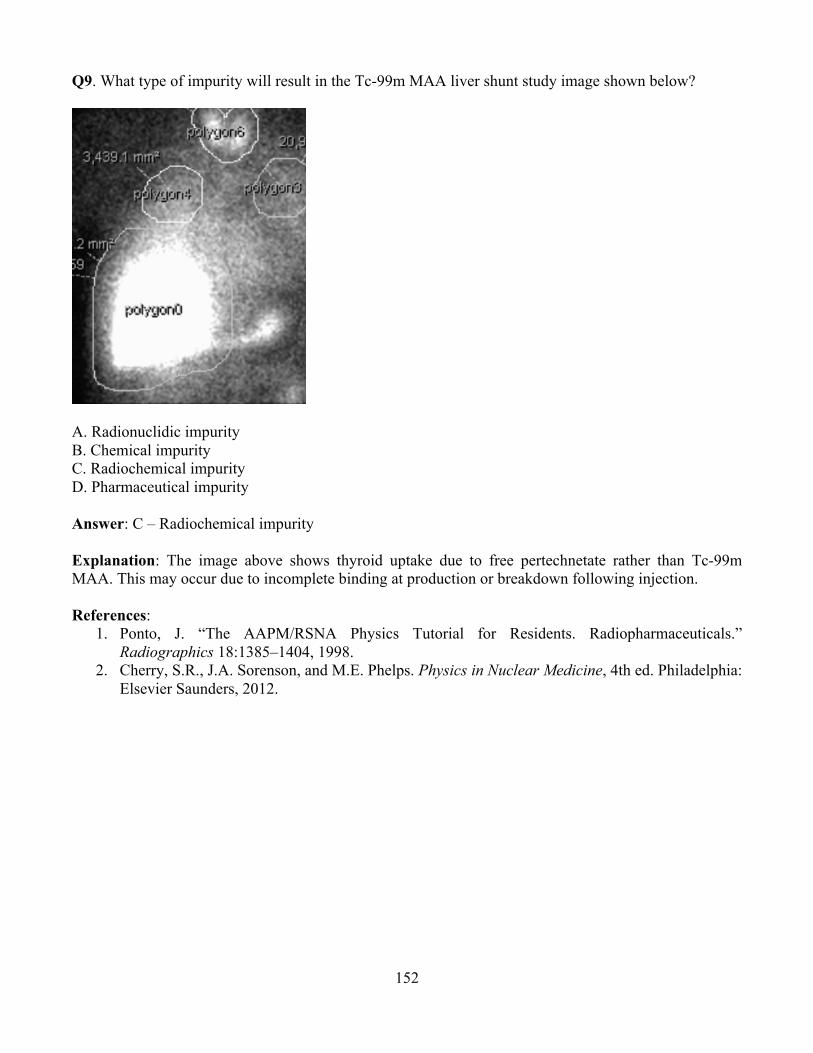
152
Q9. What type of impurity will result in the Tc-99m MAA liver shunt study image shown below?
A. Radionuclidic impurity B. Chemical impurity C. Radiochemical impurity D. Pharmaceutical impurity Answer: C – Radiochemical impurity Explanation: The image above shows thyroid uptake due to free pertechnetate rather than Tc-99m MAA. This may occur due to incomplete binding at production or breakdown following injection.
References: 1. Ponto, J. “The AAPM/RSNA Physics Tutorial for Residents. Radiopharmaceuticals.”
Radiographics 18:1385–1404, 1998. 2. Cherry, S.R., J.A. Sorenson, and M.E. Phelps. Physics in Nuclear Medicine, 4th ed. Philadelphia:
Elsevier Saunders, 2012.
153
Q10: What artifact is shown in the gallium scan below? Note: the acquisition was fixed time, and the number of counts obtained were as expected.
A. Use of the wrong collimator B. An incorrect window C. A photomultiplier tube that needs retuning D. An incorrect uniformity map Answer: D – An incorrect uniformity map Explanation: Many scintillation cameras require, as one of the correction maps, a uniformity map for each radionuclide used. For maps that have energies that are significantly different from Tc-99m, this map may require significant corrections. If the wrong map is used, as in this example, the pattern of photomultiplier tubes is very evident in the image. Reference:
1. Cherry, S.R., J.A. Sorenson, and M.E. Phelps. Physics in Nuclear Medicine, 4th ed. Philadelphia: Elsevier Saunders, 2012
154
Q11: Which of the following components has the greatest influence on both the spatial resolution and detection efficiency of a SPECT system? A. Photomultiplier Tube B. Collimator C. Image display system D. Reconstruction filter Answer: B – Collimator Explanation: Each hole in a collimator is a tiny aperture that essentially localizes where the radiation was emitted from thus improving localization. However, the septae of the collimator also absorb some of the primary radiation used to make the image and thus decrease the system detection efficiency. Reference:
1. Cherry, S.R., J.A. Sorenson, and M.E. Phelps. Physics in Nuclear Medicine, 4th ed. Philadelphia: Elsevier Saunders, 2012
Q12: Circular “ring” artifacts (often called “bullseye artifacts”) in tomographic reconstructions are the result of: A. Uncorrected flood field non-uniformities B. Inadequate statistics C. Insufficient angular sampling D. Using an inappropriate filtering algorithm E. Insufficient linear sampling Answer: A – Uncorrected flood field non-uniformities Explanation: Uncorrected non-uniformities in the flood field are visually “smeared” into a ring pattern in transverse SPECT sections. The look is similar to that of a ring artifact in CT and has a similar root cause: non-uniformity. Reference:
1. Cherry, S.R., J.A. Sorenson, and M.E. Phelps. Physics in Nuclear Medicine, 4th ed. Philadelphia: Elsevier Saunders, 2012
155
Q13: In PET imaging, what is the outcome of imaging positrons with long particle range? A. Improved image resolution B. Mis-positioning of the annihilation event C. Increased streaking artifact D. Random detection event in the PET detector Answer: B – Mis-positioning of the annihilation event Explanation: The origin of the annihilation event is determined by looking at where the 511 keV photons originate. If the positron has a long range, then where the photons originate will not coincide with where the tracer is positioned. Reference:
1. Cherry, S.R., J.A. Sorenson, and M.E. Phelps. Physics in Nuclear Medicine, 4th ed. Philadelphia: Elsevier Saunders, 2012
Q14: Applying post-processing with strong smoothing in a PET image is most likely to give artificially low SUVmax measurement for which of the following? A. 25 mm primary liver lesion B. 15 mm prostate metastasis C. 10 mm primary lung tumor D. 5 mm bone metastasis Answer: B – 5 mm bone metastasis Explanation: Strong smoothing results in a loss of resolution (blurring). This will impact small lesions and cause artificially low SUVmax measurements. Reference:
1. Cherry, S.R., J.A. Sorenson, and M.E. Phelps. Physics in Nuclear Medicine, 4th ed. Philadelphia: Elsevier Saunders, 2012