curriculum vitae - core.ac.uk · avans hogeschool in breda, the netherlands. this degree was...
TRANSCRIPT

ii
Curriculum Vitae
Drs. Ing. Niels van Boxtel was born on the 11th of December, 1985 in Tilburg, The Netherlands. He
completed his secondary school in 2002 at Pauluslyceum in Tilburg and his Bachelor studies in Chemistry at
Avans Hogeschool in Breda, The Netherlands. This degree was completed in 2007 after which he started to
work in various functions as a chemical analyst. Next to a fulltime job, he completed a master in Chemistry at
the Free University of Amsterdam, the Netherlands. During this study, a specialisation was done in analytical
chemistry and was completed in 2011. In the same year he started his PhD research at the Pharmaceutical
Analysis laboratory of KU Leuven in Belgium under the supervision of promoter Prof. Dr. Erwin Adams and
co-promoter Prof. Dr. Ann Van Schepdael. The focus of his research was on alternative approaches around
sensitivity issues within GC analysis.

iii
Acknowledgements
When I began my PhD studies at KU Leuven, the idea of completing a thesis seemed overwhelming. As the
years passed by, it has come together slowly, step by step and finally came into focus. All of this would not
have been accomplished without the help and support of countless people.
First, I would like to express my gratitude to my promoter Prof. Dr. Erwin Adams for giving me the opportunity
to start my PhD studies in the Pharmaceutical Analysis lab, Thank you for all the help and support I received
from you during my stay in the lab. I am also grateful to my co-promoter Prof. Dr. Ann Van Schepdael as
head of laboratory allowing me to start my PhD and for the support during my stay. I also would like to thank
Prof. Dr. Deirdre Cabooter as well for being a nice colleague and I wish you all the best with your future
research. Thanks to the jury members (Prof. Dr. Guy Bormans, Prof. Dr. Eva Cuypers, Prof. Dr. Kristin
Verbeke, Prof. Dr. Christophe Stove and Dr. Eric Deconinck) for reading my thesis manuscript and for their
suggestions on how to improve it as well, as for their comments while being a part of my thesis advisory
committee.
During the past years as a PhD student, I spend my time with a lot of different people and would like to thank
all of them for creating a pleasant environment to work in: Jochen, Bart, Stijn, Pranov, Karina, Huiying,
Glenn, Stani, Lynch, Marwa, Shengyun, Matthias, Jasper, Getu, Adissu, Prasanta, Ann, Didi, Mohamed,
Peter, Hui, Stephanie and Sonia. From all the colleagues, there is one that deserves special credits: Kris
Wolfs for his great support and help during my PhD. Throughout the years he helped me to overcome many
problems around my research projects. I really appreciated the ‗straight to the point‘ approach you used in
your assistance during this work. Moreover, I always enjoyed our chats about all kinds of topics, especially
when I needed some distraction from the daily work. During my stay, I have supervised several bachelor and
master students in the framework of their final thesis. It was my pleasure to guide you in your work. So thank
you Marta, Nand, Maria, Joren, Jasper and Valerie for being very nice colleagues.
Also, I would like to thank my parents for their support during my PhD. I don‘t think I could have finished it
without that. Not everyone gets a chance to study in a university and I am therefore grateful that my parents
offered me this chance. Last but not least, I would like to thank my friends for their support: Jelle, Dave,
Frank, Jop, Bob, Floran and many more. Thanks for everything!
Niels
iv
List of publications
1. N. van Boxtel, K. Wolfs, A. Van Schepdael, E. Adams, Evaluation of the full evaporation technique for
quantitative analysis of high boiling compounds with high affinity for apolar matrices, J. Chromatogr. A, 1348
(2014) 63.
2. N. van Boxtel, K. Wolfs, A. Van Schepdael, E. Adams, Application of acetone acetals as water scavengers
and derivatization agents prior to the gas chromatographic analysis of polar residual solvents in aqueous
samples, J. Chromatogr. A., 1425 (2015) 62.
3. N. van Boxtel, K. Wolfs, M. Guillén Palacín, A. Van Schepdael, E. Adams, A headspace gas
chromatography based methodology for the analysis of aromatic substituted quaternary ammonium salts,
(Submitted to Journal of Chromatography A).
4. N. van Boxtel, K. Wolfs, M. Guillén Palacín, A. Van Schepdael, E. Adams, Comprehensive headspace gas
chromatographic analysis of denaturants including denatonium benzoate in denaturated ethanol samples (To
be submitted to Talanta).
5. N. van Boxtel, K. Wolfs, W. D‘Autry, A. Van Schepdael, E. Adams, Development and characterization of
an atmospheric micro cavity hollow cathode discharge based GC-detector (To be submitted to Analytical
Chemistry).
v
Table of contents
Curriculum Vitae ............................................................................................................................................... ii
Acknowledgements ......................................................................................................................................... iii
List of publications .......................................................................................................................................... iv
List of abbreviations and symbols .............................................................................................................. viii
Chapter 1 - General introduction ................................................................................................................... 1
1.1. Gas chromatography as analytical tool ...................................................................................................... 3
1.1.1. Introduction ..................................................................................................................................... 3
1.1.2. Inlet ................................................................................................................................................. 3
1.1.3. Column ............................................................................................................................................ 4
1.1.4. Carrier gas ...................................................................................................................................... 4
1.2. Headspace sample introduction ................................................................................................................. 4
1.2.1. Overview of sample introduction techniques .................................................................................. 4
1.2.2. Basic theory of HS sampling ........................................................................................................... 5
1.2.3. Balanced pressure system .............................................................................................................. 7
1.2.4. Full evaporation technique (FET) ................................................................................................... 8
1.2.5. Shortcomings of HS sampling ........................................................................................................ 8
1.3. GC detectors ............................................................................................................................................. 10
1.3.1. Thermal conductivity detector (TCD) ............................................................................................ 10
1.3.2. Flame ionization detector (FID)..................................................................................................... 11
1.3.3. Electron capture detector (ECD) ................................................................................................... 12
1.3.4. Thermoionic ionization detector (TID) ........................................................................................... 12
1.3.5. Chemiluminescence based sulphur and nitrogen detectors ......................................................... 14
1.3.6. Photoionization detector (PID) ...................................................................................................... 15
1.3.7. Helium ionization detector (HID) ................................................................................................... 15
1.3.8. Mass spectrometer as detection system ...................................................................................... 16
1.3.9. Shortcomings of GC detectors ...................................................................................................... 17
1.4. Aim of the study ........................................................................................................................................ 18
1.5. References ............................................................................................................................................... 19
Chapter 2 - Evaluation of the full evaporation technique for quantitative analysis of high boiling compounds with high affinity for apolar matrices ..................................................................................... 24
2.1. Introduction ............................................................................................................................................... 27
2.2. Theory ....................................................................................................................................................... 28
2.3. Experimental ............................................................................................................................................. 29
2.3.1. Reagents and samples ................................................................................................................. 29
2.3.2. Chromatographic system and sampling conditions for the sHS-method ...................................... 30
2.3.3. Chromatographic system and HS sampler conditions for FET ..................................................... 31
2.3.4. Preparation of solutions ................................................................................................................ 32
2.3.5. Sample vials .................................................................................................................................. 33
2.3.6. FET evaluation .............................................................................................................................. 33
2.3.7. Stability evaluation ........................................................................................................................ 34
2.3.8. Matrix-matched vs. solvent-based calibration ............................................................................... 34
2.3.9. Recovery experiments .................................................................................................................. 34
vi
2.3.10. Analysis of commercial samples ................................................................................................. 34
2.4. Results & discussion................................................................................................................................. 35
2.4.1. Evaluation of the sample volume in the vial used for FET ............................................................ 35
2.4.2. Evaluation of matrix effects ........................................................................................................... 35
2.4.3. Stability evaluation ........................................................................................................................ 39
2.4.4. Recovery and repeatability ........................................................................................................... 39
2.4.5. Limit of quantification (LOQ) ......................................................................................................... 41
2.4.6. Analysis of commercial samples ................................................................................................... 41
2.5. Conclusions .............................................................................................................................................. 43
2.6. References ............................................................................................................................................... 44
Chapter 3 - Application of acetone acetals as water scavengers and derivatization agents prior to the gas chromatographic analysis of polar residual solvents in aqueous samples .................................... 47
3.1. Introduction ............................................................................................................................................... 50
3.2. Experimental ............................................................................................................................................. 53
3.2.1. Reagents ....................................................................................................................................... 53
3.2.2. Chromatographic systems ............................................................................................................ 53
3.2.3. Preparation of solutions ................................................................................................................ 54
3.2.4. Method validation .......................................................................................................................... 56
3.3. Results & Discussion ................................................................................................................................ 56
3.3.1. Investigation of DMP treatment parameters ................................................................................. 56
3.3.2. Influence of sample acidity on the response of analytes and choice of neutralising agent .......... 59
3.3.3. Optimization of the solvent evaporation step (FET-GC) ............................................................... 62
3.3.4. Identification of EG-DMP derivative .............................................................................................. 63
3.3.5. Further improvement ..................................................................................................................... 65
3.3.6. Method validation .......................................................................................................................... 65
3.3.7. Analysis of residual NMP in an aqueous solution of a cefotaxime analogue ............................... 67
3.3.8. Analysis of EG in contact lens fluids ............................................................................................. 68
3.4. Conclusions .............................................................................................................................................. 68
3.5. References ............................................................................................................................................... 69
Chapter 4 - A headspace gas chromatography based methodology for the analysis of aromatic substituted quaternary ammonium salts .................................................................................................... 73
4.1. Introduction ............................................................................................................................................... 76
4.2. Experimental ............................................................................................................................................. 77
4.2.1. Reagents ....................................................................................................................................... 77
4.2.2. Chromatographic systems ............................................................................................................ 78
4.2.3. Preparation of solutions and samples ........................................................................................... 80
4.2.4. Procedures .................................................................................................................................... 82
4.3. Results & Discussion ................................................................................................................................ 85
4.3.1. Screening of various QAS............................................................................................................. 85
4.3.2. Equilibration time .......................................................................................................................... 88
4.3.3. Method validation HS-GC method ................................................................................................ 89
4.3.4. Analysis of DB in commercial cooling liquid samples ................................................................... 91
4.3.5. Analysis of BZTCl in a mouth spray .............................................................................................. 95
4.3.6. Analysis of BZOCl in a mouth spray ............................................................................................. 95
vii
4.4. Conclusions .............................................................................................................................................. 95
4.5. References ............................................................................................................................................... 96
Chapter 5 - Development and characterization of an atmospheric micro cavity hollow cathode discharge based GC-detector ...................................................................................................................... 99
5.1. Introduction ............................................................................................................................................. 102
5.2. Experimental ........................................................................................................................................... 107
5.2.1. Reagents ..................................................................................................................................... 107
5.2.2. Chromatographic system and headspace (HS) sampler conditions........................................... 107
5.2.3. Preparation of solutions and sample vials .................................................................................. 108
5.2.4. µCHCD set-ups investigated ...................................................................................................... 109
5.3. Results & Discussion .............................................................................................................................. 114
5.3.1. Initial testing with the co-axial µCHCD detector set-up .............................................................. 114
5.3.2. Serial axial µCHCD detector – version 1 .................................................................................... 116
5.3.3. Serial axial µCHCD detector – version 2 .................................................................................... 119
5.3.4. Comparison to other techniques ................................................................................................. 126
5.4. Conclusions ............................................................................................................................................ 127
5.5. References ............................................................................................................................................. 128
Chapter 6 - General discussion .................................................................................................................. 133
Summary ...................................................................................................................................................... 142
Samenvatting ............................................................................................................................................... 144
viii
List of abbreviations and symbols
A anode
AD analog-to-digital
AED atomic emission detector
Ag silver
Amp amplifier
β phase ratio
BA benzyl alcohol
Bp boiling point
BSTFA N,O-Bis(trimethylsilyl)trifluoroacetamide
BZOCl benzoxonium chloride
BZTCl benzethonium chloride
C camphor
°C degrees Celsius
C0 Analyte concentration in a sample
Cap capture electrode
CCl4 carbon tetrachloride
CE capillary electrophoresis
CFD Computational Fluid Dynamics
Cg concentration in the gas phase
Cl concentration in the liquid phase
CPE cloud point extraction
d cathode-anode distance
D internal diameter of a hollow cathode
DB denatonium benzoate
DBD dielectric barrier discharge
DC direct current
2,2-DD 2,2-dimethyl-1,3-dioxolane
df
degrees of freedom
df film thickness
2D-GC two dimensional gas chromatography
DH detector housing
dHS dynamic headspace
ix
DMA N,N-dimethylacetamide
DMF N,N-dimethylformamide
DMP 2,2-dimethoxypropane
DMSO dimethylsulfoxide
ECD electron capture detector
EG ethylene glycol
EI electron ionization
EtS ethyl salicylate
eV electron volts
FET full evaporation technique
FID flame ionization detector
g grams
GC gas chromatography
GD glow discharge
HC hollow cathode
HCl hydrochloric acid
He+ helium ions
He-PDPID helium pulsed discharge photo ionization detector
HS headspace
ICH International Conference on Harmonisation
ICP inductively coupled plasma
I.D. internal diameter
IMS ion mobility spectrometry
Ir iridium
K distribution coefficient
K Kelvin
kHz kilohertz
kPa kilopascal
LC liquid chromatography
LOQ limit of quantification
M DL-menthol
m metre
µA micro ampere
MEK methyl ethyl ketone
x
MeS methyl salicylate
mg milligram
µCHCD micro cavity hollow cathode discharge
MHE multiple headspace extraction
mL milliliter
µg microgram
µL microliters
µm micrometres
mm millimetres
Mo molybdenum
MΩ mega ohm
MS mass spectrometry
MTBE methyl t-butyl ether
mV millivolt
NCD nitrogen chemiluminescence detector
ng nanogram
63Ni nickel 63 isotope
nL nano litre
NMP N-methyl-2-pyrrolidone
NO nitric oxide
NO2 nitrogen dioxide
NPD nitrogen-phosphorus detector
O3 ozone
O.D. outer diameter
Pb lead
p*d product of pressure and electrode distance
PDD pulsed discharge detector
PDECD pulsed discharge electron capture detector
PDED pulsed discharge emission detector
pg picogram
PID photo ionization detector
PLOT porous layer open tubular
ppartial partial gas pressure
PTFE/Sil polytetrafluoroethylene/silicone
xi
ptotal total gas pressure
PTV programmed temperature vaporizer
Q quartz
QAS quaternary ammonium salts
R2 determination coefficient
Rb ballast resistance
RSD relative standard deviation
SAM standard addition method
SBSE stir bar sorptive extraction
SCD sulphur chemiluminescence detector
SCOT support coated open tubular
SDME single drop micro extraction
SFE supercritical fluid extraction
sHS-GC static headspace-gas chromatography
Sn tin
SO2 sulphur dioxide
SPME solid phase micro-extraction
Sslope standard error of the slope
SWE super critical water extraction
Syx standard error of estimate
STEL short term exposure limit
T temperature in Kelvin
tcrit. critical t-value for a number of degrees of freedom
t (min) time in minutes
TCD thermal conductivity detector
TCE trichloroethylene
texperimental experimental t-value
Torr Torricelli
U power source
U-I voltage-current
UV ultraviolet
V volt
Vb breakdown voltage
V.cm-1
unit for electric field strength

xii
vs. versus
% v/v volume per volume percentage
W tungsten
WCOT wall coated open tubular
xi mole fraction
γi activity coefficient

1
Chapter 1 - General introduction

2
3
1.1. Gas chromatography as analytical tool
1.1.1. Introduction
Separation techniques such as liquid chromatography (LC) and capillary electrophoresis (CE) are often used
to separate non-volatile and often large molecules in various matrices. These techniques are however less
suitable for small volatile molecules such a many residual solvents. Therefore, such molecules are usually
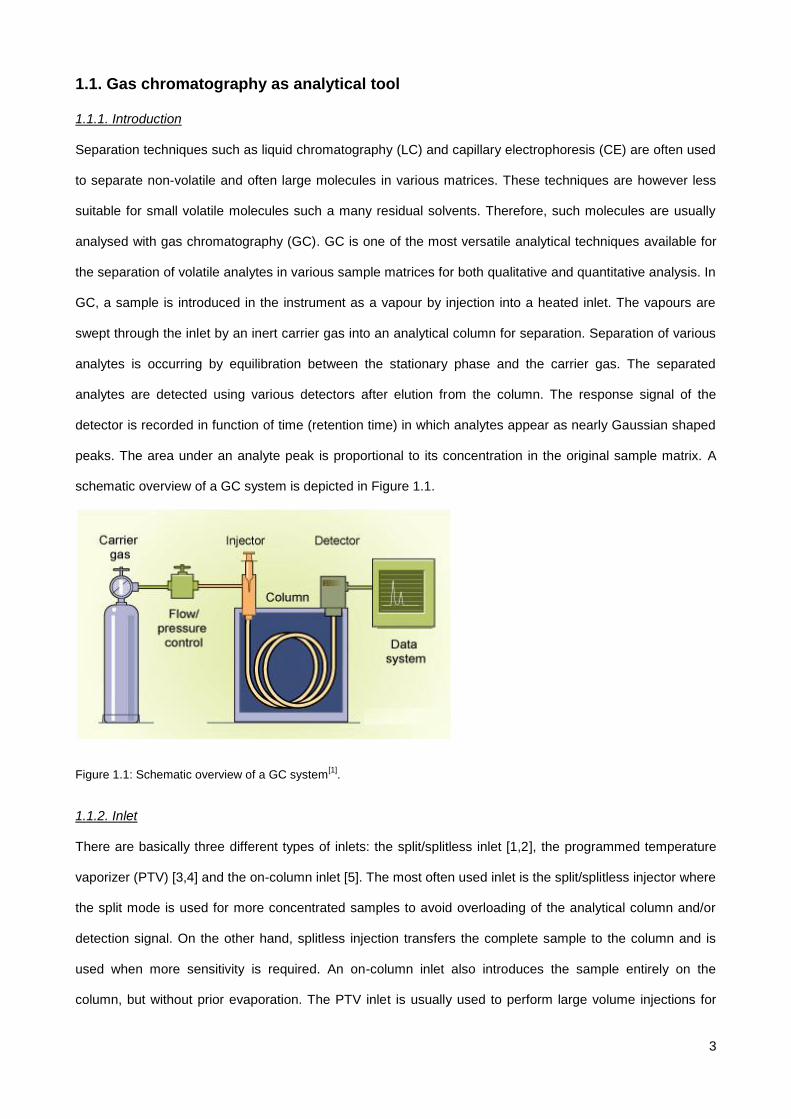
analysed with gas chromatography (GC). GC is one of the most versatile analytical techniques available for
the separation of volatile analytes in various sample matrices for both qualitative and quantitative analysis. In
GC, a sample is introduced in the instrument as a vapour by injection into a heated inlet. The vapours are
swept through the inlet by an inert carrier gas into an analytical column for separation. Separation of various
analytes is occurring by equilibration between the stationary phase and the carrier gas. The separated
analytes are detected using various detectors after elution from the column. The response signal of the
detector is recorded in function of time (retention time) in which analytes appear as nearly Gaussian shaped
peaks. The area under an analyte peak is proportional to its concentration in the original sample matrix. A
schematic overview of a GC system is depicted in Figure 1.1.
Figure 1.1: Schematic overview of a GC system[1]
.
1.1.2. Inlet
There are basically three different types of inlets: the split/splitless inlet [1,2], the programmed temperature
vaporizer (PTV) [3,4] and the on-column inlet [5]. The most often used inlet is the split/splitless injector where
the split mode is used for more concentrated samples to avoid overloading of the analytical column and/or
detection signal. On the other hand, splitless injection transfers the complete sample to the column and is
used when more sensitivity is required. An on-column inlet also introduces the sample entirely on the
column, but without prior evaporation. The PTV inlet is usually used to perform large volume injections for
4
more sensitivity. During the sample introduction, solvent is vented at a low inlet temperature to prevent
backflash of solvent causing contamination of the GC system.
1.1.3. Column
The column is where the separation takes place after introduction of the sample. Within GC analysis, two
different types of columns exist: packed columns and capillary columns. A packed column is typically made
from a glass or stainless steel coil with lengths ranging from 1 – 5 m. The column is filled with particles that
act as stationary phase. Nowadays, packed columns are merely used for preparative work and have been
replaced by capillary columns due to superior separation efficiencies. Capillary columns consist of fused
silica with a polyimide coating on the exterior and can have lengths from 15 m up to 100 m with internal
diameters from 0.10 to 0.53 mm. Three different types of capillary columns can be distinguished, which are
the Wall Coated Open Tubular (WCOT), the Support Coated Open Tubular (SCOT) and the Porous Layer
Open Tubular (PLOT) columns. A WCOT column uses a thin film coated on the inner surface of the fused
silica as stationary phase. SCOT columns use particles that are modified with a stationary phase and are
deposited on the column wall. With the PLOT columns particles act as the stationary phase itself.
1.1.4. Carrier gas
As mentioned above, the carrier gas is responsible for the transport of analytes through the column. The
carrier gas is inert towards the analytes and separation mainly depends on the characteristics of the
stationary phase. Typical carrier gasses include helium, nitrogen, hydrogen, carbon dioxide and argon.
Helium is used most often for its safety in comparison with hydrogen and the higher separation efficiency
compared to the other gasses [6].
1.2. Headspace sample introduction
1.2.1. Overview of sample introduction techniques
For the introduction of a sample into a GC system, direct injection is the most widely used approach. The
sample is usually dissolved in an appropriate solvent and injected in a heated injection port to evaporate the
volatile sample constituents using a syringe. Since the development of GC, several alternative sample
introduction and isolation techniques have been developed and implemented. These include techniques
such as thermal desorption using solid phase micro extraction (SPME), stir bar sorptive extraction (SBSE),
single drop micro extraction (SDME). Other techniques include headspace (HS) sampling methods, pyrolysis
and purge and trap. SPME and SBSE rely on the adsorption of analytes on an adsorbent for sample
enrichment and analytes are released into a GC by heating of the adsorbent. SDME uses a solvent drop to
5
extract analytes from samples. This can be performed in two ways: the extraction is performed by direct
immersion in the sample solution in which the solvent drop is immiscible. Another approach is to suspend the
droplet above the headspace for extraction.
In this thesis, three research chapters are devoted to the alternative use of HS equipment. Therefore, the
following paragraphs will cover some items related to HS sampling.
1.2.2. Basic theory of HS sampling
The theory of HS sampling has been extensively explained in literature [7] and only relevant aspects of this
technique will be described here. When HS sampling is used, a sample is heated and an aliquot of the
vapour phase (headspace) containing the volatile analytes is introduced on the column for analysis. HS
analysis can be performed both statically (sHS) and dynamically (dHS). dHS is performed by purging with an
inert gas whilst heating in an open vial in contrast to sHS sampling that occurs in a closed vial. sHS sampling
can be done by using a gas tight syringe, a sample loop system or a balanced pressure system. With sHS
analysis, a particular sample is usually dissolved in a suitable high boiling solvent after which a part of the
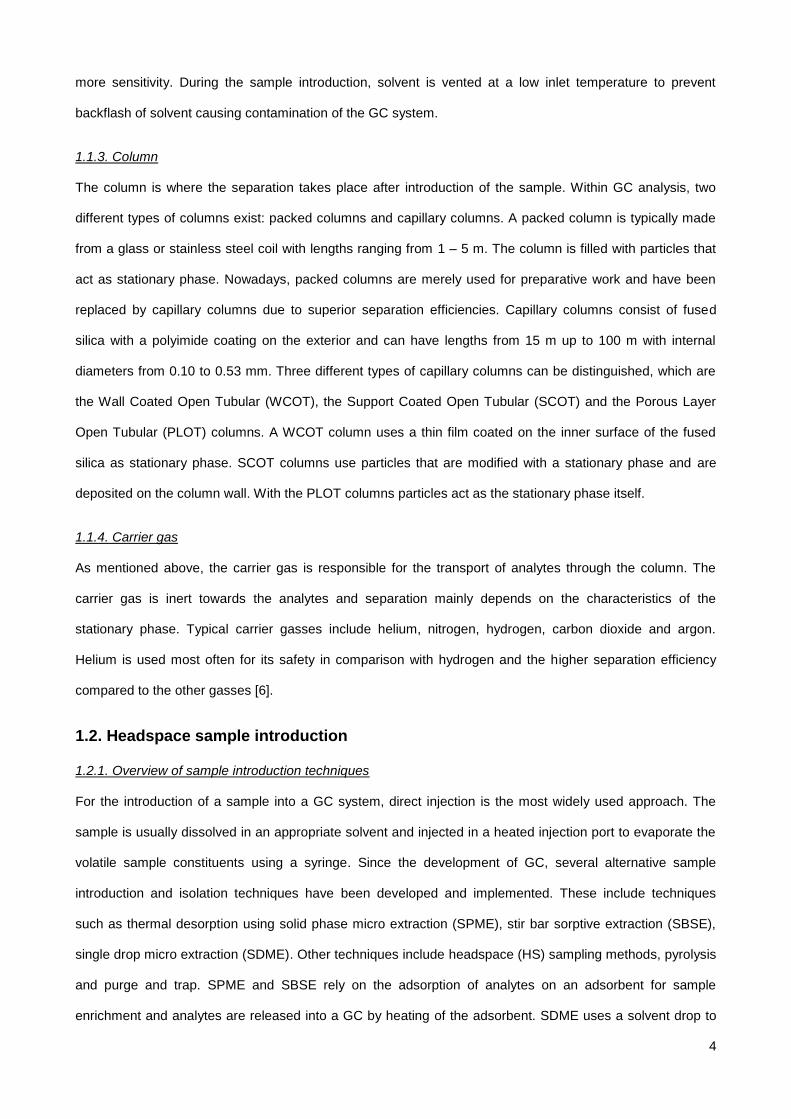
sample is transferred to a HS vial and closed with a cap having a septum. Afterwards, the sample vial is
heated for a certain time causing the volatile analytes to move towards the vapour phase until a
thermodynamic equilibrium is reached (Figure 1.2).
Figure 1.2: Schematic overview of a HS vial in sHS conditions[8]
.
The HS vial containing the sample is characterised by the so-called phase ratio β according to (1):
(1)
In which Vg and Vl are the volume of the gas phase and liquid phase, respectively.
6
The partition of a given analyte between the two phases under a certain situation can be expressed by the
partition coefficient K:
(2)
Cl is the concentration of the analyte in the liquid phase and Cg is the concentration in the gas phase. Under
sHS conditions both β and K are constant. The analyte concentration in the gas phase is then given by:
(3)
Which relates the initial sample concentration (C0) with the gas phase concentration after thermodynamic
equilibrium is established. A certain analyte having a concentration C0 will generate a concentration Cg giving
rise to a peak with a proportional area depending on K and β. In practice, the partition coefficient K is very
difficult to predict and is influenced by many different factors. In the text below, various relevant factors will
be briefly explained.
Dalton’s law
Dalton‘s law describes that the total pressure (ptotal) of a given gas mixture can be considered as the sum of
the partial pressures (ppartial) of all the separate constituents present in the gas mixture. This means that the
gas phase concentration of an analyte is depending on its partial pressure:
(4)
The partial pressure of a certain analyte is depending on the temperature. Increasing the temperature will
increase the partial pressure and also Cg so that K will change as well.
Raoult’s law
The partial pressure of an analyte is directly proportional to its mole fraction (x i) in a sample solution:
(5)
7
In which pi0 is the vapour pressure of a certain analyte which is influenced by the temperature as well
according to Antoine‘s equation:
(6)
A,B and C are so-called Antoine coefficients and are specific for an analyte. T is the temperature in Kelvin.
Raoult‘s law is only valid in situations where analytes are completely inert towards each other. However,
most sample solutions deviate from this as there are interactions and usually an adapted form of Raoult‘s law
is used:
(7)
This adapted form of Raoult‘s law uses the activity coefficient γ i to correct for any possible interaction of a
certain analyte with components from its environment.
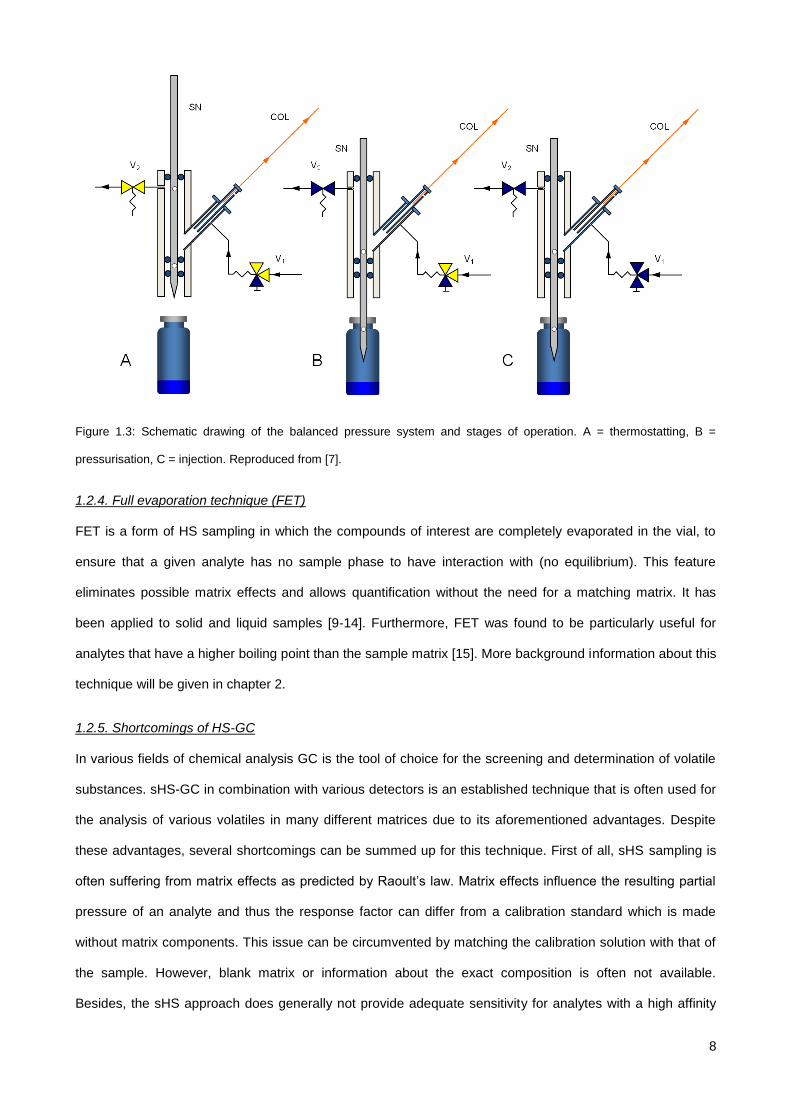
1.2.3. Balanced pressure system
The balanced pressure system is depicted in Figure 1.3. Sampling with this system proceeds in 3 phases.
Firstly, the vial is thermostatted and the sampling needle (SN) will be in its standby position (stage A). Carrier
gas flowing through valve 1 (V1) is split up between the transferline connecting the HS sampler with the inlet
of the GC and the hollow needle that contains two holes. Valve 2 (V2) is open enabling the carrier gas to
leave the system. After heating of the sample vial and establishing thermodynamic equilibrium, the needle
punctures the septum of the vial which is pressurized (stage B). By closing both valves 1 and 2, a part of the
headspace is injected to the GC column (COL) (stage C).
8
Figure 1.3: Schematic drawing of the balanced pressure system and stages of operation. A = thermostatting, B =
pressurisation, C = injection. Reproduced from [7].
1.2.4. Full evaporation technique (FET)
FET is a form of HS sampling in which the compounds of interest are completely evaporated in the vial, to
ensure that a given analyte has no sample phase to have interaction with (no equilibrium). This feature
eliminates possible matrix effects and allows quantification without the need for a matching matrix. It has
been applied to solid and liquid samples [9-14]. Furthermore, FET was found to be particularly useful for
analytes that have a higher boiling point than the sample matrix [15]. More background information about this
technique will be given in chapter 2.
1.2.5. Shortcomings of HS-GC
In various fields of chemical analysis GC is the tool of choice for the screening and determination of volatile
substances. sHS-GC in combination with various detectors is an established technique that is often used for
the analysis of various volatiles in many different matrices due to its aforementioned advantages. Despite
these advantages, several shortcomings can be summed up for this technique. First of all, sHS sampling is
often suffering from matrix effects as predicted by Raoult‘s law. Matrix effects influence the resulting partial
pressure of an analyte and thus the response factor can differ from a calibration standard which is made
without matrix components. This issue can be circumvented by matching the calibration solution with that of
the sample. However, blank matrix or information about the exact composition is often not available.
Besides, the sHS approach does generally not provide adequate sensitivity for analytes with a high affinity
9
for a particular matrix. Increasing the HS temperature does generally promote more analyte to the gas
phase. However, at some point, the sample solvent starts to boil which results in a pressure that is too high
for a HS instrument to handle. Therefore, the determination of high boiling analytes in a low boiling matrix is
problematic. Besides, thermally labile compounds could start to degrade when the used temperature is too
high. To address the problem of possible matrix effects and to overcome sensitivity issues often encountered
with sHS sampling, FET has been used to fully evaporate typical polar high boiling residual solvents such as
N,N-dimethylformamide (DMF) or dimethylsulfoxide (DMSO) in aqueous samples. These solvents are high
boiling compared to water and have a large affinity for water (miscible). In contrast to the sHS methodology,
FET does provide adequate sensitivity for such analytes. Possible matrix effects are circumvented as the
complete volatile part of the sample is evaporated so that no equilibrium between analytes and matrix can be
formed. The sensitivity that can be obtained by FET is still rather limited as the sample volume should not
exceed a certain volume. A sample volume that is too large could lead to incomplete evaporation thereby
creating sHS conditions again. Also, the pressure in the vial can exceed the maximum tolerable pressure at
a certain sample volume. The pressure in a vial is especially governed by both the vapour pressure of the
solvent and the air that is already present in the vial and expands upon heating. As predicted by the ideal
gas law, smaller molecular masses lead to lower maximum tolerable sample volumes. Due to this, the
sample volume for aqueous samples is limited to approximately 10 µL in a HS vial of 22 mL. The analysis of
analytes as aforementioned remains problematic when higher sensitivity is required. When large amounts of
aqueous samples are introduced in the GC system to increase the sensitivity, there is a serious risk to
damage the GC column. Moreover, aqueous samples do generally not allow derivatization of analytes to
improve their volatility, chromatographic properties or sensitivity. Some analytes such as certain polymers or
quaternary ammonium salts (QAS) are not volatile at all and require pyrolysis to generate representative
volatile products for GC analysis. When these types of analytes have to be determined in aqueous samples,
the water will create the aforementioned issues, especially when pyrolysis is carried out with direct injection.
10
1.3. GC detectors
Apart from various sampling techniques, various detectors have been developed. Detectors can be either
universal or selective. In the following paragraphs an overview is given of detectors that are commercially
available.
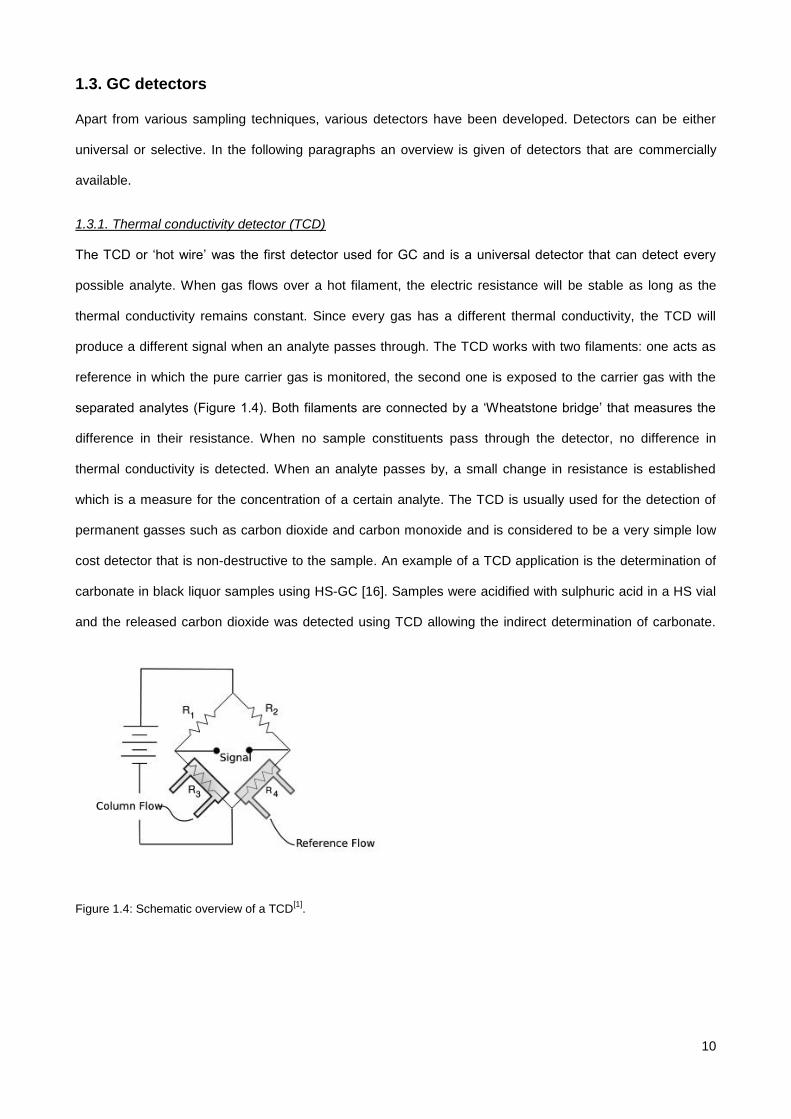
1.3.1. Thermal conductivity detector (TCD)
The TCD or ‗hot wire‘ was the first detector used for GC and is a universal detector that can detect every
possible analyte. When gas flows over a hot filament, the electric resistance will be stable as long as the
thermal conductivity remains constant. Since every gas has a different thermal conductivity, the TCD will
produce a different signal when an analyte passes through. The TCD works with two filaments: one acts as
reference in which the pure carrier gas is monitored, the second one is exposed to the carrier gas with the
separated analytes (Figure 1.4). Both filaments are connected by a ‗Wheatstone bridge‘ that measures the
difference in their resistance. When no sample constituents pass through the detector, no difference in
thermal conductivity is detected. When an analyte passes by, a small change in resistance is established
which is a measure for the concentration of a certain analyte. The TCD is usually used for the detection of
permanent gasses such as carbon dioxide and carbon monoxide and is considered to be a very simple low
cost detector that is non-destructive to the sample. An example of a TCD application is the determination of
carbonate in black liquor samples using HS-GC [16]. Samples were acidified with sulphuric acid in a HS vial
and the released carbon dioxide was detected using TCD allowing the indirect determination of carbonate.
Figure 1.4: Schematic overview of a TCD[1]
.
11
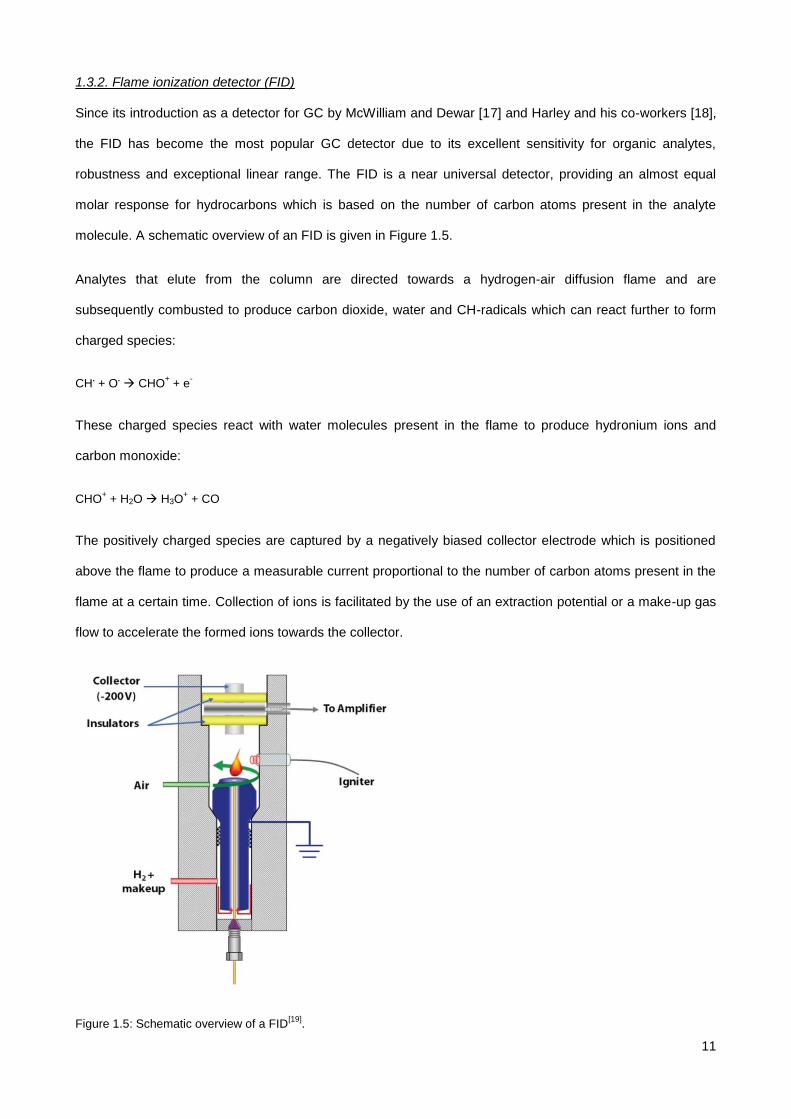
1.3.2. Flame ionization detector (FID)
Since its introduction as a detector for GC by McWilliam and Dewar [17] and Harley and his co-workers [18],
the FID has become the most popular GC detector due to its excellent sensitivity for organic analytes,
robustness and exceptional linear range. The FID is a near universal detector, providing an almost equal
molar response for hydrocarbons which is based on the number of carbon atoms present in the analyte
molecule. A schematic overview of an FID is given in Figure 1.5.
Analytes that elute from the column are directed towards a hydrogen-air diffusion flame and are
subsequently combusted to produce carbon dioxide, water and CH-radicals which can react further to form
charged species:
CH. + O
. CHO
+ + e
-
These charged species react with water molecules present in the flame to produce hydronium ions and
carbon monoxide:
CHO+ + H2O H3O
+ + CO
The positively charged species are captured by a negatively biased collector electrode which is positioned
above the flame to produce a measurable current proportional to the number of carbon atoms present in the
flame at a certain time. Collection of ions is facilitated by the use of an extraction potential or a make-up gas
flow to accelerate the formed ions towards the collector.
Figure 1.5: Schematic overview of a FID[19]
.
12
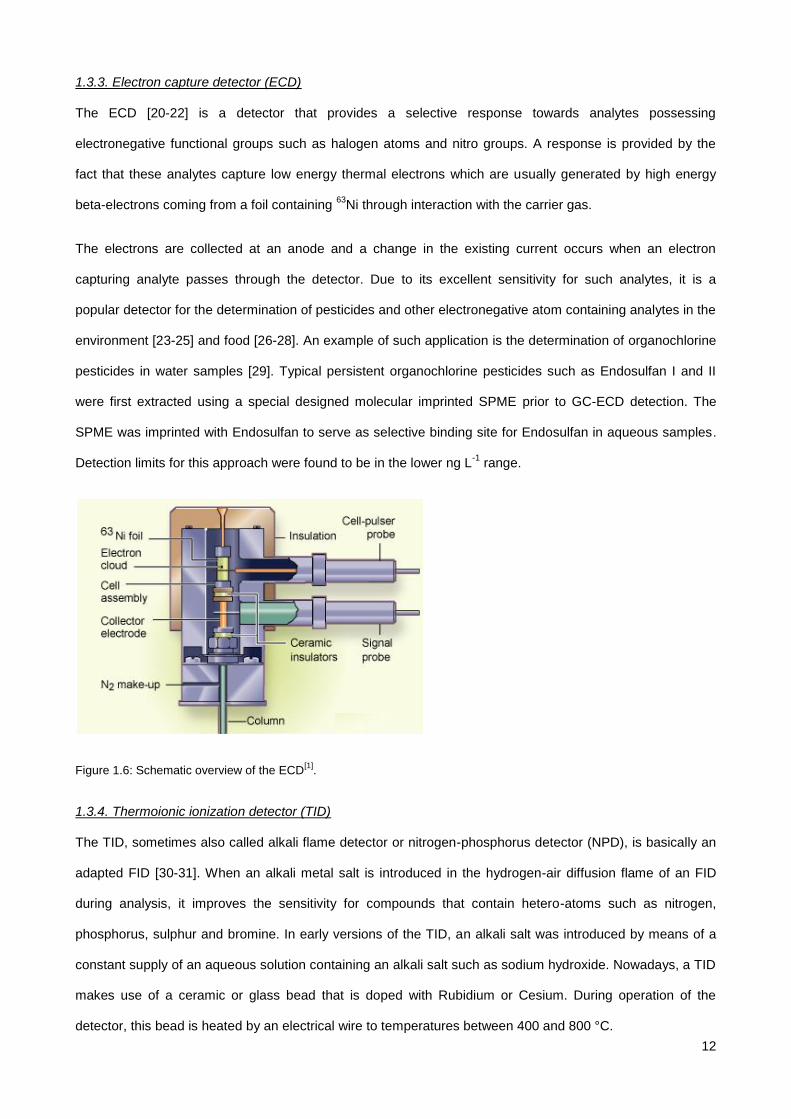
1.3.3. Electron capture detector (ECD)
The ECD [20-22] is a detector that provides a selective response towards analytes possessing
electronegative functional groups such as halogen atoms and nitro groups. A response is provided by the
fact that these analytes capture low energy thermal electrons which are usually generated by high energy
beta-electrons coming from a foil containing 63
Ni through interaction with the carrier gas.
The electrons are collected at an anode and a change in the existing current occurs when an electron
capturing analyte passes through the detector. Due to its excellent sensitivity for such analytes, it is a
popular detector for the determination of pesticides and other electronegative atom containing analytes in the
environment [23-25] and food [26-28]. An example of such application is the determination of organochlorine
pesticides in water samples [29]. Typical persistent organochlorine pesticides such as Endosulfan I and II
were first extracted using a special designed molecular imprinted SPME prior to GC-ECD detection. The
SPME was imprinted with Endosulfan to serve as selective binding site for Endosulfan in aqueous samples.
Detection limits for this approach were found to be in the lower ng L-1
range.
Figure 1.6: Schematic overview of the ECD[1]
.
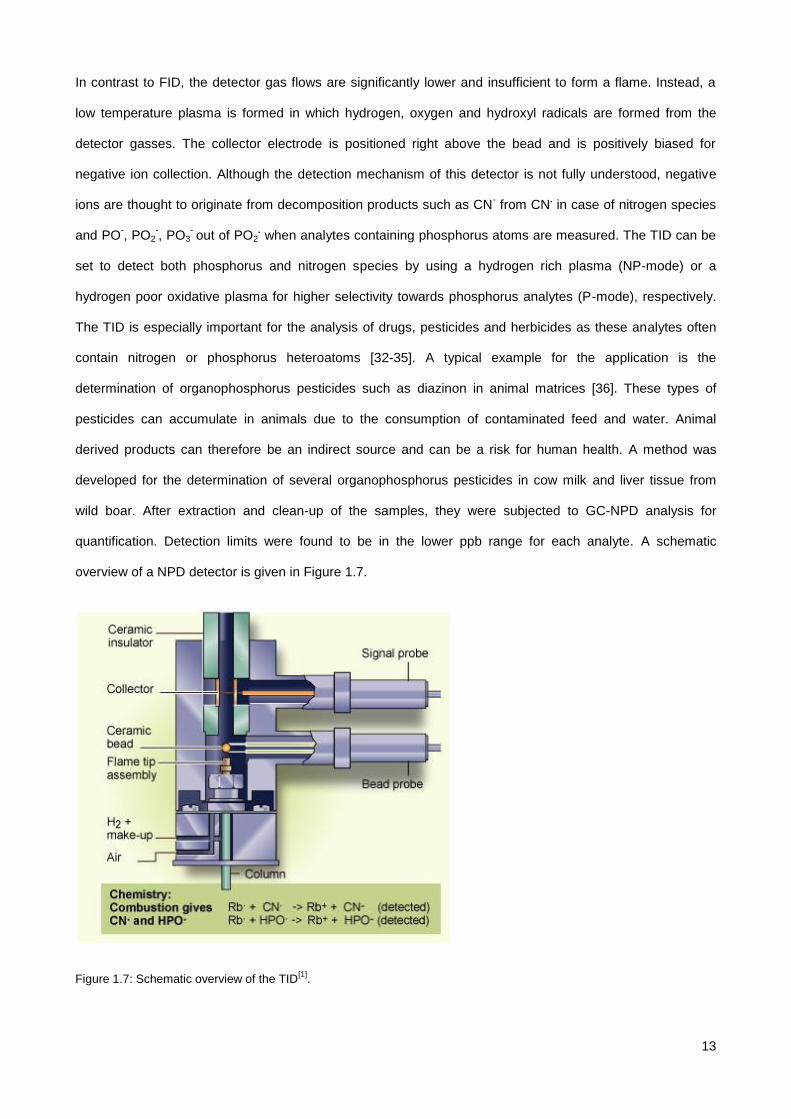
1.3.4. Thermoionic ionization detector (TID)
The TID, sometimes also called alkali flame detector or nitrogen-phosphorus detector (NPD), is basically an
adapted FID [30-31]. When an alkali metal salt is introduced in the hydrogen-air diffusion flame of an FID
during analysis, it improves the sensitivity for compounds that contain hetero-atoms such as nitrogen,
phosphorus, sulphur and bromine. In early versions of the TID, an alkali salt was introduced by means of a
constant supply of an aqueous solution containing an alkali salt such as sodium hydroxide. Nowadays, a TID
makes use of a ceramic or glass bead that is doped with Rubidium or Cesium. During operation of the
detector, this bead is heated by an electrical wire to temperatures between 400 and 800 °C.
13
In contrast to FID, the detector gas flows are significantly lower and insufficient to form a flame. Instead, a
low temperature plasma is formed in which hydrogen, oxygen and hydroxyl radicals are formed from the
detector gasses. The collector electrode is positioned right above the bead and is positively biased for
negative ion collection. Although the detection mechanism of this detector is not fully understood, negative
ions are thought to originate from decomposition products such as CN- from CN
. in case of nitrogen species
and PO-, PO2
-, PO3
- out of PO2
. when analytes containing phosphorus atoms are measured. The TID can be
set to detect both phosphorus and nitrogen species by using a hydrogen rich plasma (NP-mode) or a
hydrogen poor oxidative plasma for higher selectivity towards phosphorus analytes (P-mode), respectively.
The TID is especially important for the analysis of drugs, pesticides and herbicides as these analytes often
contain nitrogen or phosphorus heteroatoms [32-35]. A typical example for the application is the
determination of organophosphorus pesticides such as diazinon in animal matrices [36]. These types of
pesticides can accumulate in animals due to the consumption of contaminated feed and water. Animal
derived products can therefore be an indirect source and can be a risk for human health. A method was
developed for the determination of several organophosphorus pesticides in cow milk and liver tissue from
wild boar. After extraction and clean-up of the samples, they were subjected to GC-NPD analysis for
quantification. Detection limits were found to be in the lower ppb range for each analyte. A schematic
overview of a NPD detector is given in Figure 1.7.
Figure 1.7: Schematic overview of the TID[1]
.
14
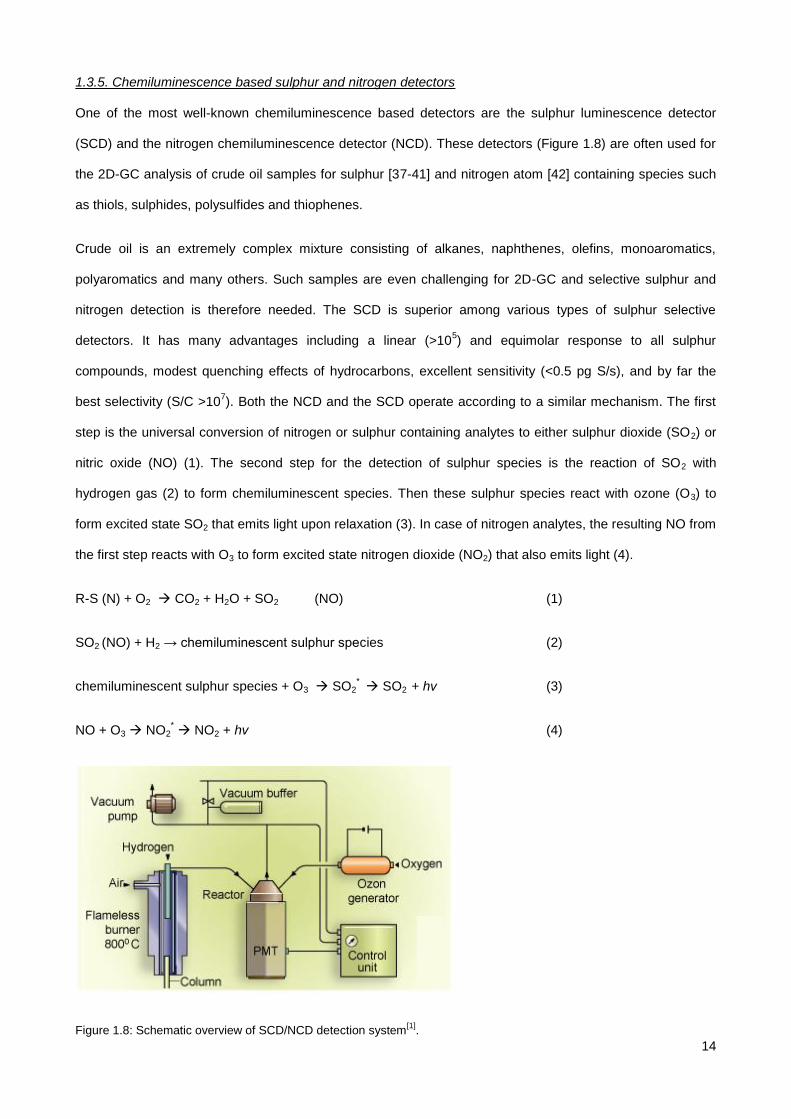
1.3.5. Chemiluminescence based sulphur and nitrogen detectors
One of the most well-known chemiluminescence based detectors are the sulphur luminescence detector
(SCD) and the nitrogen chemiluminescence detector (NCD). These detectors (Figure 1.8) are often used for
the 2D-GC analysis of crude oil samples for sulphur [37-41] and nitrogen atom [42] containing species such
as thiols, sulphides, polysulfides and thiophenes.
Crude oil is an extremely complex mixture consisting of alkanes, naphthenes, olefins, monoaromatics,
polyaromatics and many others. Such samples are even challenging for 2D-GC and selective sulphur and
nitrogen detection is therefore needed. The SCD is superior among various types of sulphur selective
detectors. It has many advantages including a linear (>105) and equimolar response to all sulphur
compounds, modest quenching effects of hydrocarbons, excellent sensitivity (<0.5 pg S/s), and by far the
best selectivity (S/C >107). Both the NCD and the SCD operate according to a similar mechanism. The first
step is the universal conversion of nitrogen or sulphur containing analytes to either sulphur dioxide (SO2) or
nitric oxide (NO) (1). The second step for the detection of sulphur species is the reaction of SO2 with
hydrogen gas (2) to form chemiluminescent species. Then these sulphur species react with ozone (O3) to
form excited state SO2 that emits light upon relaxation (3). In case of nitrogen analytes, the resulting NO from
the first step reacts with O3 to form excited state nitrogen dioxide (NO2) that also emits light (4).
R-S (N) + O2 CO2 + H2O + SO2 (NO) (1)
SO2 (NO) + H2 → chemiluminescent sulphur species (2)
chemiluminescent sulphur species + O3 SO2* SO2 + hv (3)
NO + O3 NO2* NO2 + hv (4)
Figure 1.8: Schematic overview of SCD/NCD detection system[1]
.
15
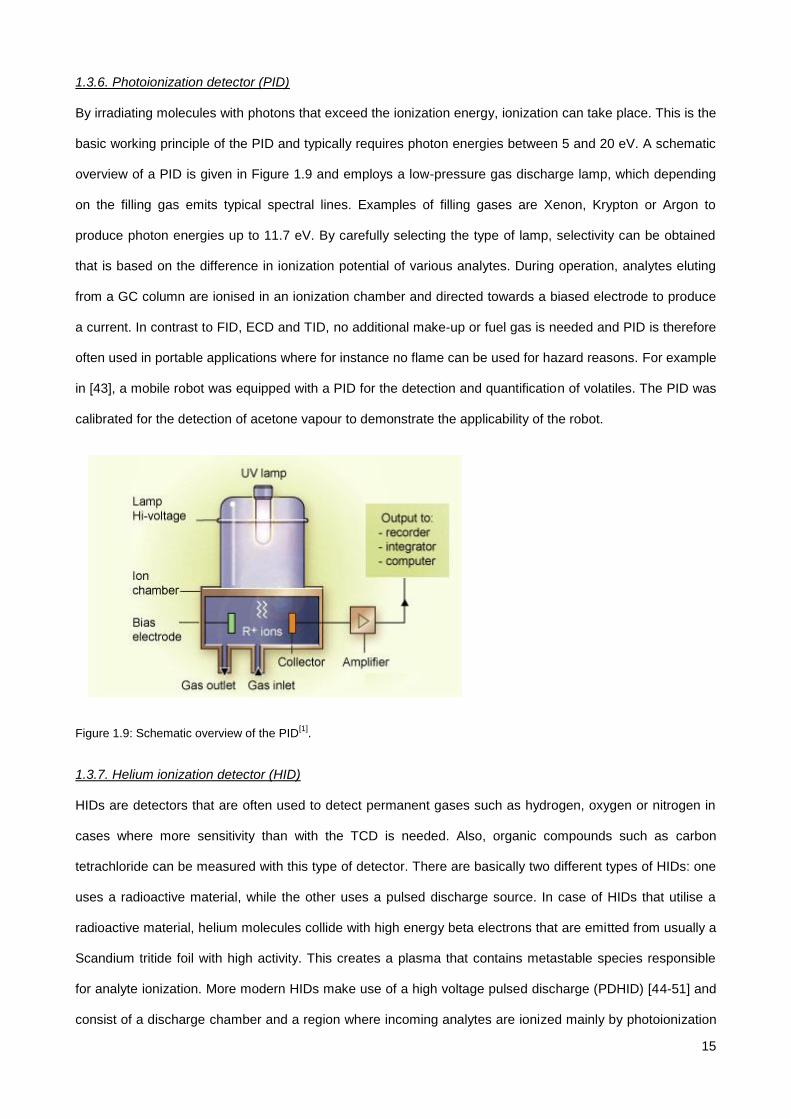
1.3.6. Photoionization detector (PID)
By irradiating molecules with photons that exceed the ionization energy, ionization can take place. This is the
basic working principle of the PID and typically requires photon energies between 5 and 20 eV. A schematic
overview of a PID is given in Figure 1.9 and employs a low-pressure gas discharge lamp, which depending
on the filling gas emits typical spectral lines. Examples of filling gases are Xenon, Krypton or Argon to
produce photon energies up to 11.7 eV. By carefully selecting the type of lamp, selectivity can be obtained
that is based on the difference in ionization potential of various analytes. During operation, analytes eluting
from a GC column are ionised in an ionization chamber and directed towards a biased electrode to produce
a current. In contrast to FID, ECD and TID, no additional make-up or fuel gas is needed and PID is therefore
often used in portable applications where for instance no flame can be used for hazard reasons. For example
in [43], a mobile robot was equipped with a PID for the detection and quantification of volatiles. The PID was
calibrated for the detection of acetone vapour to demonstrate the applicability of the robot.
Figure 1.9: Schematic overview of the PID[1]
.
1.3.7. Helium ionization detector (HID)
HIDs are detectors that are often used to detect permanent gases such as hydrogen, oxygen or nitrogen in
cases where more sensitivity than with the TCD is needed. Also, organic compounds such as carbon
tetrachloride can be measured with this type of detector. There are basically two different types of HIDs: one
uses a radioactive material, while the other uses a pulsed discharge source. In case of HIDs that utilise a
radioactive material, helium molecules collide with high energy beta electrons that are emitted from usually a
Scandium tritide foil with high activity. This creates a plasma that contains metastable species responsible
for analyte ionization. More modern HIDs make use of a high voltage pulsed discharge (PDHID) [44-51] and
consist of a discharge chamber and a region where incoming analytes are ionized mainly by photoionization
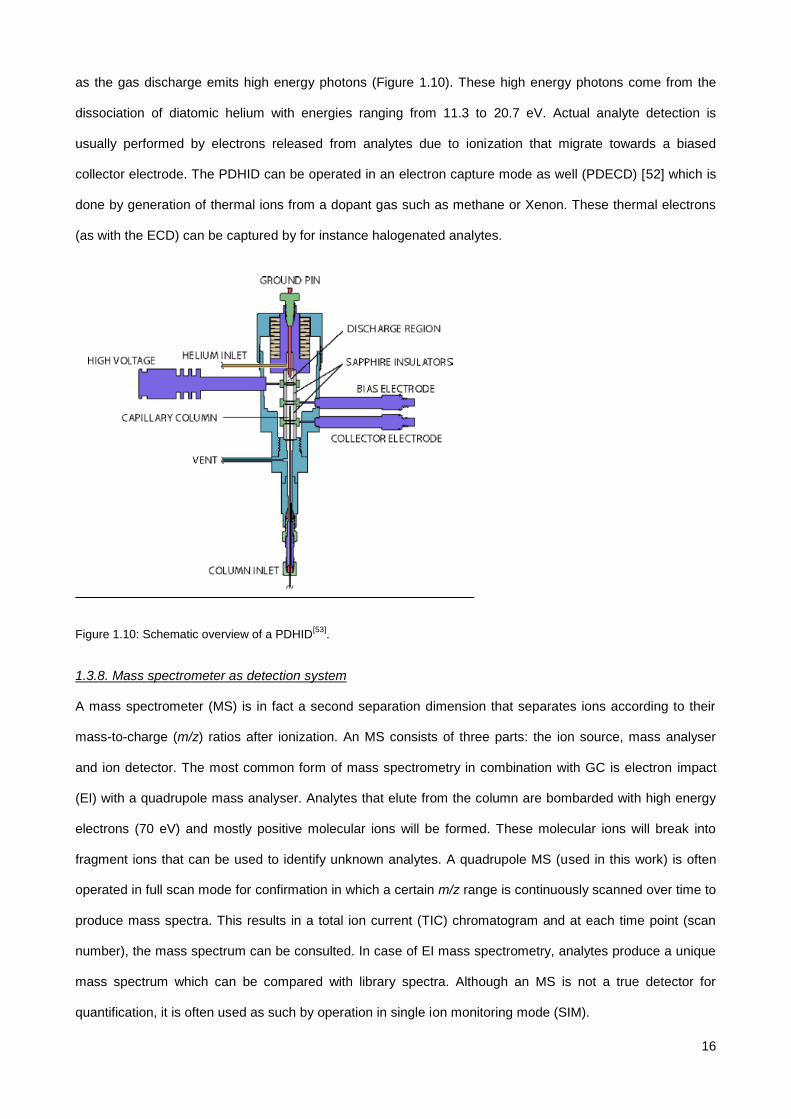
16
as the gas discharge emits high energy photons (Figure 1.10). These high energy photons come from the
dissociation of diatomic helium with energies ranging from 11.3 to 20.7 eV. Actual analyte detection is
usually performed by electrons released from analytes due to ionization that migrate towards a biased
collector electrode. The PDHID can be operated in an electron capture mode as well (PDECD) [52] which is
done by generation of thermal ions from a dopant gas such as methane or Xenon. These thermal electrons
(as with the ECD) can be captured by for instance halogenated analytes.
Figure 1.10: Schematic overview of a PDHID[53]
.
1.3.8. Mass spectrometer as detection system
A mass spectrometer (MS) is in fact a second separation dimension that separates ions according to their
mass-to-charge (m/z) ratios after ionization. An MS consists of three parts: the ion source, mass analyser
and ion detector. The most common form of mass spectrometry in combination with GC is electron impact
(EI) with a quadrupole mass analyser. Analytes that elute from the column are bombarded with high energy
electrons (70 eV) and mostly positive molecular ions will be formed. These molecular ions will break into
fragment ions that can be used to identify unknown analytes. A quadrupole MS (used in this work) is often
operated in full scan mode for confirmation in which a certain m/z range is continuously scanned over time to
produce mass spectra. This results in a total ion current (TIC) chromatogram and at each time point (scan
number), the mass spectrum can be consulted. In case of EI mass spectrometry, analytes produce a unique
mass spectrum which can be compared with library spectra. Although an MS is not a true detector for
quantification, it is often used as such by operation in single ion monitoring mode (SIM).
17
With SIM, only ions with particular m/z values are allowed to be detected and target analytes will be
selectively detected for quantification.
1.3.9. Shortcomings of GC detectors
Since its development, the FID became the workhorse for quantitative GC analysis of various carbon atom
containing compounds. The FID is known for its simple construction, ease of operation, robustness and
unsurpassed sensitivity for alkanes. However, compounds containing heteroatoms such as oxygen, nitrogen,
sulphur, phosphorus, chlorine, bromine and iodine are detected with less sensitivity because carbon atoms
are only partly oxidised in such substances. This makes the FID detector unsuitable for the detection of
analytes such as carbon tetrachloride which contains only one fully substituted carbon atom that cannot be
oxidised. Moreover, the FID does not provide the possibility to identify or provide structural information for
unknown compounds that could be detected during screening. Identification is only possible with suitable
reference standards of which retention times are compared with these of unknowns. For this reason,
analytes such as polychlorobiphenyls (PCBs), nitrogen or phosphorus containing pesticides and herbicides
are usually detected with the aforementioned selective detectors such as the ECD or TID. However, the
radio-active element that is used in the ECD gives rise to legislation issues and as with all selective detectors
universality is lost. Mass spectrometry (MS) can both serve to identify and quantify analytes. However, MS
needs an expensive vacuum system to operate and the ionization efficiency of the used filament with EI is
rather low like the hydrogen diffusion flame of the FID. Where the TCD is generally not sensitive enough, the
PDHID is often employed as detector for trace analysis. However, this detector uses a fairly high helium
make-up flow (30 mL/min) to counteract the column flow containing the analytes to avoid direct interaction
with the discharge. The necessity for high helium flows is not desired as helium becomes increasingly more
expensive and possible ionization pathways are limited due to the detector set-up. It is true that many of the
described GC detectors need additional gases and vacuum (in case of the SCD, NCD and MS) for operation
which limits the portability. PID on the other hand is not sensitive for halogenated aliphatics and has no
response at all for methane.
18
1.4. Aim of the study
Seen the drawbacks of sHS, in chapter 2 the use of FET is explored for the analysis of different high boiling
apolar analytes in apolar matrices. To avoid the problems related to GC analysis of aqueous samples,
removal of water prior to GC analysis of aqueous samples is necessary. This can be performed with
techniques such as HS trap which uses an adsorbent to selectively retain analytes and allows sample
enrichment. However, this approach could still result in problems with analytes such as ethylene glycol (EG)
that are prone to interact with parts of the system. An easier approach would be to remove the water before
GC analysis is performed. So, Chapter 3 is devoted to the application of water scavenging using acetone
acetals in an attempt to enrich aqueous samples prior to FET analysis. Chapter 4 deals with the problems
related to the analysis of QAS in aqueous samples by investigating whether the use of HS sampling can
generate volatile products for the indirect quantification of various QAS. Such approach would be beneficial
as non-volatile degradation products are not introduced in the GC system leading to a more robust method.
Where chapters 2-4 mainly cover aspects of improved sample introduction and sample preparation, chapter
5 is focusing on GC detectors. Many issues around the existing GC detectors are related to their ion source
and a detection system that can circumvent the issues discussed in 1.3.9. would be very beneficial. A
prototype GC detector using a microhollow cathode discharge (MHCD) as ion source is presented as
alternative to the described detectors. A detector using an ion source with higher ionization efficiency and
possibility to obtain structural information could possibly replace many of the aforementioned GC detectors.
In this chapter, the theory around MHCD‘s is covered and experimental results around the development are
presented.
19
1.5. References
[1] D.C. Harris, 2005, Quantitative chemical analysis, W.H. Freeman and Company, USA 7th
Ed., 538-540
[2] Snow, N. H. In Modern Practice of Gas Chromatography, 4th ed.; Grob, R. L., Barry, E. F., Eds.; John
Wiley & Sons: Hoboken, NJ, 2004.
[3] K. Grob, T. Laubli, High oven temperature on-column injection in capillary gas chromatography II.
Avoidance of peak distortion, J. Chromatogr. A, 357 (1986) 345-355
[4] W. Vogt, K. Jacob, H.W. Obwexer, Sampling method in capillary column gas—liquid chromatography
allowing injections of up to 250 μL, J. Chromatogr. A, 174 (1979) 437-439
[5] W. Vogt, K. Jacob, A. Ohnesorge, H.W. Obwexer, Capillary gas chromatographic injection system for
large sample volumes, J. Chromatogr. A, 186 (1979) 197-205
[6] J.J. van Deemter, F.J. Zuiderweg, A. Klinkenberg, Longitudinal diffusion and resistance to mass transfer
as causes of nonideality in chromatography, Chem. Eng. Sci. 5 (1956) 271-289
[7] B. Kolb, L. Ettre, Static Headspace – Gas chromatography: Theory and Practice, 2nd ed.; Wiley-VCH:
Weinheim, 1997.
[8] A Technical Guide for Static Headspace Analysis Using GC, Restek Corp. (2000).
[9] A. Brault, V. Agasse, P. Cardinael, J.C. Combret, The full evaporation technique: A promising alternative
for residual solvent analysis in solid samples, J. Sep. Science, 28 (2005) 380-386
[10] X.S. Chai, Q.X. Hou, F.J. Schork, Determination of residual monomer in polymer latex by full
evaporation headspace gas chromatography, J. Chromatogr. A, 1040 (2004) 163-167
[11] H. Li, H. Zhan, S. Fu, M. Lui, X.S. Chai, Rapid determination of methanol in black liquors by full
evaporation headspace gas chromatography, J. Chromatogr. A, 1175 (2007) 133-136
[12] M. Markelov, J.P. Guzowski Jr, Matrix independent headspace gas chromatographic analysis. The full
evaporation technique, Anal. Chim. Acta, 276 (1993) 235-245
[13] J. Schuberth, Volatile organic compounds determined in pharmaceutical products by full evaporation
technique and capillary gas chromatography/ion-trap detection, Anal. Chem., 68 (1996) 1317-1320
20
[14] J. Schuberth, A full evaporation headspace technique with capillary GC and ITD: A means for
quantitating volatile organic compounds in biological samples, J. Sep. Science, 34 (1996) 314-319
[15] D.M. Kialengila, K. Wolfs, J. Bugulama, A. Van Schepdael, E. Adams, Full evaporation headspace gas
chromatography for sensitive determination of high boiling point volatile organic compounds in low boiling
matrices, J. Chromatogr. A, 1315 (2013) 167-175
[16] X.S. Chai, Q. Luo, J.Y. Zhu, Analysis of non-volatile species in a complex matrix by headspace gas
chromatography, J. Chromatogr. A, 909 (2001) 249-257
[17] I.G. McWilliam, R. A. Dewar, Flame ionization detector for gas chromatography, Nature, 181 (1958) 760-
760
[18] J. Harley, W. Nel, V. Pretorius, Flame ionization detector for gas chromatography, Nature, 181 (1958)
177-178
[19] www.sepscience.com. Accessed on 1-7-2016.
[20] J.E. Lovelock, The electron capture detector, J. Chromatogr., 99 (1974) 3-12
[21] E.D. Pellizari, Electron capture detection in gas chromatography, J. Chromatogr., 98 (1974) 323-361
[22] J.E. Lovelock, A.J. Watson, Electron capture detector. Theory and practice, J. Chromatogr., 158 (1978)
123-138
[23] Y.S. Su, J.F. Jen, Determination of organophosporous pesticides in water using in-syringe ultrasound-
assisted emulsification and gas chromatography with electron-capture detection, J. Chromatogr. A, 1217
(2010) 5043-5049
[24] N. Fattahi, Y. Assadi, M.R.M. Hosseini, E.Z. Jahromi, Determination of chlorophenols in water samples
using simultaneous dispersive liquid-liquid microextraction and derivatization followed by gas
chromatography-electron-capture detection, J. Chromatogr. A, 1157 (2007) 23-29
[25] M.Y. Tsai, P.V. Kumar, H.P. Li, J.F. Jen, Analysis of hexachlorocyclohexanes in aquatic samples by
one-step microwave-assisted headspace controlled-temperature liquid-phase microextraction and gas
chromatography with electron capture detection, J. Chromatogr. A, 1217 (2010) 1891-1897
21
[26] C.K. Zacharis, I. Rotsias, P.G. Zachariadis, A. Zotos, Dispersive liquid-liquid microextraction for the
determination of organochlorine pesticides residues in honey by gas chromatography-electron capture and
ion trap mass spectrometric detection, Food Chemistry, 134 (2012) 1665-1672
[27] P.C. Abhilash, V. Singh, N. Singh, Simplified determination of combined residues of lindane and other
HCH isomers in vegetables, fruits, wheat, pulses and medicinal plants by matrix solid-phase dispersion
(MSPD) followed by GC-ECD, Food Chemistry, 113 (2009) 267-271
[28] G.P. de Pinho, A.A. Neves, M.E.L.R. de Querioz, F.O. Silvério, Optimization of the liquid-liquid extraction
method and low temperature purification (LLE-LTP) for pesticide residue analysis in honey samples by gas
chromatography, Food Control, 21 (2010) 1307-1311
[29] H. Shaikh, N. Memon, M.I. Bhanger, S.M. Nizamani, A. Denizli, Core shell molecularly imprinted
polymer-based solid-phase microextraction fiber for ultra trace analysis of endosulfan I and II in real aqueous
matrix through gas chromatography-micro electron capture detector, J. Chromatogr. A, 1337 (2014) 179-187
[29] E. D. Conte, E. F. Barry, Alkali flame ionization detector for gas chromatography using an alkali salt
aerosol as the enhancement source, J. Chromatogr., 644 (1993) 349-355
[30] H. Snijders, H. Janssen, C. Cramers, Design and optimization of a novel type nitrogen-phosphorus
detector for capillary gas chromatography, J. Chromatogr. A, 732 (1996) 51-61
[31] V.V. Brazhnikov, E.B. Shmidel, Thermoionic ionization detector for the analysis of phosphorus and
nitrogen containing organic compounds, J. Chrom., 122 (1976) 527-534
[32] A. Salemi, R. Rasoolzadeh, M.M. Nejad, M. Vosough, Ultrasonic assisted headspace single drop micro-
extraction and gas chromatography with nitrogen-phosphorus detector for determination of
organophosphoros pesticides in soil, Anal. Chim. Acta, 769 (2013) 121-126
[33] J.J. Jiménez, J.L. Bernal, M.J. del Nozal, L. Toribio, E. Arias, Analysis of pesticide residues in wine by
solid-phase extraction and gas chromatography with electron capture and nitrogen-phosphorus detection, J.
Chromatogr. A, 919 (2001) 147-156
[34] G. Pagliuca, T. Gazotti, E. Zironi, P. Sticca, Residue analysis of organophosphorus pesticides in animal
matrices by dual column capillary gas chromatography with nitrogen-phosphorus detection, J. Chromatogr.
A, 1071 (2005) 67-70
22
[35] J. Fenoll, P. Hellín, C.M. Martínez, M. Miguel, P. Flores, Multiresidue method for analysis of pesticides in
pepper and tomato by gas chromatography with nitrogen-phosphorous detection, Food Chemistry, 105
(2007) 711-719
[36] G. Pagliuca, T. Gazotti, E. Zironi, P. Sticca, Residue analysis of organophosphorus pesticides in animal
matrices by dual column capillary gas chromatography with nitrogen-phosphorus detection, J. Chromatogr.
A, 1071 (2005) 67-70
[37] X. Yan, Sulfur and nitrogen chemiluminescence detection in gas chromatographic analysis, J.
Chromatogr. A, 976 (2002) 3-10
[38] R. Hua, J. Wang, H. Kong, J. Lui, X. Lu, G. Xu, Analysis of sulfur-containing compounds in crude oils by
comprehensive two-dimensional gas chromatography with sulphur chemiluminescence detection, J. Sep.
Sci., 27 (2004) 691–698
[39] B. Chawla, F. Di Sanzo, Determination of sulfur components in light petroleum streams by high-
resolution gas chromatography with chemiluminescence detection, J. Chromatogr. A, 589 (1992) 271-279
[40] R. Hua, Y. Li, W. Liu, J. Zheng, H. Wei, J. Wang, X. Lu, H. Kong, G. Xu, Determination of sulfur-
containing compounds in diesel oils by comprehensive two-dimensional gas chromatography with a sulfur
chemiluminescence detector, J. Chromatogr. A, 1019 (2003) 101-109
[41] C. L. Garcia, M. Becchi, M.F. Grenier-Loustalot, O. Païsse, R. Szymanski, Analysis of aromatic sulfur
compounds in gas oils using GC with sulfur chemiluminescence detection and high-resolution MS, Anal.
Chem., 74 (2002) 3849-3857
[42] H.E. Toraman, T. Dijkmans, M.R. Djokic, K.M. Van der Geem, G.B. Marin, Detailed compositional
characterization of plastic waste pyrolysis oil by comprehensive two-dimensional gas-chromatography
coupled to multiple detectors, J. Chromatogr. A, 1359 (2014) 237-246
[43] D. Martínez, J. Moreno, M. Tresanchez, M. Teixidó, D. Font, A. Pardo, S. Marco, J. Palacín,
Experimental application of an autonomous mobile robot for gas leak detection in indoor environments,
Fusion 2014, 17th International Conference on Information Fusion
[44] D.S. Forsyth, Pulsed discharge detector: theory and applications, J. Chrom. A, 1050 (2004) 63-68
23
[45] W.E. Wentworth, H. Cai, S. Stearns, Pulsed discharge helium ionization detector. Universal detector for
inorganic and organic compounds at the low picogram level, J. Chromatogr. A, 688 (1994) 135-152
[46] S. Mendoca, W.E. Wentworth, E.C.M. Chen, S.D. Stearns, Relative responses of various classes of
compounds using a pulsed discharge helium photoionization detector: Experimental determination and
theoretical calculations, J. Chromatogr. A, 749 (1996) 131-148
[47] M.T. Roberge, J.W. Finley, H.C. Lukaski, A.J. Borgerding, Evaluation of the pulsed discharge helium
ionization detector for the analysis of hydrogen and methane in breath, J. Chromatogr. A, 1027 (2004) 19-23
[48] J.G. Dojahn, W.E. Wentworth, S.N. Deming, S.D. Stearns, Determination of percent composition of a
mixture analysed by gas chromatography. Comparison of a helium pulsed-discharge photoionization detector
with a flame ionization detector, J. Chromatogr. A, 917 (2001) 187-204
[49] H. Cai, S.D. Stearns, Pulsed discharge helium ionization detector with multiple combined bias/collecting
electrodes for gas chromatography, J. Chromatogr. A, 1284 (2013) 163-173
[50] S.H. Kim, S.M. Nam, K.O. Koh, Y.W. Choi, Analysis of natural gas using single capillary column and a
pulsed discharge helium ionization detector, Bull. Korean. Chem. Soc., 20 (1999) 843-845
[51] M.C. Hunter, K.D. Bartle, P.W. Seakins, A.C. Lewis, Direct measurement of atmospheric formaldehyde
using gas chromatography-pulsed discharge ionisation detection, Anal. Commun., 36 (1999) 101-104
[52] W.E. Wentworth, K. Sun, D. Zhang, J. Madabushi, S.D. Stearns, Pulsed discharge emission detector: an
element-selective detector for gas chromatography, J. Chromatogr. A, 872 (2000) 119-140
[53] www.vici.com. Accessed on 1-7-2016.
24
Chapter 2 - Evaluation of the full evaporation technique for quantitative analysis of
high boiling compounds with high affinity for apolar matrices
Niels van Boxtel, Kris Wolfs, Ann Van Schepdael, Erwin Adams
Pharmaceutical Analysis, Department of Pharmaceutical and Pharmacological Sciences
KU Leuven, Leuven, Belgium
J. Chromatogr. A 2014, 1348, 63–70

25
26
Abstract
In order to reduce inaccuracies due to possible matrix effects in conventional static headspace-gas
chromatography (sHS-GC), it is standard practice to match the composition of calibration standards towards
the composition of the sample to be analysed by adding blank matrix. However, the latter is not always
available and in that case the full evaporation technique (FET) could be a solution. With FET a small sample
volume is introduced in a HS vial and compounds of interest are completely evaporated. Hence no
equilibrium between the condensed phase and vapour phase exists. Without the existence of an equilibrium,
matrix effects are less likely to occur. Another issue often encountered with sHS-sampling is that low vapour
pressure compounds with a high affinity for the dilution medium show a limited sensitivity. FET has proven to
be an appropriate solution to address this problem too.
In this work, the applicability of FET for the quantitative analysis of high boiling compounds in different
complex apolar matrices is examined. Data show that FET is an excellent tool to overcome matrix effects
often encountered with conventional sHS analysis. The tested method shows excellent recovery with
recovery values around 100% as well as repeatability with RSD values around 1% for the quantification of
high boiling compounds (bp. > 200 °C) such as camphor, menthol, methyl salicylate and ethyl salicylate in
various matrices. LOQ values were found to be around 0.3 µg per vial. Following validation of the technique,
several topical pharmaceutical formulations like ThermoCream®, Reflexspray
®, Vicks Vaporub
® and
Radosalil®
were examined. For the latter, a comparison has been made with a sHS-method described in
literature.
Keywords
Matrix effect, Full Evaporation Technique, Static headspace
27
2.1. Introduction
Static headspace (sHS) sampling is widely used for the quantitative analysis of volatile compounds in a
variety of matrices due to its simplicity and cleanliness of introducing volatiles of interest into a gas
chromatograph. A disadvantage of this technique is the possibility of matrix effects causing signal differences
between the sample and calibration standards [1]. Matrix effects are any form of interaction in the condensed
phase that influences the equilibrium between the condensed and vapour phase in a HS vial. A way to solve
this problem is to add blank matrix to calibration standards in order to compensate for the matrix. However,
this is not always possible as blank matrix is not always available. So, quantification of volatiles can be
inaccurate because matrix effects can influence the established equilibrium between the condensed and
vapour phase in a HS vial and thus can give rise to different response factors for a certain compound in
different matrices. Possible methods to address this problem are multiple headspace extraction (MHE),
standard addition method (SAM) and full evaporation technique (FET). However, MHE can be very time
consuming and SAM can only be performed when enough sample is available. In contrast to these
techniques, FET only uses very small amounts of sample and this procedure does not take more time to
perform than conventional sHS. With FET, all volatile compounds of interest are transferred completely to the
vapour phase and the matrix no longer influences the equilibrium between vapour and condensed phase.
FET has proven to be a useful technique to avoid matrix effects during analysis of both solid and liquid
samples [2-7]. FET has also proven to be useful for the analysis of high boiling solvents (low vapour
pressure) with high affinity for water (high K value) in an aqueous matrix. Using conventional sHS-sampling,
this determination is difficult since the sensitivity for these high boiling compounds is limited [8]. The same
issue regarding sensitivity could arise when high boiling compounds have high affinity for apolar matrices
and/or dilution media.
The aim of this work was to investigate the applicability of FET on the quantification of high boiling
compounds (bp > 200 °C) with high affinity for different apolar matrices. The quantitative analysis of camphor
(C), DL-menthol (M), methyl salicylate (MeS) and ethyl salicylate (EtS) in different pharmaceutical products
was taken as an example. These compounds are usually analysed with either sHS-sampling or direct
injection [9-11]. The drawbacks of sHS are mentioned above while direct injection suffers from clogging and
sample adsorption in the injector. Aspects like linearity, repeatability and recovery were evaluated.
Calibration curves obtained with matrix-matched standards were compared with those obtained with solvent-
based standards to check for the absence of matrix effects. In order to evaluate the advantage of FET over
28
sHS for the analysis of apolar high boiling compounds in an apolar matrix, a typical sample containing the
aforementioned compounds was analysed with both techniques.
2.2. Theory
With conventional sHS-GC, an equilibrium exists in a sealed HS vial containing a condensed and a vapour
phase, both with a particular volume:
Where Vg is the volume of the vapour phase, Vl the volume of the liquid phase (condensed phase) and Vv the
total volume (volume of the vial). If a sample with volume V0 containing a concentration C0 is transferred in a
vial, the sum of the absolute amounts in the vapour and condensed phase after equilibration equals the total
amount of sample before equilibration:
Where Cl is the concentration of the analyte in the liquid phase and Cg the concentration in the gas phase.
With FET, only a very small amount of sample is transferred into the vial and sufficiently heated. As a result,
Vl will approach zero due to near complete evaporation. Consequently eq. 2 becomes:
so that the amount of the compound of interest in the gas phase is directly determined by the sample amount
in the HS vial. The approximate maximum volume of solvent and absolute amount of compounds that can be
introduced in a HS vial in order to meet the criterion for FET can be calculated by combining Antoine‘s
equation and the Ideal Gas law [8]. When the maximum amount of a certain compound is exceeded,
condensation will occur and the requirements for FET will not be met as the system is in sHS-mode, and
hence, possible matrix effects can occur. When performing FET-analysis, the compound that has the highest
abundance in the vial is the solvent. It has to be ensured that the pressure at equilibrium in the vial does not
exceed the pressure applied on the vial during injection. The latter pressure is determined by the
chromatographic conditions. During heating of the vial, the air that is present in the vial will also exert a
certain pressure depending on the temperature (thermal expansion). When the applied injection pressure is
not high enough to counteract the equilibration pressure, an amount of gas phase will flow into the injection
system when the needle punctures the vial. This will result in loss of sample with pressure loop systems or
29
pre-injection with balanced pressure systems. Therefore, in practice the maximum amount of solvent that
can be introduced in a vial will be lower than the calculated maximum amount that can be evaporated.
2.3. Experimental
2.3.1. Reagents and samples
C, M, MeS, EtS, (structure, boiling points and Antoine‘s constants are given in Table 2.1) and Radosalil®
stick were kindly donated by Will Pharma (Wavre, Belgium). Salicylic acid, paraffin, petroleum jelly, cetiol,
capsaicin oleoresin (containing 8% of capsaicin) and Lanette SX for the preparation of blank Radosalil®
matrix were obtained from Will Pharma as well. ThermoCream® and its blank matrix were obtained from
Sterop (Brussels, Belgium). Reflexspray® and Vicks Vaporub
® were obtained from a local pharmacy. 1-
Octanol (98%) was obtained from Janssen Chimica (Geel, Belgium), o-xylene (99%) from VWR International
(Heverlee, Belgium), DMF from Fischer Chemical (Loughborough, United Kingdom). The boiling points and
Antoine‘s coefficients of o-xylene and DMF are given in Table 2.1. n-Dodecane was purchased from Sigma-
Aldrich (Diegem, Belgium). The composition of each matrix is given in Table 2.2.
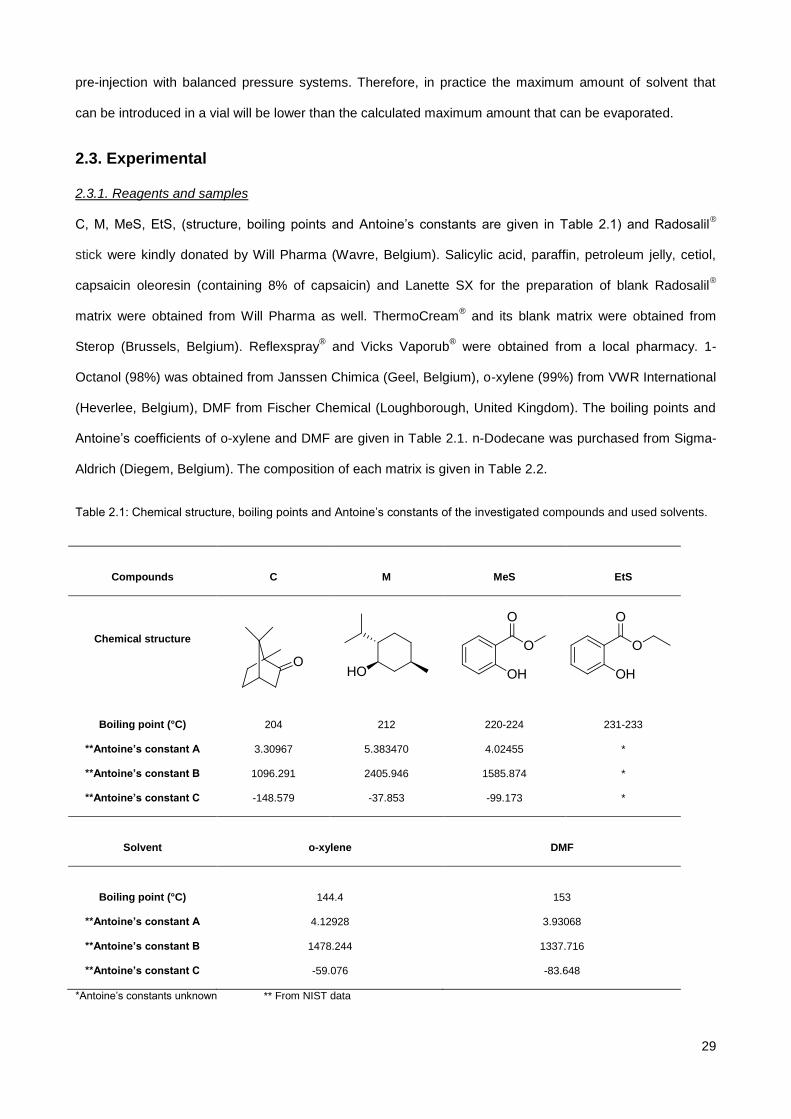
Table 2.1: Chemical structure, boiling points and Antoine‘s constants of the investigated compounds and used solvents.
Compounds
C
M
MeS
EtS
Chemical structure
Boiling point (°C)
204
212
220-224
231-233
**Antoine’s constant A 3.30967 5.383470 4.02455 *
**Antoine’s constant B 1096.291 2405.946 1585.874 *
**Antoine’s constant C -148.579 -37.853 -99.173 *
Solvent
o-xylene
DMF
Boiling point (°C)
144.4
153
**Antoine’s constant A 4.12928 3.93068
**Antoine’s constant B 1478.244 1337.716
**Antoine’s constant C -59.076 -83.648
*Antoine‘s constants unknown ** From NIST data
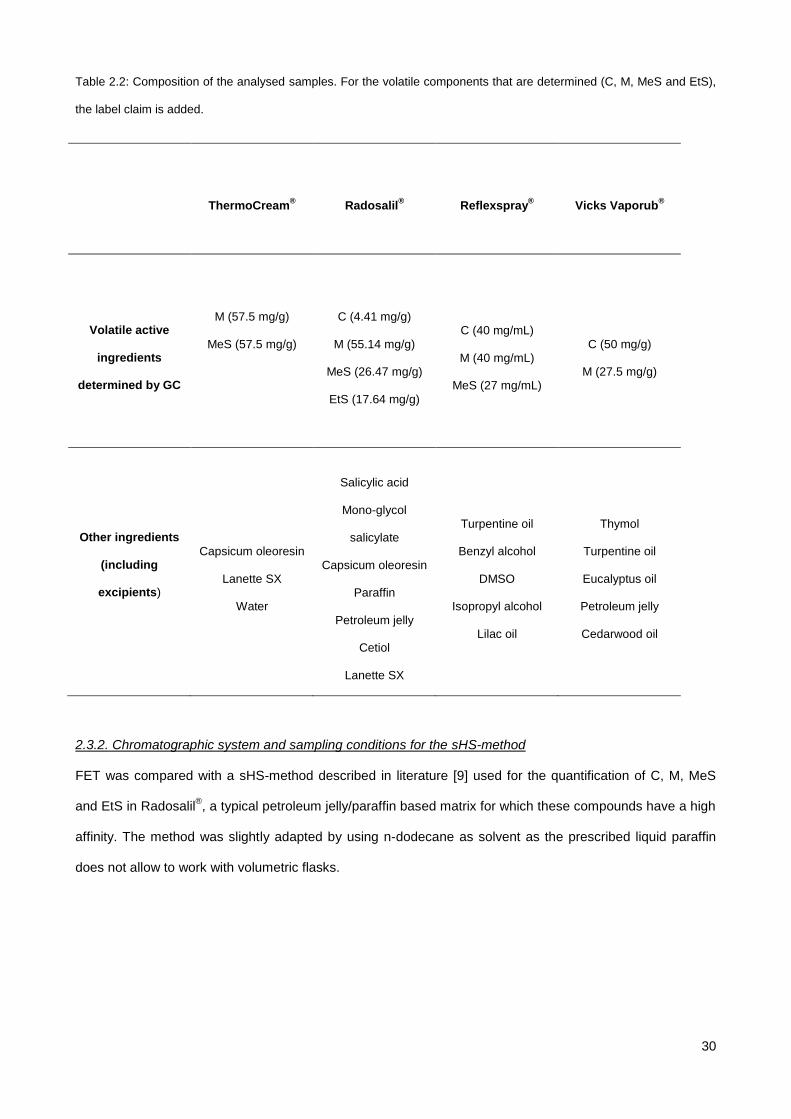
30
Table 2.2: Composition of the analysed samples. For the volatile components that are determined (C, M, MeS and EtS),
the label claim is added.
ThermoCream®
Radosalil®
Reflexspray®
Vicks Vaporub®
Volatile active
ingredients
determined by GC
M (57.5 mg/g)
MeS (57.5 mg/g)
C (4.41 mg/g)
M (55.14 mg/g)
MeS (26.47 mg/g)
EtS (17.64 mg/g)
C (40 mg/mL)
M (40 mg/mL)
MeS (27 mg/mL)
C (50 mg/g)
M (27.5 mg/g)
Other ingredients
(including
excipients)
Capsicum oleoresin
Lanette SX
Water
Salicylic acid
Mono-glycol
salicylate
Capsicum oleoresin
Paraffin
Petroleum jelly
Cetiol
Lanette SX
Turpentine oil
Benzyl alcohol
DMSO
Isopropyl alcohol
Lilac oil
Thymol
Turpentine oil
Eucalyptus oil
Petroleum jelly
Cedarwood oil
2.3.2. Chromatographic system and sampling conditions for the sHS-method
FET was compared with a sHS-method described in literature [9] used for the quantification of C, M, MeS
and EtS in Radosalil®, a typical petroleum jelly/paraffin based matrix for which these compounds have a high
affinity. The method was slightly adapted by using n-dodecane as solvent as the prescribed liquid paraffin
does not allow to work with volumetric flasks.
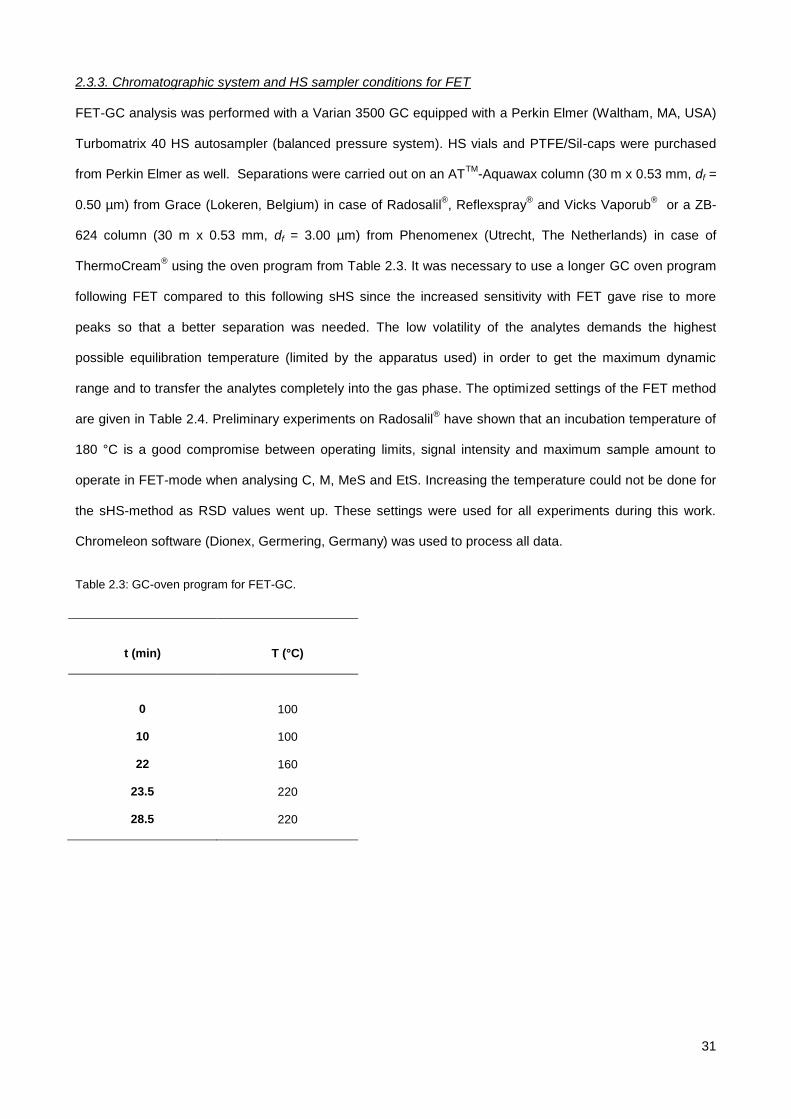
31
2.3.3. Chromatographic system and HS sampler conditions for FET
FET-GC analysis was performed with a Varian 3500 GC equipped with a Perkin Elmer (Waltham, MA, USA)
Turbomatrix 40 HS autosampler (balanced pressure system). HS vials and PTFE/Sil-caps were purchased
from Perkin Elmer as well. Separations were carried out on an ATTM
-Aquawax column (30 m x 0.53 mm, df =
0.50 µm) from Grace (Lokeren, Belgium) in case of Radosalil®, Reflexspray
® and Vicks Vaporub
® or a ZB-
624 column (30 m x 0.53 mm, df = 3.00 µm) from Phenomenex (Utrecht, The Netherlands) in case of
ThermoCream® using the oven program from Table 2.3. It was necessary to use a longer GC oven program
following FET compared to this following sHS since the increased sensitivity with FET gave rise to more
peaks so that a better separation was needed. The low volatility of the analytes demands the highest
possible equilibration temperature (limited by the apparatus used) in order to get the maximum dynamic
range and to transfer the analytes completely into the gas phase. The optimized settings of the FET method
are given in Table 2.4. Preliminary experiments on Radosalil® have shown that an incubation temperature of
180 °C is a good compromise between operating limits, signal intensity and maximum sample amount to
operate in FET-mode when analysing C, M, MeS and EtS. Increasing the temperature could not be done for
the sHS-method as RSD values went up. These settings were used for all experiments during this work.
Chromeleon software (Dionex, Germering, Germany) was used to process all data.
Table 2.3: GC-oven program for FET-GC.
t (min)
T (°C)
0
100
10 100
22 160
23.5 220
28.5 220
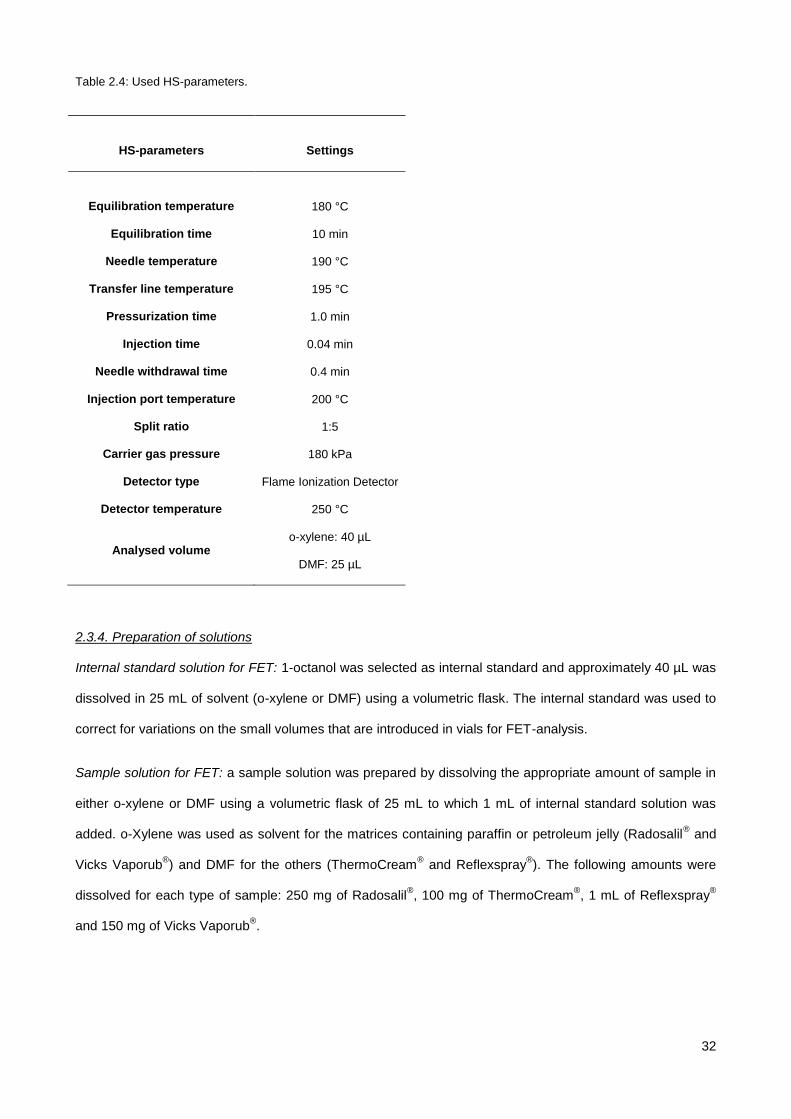
32
Table 2.4: Used HS-parameters.
HS-parameters
Settings
Equilibration temperature
180 °C
Equilibration time 10 min
Needle temperature 190 °C
Transfer line temperature 195 °C
Pressurization time 1.0 min
Injection time 0.04 min
Needle withdrawal time 0.4 min
Injection port temperature 200 °C
Split ratio 1:5
Carrier gas pressure 180 kPa
Detector type Flame Ionization Detector
Detector temperature 250 °C
Analysed volume o-xylene: 40 µL
DMF: 25 µL
2.3.4. Preparation of solutions
Internal standard solution for FET: 1-octanol was selected as internal standard and approximately 40 µL was
dissolved in 25 mL of solvent (o-xylene or DMF) using a volumetric flask. The internal standard was used to
correct for variations on the small volumes that are introduced in vials for FET-analysis.
Sample solution for FET: a sample solution was prepared by dissolving the appropriate amount of sample in
either o-xylene or DMF using a volumetric flask of 25 mL to which 1 mL of internal standard solution was
added. o-Xylene was used as solvent for the matrices containing paraffin or petroleum jelly (Radosalil® and
Vicks Vaporub®) and DMF for the others (ThermoCream
® and Reflexspray
®). The following amounts were
dissolved for each type of sample: 250 mg of Radosalil®, 100 mg of ThermoCream
®, 1 mL of Reflexspray
®
and 150 mg of Vicks Vaporub®.
33
Sample solution for sHS: approximately 1 g of Radosalil® was dissolved in 50 mL of n-dodecane using a
volumetric flask. As described in the original method, sample solutions needed to be heated to dissolve the
sample in the n-dodecane before adding up to volume [9].
Blank ThermoCream® matrix: appropriate amounts of water, Lanette SX and capsicum oleoresin (8%
capsaicin) were heated at 50 °C and mixed until a homogeneous cream was obtained. The cream was
allowed to cool down to room temperature before use.
Blank Radosalil® matrix: appropriate amounts of salicylic acid, paraffin, petroleum jelly, cetiol, capsicum
oleoresin (8% capsaicin), Lanette SX and a magnetic stir bar were put in a conical flask and sealed with a
glass stopper. The conical flask was heated and stirred until the solution was homogeneous. The solution
was allowed to cool down to room temperature to obtain solid Radosalil® blank matrix.
Calibration solutions for FET: appropriate amounts of C, M, MeS and EtS were dissolved in either DMF or o-
xylene. Dilutions were made by diluting appropriate volumes in volumetric flasks of 25 mL and adding 1 mL
of internal standard solution.
Calibration solutions for FET to check the influence of the matrix: to each of the above calibration solutions
for FET, 100 mg of blank ThermoCream®
or 250 mg of blank Radosalil® was added.
Calibration solutions for sHS: appropriate amounts of C, M, MeS and EtS were dissolved in n-dodecane,
followed by diluting appropriate volumes in volumetric flasks of 50 mL. Each calibration solution contained 1
g of blank Radosalil® for matrix compensation.
2.3.5. Sample vials
In case of FET, 40 µL of sample or calibration solution was transferred to a HS vial when o-xylene was used;
25 µL when DMF was used as solvent. With the sHS-method, a sample volume of 5 mL was brought into the
vial. Each vial was sealed with a PTFE-Sil-cap before analysis.
2.3.6. FET evaluation
Before recovery experiments were performed, it was first evaluated whether the conditions for FET-mode
were met in this particular case by analysing a range of sample volumes transferred into the vial.
34
So, Radosalil® sample solution in o-xylene was analysed using sample volumes ranging from 10 to 50 µL
with increments of 10 µL. In contradistinction with water [8], o-xylene will have almost no influence on the
viscosity of the gas phase. If FET conditions are fulfilled, a linear curve should be obtained when peak areas
of C, M, MeS and EtS are plotted vs. the introduced volume. Measurements were performed in triplicate.
2.3.7. Stability evaluation
Another important aspect of the method is to check whether thermal degradation occurs during incubation of
a sample. Experiments were performed by heating HS vials containing Radosalil®
sample for different
periods of time.
2.3.8. Matrix-matched vs. solvent-based calibration
Calibration series prepared in o-xylene containing 100 mg of blank ThermoCream® (matrix) were compared
with neat standard solutions containing appropriate amounts of M and MeS. 1 mL of internal standard
solution was added to each solution. The same was done with Radosalil® by comparing calibration series in
which 250 mg of blank Radosalil® was added. Every calibration point was injected twice for both calibration
series. This experiment could not be performed for the other samples as blank matrix was not available.
2.3.9. Recovery experiments
Recovery experiments for ThermoCream® were carried out by dissolving 100 mg of blank ThermoCream
® in
DMF and spiking with M and MeS. Spiked concentration levels were 80%, 100% and 120% with 100%
referring to the label content of ThermoCream®.
Recovery experiments for Radosalil® were carried out by dissolving 250 mg of blank Radosalil
® in 25 mL of
o-xylene and spiking with C, M, MeS and EtS. Spiked concentration levels were 80%, 100% and 120% with
100% referring to the label content of a Radosalil® stick.
Since no blank matrix was available for Reflexspray® and Vicks Vaporub
®, recovery experiments were
carried out by spiking the samples dissolved in DMF or o-xylene with C, M and MeS to confirm that no
headspace related matrix effects were occurring.
2.3.10. Analysis of commercial samples
Commercial samples of all four formulations were analysed using FET. Two Radosalil® samples were
analysed with FET as well as sHS, so that the results of both methods could be compared.
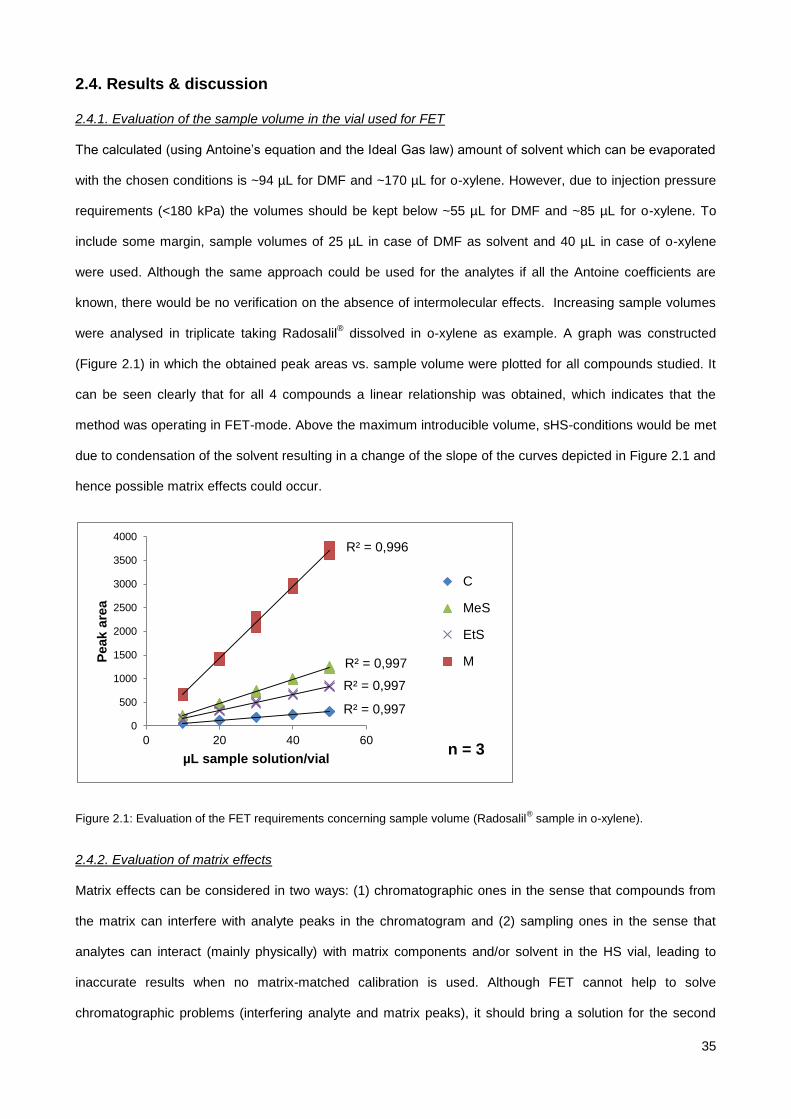
35
2.4. Results & discussion
2.4.1. Evaluation of the sample volume in the vial used for FET
The calculated (using Antoine‘s equation and the Ideal Gas law) amount of solvent which can be evaporated
with the chosen conditions is ~94 µL for DMF and ~170 µL for o-xylene. However, due to injection pressure
requirements (<180 kPa) the volumes should be kept below ~55 µL for DMF and ~85 µL for o-xylene. To
include some margin, sample volumes of 25 µL in case of DMF as solvent and 40 µL in case of o-xylene
were used. Although the same approach could be used for the analytes if all the Antoine coefficients are
known, there would be no verification on the absence of intermolecular effects. Increasing sample volumes
were analysed in triplicate taking Radosalil® dissolved in o-xylene as example. A graph was constructed
(Figure 2.1) in which the obtained peak areas vs. sample volume were plotted for all compounds studied. It
can be seen clearly that for all 4 compounds a linear relationship was obtained, which indicates that the
method was operating in FET-mode. Above the maximum introducible volume, sHS-conditions would be met
due to condensation of the solvent resulting in a change of the slope of the curves depicted in Figure 2.1 and
hence possible matrix effects could occur.
Figure 2.1: Evaluation of the FET requirements concerning sample volume (Radosalil® sample in o-xylene).
2.4.2. Evaluation of matrix effects
Matrix effects can be considered in two ways: (1) chromatographic ones in the sense that compounds from
the matrix can interfere with analyte peaks in the chromatogram and (2) sampling ones in the sense that
analytes can interact (mainly physically) with matrix components and/or solvent in the HS vial, leading to
inaccurate results when no matrix-matched calibration is used. Although FET cannot help to solve
chromatographic problems (interfering analyte and matrix peaks), it should bring a solution for the second
R² = 0,997
R² = 0,997
R² = 0,997
R² = 0,996
0
500
1000
1500
2000
2500
3000
3500
4000
0 20 40 60
Peak a
rea
µL sample solution/vial
C
MeS
EtS
M
n = 3
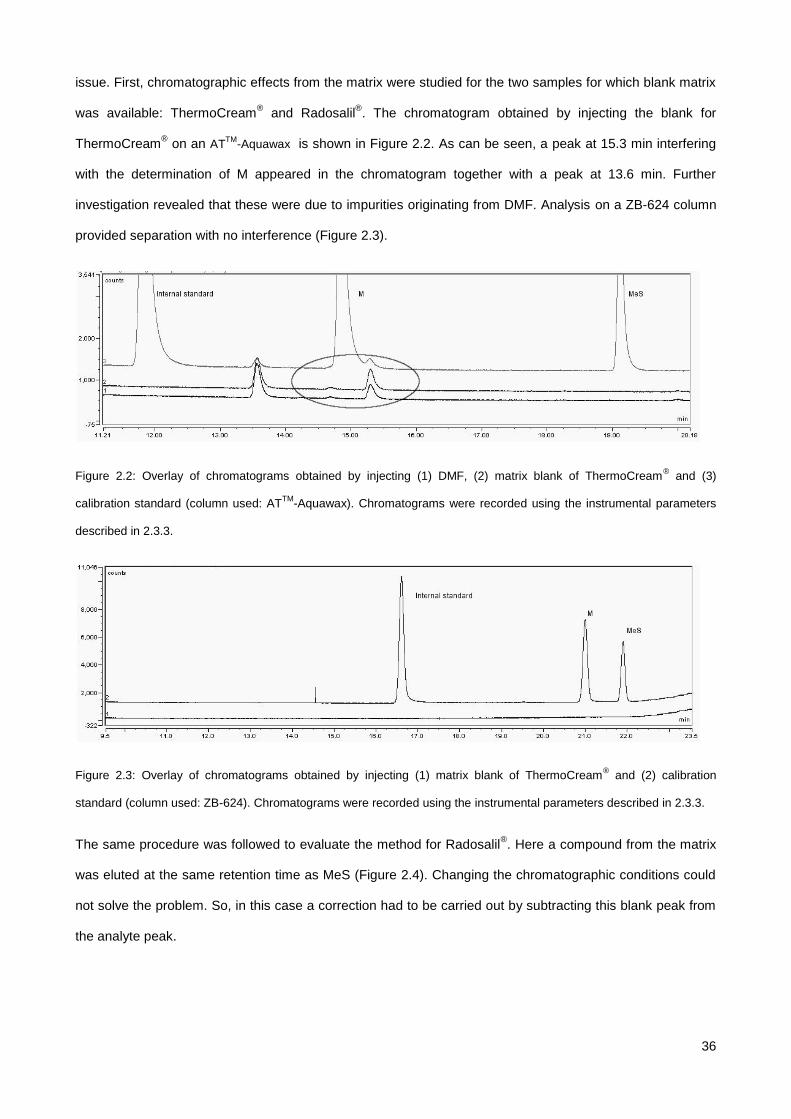
36
issue. First, chromatographic effects from the matrix were studied for the two samples for which blank matrix
was available: ThermoCream® and Radosalil
®. The chromatogram obtained by injecting the blank for
ThermoCream® on an AT
TM-Aquawax is shown in Figure 2.2. As can be seen, a peak at 15.3 min interfering
with the determination of M appeared in the chromatogram together with a peak at 13.6 min. Further
investigation revealed that these were due to impurities originating from DMF. Analysis on a ZB-624 column
provided separation with no interference (Figure 2.3).
Figure 2.2: Overlay of chromatograms obtained by injecting (1) DMF, (2) matrix blank of ThermoCream® and (3)
calibration standard (column used: ATTM
-Aquawax). Chromatograms were recorded using the instrumental parameters
described in 2.3.3.
Figure 2.3: Overlay of chromatograms obtained by injecting (1) matrix blank of ThermoCream® and (2) calibration
standard (column used: ZB-624). Chromatograms were recorded using the instrumental parameters described in 2.3.3.
The same procedure was followed to evaluate the method for Radosalil®. Here a compound from the matrix
was eluted at the same retention time as MeS (Figure 2.4). Changing the chromatographic conditions could
not solve the problem. So, in this case a correction had to be carried out by subtracting this blank peak from
the analyte peak.
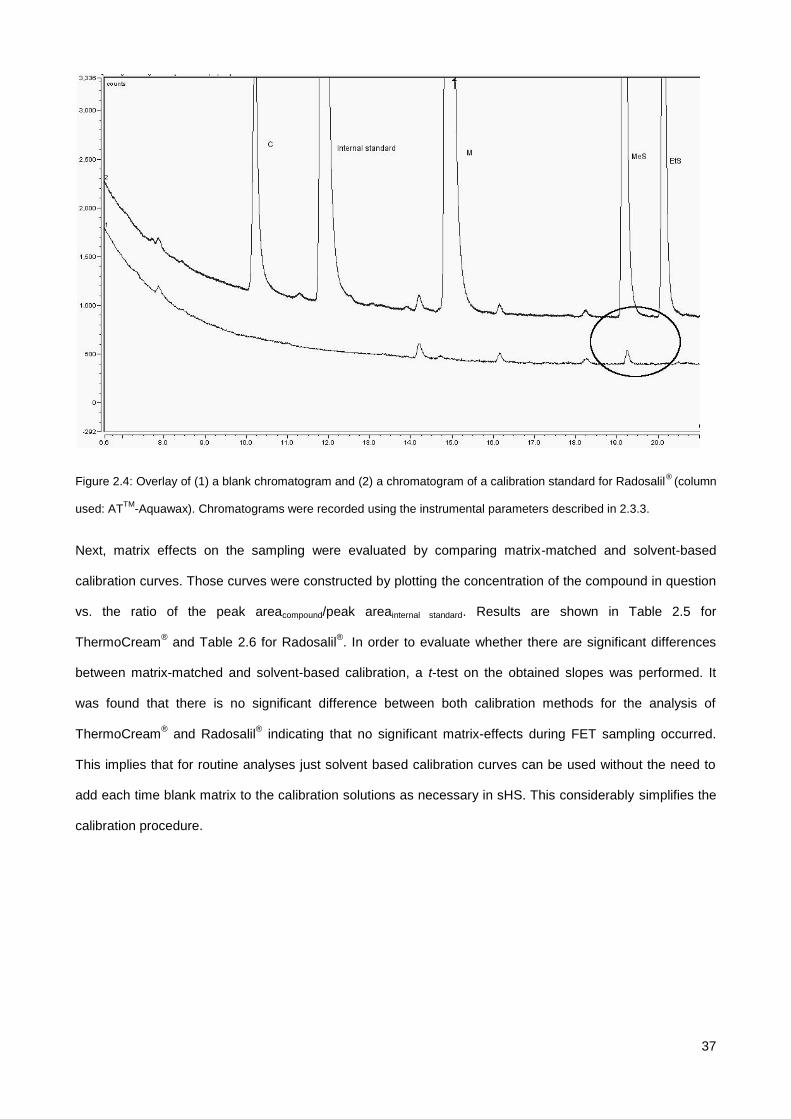
37
Figure 2.4: Overlay of (1) a blank chromatogram and (2) a chromatogram of a calibration standard for Radosalil®
(column
used: ATTM
-Aquawax). Chromatograms were recorded using the instrumental parameters described in 2.3.3.
Next, matrix effects on the sampling were evaluated by comparing matrix-matched and solvent-based
calibration curves. Those curves were constructed by plotting the concentration of the compound in question
vs. the ratio of the peak areacompound/peak areainternal standard. Results are shown in Table 2.5 for
ThermoCream® and Table 2.6 for Radosalil
®. In order to evaluate whether there are significant differences
between matrix-matched and solvent-based calibration, a t-test on the obtained slopes was performed. It
was found that there is no significant difference between both calibration methods for the analysis of
ThermoCream® and Radosalil
® indicating that no significant matrix-effects during FET sampling occurred.
This implies that for routine analyses just solvent based calibration curves can be used without the need to
add each time blank matrix to the calibration solutions as necessary in sHS. This considerably simplifies the
calibration procedure.
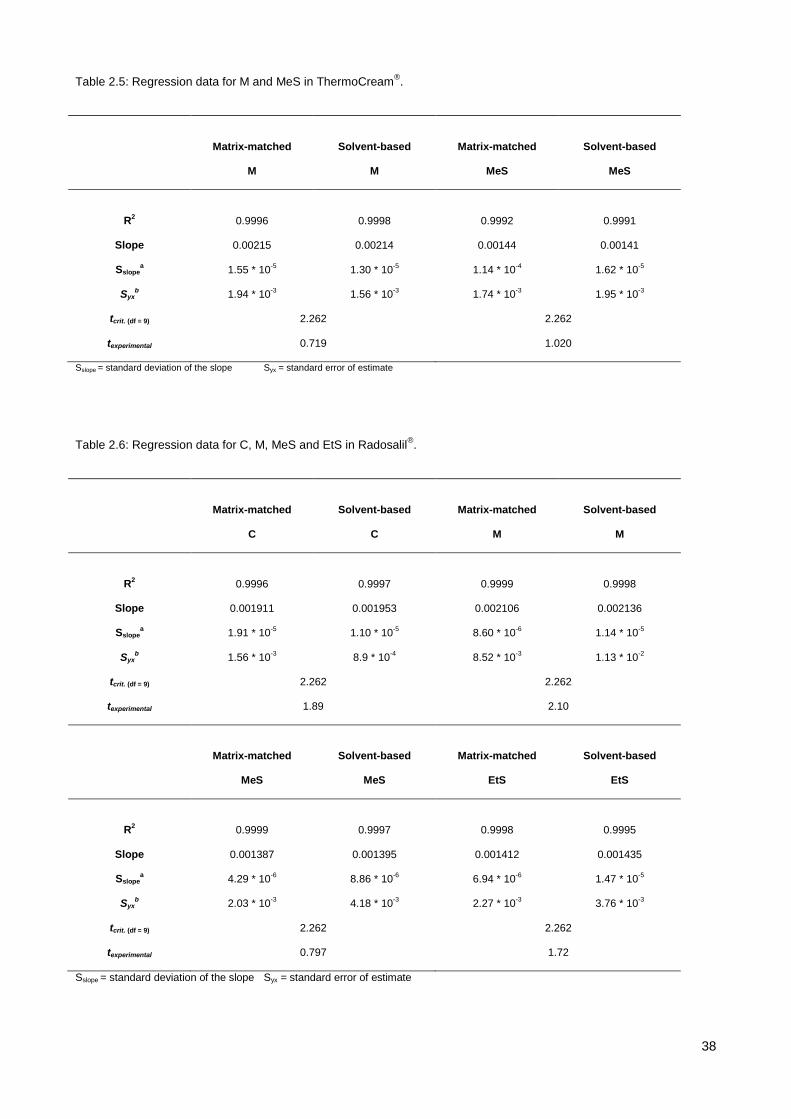
38
Table 2.5: Regression data for M and MeS in ThermoCream®.
Matrix-matched
Solvent-based
Matrix-matched
Solvent-based
M M MeS MeS
R2
0.9996
0.9998
0.9992
0.9991
Slope 0.00215 0.00214 0.00144 0.00141
Sslopea
1.55 * 10-5
1.30 * 10-5
1.14 * 10-4 1.62 * 10
-5
Syxb
1.94 * 10-3 1.56 * 10
-3 1.74 * 10
-3 1.95 * 10
-3
tcrit. (df = 9) 2.262 2.262
texperimental 0.719 1.020
Sslope = standard deviation of the slope Syx = standard error of estimate
Table 2.6: Regression data for C, M, MeS and EtS in Radosalil®.
Matrix-matched
Solvent-based
Matrix-matched
Solvent-based
C C M M
R2
0.9996
0.9997
0.9999
0.9998
Slope 0.001911 0.001953 0.002106 0.002136
Sslopea
1.91 * 10-5
1.10 * 10-5
8.60 * 10-6
1.14 * 10-5
Syxb
1.56 * 10-3 8.9 * 10
-4 8.52 * 10
-3 1.13 * 10
-2
tcrit. (df = 9) 2.262 2.262
texperimental 1.89 2.10
Matrix-matched
Solvent-based
Matrix-matched
Solvent-based
MeS MeS EtS EtS
R2
0.9999
0.9997
0.9998
0.9995
Slope 0.001387 0.001395 0.001412 0.001435
Sslopea
4.29 * 10-6
8.86 * 10-6
6.94 * 10-6
1.47 * 10-5
Syxb
2.03 * 10-3 4.18 * 10
-3 2.27 * 10
-3 3.76 * 10
-3
tcrit. (df = 9) 2.262 2.262
texperimental 0.797 1.72
Sslope = standard deviation of the slope Syx = standard error of estimate
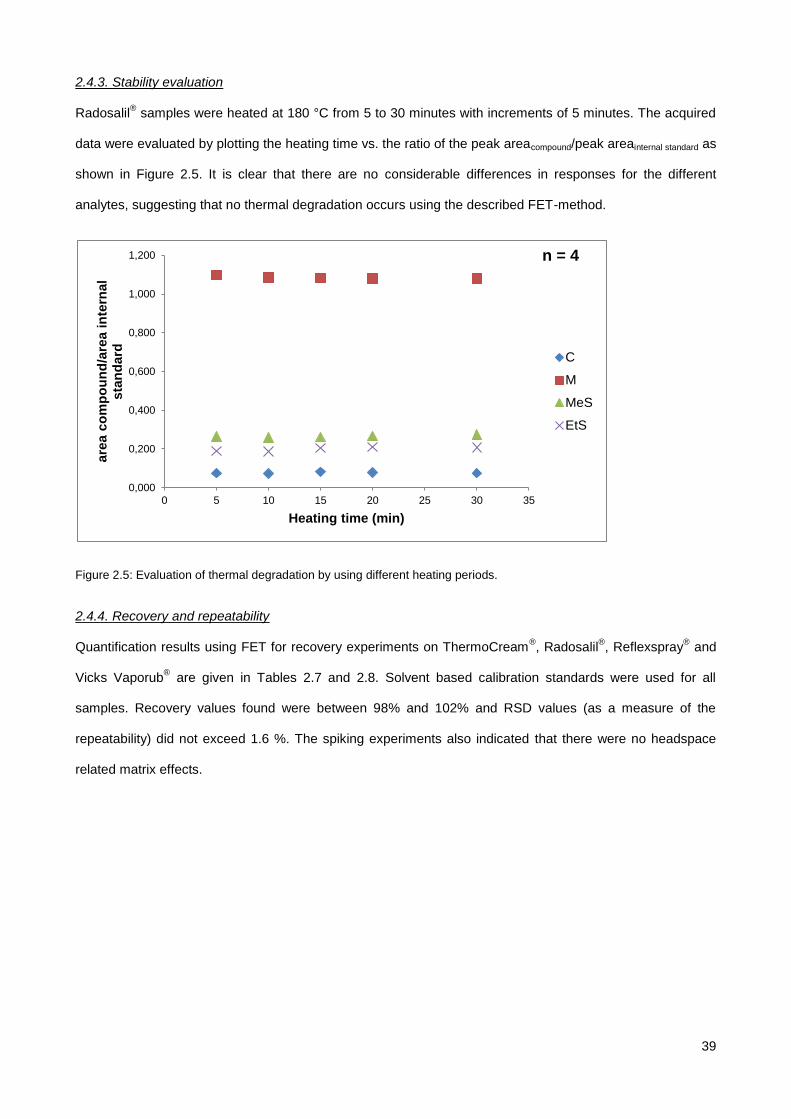
39
2.4.3. Stability evaluation
Radosalil® samples were heated at 180 °C from 5 to 30 minutes with increments of 5 minutes. The acquired
data were evaluated by plotting the heating time vs. the ratio of the peak areacompound/peak areainternal standard as
shown in Figure 2.5. It is clear that there are no considerable differences in responses for the different
analytes, suggesting that no thermal degradation occurs using the described FET-method.
Figure 2.5: Evaluation of thermal degradation by using different heating periods.
2.4.4. Recovery and repeatability
Quantification results using FET for recovery experiments on ThermoCream®, Radosalil
®, Reflexspray
® and
Vicks Vaporub® are given in Tables 2.7 and 2.8. Solvent based calibration standards were used for all
samples. Recovery values found were between 98% and 102% and RSD values (as a measure of the
repeatability) did not exceed 1.6 %. The spiking experiments also indicated that there were no headspace
related matrix effects.
0,000
0,200
0,400
0,600
0,800
1,000
1,200
0 5 10 15 20 25 30 35
are
a c
om
po
un
d/a
rea i
nte
rnal
sta
nd
ard
Heating time (min)
C
M
MeS
EtS
n = 4
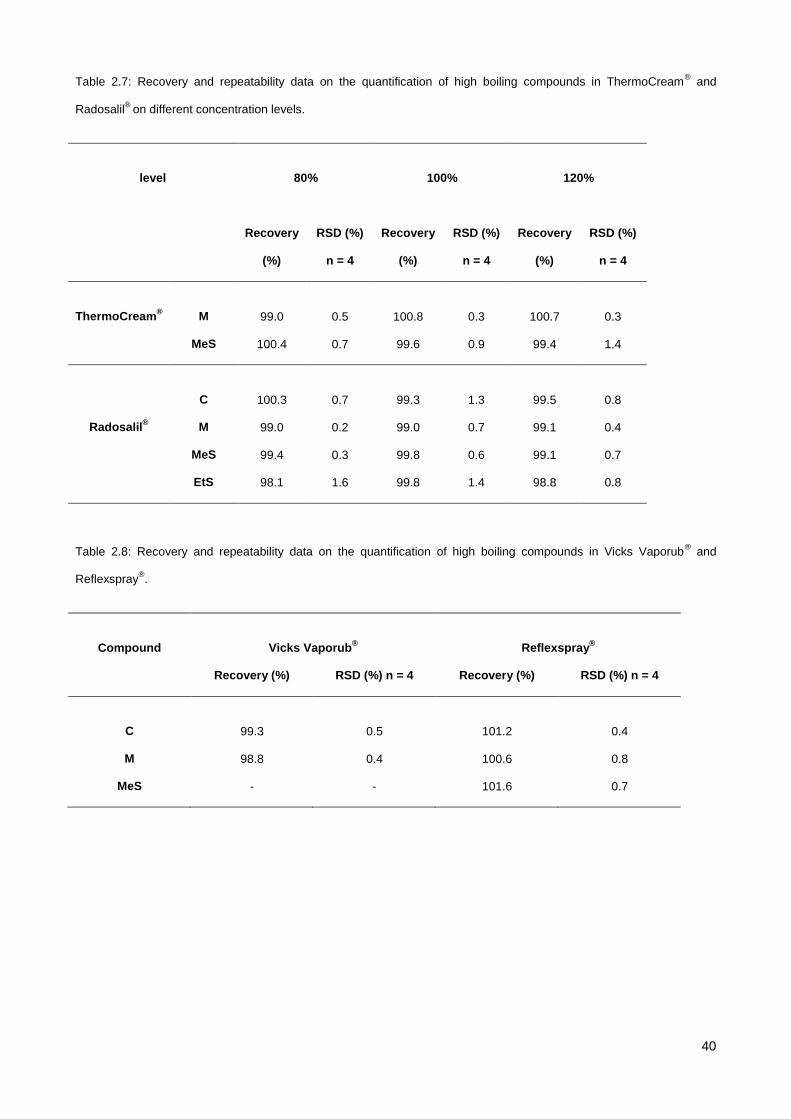
40
Table 2.7: Recovery and repeatability data on the quantification of high boiling compounds in ThermoCream® and
Radosalil®
on different concentration levels.
level
80% 100% 120%
Recovery
(%)
RSD (%)
n = 4
Recovery
(%)
RSD (%)
n = 4
Recovery
(%)
RSD (%)
n = 4
ThermoCream®
M
99.0
0.5
100.8
0.3
100.7
0.3
MeS 100.4 0.7 99.6 0.9 99.4 1.4
Radosalil®
C
100.3
0.7
99.3
1.3
99.5
0.8
M 99.0 0.2 99.0 0.7 99.1 0.4
MeS 99.4 0.3 99.8 0.6 99.1 0.7
EtS 98.1 1.6 99.8 1.4 98.8 0.8
Table 2.8: Recovery and repeatability data on the quantification of high boiling compounds in Vicks Vaporub® and
Reflexspray®.
Compound
Vicks Vaporub®
Reflexspray®
Recovery (%) RSD (%) n = 4
Recovery (%) RSD (%) n = 4
C
99.3
0.5
101.2
0.4
M 98.8 0.4 100.6 0.8
MeS - - 101.6 0.7
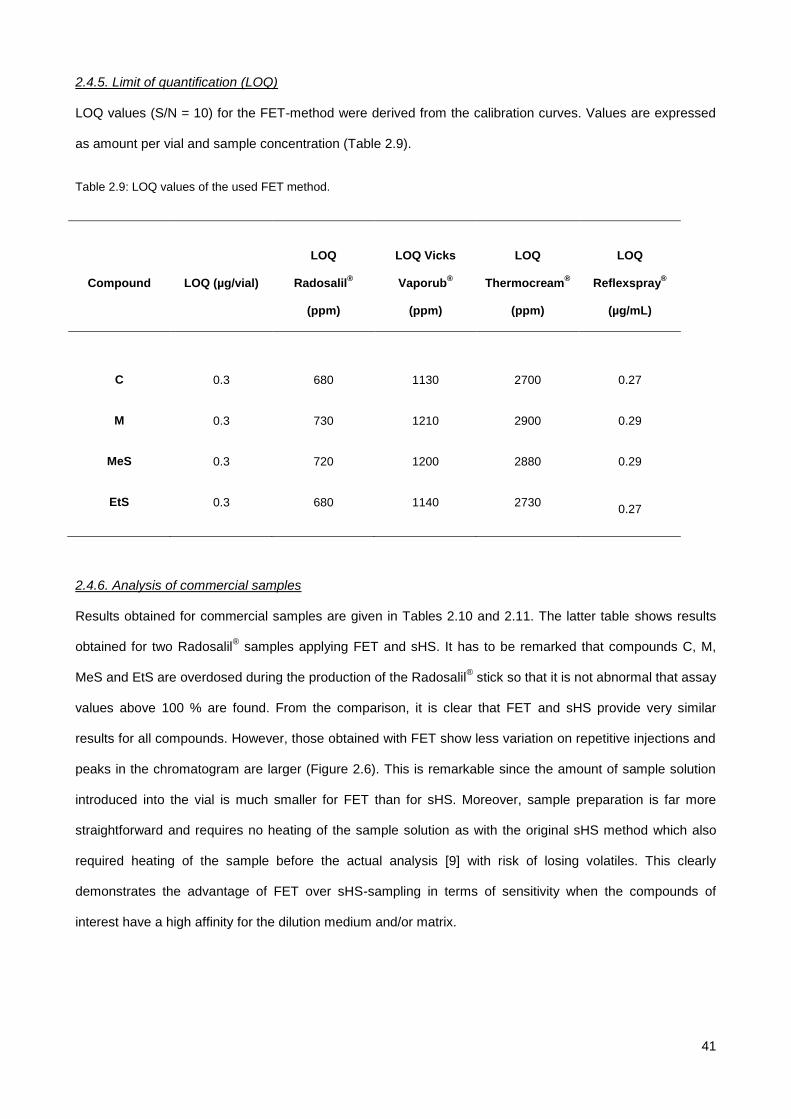
41
2.4.5. Limit of quantification (LOQ)
LOQ values (S/N = 10) for the FET-method were derived from the calibration curves. Values are expressed
as amount per vial and sample concentration (Table 2.9).
Table 2.9: LOQ values of the used FET method.
Compound
LOQ (µg/vial)
LOQ
Radosalil®
(ppm)
LOQ Vicks
Vaporub®
(ppm)
LOQ
Thermocream®
(ppm)
LOQ
Reflexspray®
(µg/mL)
C
0.3
680
1130
2700
0.27
M 0.3 730 1210 2900 0.29
MeS 0.3 720 1200 2880 0.29
EtS 0.3 680 1140 2730 0.27
2.4.6. Analysis of commercial samples
Results obtained for commercial samples are given in Tables 2.10 and 2.11. The latter table shows results
obtained for two Radosalil® samples applying FET and sHS. It has to be remarked that compounds C, M,
MeS and EtS are overdosed during the production of the Radosalil® stick so that it is not abnormal that assay
values above 100 % are found. From the comparison, it is clear that FET and sHS provide very similar
results for all compounds. However, those obtained with FET show less variation on repetitive injections and
peaks in the chromatogram are larger (Figure 2.6). This is remarkable since the amount of sample solution
introduced into the vial is much smaller for FET than for sHS. Moreover, sample preparation is far more
straightforward and requires no heating of the sample solution as with the original sHS method which also
required heating of the sample before the actual analysis [9] with risk of losing volatiles. This clearly
demonstrates the advantage of FET over sHS-sampling in terms of sensitivity when the compounds of
interest have a high affinity for the dilution medium and/or matrix.
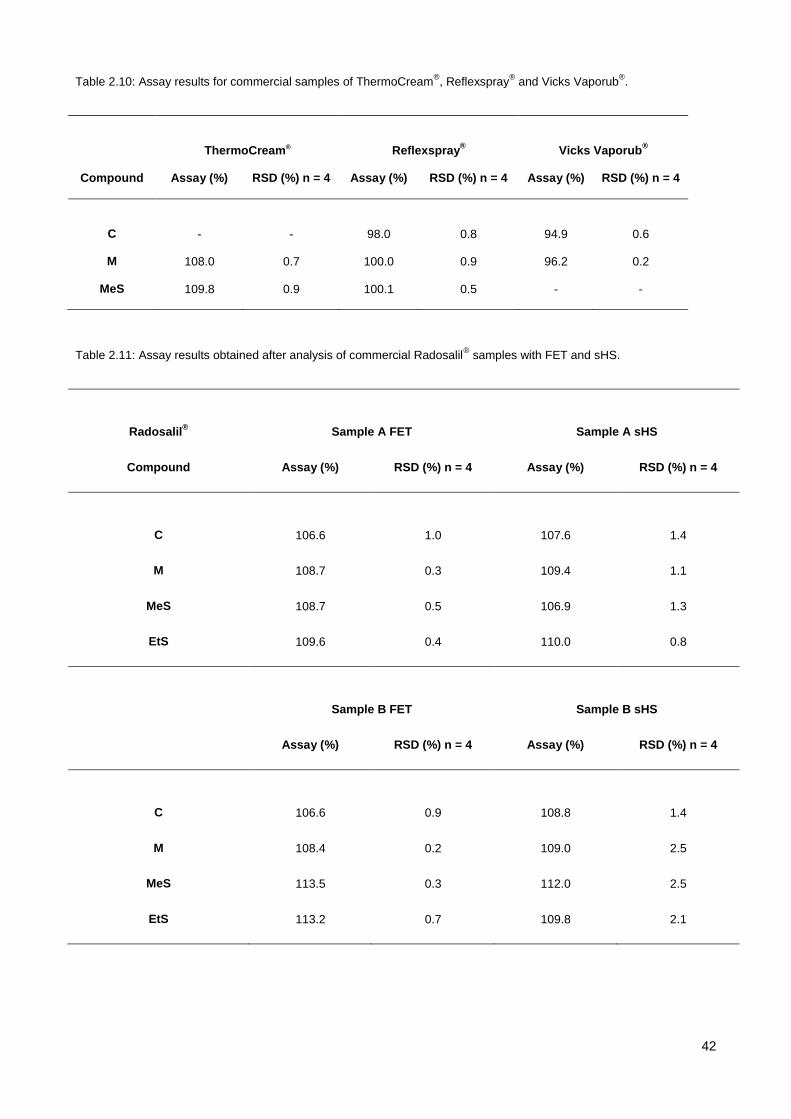
42
Table 2.10: Assay results for commercial samples of ThermoCream®, Reflexspray
® and Vicks Vaporub
®.
ThermoCream®
Reflexspray®
Vicks Vaporub®
Compound Assay (%) RSD (%) n = 4
Assay (%) RSD (%) n = 4
Assay (%) RSD (%) n = 4
C
-
-
98.0
0.8
94.9
0.6
M 108.0 0.7 100.0 0.9 96.2 0.2
MeS 109.8 0.9 100.1 0.5 - -
Table 2.11: Assay results obtained after analysis of commercial Radosalil® samples with FET and sHS.
Radosalil®
Sample A FET
Sample A sHS
Compound Assay (%) RSD (%) n = 4
Assay (%) RSD (%) n = 4
C
106.6
1.0
107.6
1.4
M 108.7 0.3 109.4 1.1
MeS 108.7 0.5 106.9 1.3
EtS 109.6 0.4 110.0 0.8
Sample B FET
Sample B sHS
Assay (%) RSD (%) n = 4
Assay (%) RSD (%) n = 4
C
106.6
0.9
108.8
1.4
M 108.4 0.2 109.0 2.5
MeS 113.5 0.3 112.0 2.5
EtS 113.2 0.7 109.8 2.1
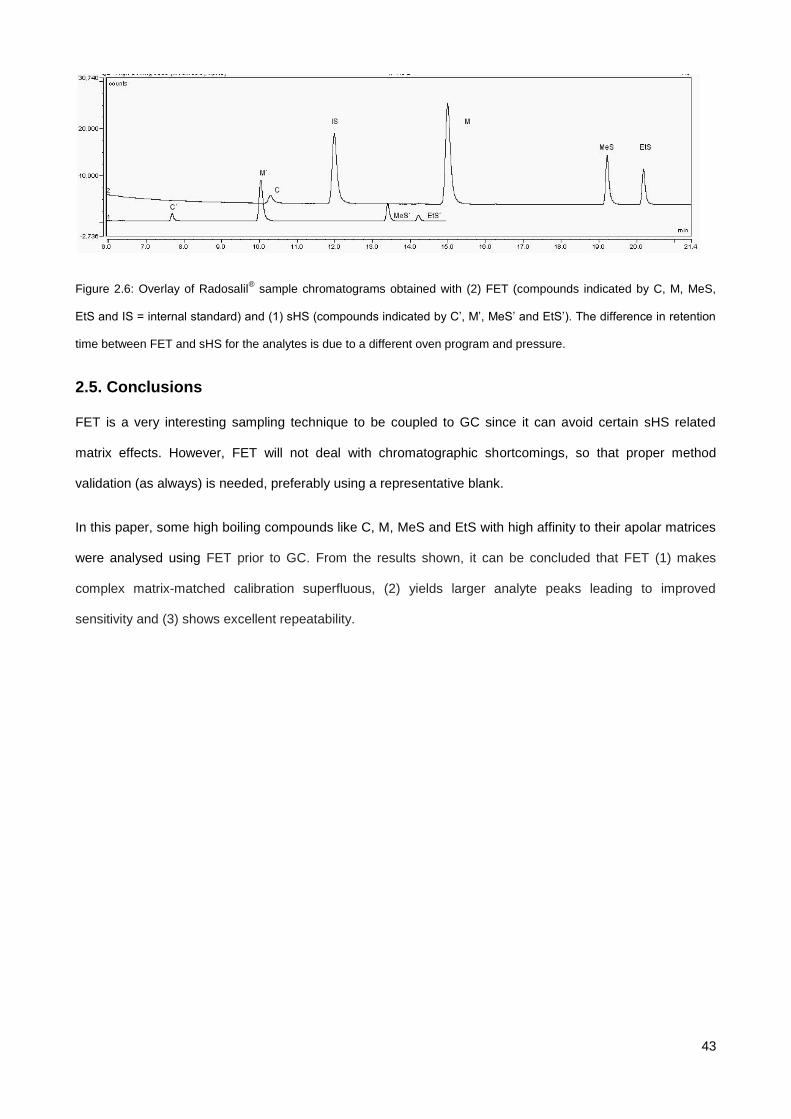
43
Figure 2.6: Overlay of Radosalil® sample chromatograms obtained with (2) FET (compounds indicated by C, M, MeS,
EtS and IS = internal standard) and (1) sHS (compounds indicated by C‘, M‘, MeS‘ and EtS‘). The difference in retention
time between FET and sHS for the analytes is due to a different oven program and pressure.
2.5. Conclusions
FET is a very interesting sampling technique to be coupled to GC since it can avoid certain sHS related
matrix effects. However, FET will not deal with chromatographic shortcomings, so that proper method
validation (as always) is needed, preferably using a representative blank.
In this paper, some high boiling compounds like C, M, MeS and EtS with high affinity to their apolar matrices
were analysed using FET prior to GC. From the results shown, it can be concluded that FET (1) makes
complex matrix-matched calibration superfluous, (2) yields larger analyte peaks leading to improved
sensitivity and (3) shows excellent repeatability.
44
2.6. References
[1] S. Yarramraju, V. Akurathi, K. Wolfs, A. Van Schepdael, J.Hoogmartens, E. Adams, Investigation of
sorbic acid volatile degradation products in pharmaceutical formulations using static headspace gas
chromatography, J. Pharm. Biomed. Anal., 44 (2007) 456-463
[2] A. Brault, V. Agasse, P. Cardinael, J. C. Combret, The full Evaporation technique: A promising alternative
for residual solvent analysis in solid samples, J. Sep. Science, 28 (2005) 380-386
[3] X.S. Chai, Q.X. Hou, F.J. Schork, Determination of residual monomer in polymer latex by full evaporation
headspace gas chromatography, J. Chromatogr. A, 1040 (2004) 163-167
[4] H. Li, H. Zhan, S. Fu, M. Lui, X.S. Chai, Rapid determination of methanol in black liquors by full
evaporation headspace gas chromatography, J. Chromatogr. A, 1175 (2007) 133-136
[5] M. Markelov, J.P. Guzowski Jr, Matrix independent headspace gas chromatographic analysis. The full
evaporation technique, Analytica Chimica Acta, 276 (1993) 235-245
[6] J. Schuberth, Volatile organic compounds determined in pharmaceutical products by full evaporation
technique and capillary gas chromatography/ion-trap detection, Anal. Chem., 68, (1996) 1317-1320
[7] J. Schuberth, A full evaporation headspace technique with capillary GC and ITD: A means for quantitating
volatile organic compounds in biological samples, J. Sep. Science, 34, (1996) 314-319
[8] D.M. Kialengila, K. Wolfs, J. Bugulama, A. Van Schepdael, E. Adams, Full evaporation headspace gas
chromatography for sensitive determination of high boiling point volatile organic compounds in low boiling
matrices, J. Chromatogr. A, 1315 (2013) 167-175
[9] J. Pauwels, W. D‘Autry, L. Van den Bosche, C. Dewever, M. Forier, S. Vandenwaeyenberg, K. Wolfs, J.
Hoogmartens, A. Van Schepdael, E. Adams, Optimization and validation of liquid chromatography and
headspace-gas chromatography based methods for the quantitative determination of capsaicinoids, salicylic
acid, glycol monosalicylate, methyl salicylate, ethyl salicylate, camphor and l-menthol in a topical formulation,
J. Pharm. Biomed. Anal., 60 (2012) 51-58
[10] E. Gonzalez-Penas, M. Lopez-Alvarez, F. Martinez de Narvajas, A Ursua, Simultaneous GC
determination of turpentine, camphor, menthol and methyl salicylate in a topical analgesic formulation
(Dologex®), Chromatographia, 52 (2000) 245-248

45
[11] J.S. Valdez, D.K. Martin, M. Maversohn, Sensitive and selective gas chromatographic methods for the
quantitation of camphor, menthol and methyl salicylate from human plasma, J. Chromatogr. B Biomed. Sci.
Appl., 729 (1999) 163-171

46
47
Chapter 3 - Application of acetone acetals as water scavengers and derivatization
agents prior to the gas chromatographic analysis of polar residual solvents in
aqueous samples
Niels van Boxtel, Kris Wolfs, Ann Van Schepdael, Erwin Adams
Pharmaceutical Analysis, Department of Pharmaceutical and Pharmacological Sciences
KU Leuven, Leuven, Belgium
J. Chromatogr. A 2015, 1425, 62–72

48
49
Abstract
The sensitivity of gas chromatography (GC) combined with the full evaporation technique (FET) for the
analysis of aqueous samples is limited due to the maximum tolerable sample volume in a headspace vial.
Using an acetone acetal as water scavenger prior to FET-GC analysis proved to be a useful and versatile
tool for the analysis of high boiling analytes in aqueous samples. 2,2-Dimethoxypropane (DMP) was used in
this case resulting in methanol and acetone as reaction products with water. These solvents are relatively
volatile and were easily removed by evaporation enabling sample enrichment leading to 10-fold improvement
in sensitivity compared to the standard 10 µL FET sample volumes for a selection of typical high boiling polar
residual solvents in water. This could be improved even further if more sample is used. The method was
applied for the determination of residual NMP in an aqueous solution of a cefotaxime analogue and proved
to be considerably better than conventional static headspace (sHS) and the standard FET approach, which
do not allow proper analysis in this case. The methodology was also applied to determine trace amounts of
ethylene glycol (EG) in aqueous samples like contact lens fluids, where scavenging of the water would avoid
laborious extraction prior to derivatization. During this experiment it was revealed that DMP reacts
quantitatively with EG to form 2,2-dimethyl-1,3-dioxolane (2,2-DD) under the proposed reaction conditions.
The relatively high volatility (bp 93 °C) of 2,2-DD makes it possible to perform analysis of EG using the static
headspace (sHS) methodology making additional derivatization reactions superfluous.
Keywords
Full Evaporation Technique, Static Headspace, Dehydration, 2,2-Dimethoxypropane.
50
3.1. Introduction
Analysis of aqueous samples with gas chromatography (GC) has always been a challenge mainly due to
water intolerance of most stationary phases towards repetitive injections of high amounts of water and
injection liners that are incompatible towards the introduction of large amounts of water. Standard GC-
columns often degrade and injection liners are not able to deal with the gas expansion of water because of
the heated injection port. Developed methods for the analysis of aqueous samples are either based on the
isolation and enrichment of analytes prior to GC separation or on direct aqueous injections using special
retention gaps and/or columns. Isolation of analytes can be done by using techniques such as supercritical
fluid extraction (SFE), subcritical water extraction (SWE), cloud point extraction (CPE), solid phase extraction
(SPE), solid phase microextraction (SPME), stir-bar sorptive extraction (SBSE) and single drop
microextraction (SDME). However, all these techniques are biased towards more volatile compounds or
apolar compounds that have a rather low affinity for water. Recently, a method was developed that uses a
split injector packed with an adsorbent containing LiCl to enable injections up to 100 µL for the analysis of
several high boiling analytes in water [1]. For the analysis of residual solvents in aqueous or water soluble
pharmaceutical products, static headspace (sHS) GC and dynamic headspace (dHS) GC are traditionally
used [2]. HS analysis is, in contrast to direct injection, a very clean method of introducing analytes on a GC
column. When performing HS techniques with aqueous samples, incubation temperatures should be kept
relatively low to ensure that the HS pressure does not exceed the limitations of the instrument. This limitation
restricts the sensitivity for analytes with a high affinity for water and high boiling points such as N,N-
dimethylformamide (DMF), N,N-dimethylacetamide (DMA), dimethylsulfoxide (DMSO), N-methyl-2-
pyrrolidone (NMP) and 1,3-dimethyl-2-imidazole (DMI) when sHS is used. Their determination as residual
solvents in aqueous samples is really problematic. A work around for DMSO is its reduction to the more
volatile dimethylsulfide (DMS) enabling the indirect quantitative analysis of this high boiling polar solvent [3].
An additional possible disadvantage is that HS sampling is known to suffer from matrix effects. The so-called
Full Evaporation Technique (FET) in combination with a more water resistant column has proven to be useful
to improve the sensitivity for these typical polar residual solvents in aqueous samples [4] and provides
elimination of matrix effects [5]. However, as with sHS sampling, pressure limits have to be respected as
well, meaning that the introduced sample volume and therefore the sensitivity is still limited for aqueous
samples. An approach to avoid this problem is to use desiccants such as CaCl2 or K2CO3 to trap water inside
a HS vial forming hydrates. A method described in literature uses 6.0 g of CaCl2 to remove water for the
analysis of phenol [6]. However, CaCl2 is known to adsorb phenol [7] and might introduce unwanted matrix
51
effects for other analytes too. Furthermore, introducing 6.0 g of a desiccant in a vial has serious
consequences for the partial pressures of the analytes present in the vial. Moreover, water can be released
when higher HS temperatures are used for the evaporation of higher boiling analytes. When performing this
described method in our lab, most sample vials (~75%) actually ruptured for unclear reasons. Rupturing of
the sample vials occurred in the incubation oven of the HS sampler, but when the heating process was
repeated in an ordinary oven, vials stayed intact. Recently, FET has been combined with dHS to increase the
tolerable sample volume by transferring the whole sample over a Tenax® filled trap thereby eliminating the
water [8-10]. Transferring occurs by purging the sample vial until analytes are (nearly) completely transferred
to the trap. However, problems could still exist with analytes such as ethylene glycol (EG) which is prone to
interact with many parts of the instrument (injector, column, etc.) resulting in erroneous results. Often, EG or
other diols are analysed as phenyl boronate (PBA) [11] or trimethylsilyl (TMS) derivatives [12-14].
Unfortunately, most GC derivatization reagents tend to react with water as well and are therefore not easily
applicable to aqueous samples. Furthermore, the derivatization of EG with PBA leads to a product with an
even higher boiling point than EG itself (2-phenyl-1,3,2-dioxaborolane, 218 – 220 °C) and is susceptible to
hydrolysis in an aqueous environment [15].
An approach to circumvent the abovementioned problems could be a selective chemical reaction to remove
enough or all water in order to be able to introduce a larger sample volume in a HS vial and enable
derivatization and analysis of compounds such as EG; thereby increasing the sensitivity significantly when
FET is applied. In fact, such chemical reactions are known including drying reactions with several agents or
certain hydrolysis reactions such as the reaction of water with acetone acetals to give acetone and an
alcohol as final products. This reaction has proven to be useful in the past for the analysis of DMSO in urine
samples using direct injection in which 2,2-dimethoxypropane (DMP) was used as water scavenger [16].
DMP is also known as acetone dimethyl acetal and reacts endothermically with equimolar amounts of water
producing methanol and acetone in a molar ratio of 2:1 with the help of an acid as catalyst (Figure 3.1).
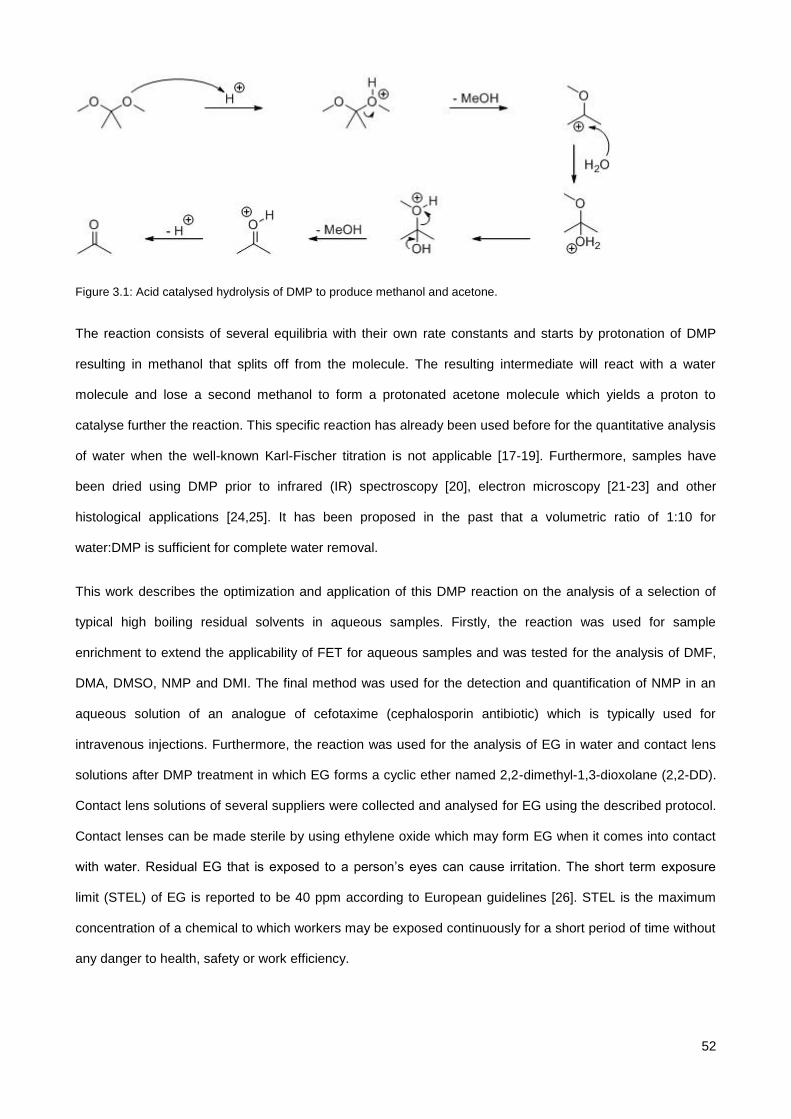
52
Figure 3.1: Acid catalysed hydrolysis of DMP to produce methanol and acetone.
The reaction consists of several equilibria with their own rate constants and starts by protonation of DMP
resulting in methanol that splits off from the molecule. The resulting intermediate will react with a water
molecule and lose a second methanol to form a protonated acetone molecule which yields a proton to
catalyse further the reaction. This specific reaction has already been used before for the quantitative analysis
of water when the well-known Karl-Fischer titration is not applicable [17-19]. Furthermore, samples have
been dried using DMP prior to infrared (IR) spectroscopy [20], electron microscopy [21-23] and other
histological applications [24,25]. It has been proposed in the past that a volumetric ratio of 1:10 for
water:DMP is sufficient for complete water removal.
This work describes the optimization and application of this DMP reaction on the analysis of a selection of
typical high boiling residual solvents in aqueous samples. Firstly, the reaction was used for sample
enrichment to extend the applicability of FET for aqueous samples and was tested for the analysis of DMF,
DMA, DMSO, NMP and DMI. The final method was used for the detection and quantification of NMP in an
aqueous solution of an analogue of cefotaxime (cephalosporin antibiotic) which is typically used for
intravenous injections. Furthermore, the reaction was used for the analysis of EG in water and contact lens
solutions after DMP treatment in which EG forms a cyclic ether named 2,2-dimethyl-1,3-dioxolane (2,2-DD).
Contact lens solutions of several suppliers were collected and analysed for EG using the described protocol.
Contact lenses can be made sterile by using ethylene oxide which may form EG when it comes into contact
with water. Residual EG that is exposed to a person‘s eyes can cause irritation. The short term exposure
limit (STEL) of EG is reported to be 40 ppm according to European guidelines [26]. STEL is the maximum
concentration of a chemical to which workers may be exposed continuously for a short period of time without
any danger to health, safety or work efficiency.
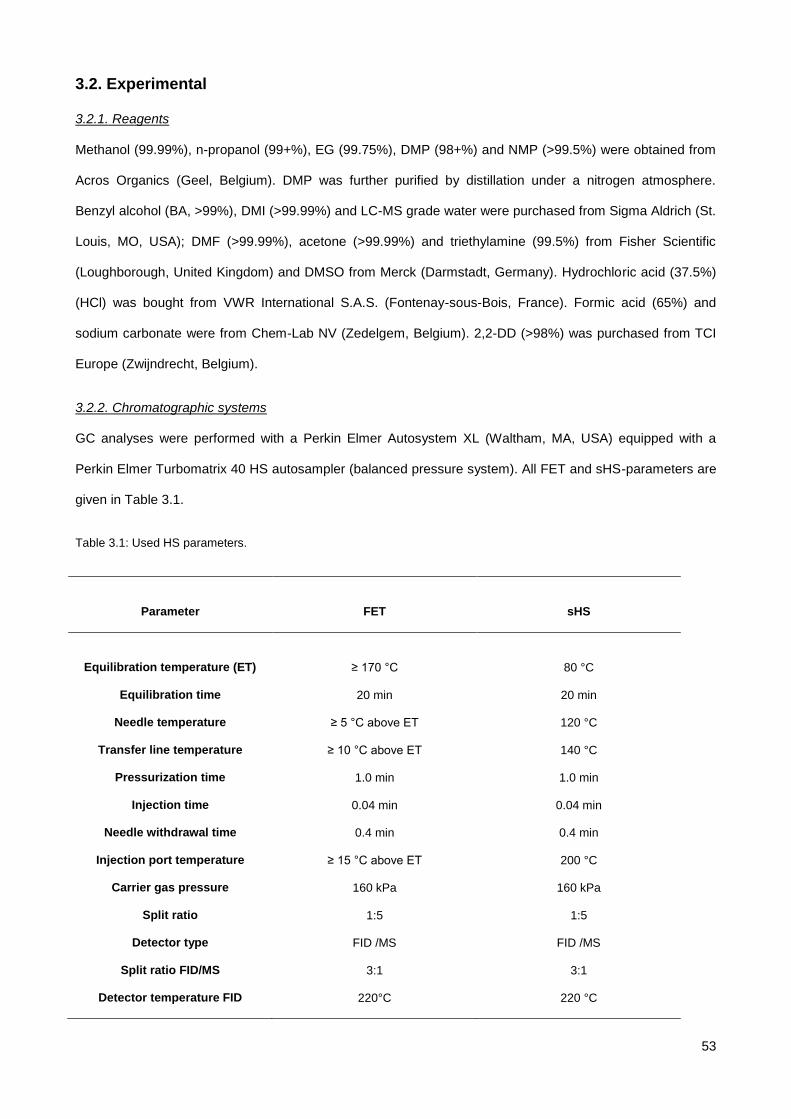
53
3.2. Experimental
3.2.1. Reagents
Methanol (99.99%), n-propanol (99+%), EG (99.75%), DMP (98+%) and NMP (>99.5%) were obtained from
Acros Organics (Geel, Belgium). DMP was further purified by distillation under a nitrogen atmosphere.
Benzyl alcohol (BA, >99%), DMI (>99.99%) and LC-MS grade water were purchased from Sigma Aldrich (St.
Louis, MO, USA); DMF (>99.99%), acetone (>99.99%) and triethylamine (99.5%) from Fisher Scientific
(Loughborough, United Kingdom) and DMSO from Merck (Darmstadt, Germany). Hydrochloric acid (37.5%)
(HCl) was bought from VWR International S.A.S. (Fontenay-sous-Bois, France). Formic acid (65%) and
sodium carbonate were from Chem-Lab NV (Zedelgem, Belgium). 2,2-DD (>98%) was purchased from TCI
Europe (Zwijndrecht, Belgium).
3.2.2. Chromatographic systems
GC analyses were performed with a Perkin Elmer Autosystem XL (Waltham, MA, USA) equipped with a
Perkin Elmer Turbomatrix 40 HS autosampler (balanced pressure system). All FET and sHS-parameters are
given in Table 3.1.
Table 3.1: Used HS parameters.
Parameter
FET
sHS
Equilibration temperature (ET)
≥ 170 °C
80 °C
Equilibration time 20 min 20 min
Needle temperature ≥ 5 °C above ET 120 °C
Transfer line temperature ≥ 10 °C above ET 140 °C
Pressurization time 1.0 min 1.0 min
Injection time 0.04 min 0.04 min
Needle withdrawal time 0.4 min 0.4 min
Injection port temperature ≥ 15 °C above ET 200 °C
Carrier gas pressure 160 kPa 160 kPa
Split ratio 1:5 1:5
Detector type FID /MS FID /MS
Split ratio FID/MS 3:1 3:1
Detector temperature FID 220°C 220 °C
54
A minimum FET temperature of 170 °C was selected to ensure the complete evaporation of all analytes. HS-
vials and PTFE/Sil-caps were purchased from Perkin Elmer as well. Separations regarding FET-GC of polar
residual solvents were carried out on an ATTM
-Aquawax column (30 m x 0.53 mm, df = 0.50 µm) from Grace
(Columbia, MD, USA). Separations for EG analysis and the evaluation of reaction parameters were carried
out on a ZB-624 column (30 m x 0.53 mm, df = 3.00 µm). The oven program given in Table 3.2 was used for
all experiments. The effluent from the column was splitted towards the FID and a Perkin Elmer Turbomass
mass spectrometer (MS) operated in full scan mode.
Table 3.2: GC oven program.
t (min)
T (°C)
0
40
10 40
15 (40 °C/min) 240
25 240
40 40
3.2.3. Preparation of solutions
3.2.3.1. Checking of DMP-water reaction parameters
Water scavenging reactions were performed with different volume ratios of water/DMP (1:2.5 to 1:27.5)
catalysed by varying volumes of HCl (1 to 10 µL) to determine the optimum reaction conditions. The use of
formic acid as a catalyst and the influence of the reaction time were tested as well. Reactions were
performed in open HS vials (not capped). After the reaction, 10 mL of DMF was added to create a suitable
matrix for the sHS determination of acetone.
3.2.3.2. DMP-water reaction procedure
Reactions with aqueous samples were performed by transferring 4 mL of sample in a volumetric flask of 50
mL and adding 40 mL of DMP to react with water. Reactions were catalysed by adding 10 µL of hydrochloric
acid (37.5 w/w %) to the solution. The solution cools down significantly during the hydrolysis reaction which
was considered to be completed when the flask was again at room temperature. 1 mL of the appropriate
internal standard solution (see 3.2.3.3.) was added before completing to volume with methanol. Samples
55
were neutralised afterwards by addition of a spoonful (~ 5 g) of sodium carbonate to obtain a saturated
solution. Since sodium carbonate does nearly not dissolve in the mixture, solutions were stirred for 10
minutes with a magnetic stir bar to improve contact. Supernatant was decanted in a centrifuge tube and
centrifuged at 4500 g for 10 minutes. The same procedure was used to prepare blank solution. As an
alternative to sodium carbonate, neutralisation was also performed with 20 µL of triethylamine before adding
up to volume. Since triethylamine mixes well with the reaction mixture, neutralisation occurs instantaneously
and centrifugation is not necessary anymore.
3.2.3.3. Solutions for FET analysis of polar residual solvents
A stock solution was prepared by dissolving the following high boiling polar residual solvents in methanol:
DMF, DMA, DMSO, NMP and DMI (14 mg/mL). For the internal standard solution used for calibration, BA
was dissolved in methanol to obtain concentrations of 14 mg/mL. Calibration solutions were prepared by
diluting appropriate volumes of the stock solution in methanol. Each time 3 mL of internal standard solution
was added before adding up to the volume of 25 mL. 10 µL of calibration solution was transferred to a HS
vial and sealed with a PTFE/Sil-cap for FET-GC analysis.
A sample stock solution of the same high boiling polar solvents (1.4 mg/mL each) was also prepared in LC-
MS-grade water. Due to the dilution factor of 50 for the internal standard (cfr. 1 mL to 50 mL, section 3.2.3.2.)
another internal standard solution was prepared by dissolving BA in methanol to obtain a concentration of
0.84 mg/mL. One mL of neutralised solution obtained by treating a sample with the procedure described in
3.2.3.2. was transferred to a HS vial which was not closed. The vials were placed in a vacuum oven at room
temperature set at ≤0.1 kPa for 5.5 min to remove the excess of methanol, acetone and DMP. After
evaporation, the vials were capped with a PTFE/Sil-cap to be analysed with FET-GC.
3.2.3.4. Residual NMP determination in cefotaxime analogue solution
The 0.4 % solution of the cefotaxime analogue in water for injection was analysed as such by sHS-GC at 80
°C and standard FET-GC (sample volume of 10 µL) as well as by FET-GC after treatment using the
procedure described in 3.2.3.2.
3.2.3.5. Solutions for sHS analysis of EG
56
A stock solution of EG (2 mg/mL) was prepared in LC-MS grade water. DMSO was used as solvent to
prepare a 0.2 mg/mL stock solution of 2,2-DD. Calibration solutions were prepared by diluting appropriate
volumes of this 2,2-DD stock solution in DMSO.
Next, 1.0 mL of calibration solution was mixed with 1.0 mL of blank prepared by the procedure described in
3.2.3.2. Samples were treated according to 3.2.3.2 and 1.0 mL of the resulting solution was transferred to a
headspace vial followed by addition of 1.0 mL of DMSO. Finally, the vial was closed with a PTFE/Sil-cap to
be analysed with sHS-GC.
3.2.4. Method validation
The linearity of the calibration curve was determined by analysing calibration solutions with the described HS
methods. In case of FET-GC analysis, peak areas were corrected by normalisation towards the internal
standard and plotted vs. the analyte concentrations. The recovery of the polar residual solvents method was
determined by preparing aqueous sample dilutions with known concentrations of analytes. Resulting
concentrations were in the range of 50-250 ppm. Consequently, an aliquot was treated according to the
aforementioned protocol and analysed with the appropriate FET-GC method.
The recovery of the EG method was determined by preparing aqueous samples with known concentrations
of EG. Resulting concentrations were in the range of 175-350 ppm and samples were treated according to
the aforementioned protocol and analysed with the appropriate sHS-GC method.
3.3. Results & Discussion
3.3.1. Investigation of DMP treatment parameters
3.3.1.1. Amount of acid and reaction time
Important parameters were the amount of acid necessary to catalyse the reaction to completion and the time
needed. In order to test the influence of different amounts of HCl and reaction times, reactions were
performed with 100 µL of water and 2.5 mL of DMP to which 1, 5, 10 or 20 µL of HCl was added. Adding 2.5
mL of DMP meant that a larger ratio than 1:10 was used. This was done to have an excess of DMP. To
evaluate the influence of both parameters the obtained peak area of acetone was plotted against the
reaction time. As can be seen from Figure 3.2, the acetone yield stays rather constant for all tested amounts
of added HCl. The tendency of the acetone yield curve to decrease over time might be due to the fact that
acetone is rather volatile and that therefore acetone might evaporate partially over time. Since a volume of
10 µL was also used for FET analysis, for practical reasons addition of 10 µL of acid was selected.
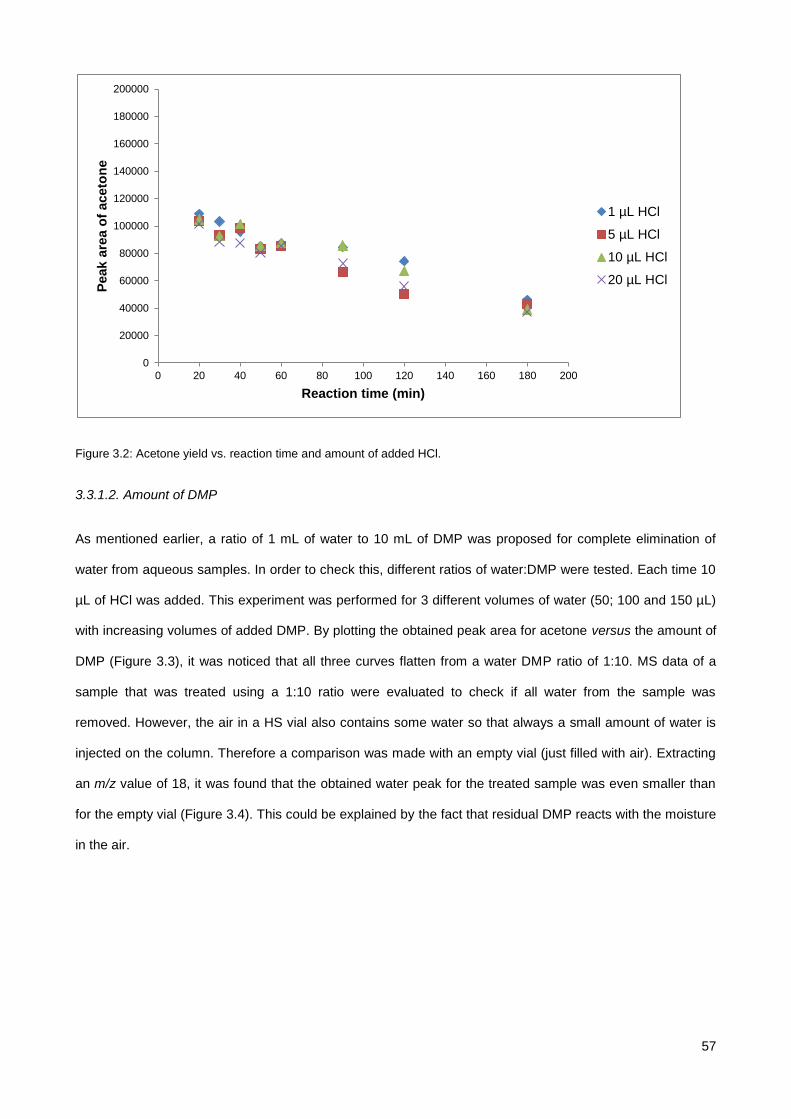
57
Figure 3.2: Acetone yield vs. reaction time and amount of added HCl.
3.3.1.2. Amount of DMP
As mentioned earlier, a ratio of 1 mL of water to 10 mL of DMP was proposed for complete elimination of
water from aqueous samples. In order to check this, different ratios of water:DMP were tested. Each time 10
µL of HCl was added. This experiment was performed for 3 different volumes of water (50; 100 and 150 µL)
with increasing volumes of added DMP. By plotting the obtained peak area for acetone versus the amount of
DMP (Figure 3.3), it was noticed that all three curves flatten from a water DMP ratio of 1:10. MS data of a
sample that was treated using a 1:10 ratio were evaluated to check if all water from the sample was
removed. However, the air in a HS vial also contains some water so that always a small amount of water is
injected on the column. Therefore a comparison was made with an empty vial (just filled with air). Extracting
an m/z value of 18, it was found that the obtained water peak for the treated sample was even smaller than
for the empty vial (Figure 3.4). This could be explained by the fact that residual DMP reacts with the moisture
in the air.
0
20000
40000
60000
80000
100000
120000
140000
160000
180000
200000
0 20 40 60 80 100 120 140 160 180 200
Peak a
rea o
f aceto
ne
Reaction time (min)
1 µL HCl
5 µL HCl
10 µL HCl
20 µL HCl
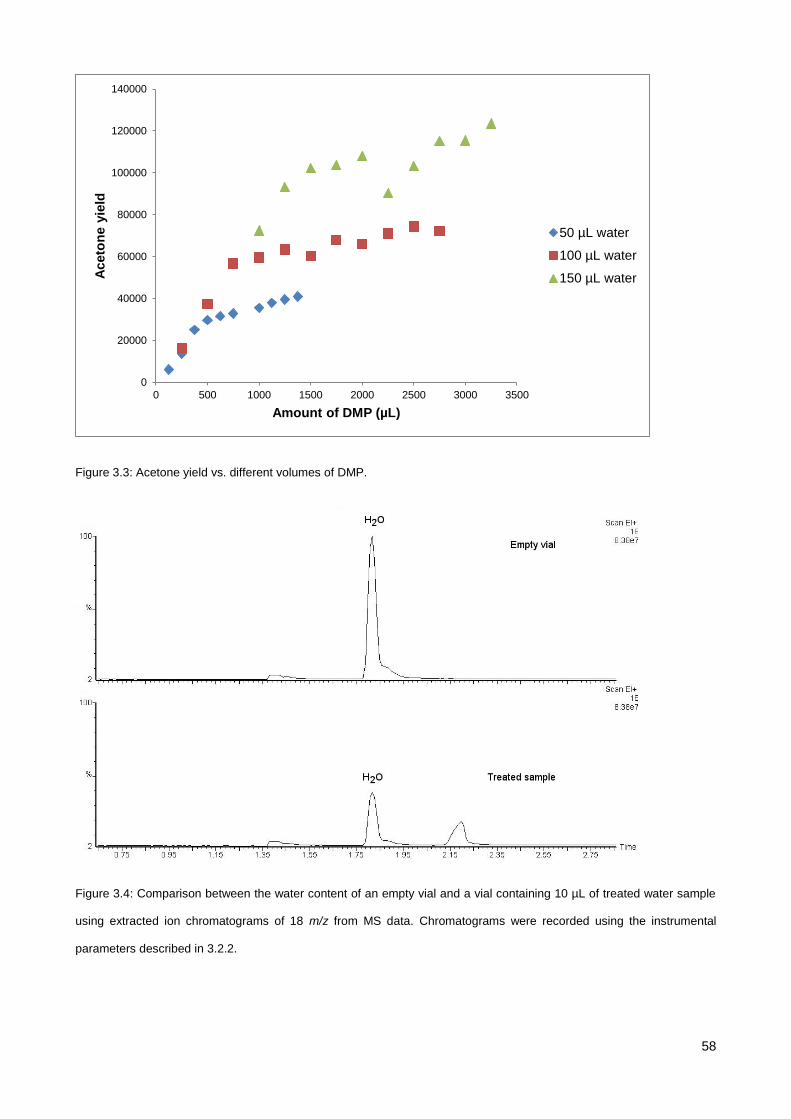
58
Figure 3.3: Acetone yield vs. different volumes of DMP.
Figure 3.4: Comparison between the water content of an empty vial and a vial containing 10 µL of treated water sample
using extracted ion chromatograms of 18 m/z from MS data. Chromatograms were recorded using the instrumental
parameters described in 3.2.2.
0
20000
40000
60000
80000
100000
120000
140000
0 500 1000 1500 2000 2500 3000 3500
Aceto
ne y
ield
Amount of DMP (µL)
50 µL water
100 µL water
150 µL water
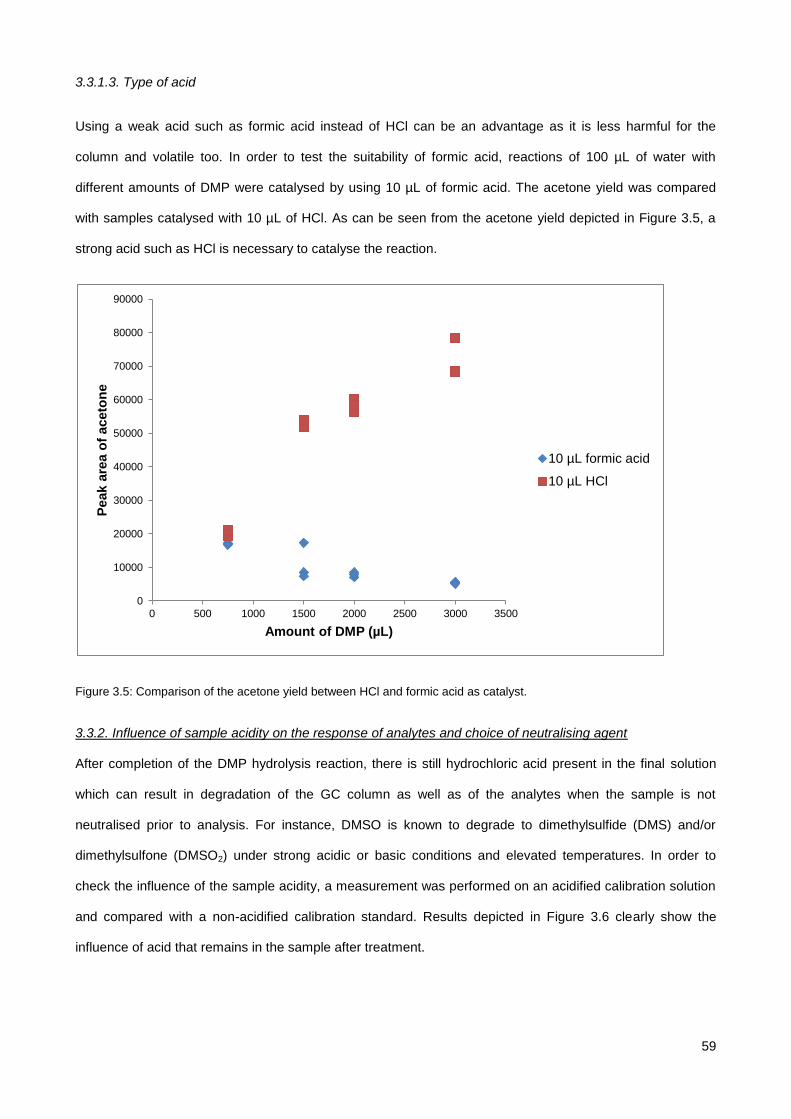
59
3.3.1.3. Type of acid
Using a weak acid such as formic acid instead of HCl can be an advantage as it is less harmful for the
column and volatile too. In order to test the suitability of formic acid, reactions of 100 µL of water with
different amounts of DMP were catalysed by using 10 µL of formic acid. The acetone yield was compared
with samples catalysed with 10 µL of HCl. As can be seen from the acetone yield depicted in Figure 3.5, a
strong acid such as HCl is necessary to catalyse the reaction.
Figure 3.5: Comparison of the acetone yield between HCl and formic acid as catalyst.
3.3.2. Influence of sample acidity on the response of analytes and choice of neutralising agent
After completion of the DMP hydrolysis reaction, there is still hydrochloric acid present in the final solution
which can result in degradation of the GC column as well as of the analytes when the sample is not
neutralised prior to analysis. For instance, DMSO is known to degrade to dimethylsulfide (DMS) and/or
dimethylsulfone (DMSO2) under strong acidic or basic conditions and elevated temperatures. In order to
check the influence of the sample acidity, a measurement was performed on an acidified calibration solution
and compared with a non-acidified calibration standard. Results depicted in Figure 3.6 clearly show the
influence of acid that remains in the sample after treatment.
0
10000
20000
30000
40000
50000
60000
70000
80000
90000
0 500 1000 1500 2000 2500 3000 3500
Peak a
rea o
f aceto
ne
Amount of DMP (µL)
10 µL formic acid
10 µL HCl
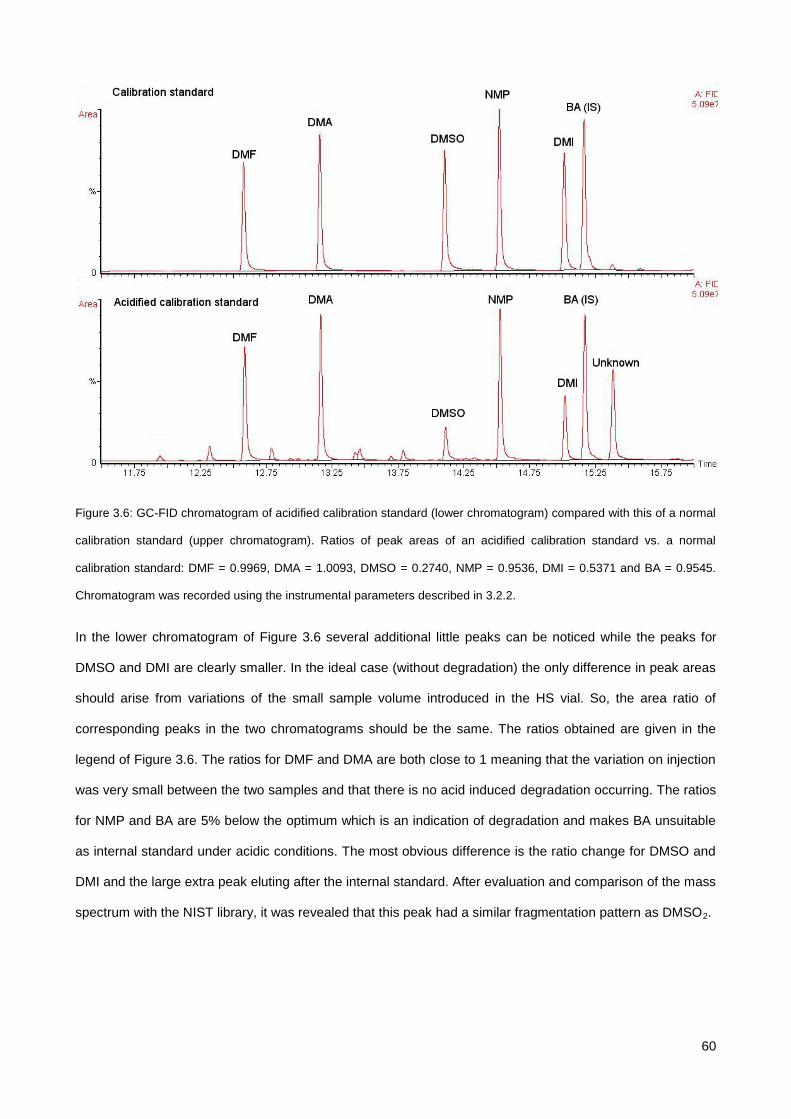
60
Figure 3.6: GC-FID chromatogram of acidified calibration standard (lower chromatogram) compared with this of a normal
calibration standard (upper chromatogram). Ratios of peak areas of an acidified calibration standard vs. a normal
calibration standard: DMF = 0.9969, DMA = 1.0093, DMSO = 0.2740, NMP = 0.9536, DMI = 0.5371 and BA = 0.9545.
Chromatogram was recorded using the instrumental parameters described in 3.2.2.
In the lower chromatogram of Figure 3.6 several additional little peaks can be noticed while the peaks for
DMSO and DMI are clearly smaller. In the ideal case (without degradation) the only difference in peak areas
should arise from variations of the small sample volume introduced in the HS vial. So, the area ratio of
corresponding peaks in the two chromatograms should be the same. The ratios obtained are given in the
legend of Figure 3.6. The ratios for DMF and DMA are both close to 1 meaning that the variation on injection
was very small between the two samples and that there is no acid induced degradation occurring. The ratios
for NMP and BA are 5% below the optimum which is an indication of degradation and makes BA unsuitable
as internal standard under acidic conditions. The most obvious difference is the ratio change for DMSO and
DMI and the large extra peak eluting after the internal standard. After evaluation and comparison of the mass
spectrum with the NIST library, it was revealed that this peak had a similar fragmentation pattern as DMSO2.
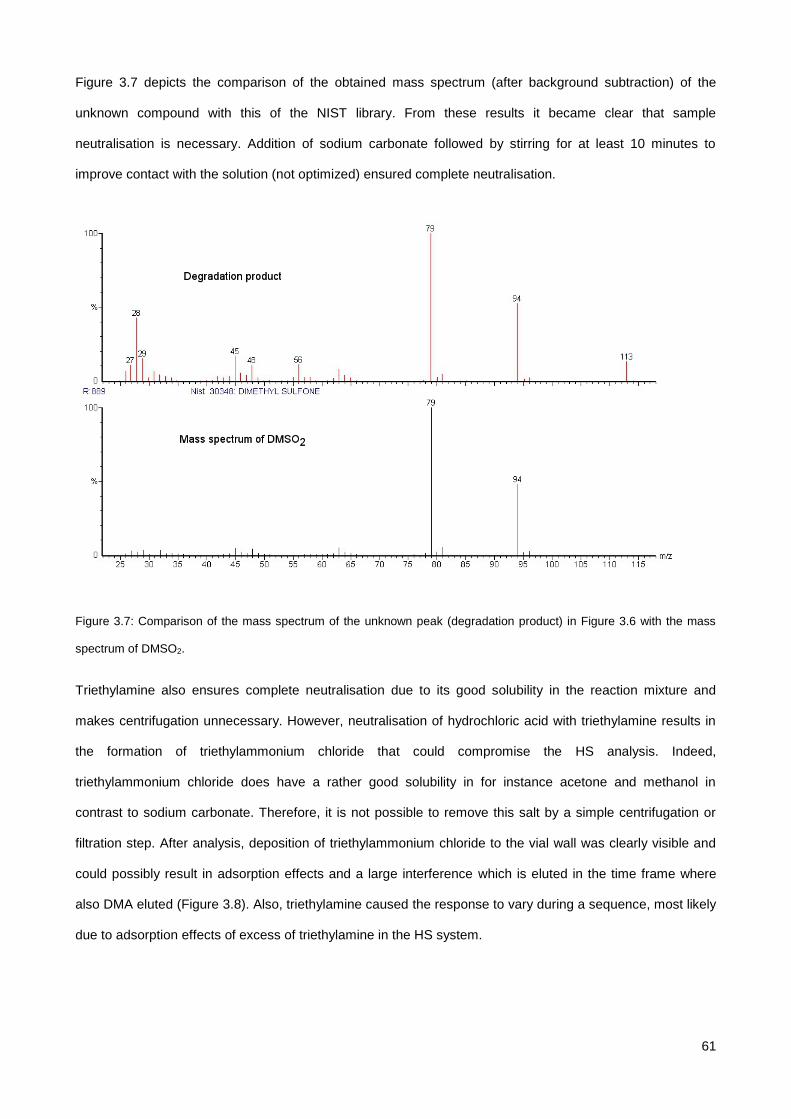
61
Figure 3.7 depicts the comparison of the obtained mass spectrum (after background subtraction) of the
unknown compound with this of the NIST library. From these results it became clear that sample
neutralisation is necessary. Addition of sodium carbonate followed by stirring for at least 10 minutes to
improve contact with the solution (not optimized) ensured complete neutralisation.
Figure 3.7: Comparison of the mass spectrum of the unknown peak (degradation product) in Figure 3.6 with the mass
spectrum of DMSO2.
Triethylamine also ensures complete neutralisation due to its good solubility in the reaction mixture and
makes centrifugation unnecessary. However, neutralisation of hydrochloric acid with triethylamine results in
the formation of triethylammonium chloride that could compromise the HS analysis. Indeed,
triethylammonium chloride does have a rather good solubility in for instance acetone and methanol in
contrast to sodium carbonate. Therefore, it is not possible to remove this salt by a simple centrifugation or
filtration step. After analysis, deposition of triethylammonium chloride to the vial wall was clearly visible and
could possibly result in adsorption effects and a large interference which is eluted in the time frame where
also DMA eluted (Figure 3.8). Also, triethylamine caused the response to vary during a sequence, most likely
due to adsorption effects of excess of triethylamine in the HS system.
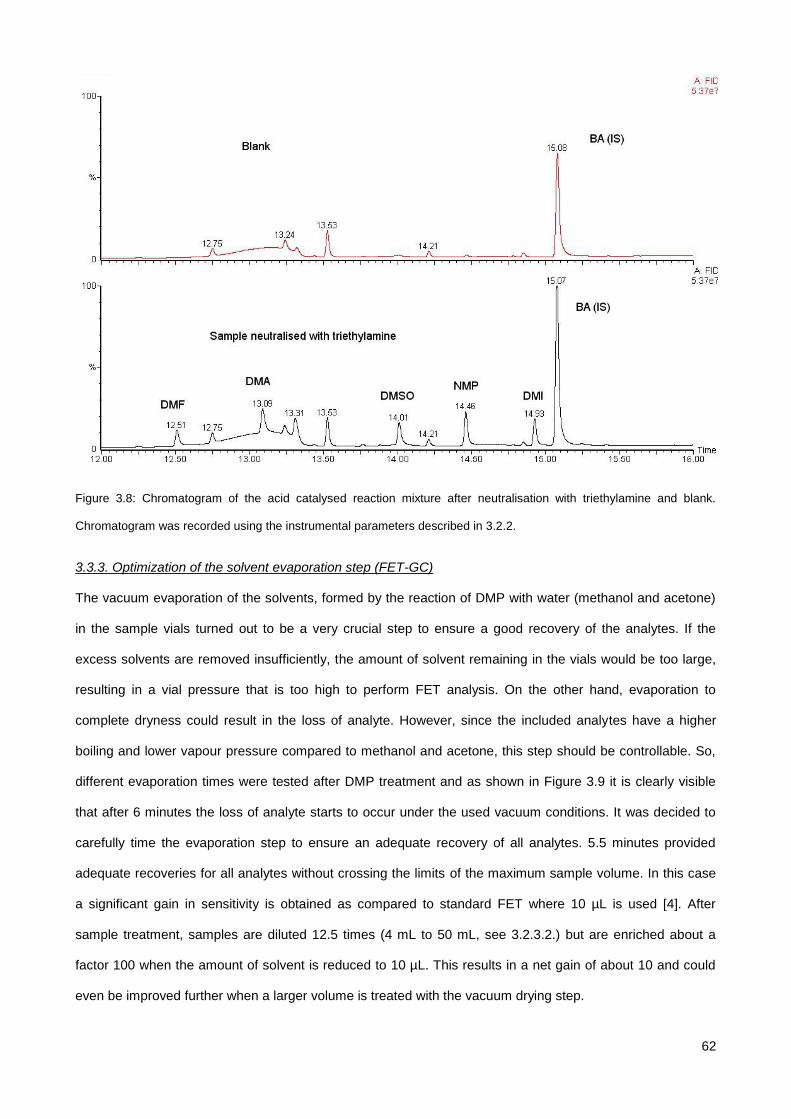
62
Figure 3.8: Chromatogram of the acid catalysed reaction mixture after neutralisation with triethylamine and blank.
Chromatogram was recorded using the instrumental parameters described in 3.2.2.
3.3.3. Optimization of the solvent evaporation step (FET-GC)
The vacuum evaporation of the solvents, formed by the reaction of DMP with water (methanol and acetone)
in the sample vials turned out to be a very crucial step to ensure a good recovery of the analytes. If the
excess solvents are removed insufficiently, the amount of solvent remaining in the vials would be too large,
resulting in a vial pressure that is too high to perform FET analysis. On the other hand, evaporation to
complete dryness could result in the loss of analyte. However, since the included analytes have a higher
boiling and lower vapour pressure compared to methanol and acetone, this step should be controllable. So,
different evaporation times were tested after DMP treatment and as shown in Figure 3.9 it is clearly visible
that after 6 minutes the loss of analyte starts to occur under the used vacuum conditions. It was decided to
carefully time the evaporation step to ensure an adequate recovery of all analytes. 5.5 minutes provided
adequate recoveries for all analytes without crossing the limits of the maximum sample volume. In this case
a significant gain in sensitivity is obtained as compared to standard FET where 10 µL is used [4]. After
sample treatment, samples are diluted 12.5 times (4 mL to 50 mL, see 3.2.3.2.) but are enriched about a
factor 100 when the amount of solvent is reduced to 10 µL. This results in a net gain of about 10 and could
even be improved further when a larger volume is treated with the vacuum drying step.
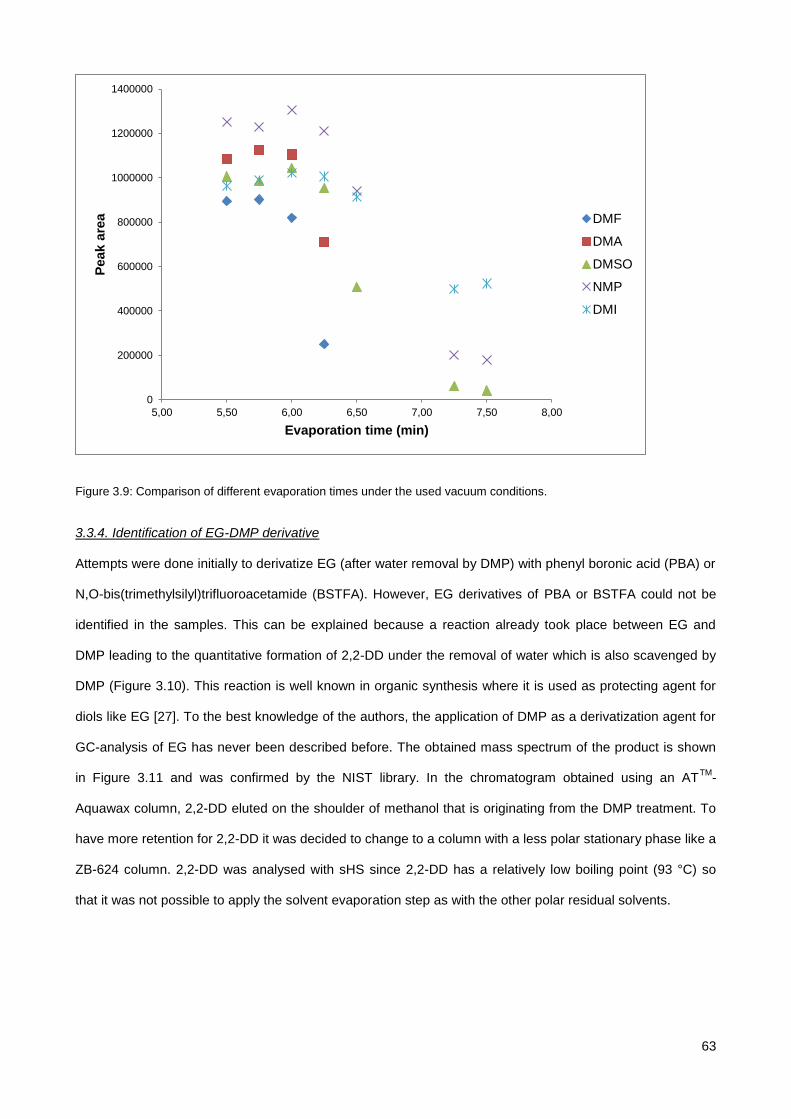
63
Figure 3.9: Comparison of different evaporation times under the used vacuum conditions.
3.3.4. Identification of EG-DMP derivative
Attempts were done initially to derivatize EG (after water removal by DMP) with phenyl boronic acid (PBA) or
N,O-bis(trimethylsilyl)trifluoroacetamide (BSTFA). However, EG derivatives of PBA or BSTFA could not be
identified in the samples. This can be explained because a reaction already took place between EG and
DMP leading to the quantitative formation of 2,2-DD under the removal of water which is also scavenged by
DMP (Figure 3.10). This reaction is well known in organic synthesis where it is used as protecting agent for
diols like EG [27]. To the best knowledge of the authors, the application of DMP as a derivatization agent for
GC-analysis of EG has never been described before. The obtained mass spectrum of the product is shown
in Figure 3.11 and was confirmed by the NIST library. In the chromatogram obtained using an ATTM
-
Aquawax column, 2,2-DD eluted on the shoulder of methanol that is originating from the DMP treatment. To
have more retention for 2,2-DD it was decided to change to a column with a less polar stationary phase like a
ZB-624 column. 2,2-DD was analysed with sHS since 2,2-DD has a relatively low boiling point (93 °C) so
that it was not possible to apply the solvent evaporation step as with the other polar residual solvents.
0
200000
400000
600000
800000
1000000
1200000
1400000
5,00 5,50 6,00 6,50 7,00 7,50 8,00
Peak a
rea
Evaporation time (min)
DMF
DMA
DMSO
NMP
DMI
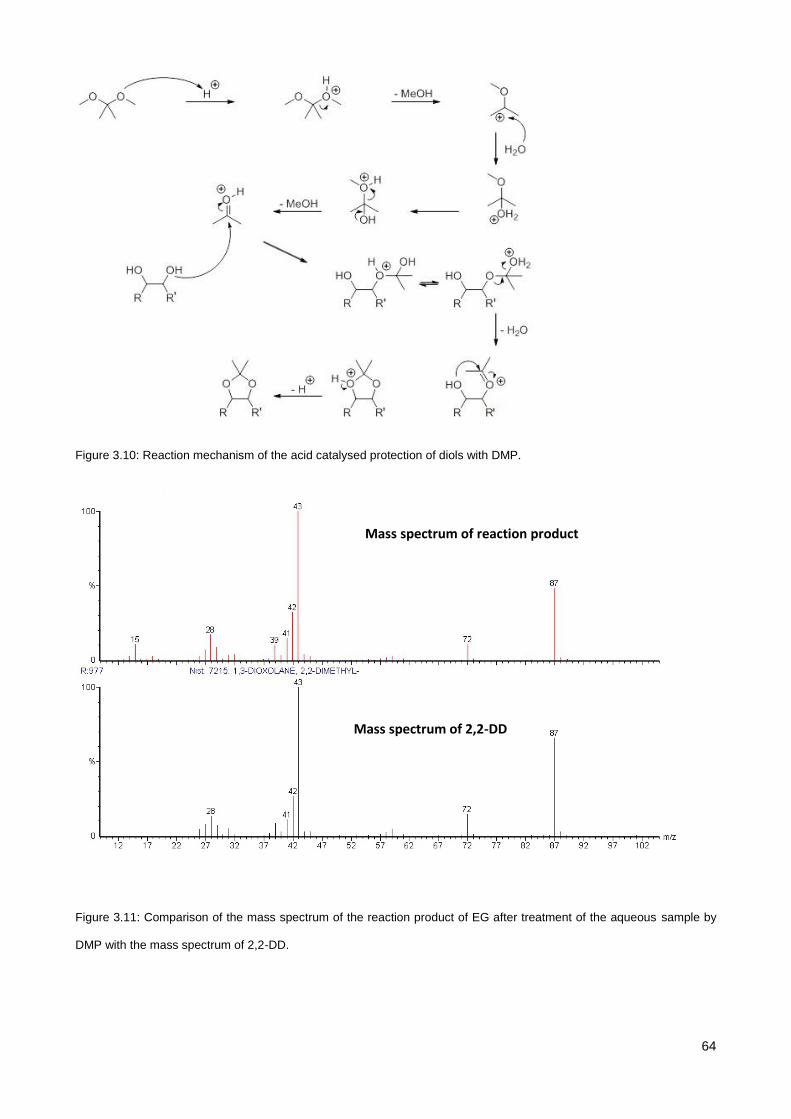
64
Figure 3.10: Reaction mechanism of the acid catalysed protection of diols with DMP.
Figure 3.11: Comparison of the mass spectrum of the reaction product of EG after treatment of the aqueous sample by
DMP with the mass spectrum of 2,2-DD.
Mass spectrum of 2,2-DD
Mass spectrum of reaction product
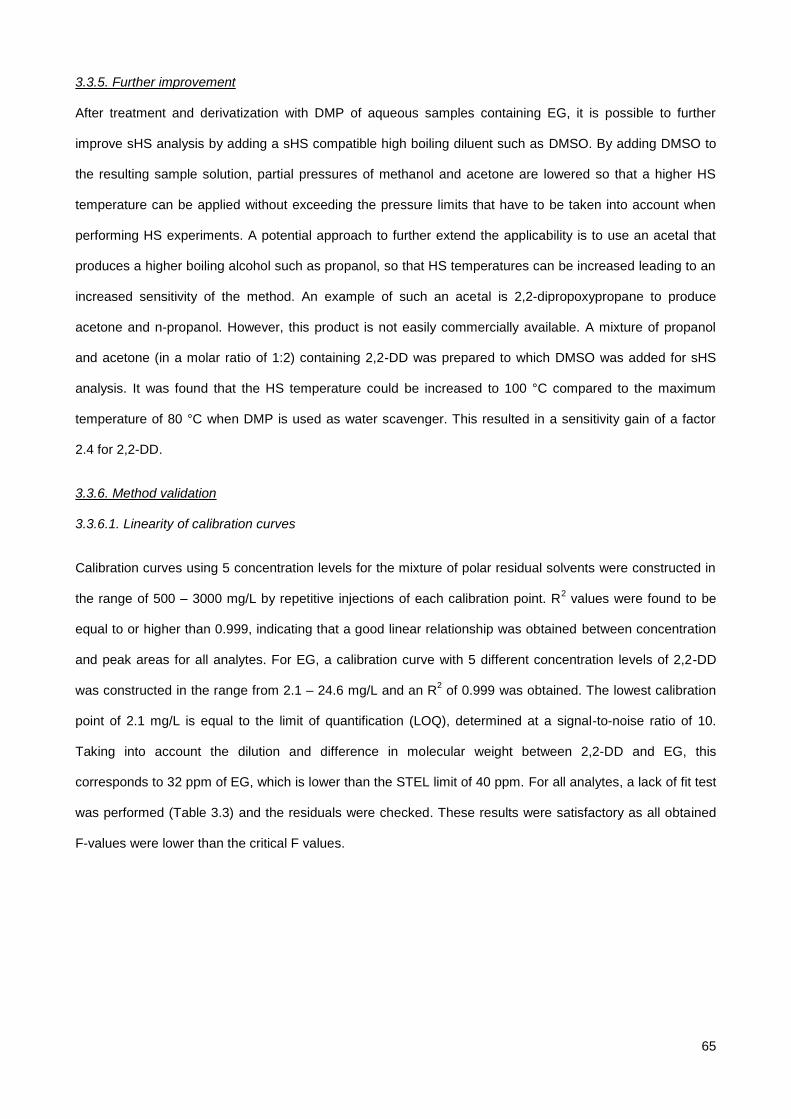
65
3.3.5. Further improvement
After treatment and derivatization with DMP of aqueous samples containing EG, it is possible to further
improve sHS analysis by adding a sHS compatible high boiling diluent such as DMSO. By adding DMSO to
the resulting sample solution, partial pressures of methanol and acetone are lowered so that a higher HS
temperature can be applied without exceeding the pressure limits that have to be taken into account when
performing HS experiments. A potential approach to further extend the applicability is to use an acetal that
produces a higher boiling alcohol such as propanol, so that HS temperatures can be increased leading to an
increased sensitivity of the method. An example of such an acetal is 2,2-dipropoxypropane to produce
acetone and n-propanol. However, this product is not easily commercially available. A mixture of propanol
and acetone (in a molar ratio of 1:2) containing 2,2-DD was prepared to which DMSO was added for sHS
analysis. It was found that the HS temperature could be increased to 100 °C compared to the maximum
temperature of 80 °C when DMP is used as water scavenger. This resulted in a sensitivity gain of a factor
2.4 for 2,2-DD.
3.3.6. Method validation
3.3.6.1. Linearity of calibration curves
Calibration curves using 5 concentration levels for the mixture of polar residual solvents were constructed in
the range of 500 – 3000 mg/L by repetitive injections of each calibration point. R2 values were found to be
equal to or higher than 0.999, indicating that a good linear relationship was obtained between concentration
and peak areas for all analytes. For EG, a calibration curve with 5 different concentration levels of 2,2-DD
was constructed in the range from 2.1 – 24.6 mg/L and an R2 of 0.999 was obtained. The lowest calibration
point of 2.1 mg/L is equal to the limit of quantification (LOQ), determined at a signal-to-noise ratio of 10.
Taking into account the dilution and difference in molecular weight between 2,2-DD and EG, this
corresponds to 32 ppm of EG, which is lower than the STEL limit of 40 ppm. For all analytes, a lack of fit test
was performed (Table 3.3) and the residuals were checked. These results were satisfactory as all obtained
F-values were lower than the critical F values.
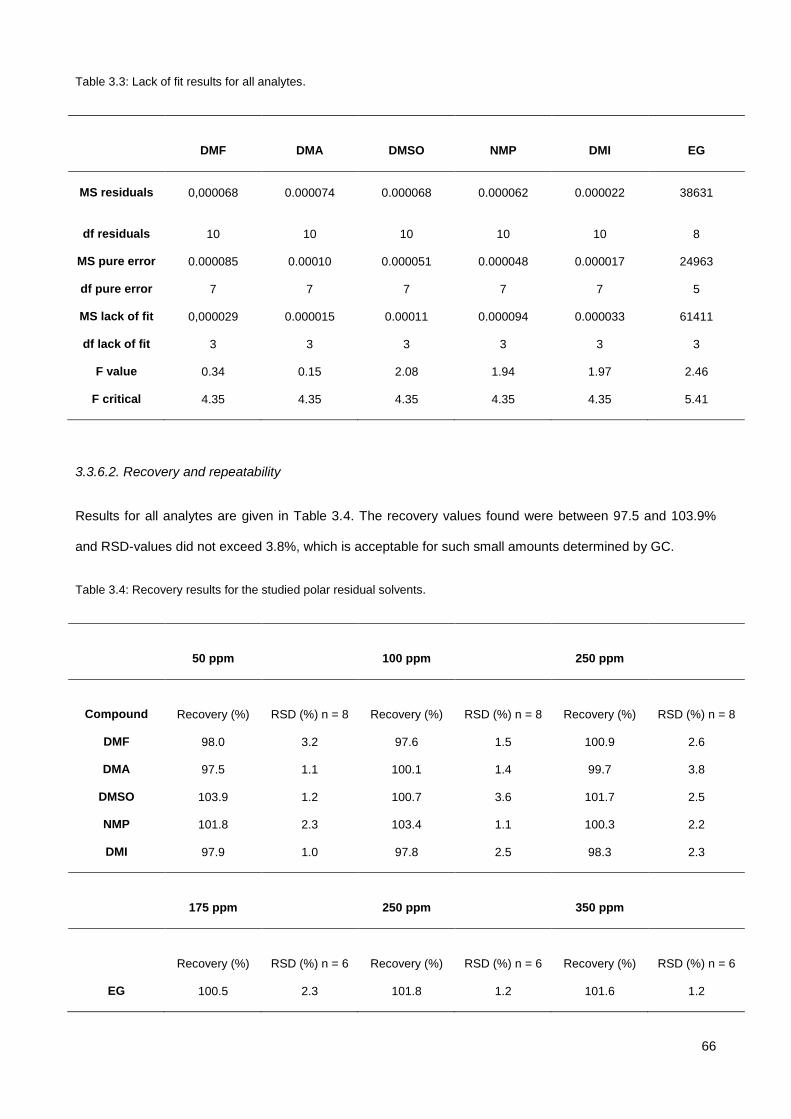
66
Table 3.3: Lack of fit results for all analytes.
DMF
DMA
DMSO
NMP
DMI
EG
MS residuals
0,000068
0.000074 0.000068 0.000062 0.000022 38631
df residuals 10 10 10 10 10 8
MS pure error 0.000085 0.00010 0.000051 0.000048 0.000017 24963
df pure error 7 7 7 7 7 5
MS lack of fit 0,000029 0.000015 0.00011 0.000094 0.000033 61411
df lack of fit 3 3 3 3 3 3
F value 0.34 0.15 2.08 1.94 1.97 2.46
F critical 4.35 4.35 4.35 4.35 4.35 5.41
3.3.6.2. Recovery and repeatability
Results for all analytes are given in Table 3.4. The recovery values found were between 97.5 and 103.9%
and RSD-values did not exceed 3.8%, which is acceptable for such small amounts determined by GC.
Table 3.4: Recovery results for the studied polar residual solvents.
50 ppm
100 ppm
250 ppm
Compound
Recovery (%)
RSD (%) n = 8
Recovery (%)
RSD (%) n = 8
Recovery (%)
RSD (%) n = 8
DMF 98.0 3.2 97.6 1.5 100.9 2.6
DMA 97.5 1.1 100.1 1.4 99.7 3.8
DMSO 103.9 1.2 100.7 3.6 101.7 2.5
NMP 101.8 2.3 103.4 1.1 100.3 2.2
DMI 97.9 1.0 97.8 2.5 98.3 2.3
175 ppm
250 ppm
350 ppm
Recovery (%)
RSD (%) n = 6
Recovery (%)
RSD (%) n = 6
Recovery (%)
RSD (%) n = 6
EG 100.5 2.3 101.8 1.2 101.6 1.2
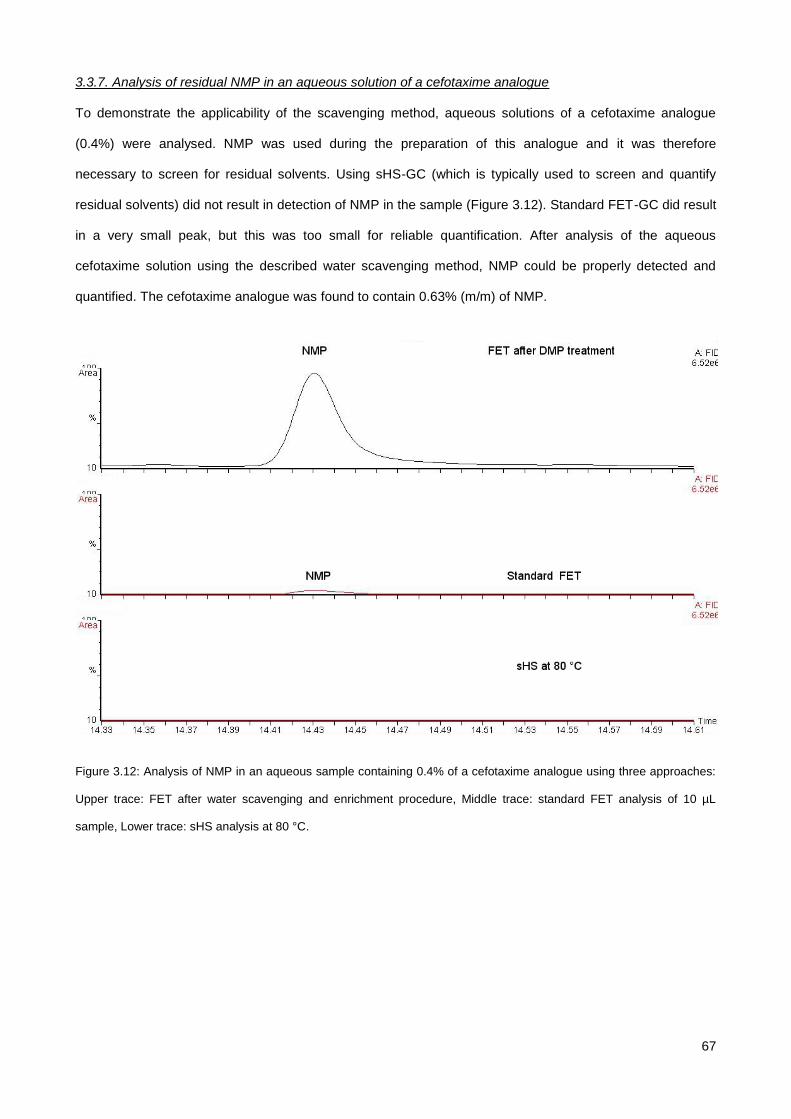
67
3.3.7. Analysis of residual NMP in an aqueous solution of a cefotaxime analogue
To demonstrate the applicability of the scavenging method, aqueous solutions of a cefotaxime analogue
(0.4%) were analysed. NMP was used during the preparation of this analogue and it was therefore
necessary to screen for residual solvents. Using sHS-GC (which is typically used to screen and quantify
residual solvents) did not result in detection of NMP in the sample (Figure 3.12). Standard FET-GC did result
in a very small peak, but this was too small for reliable quantification. After analysis of the aqueous
cefotaxime solution using the described water scavenging method, NMP could be properly detected and
quantified. The cefotaxime analogue was found to contain 0.63% (m/m) of NMP.
Figure 3.12: Analysis of NMP in an aqueous sample containing 0.4% of a cefotaxime analogue using three approaches:
Upper trace: FET after water scavenging and enrichment procedure, Middle trace: standard FET analysis of 10 µL
sample, Lower trace: sHS analysis at 80 °C.
68
3.3.8. Analysis of EG in contact lens fluids
Five different contact lens fluids were examined. In four of them, no traces of EG were detected, but one of
the samples did contain 2,2-DD which was formed from EG originally present in the sample. The 2,2-DD
concentration was found to be 4.8 mg/L, which was recalculated to 73 ppm of EG in the original sample. This
is above the threshold concentration at which harmful effects start to manifest.
3.4. Conclusions
Results have shown that the DMP hydrolysis reaction with water is an excellent method to circumvent
several GC related problems. Firstly, the DMP hydrolysis reaction enabled sample enrichment of aqueous
samples prior to FET-GC analysis to address the problems related to the maximum tolerable sample volume.
In this case a 10-fold increase of sensitivity was obtained compared to standard FET of aqueous samples
where 10 µL is used and this can be further improved if a larger sample volume is enriched during the
vacuum drying step. The proposed method provides adequate recovery for a set of typical high boiling polar
residual solvents after successfully removing water from aqueous samples. The developed method was
applied for the determination of residual NMP in an aqueous solution containing a cefotaxime analogue.
NMP was successfully detected and quantified using the water scavenging method while standard FET and
sHS approaches showed insufficient sensitivity. Furthermore, it was discovered that under the used reaction
conditions EG converts quantitatively to 2,2-DD whilst water is eliminated as well. This makes further
derivatization with reagents such as PBA or BSTFA superfluous. Adding DMSO to the sample enabled sHS
analysis of EG making it possible to quantify 40 ppm of EG in aqueous samples which is the level where EG
starts to have an effect on human health according to its STEL limit. As with the high boiling residual
solvents, good recoveries were obtained with an acceptable limit of quantification. By selecting another
acetone acetal (such as 2,2-dipropoxypropane) higher boiling alcohols could be produced. This has the
advantage that higher HS temperatures could be selected leading to a higher sensitivity. Finally, the
proposed method could also be used with direct injection as the resulting reaction mixture is not harmful to
non-water resistant GC columns and flooding of injection liners would be avoided. This will enable large
volume injection with for instance a programmed temperature injector to increase further the sensitivity.
69
3.5. References
[1] B. Yu, Y. Song, L. Han, H. Yu, Y. Liu, H. Liu, Optimizations of packed sorbent and inlet temperature for
large volume-direct aqueous injection-gas chromatography to determine high boiling volatile organic
compounds in water, J. Chromatogr. A, 1356 (2014) 221-229
[2] European Pharmacopoeia, 8th ed., Identification and Control of Residual Solvents. (Section 2.4.24),
European Department for the Quality of Medicines, Council of Europe, Strasbourg, 2014.
[3] K. Ui, M. Abo, A. Okubo, S. Yamazaki, An improved method for the analysis of mimethyl sulfoxide in
water samples, Analytical Sciences 20 (2004) 223-225
[4] D.M. Kialengila, K. Wolfs, J. Bugalama, A. Van Schepdael, E. Adams, Full evaporation headspace gas
chromatography for sensitive determination of high boiling point volatile organic compounds in low boiling
matrices, J. Chromatogr. A, 1315 (2013) 167-175
[5] N. van Boxtel, K. Wolfs, A. Van Schepdael, E. Adams, Evaluation of the full evaporation technique for
quantitative analysis of high boiling compounds with high affinity for apolar matrices, J. Chromatogr. A, 1348
(2014) 63-70
[6] H.C. Hu, X.S. Chai, C.H. Wei, D. Barnes, Increasing the sensitivity of headspace analysis of low volatility
solutes through water removal by hydrate formation, J. Chromatogr. A, 1343 (2014) 42-46
[7] www.merck-millipore.com/dryingagents. Accessed on 17-7-2015.
[8] C. Devos, N. Ochiai, K. Sasamoto, P. Sandra, F. David, Full evaporation dynamic headspace in
combination with selectable one-dimensional/two-dimensional gas chromatography-mass spectrometry for
the determination of suspected fragrance allergens in cosmetic products, J. Chromatogr. A, 1255 (2012)
207-215
[9] N. Ochai, K. Sasamoto, A. Hoffmann, K. Okanoya, Full evaporation dynamic headspace and gas
chromatography-mass spectrometry for uniform enrichment of odor compounds in aqueous samples, J.
Chromatogr. A, 1240 (2012) 59-68
70
[10] N. Ochai, K. Sasamoto, K. MacNamara, Characterization of sulfur compounds in whisky by full
evaporation dynamic headspace and selectable one-dimensional/two-dimensional retention time locked gas
chromatography-mass spectrometry with simultaneous element specific detection, J. Chromatogr. A, 1270
(2012) 296-304
[11] N.B. Smith, Determination of serum ethylene glycol by capillary gas chromatography, Clin. Chim. Acta,
144 (1984) 269-272
[12] W.H. Porter, P.H. Rutter, H. H. Yao, Simultaneous determination of ethylene glycol and glycolic acid in
serum by gas chromatography-mass spectrometry, J. Anal.Toxicol., 23 (1999) 591-597
[13] V. Gembus, J.P. Goullé, C. Lacroix, Determination of glycols in biological specimens by gas
chromatography-mass spectrometry, J. Anal.Toxicol., 26 (2002) 280-285
[14] M.R. Meyer, A.A. Weber, H.H. Maurer, A validated GC-MS procedure for fast, simple, and cost-effective
quantification of glycols and GHB in human plasma and their identification in urine and plasma developed for
emergency toxicology, Anal. Bioanal. Chem., 400 (2011) 411-414
[15] C. Achili, A. Ciana, M. Fagnoni, C. Balduini, G. Minetti, Susceptibility to hydrolysis of phenylboronic
pinacol esters at physiological pH, Cent. Eur. J. Chem., 11 (2013) 137-139
[16] A. Takeuchi, S. Yamamoto, R. Narai, M. Nishida, M. Yashiki, N. Sakui, A. Namera, Determination of
dimethyl sulfoxide and dimethyl sulfone in urine by gas chromatography-mass spectrometry after preparation
using 2,2-dimethoxypropane, Biomed. Chromatogr., 24 (2010) 465-471
[17] K.D. Dix, P.A. Sakkinen, J.S. Fritz, Gas chromatographic determination of water using 2,2-
dimethoxypropane and a solid acid catalyst, Anal. Chem., 61 (1989) 1325-1327
[18] F.E. Critchfield, E.T. Bishop, Water determination by reaction with 2,2-dimethoxypropane, Anal. Chem.,
33 (1961) 1034-1035
[19] N.Y. Mary, Gas chromatographic determination of water in natural products by reaction with 2,2-
dimethoxypropane, J. Pharm. Sci., 58 (1969) 1089-1092
[20] D. Erley, 2,2-dimethoxypropane as a drying agent for preparation of infrared samples, Anal. Chem., 29
(1957) 1564-1564
71
[21] J.R. Thorpe, D.M.R. Harvey, J. Optimization and investigation of the use of 2,2-dimethoxypropane as a
dehydration agent for plant tissues in transmission electron microscopy, J. Ultrastruc. Res., 68 (1979) 186-
194
[22] M.D. Maser, J.J. Trimble, Rapid chemical dehydration of biologic samples for scanning electron
microscopy using 2,2-dimethoxypropane, J. Histochem. Cytochem., 25 (1977) 247-251
[23] L.L. Muller, T.J. Jacks, Rapid chemical dehydration of samples for electron microscopic examinations, J.
Histochem. Cytochem., 23 (1975) 107-110
[24] K. Conway, J.A. Kiernan, Chemical dehydration of specimens with 2,2-dimethoxypropane (DMP) for
paraffin processing of animal tissues: practical and economic advantages over dehydration in ethanol,
Biotechnic Histochem., 74 (1999) 20-26
[25] A. De Ruiter, P. Van Banning, J.J. Willemse, Rapid histological results in aquaculture research by using
the time-saving embedding procedure with 2,2-dimethoxypropane, Aquaculture, 25 (1981) 293-297
[26] Public Health England, Ethylene glycol: health effects, incident management and toxicology, 1 July
2014. Part of Chemical hazards compendium.
[27] T.W. Green, P. G. M. Wuts, Protective Groups in Organic Synthesis, Wiley-Interscience, New York,
1999, 207-215, 716-719

72
73
Chapter 4 - A headspace gas chromatography based methodology for the analysis
of aromatic substituted quaternary ammonium salts
Niels van Boxtel, Kris Wolfs, Marta Guillén Palacín, Ann Van Schepdael, Erwin Adams
Pharmaceutical Analysis, Department of Pharmaceutical and Pharmacological Sciences
KU Leuven, Leuven, Belgium
Submitted to J. Chromatogr. A

74
75
Abstract
The analysis of quaternary ammonium salts (QAS) using GC is often performed by ‗‘in injector‘‘ pyrolysis to
create volatile degradation products for quantification purposes. Besides the risk of severe system
contamination, the application of this approach on aqueous samples is problematic. In this work, the sample
is treated in a vial with 2,2-dimethoxypropane (DMP) under acidic catalysis. In addition to the removal of
water and sample enrichment, the QAS are decomposed. As HS transfers only volatile compounds to the
GC system, contamination is avoided. It was found that depending on the presence of benzyl, phenyl or
methyl groups on the quaternary nitrogen; benzyl chloride, N,N-dimethylaniline or chloromethane are formed
respectively in the sealed vial. All these can be used as an analytical target. A calibration curve for benzyl
chloride could be derived from the pure compound. Chloromethane was generated from pure
benzyldimethyldecylammonium chloride (BEDIDE), a pure QAS with benzyl and methyl groups, to construct
a secondary calibration curve using a back analysis approach. It has been proven that by quantifying the
formed analytical targets, the mass balance for the QAS under investigation was close to 100%. The
presented procedure allows the quantification of any aromatic substituted QAS without the need for a
matching reference, which is a major advantage over existing CE and HPLC methods. The proposed
methodology was validated for mouth sprays containing benzethonium chloride (BZTCl) or benzoxonium
chloride (BZOCl) and for denatonium benzoate (DB) in ethylene glycol (EG) based cooling liquids. Results
showed that the approach provided excellent linearity (R2 ≥ 0.999) and limits of detection around 0.01 µg/vial
for benzyl chloride. It was found that the reaction product of DMP and glycerol which was also present in the
mouthspray and some cooling liquids, caused chromatographic interference with benzyl chloride. Treating
those samples in the vial with N,O-bis(trimethylsilyl)trifluoroacetamide (BSTFA) after the enrichment step
removes the interference and leaves a possible pathway for the simultaneous determination of glycerol in
those samples.
Keywords
Headspace, quaternary ammonium salts, gas chromatography
76
4.1. Introduction
Quaternary ammonium salts (QAS) are synthesised by reaction of tertiary amines with halogenated
compounds and are mostly used as disinfectants, surfactants, corrosion inhibitors or pest controllers. The
analysis of QAS is usually performed using liquid chromatography (LC) [1-9], capillary electrophoresis (CE)
[10-12] or gas chromatography (GC) [13, 14]. Although LC is often combined with mass spectrometry (MS),
LC-MS based methods often suffer from matrix effects that cause ion suppression in the ion source. This can
be (partly) counteracted by using labelled standards which are however not always easily available and can
be very expensive. It is also known that CE does not offer the best repeatability/reproducibility and is more
problematic towards method transfer. GC methods are based on pyrolysis GC in which a sample is
introduced into a heated injector. This has the disadvantage that when not all the resulting pyrolysis products
are volatile, parts of the GC system can become contaminated by the gradual build-up of residues that
cannot be evaporated. The determination of QAS in aqueous samples poses an even larger challenge.
Evaporation of large amounts of water in an injection liner is problematic due to the large resulting gas
volume after evaporation leading to flooding of the injection liner. Moreover, the introduction of large
amounts of water on a GC column leads to column damage unless special water resistant columns are used.
Static headspace (sHS)-GC on the other hand allows clean sample introduction as only volatile sample
constituents are introduced in the GC system. However, the use of sHS-GC in combination with aqueous
samples is limited as the used incubation temperature should be kept below the boiling point of water. This
limits the sensitivity for analytes with a high boiling point and large affinity for the aqueous matrix. Recently, a
method was published in which an acetone acetal was used for the complete removal of water prior to the
analysis of a selection of typical high boiling polar residual solvents [15]. Acetone acetals such as 2,2-
dimethoxypropane (DMP) react with water to form acetone and methanol under acidic catalysis. The fact that
the resulting products are much more volatile than the analytes (which have a high boiling point), enables
sample enrichment by simple evaporation using either a vacuum oven or a stream of nitrogen.
This work covers the use of full evaporation (FET)-HS-GC for the analysis of benzyl substituted QAS in
aqueous samples after removal of water with DMP. First, a screening of typical QAS was performed to
determine the resulting products and to evaluate the quantitative relationship of this approach. Finally, the
method was applied to the analysis of denatonium benzoate (DB) in cooling liquids that contain both water
and ethylene glycol (EG). The same approach was used to analyse benzethonium chloride (BZTCl) and
benzoxonium chloride (BZOCl) in mouth sprays.
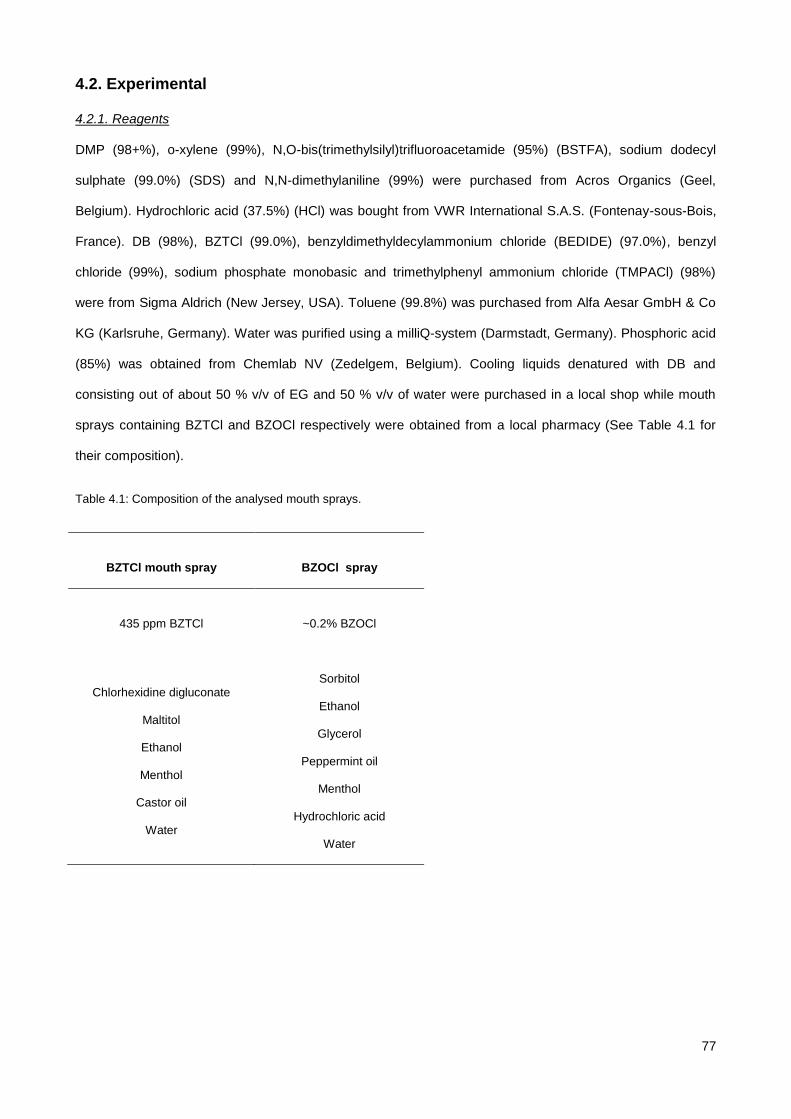
77
4.2. Experimental
4.2.1. Reagents
DMP (98+%), o-xylene (99%), N,O-bis(trimethylsilyl)trifluoroacetamide (95%) (BSTFA), sodium dodecyl
sulphate (99.0%) (SDS) and N,N-dimethylaniline (99%) were purchased from Acros Organics (Geel,
Belgium). Hydrochloric acid (37.5%) (HCl) was bought from VWR International S.A.S. (Fontenay-sous-Bois,
France). DB (98%), BZTCl (99.0%), benzyldimethyldecylammonium chloride (BEDIDE) (97.0%), benzyl
chloride (99%), sodium phosphate monobasic and trimethylphenyl ammonium chloride (TMPACl) (98%)
were from Sigma Aldrich (New Jersey, USA). Toluene (99.8%) was purchased from Alfa Aesar GmbH & Co
KG (Karlsruhe, Germany). Water was purified using a milliQ-system (Darmstadt, Germany). Phosphoric acid
(85%) was obtained from Chemlab NV (Zedelgem, Belgium). Cooling liquids denatured with DB and
consisting out of about 50 % v/v of EG and 50 % v/v of water were purchased in a local shop while mouth
sprays containing BZTCl and BZOCl respectively were obtained from a local pharmacy (See Table 4.1 for
their composition).
Table 4.1: Composition of the analysed mouth sprays.
BZTCl mouth spray
BZOCl spray
435 ppm BZTCl
~0.2% BZOCl
Chlorhexidine digluconate
Maltitol
Ethanol
Menthol
Castor oil
Water
Sorbitol
Ethanol
Glycerol
Peppermint oil
Menthol
Hydrochloric acid
Water
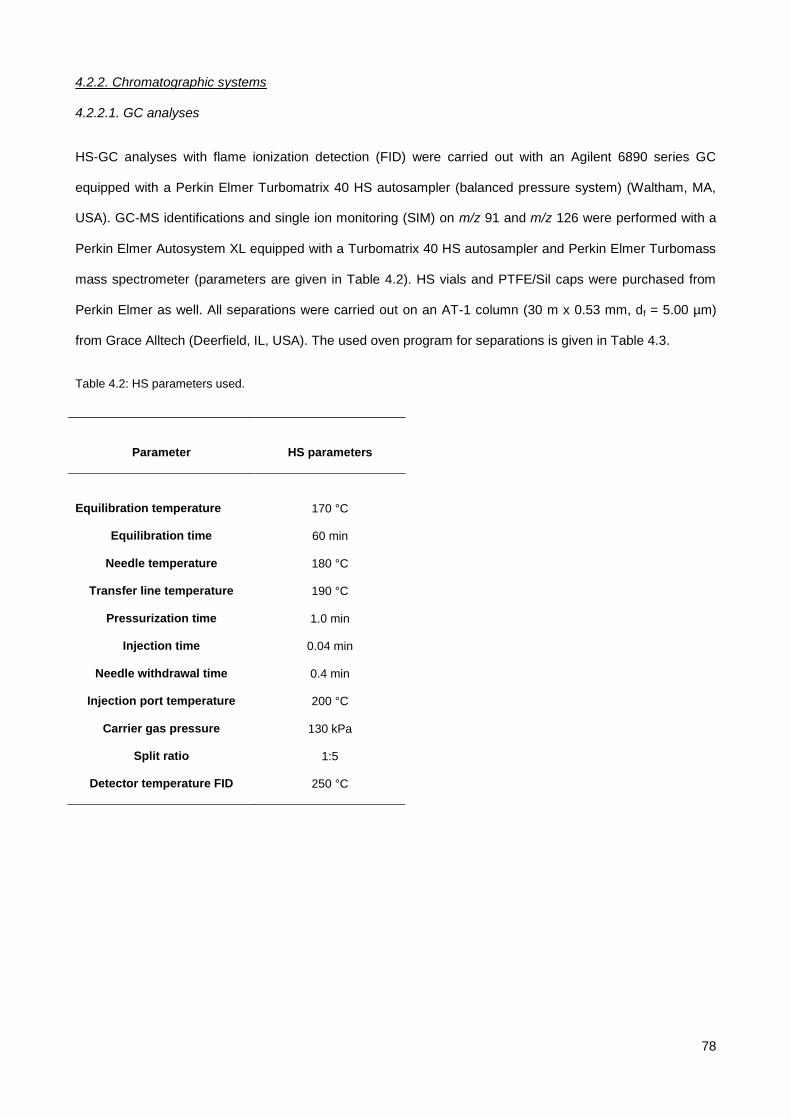
78
4.2.2. Chromatographic systems
4.2.2.1. GC analyses
HS-GC analyses with flame ionization detection (FID) were carried out with an Agilent 6890 series GC
equipped with a Perkin Elmer Turbomatrix 40 HS autosampler (balanced pressure system) (Waltham, MA,
USA). GC-MS identifications and single ion monitoring (SIM) on m/z 91 and m/z 126 were performed with a
Perkin Elmer Autosystem XL equipped with a Turbomatrix 40 HS autosampler and Perkin Elmer Turbomass
mass spectrometer (parameters are given in Table 4.2). HS vials and PTFE/Sil caps were purchased from
Perkin Elmer as well. All separations were carried out on an AT-1 column (30 m x 0.53 mm, df = 5.00 µm)
from Grace Alltech (Deerfield, IL, USA). The used oven program for separations is given in Table 4.3.
Table 4.2: HS parameters used.
Parameter
HS parameters
Equilibration temperature
170 °C
Equilibration time 60 min
Needle temperature 180 °C
Transfer line temperature 190 °C
Pressurization time 1.0 min
Injection time 0.04 min
Needle withdrawal time 0.4 min
Injection port temperature 200 °C
Carrier gas pressure 130 kPa
Split ratio 1:5
Detector temperature FID 250 °C
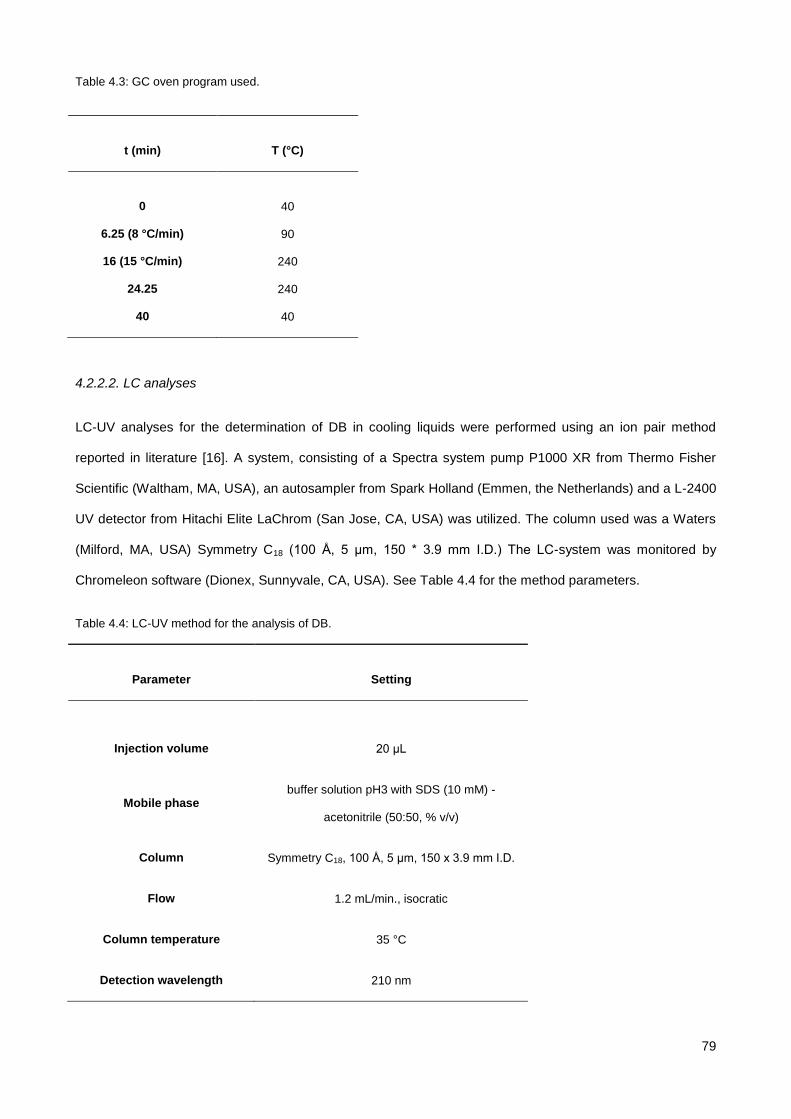
79
Table 4.3: GC oven program used.
t (min)
T (°C)
0
40
6.25 (8 °C/min) 90
16 (15 °C/min) 240
24.25 240
40 40
4.2.2.2. LC analyses
LC-UV analyses for the determination of DB in cooling liquids were performed using an ion pair method
reported in literature [16]. A system, consisting of a Spectra system pump P1000 XR from Thermo Fisher
Scientific (Waltham, MA, USA), an autosampler from Spark Holland (Emmen, the Netherlands) and a L-2400
UV detector from Hitachi Elite LaChrom (San Jose, CA, USA) was utilized. The column used was a Waters
(Milford, MA, USA) Symmetry C18 (100 Å, 5 μm, 150 * 3.9 mm I.D.) The LC-system was monitored by
Chromeleon software (Dionex, Sunnyvale, CA, USA). See Table 4.4 for the method parameters.
Table 4.4: LC-UV method for the analysis of DB.
Parameter
Setting
Injection volume
20 μL
Mobile phase buffer solution pH3 with SDS (10 mM) -
acetonitrile (50:50, % v/v)
Column Symmetry C18, 100 Å, 5 μm, 150 x 3.9 mm I.D.
Flow 1.2 mL/min., isocratic
Column temperature 35 °C
Detection wavelength 210 nm
80
4.2.3. Preparation of solutions and samples
4.2.3.1. GC analyses
4.2.3.1.1. Screening samples of different QAS
An overview of the QAS included in this study is given in Table 4.5. Solutions of pure QAS available as their
chloride salt (BZTCl, BEDIDE and TMPACl) and DB having benzoate as counter ion with concentrations of
15 mg/mL were prepared in methanol. For BZTCl, BEDIDE and TMPACl, 100 µL of each solution was
transferred to a HS vial. As DB is not a chloride salt, the reaction did not proceed and so the procedure was
adapted. 100 µL of methanolic DB solution and 10 µL of HCl were introduced in a HS vial. After evaporation
to dryness using a vacuum oven, vials were sealed with a PTFE/Sil cap and analysed using the described
HS-GC method to identify the major volatile decomposition (or pyrolysis) products.
BZOCl was not available as pure salt. Therefore, 10 µL of mouth spray containing BZOCl was treated with 1
mL of DMP (to which 10 µL of HCl was added) for water scavenging. This procedure was carried out directly
in the HS vial which was dried under vacuum afterwards. Next, the vial was sealed with a PTFE/Sil cap.
4.2.3.1.2. Internal standard solution
200 mg of toluene was dissolved in 10 mL of o-xylene and diluted 10 times by transferring 5.0 mL of the
solution to a volumetric flask of 50 mL. o-Xylene was used to bring the solution up to volume.
4.2.3.1.3. Calibration solutions for the determination of benzyl chloride
200 mg of benzyl chloride was dissolved in 10 mL of o-xylene and diluted 10 times by transferring 5.0 mL to
a volumetric flask of 50 mL and bringing to volume with o-xylene. A 6-point calibration series was prepared in
the range from 100 – 600 mg/L. Before bringing to volume with o-xylene, each time 4.0 mL of internal
standard solution was added. Calibration was performed by analysing 10 µL of each solution.
4.2.3.1.4. Calibration solutions for the determination of chloromethane
A solution of BEDIDE in methanol was prepared by dissolving 20 mg in 25 mL of methanol. A 6-point
calibration curve in the range from 1 – 10 mg/L was prepared using appropriate dilutions in methanol. 200 µL
of each calibration solution was transferred into a HS vial and methanol was removed by vacuum
evaporation. Then, 10 µL of o-xylene was added to the vial which was sealed with a PTFE/Sil-cap.
81
4.2.3.1.5. Sample preparation for the HS analysis of DB in cooling liquids (50% EG)
Samples were diluted 20-times with water from which an aliquot of 1.0 mL was transferred to a HS vial. After
adding 10.0 mL of DMP and 50 µL of HCl, the mixture was left for 5 minutes to react. After the water
scavenging process, samples were placed in a vacuum oven at 30 °C for 2 hours to evaporate all solvents
and HCl. After the drying step, another 1.0 mL of DMP and 10 µL of HCl were added to react with residues of
EG. Once again, samples were evaporated before adding 10 µL of o-xylene to the sample vial. Finally, vials
were sealed with a PTFE/Sil-cap and analysed with the described HS method. In case of FID detection, 100
µL of BSTFA was transferred into the sample vial for silanisation and evaporated to dryness before addition
of 10 µL o-xylene and closure of the vial.
4.2.3.1.6. Sample preparation for the HS analysis of BZTCl in a mouth spray
A mouth spray containing BZTCl was diluted 100 times in water. 1.0 mL of the resulting solution was brought
into a HS vial and 10.0 mL of DMP and 50 µL of HCl were added. After reacting for 5 minutes, samples were
evaporated to dryness in a vacuum oven at 30 °C. Before sealing the vials with a PTFE/Sil cap, 10 µL of o-
xylene was added.
4.2.3.1.7. Sample preparation for the HS analysis of BZOCl in a mouth spray
A mouth spray containing BZOCl was diluted 250 times in water. 1.0 mL of the resulting solution was brought
into a HS vial and 10.0 mL of DMP and 50 µL of HCl were added. After reacting for 5 minutes, samples were
evaporated to dryness in a vacuum oven at 30 °C. Before sealing the vials with a PTFE/Sil cap, 10 µL of o-
xylene was added.
4.2.3.2. LC analyses
4.2.3.2.1. Preparation of the mobile phase
A 0.1 M buffer solution of NaH2PO4 and phosphoric acid was prepared by adjusting the pH to 3.0. Next, 100
mL of the buffer was diluted 10 times in a volumetric flask of 1000 mL. Before bringing to volume, 2.88 g of
SDS was added. Finally, 500 mL of the resulting buffer solution was mixed with 500 mL of acetonitrile.
4.2.3.2.2. SDS solution
560 mg of SDS was dissolved in water using a volumetric flask of 100 mL.
82
4.2.3.2.3. DB standard solution
40 mg of DB was weighed and dissolved in 50.0 mL of water using a volumetric flask. This solution was
diluted 10 times by transferring 10.0 mL to a volumetric flask of 100 mL. Finally, 5.0 mL of this solution was
transferred to a 50 mL volumetric flask; 35 mL of ethanol was added and brought up to volume with water.
Finally the resulting reference solution was diluted twice with SDS solution.
4.2.3.2.4. Sample preparation for the HPLC analysis of DB in cooling liquids (50% EG)
5.0 mL of sample was transferred into a volumetric flask of 10 mL and brought up to volume using the SDS
solution.
4.2.4. Procedures
4.2.4.1. Study of degradation compounds
For all compounds under investigation, vials were prepared as described in 4.2.3.1.1. and analysed using
the parameters listed in Table 4.2 with an equilibration time of 60 min. The data were collected using MS in
full scan mode for identification and FID in parallel.
The effect of the equilibration time on the decomposition yield was investigated as example for BZTCl and
BEDIDE. The vials prepared as described in 4.2.3.1.1. were analysed using the parameters listed in Table
4.2, but with different equilibration times varying from 35 to 60 minutes. The resulting peak areas for benzyl
chloride and chloromethane were measured.
4.2.4.2. Calibration for benzyl chloride
Three calibration curves were constructed. One was FID based, while the two others were SIM based (m/z
91 and m/z 126). Each six point calibration curve was constructed using the vials prepared in duplicate
according to 4.2.3.1.3. The peak areas for benzyl chloride were corrected with the obtained peak areas for
toluene which was used as internal standard.
4.2.4.3. Calibration for chloromethane
Decomposition of QAS like BEDIDE results in the formation of either benzyl chloride or chloromethane (see
also Table 4.5). The benzyl chloride content of the vials prepared as described in 4.2.3.1.4. was determined
using the analytical parameters from Table 4.2 with FID detection and the calibration curve obtained from
4.2.4.2. It was assumed that from the number of mmoles of BEDIDE and the number of mmoles of benzyl
83
chloride, the number of mmoles of chloromethane can be calculated. As the original amount of QAS with
methyl groups like BEDIDE in the vials is known and the amount of formed benzyl chloride is measured, the
formed amount of chloromethane in a vial can be calculated using formulae (1) and (2):
(
) (
) (1)
In which:
mmoles QAS left = mmoles of QAS that did not yield benzyl chloride
mQAS = total mass in mg of QAS in HS vial
MQAS = molecular mass of QAS
mBCl = mass (mg) of released benzyl chloride
MBCl = molecular mass of benzyl chloride
Using formula (1) the amount of QAS that can produce chloromethane is calculated enabling the
determination of the amount of chloromethane in a vial. Since one mole of QAS (even with more than one
methyl group) produces one mole of chloromethane:
(2)
mCM = mass (mg) of chloromethane
MCM = molecular mass of chloromethane
From these calculations and the peak areas measured for chloromethane, a calibration curve was
constructed.
4.2.4.4. Method validation
4.2.4.4.1. Linearity of the calibration curve
The generalized linearity depends on the combined response for benzyl chloride and chloromethane. For
both compounds a six point calibration curve was created and assessed.
4.2.4.4.2. Repeatability
Repeatability was expressed as RSD% value using at least 4 measurements.
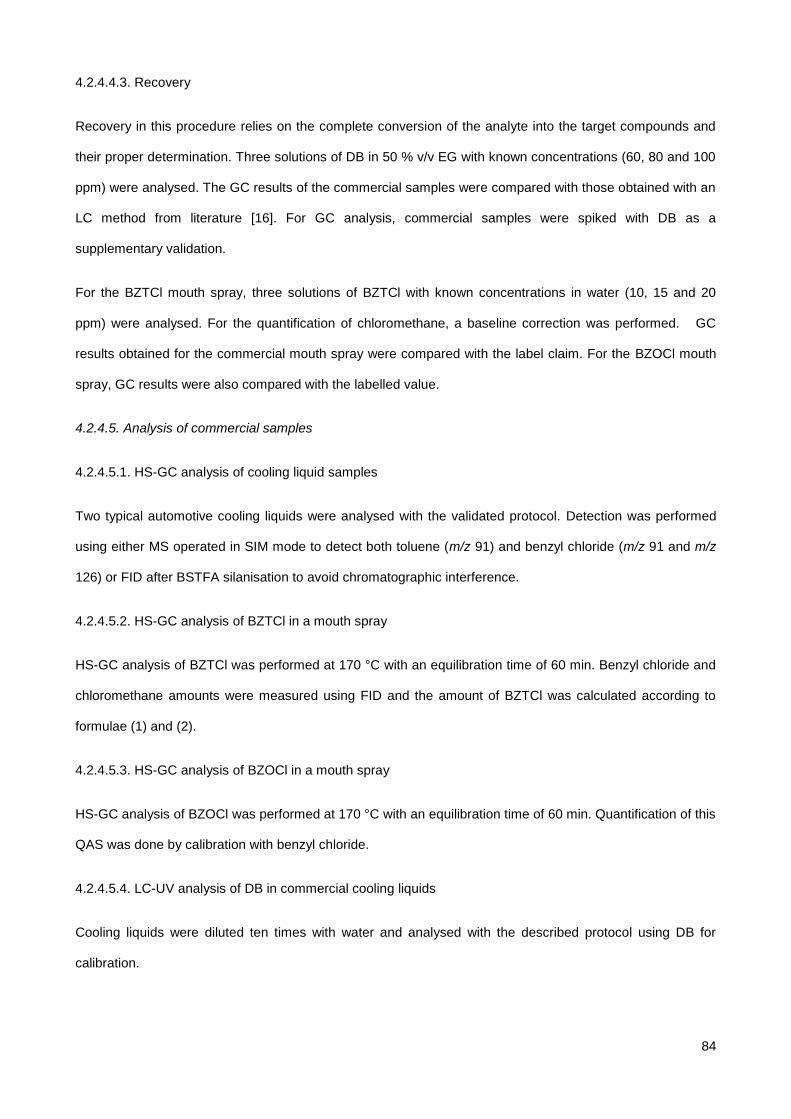
84
4.2.4.4.3. Recovery
Recovery in this procedure relies on the complete conversion of the analyte into the target compounds and
their proper determination. Three solutions of DB in 50 % v/v EG with known concentrations (60, 80 and 100
ppm) were analysed. The GC results of the commercial samples were compared with those obtained with an
LC method from literature [16]. For GC analysis, commercial samples were spiked with DB as a
supplementary validation.
For the BZTCl mouth spray, three solutions of BZTCl with known concentrations in water (10, 15 and 20
ppm) were analysed. For the quantification of chloromethane, a baseline correction was performed. GC
results obtained for the commercial mouth spray were compared with the label claim. For the BZOCl mouth
spray, GC results were also compared with the labelled value.
4.2.4.5. Analysis of commercial samples
4.2.4.5.1. HS-GC analysis of cooling liquid samples
Two typical automotive cooling liquids were analysed with the validated protocol. Detection was performed
using either MS operated in SIM mode to detect both toluene (m/z 91) and benzyl chloride (m/z 91 and m/z
126) or FID after BSTFA silanisation to avoid chromatographic interference.
4.2.4.5.2. HS-GC analysis of BZTCl in a mouth spray
HS-GC analysis of BZTCl was performed at 170 °C with an equilibration time of 60 min. Benzyl chloride and
chloromethane amounts were measured using FID and the amount of BZTCl was calculated according to
formulae (1) and (2).
4.2.4.5.3. HS-GC analysis of BZOCl in a mouth spray
HS-GC analysis of BZOCl was performed at 170 °C with an equilibration time of 60 min. Quantification of this
QAS was done by calibration with benzyl chloride.
4.2.4.5.4. LC-UV analysis of DB in commercial cooling liquids
Cooling liquids were diluted ten times with water and analysed with the described protocol using DB for
calibration.
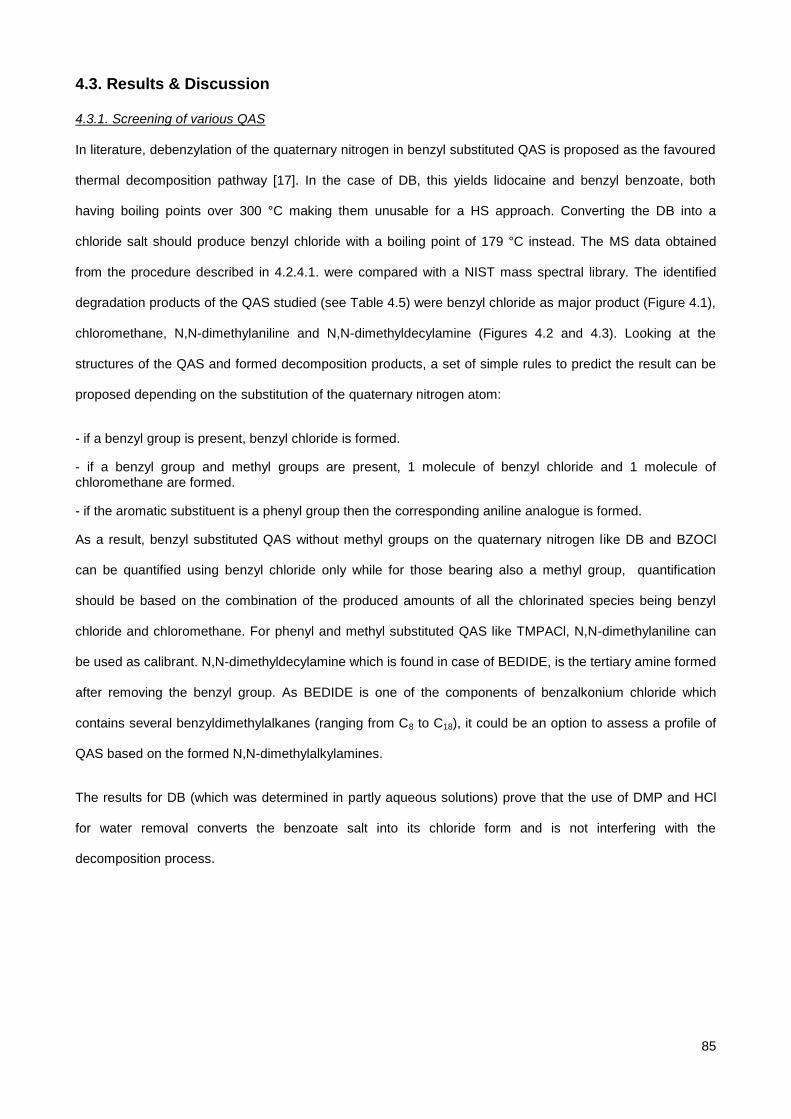
85
4.3. Results & Discussion
4.3.1. Screening of various QAS
In literature, debenzylation of the quaternary nitrogen in benzyl substituted QAS is proposed as the favoured
thermal decomposition pathway [17]. In the case of DB, this yields lidocaine and benzyl benzoate, both
having boiling points over 300 °C making them unusable for a HS approach. Converting the DB into a
chloride salt should produce benzyl chloride with a boiling point of 179 °C instead. The MS data obtained
from the procedure described in 4.2.4.1. were compared with a NIST mass spectral library. The identified
degradation products of the QAS studied (see Table 4.5) were benzyl chloride as major product (Figure 4.1),
chloromethane, N,N-dimethylaniline and N,N-dimethyldecylamine (Figures 4.2 and 4.3). Looking at the
structures of the QAS and formed decomposition products, a set of simple rules to predict the result can be
proposed depending on the substitution of the quaternary nitrogen atom:
- if a benzyl group is present, benzyl chloride is formed.
- if a benzyl group and methyl groups are present, 1 molecule of benzyl chloride and 1 molecule of chloromethane are formed.
- if the aromatic substituent is a phenyl group then the corresponding aniline analogue is formed.
As a result, benzyl substituted QAS without methyl groups on the quaternary nitrogen like DB and BZOCl
can be quantified using benzyl chloride only while for those bearing also a methyl group, quantification
should be based on the combination of the produced amounts of all the chlorinated species being benzyl
chloride and chloromethane. For phenyl and methyl substituted QAS like TMPACl, N,N-dimethylaniline can
be used as calibrant. N,N-dimethyldecylamine which is found in case of BEDIDE, is the tertiary amine formed
after removing the benzyl group. As BEDIDE is one of the components of benzalkonium chloride which
contains several benzyldimethylalkanes (ranging from C8 to C18), it could be an option to assess a profile of
QAS based on the formed N,N-dimethylalkylamines.
The results for DB (which was determined in partly aqueous solutions) prove that the use of DMP and HCl
for water removal converts the benzoate salt into its chloride form and is not interfering with the
decomposition process.
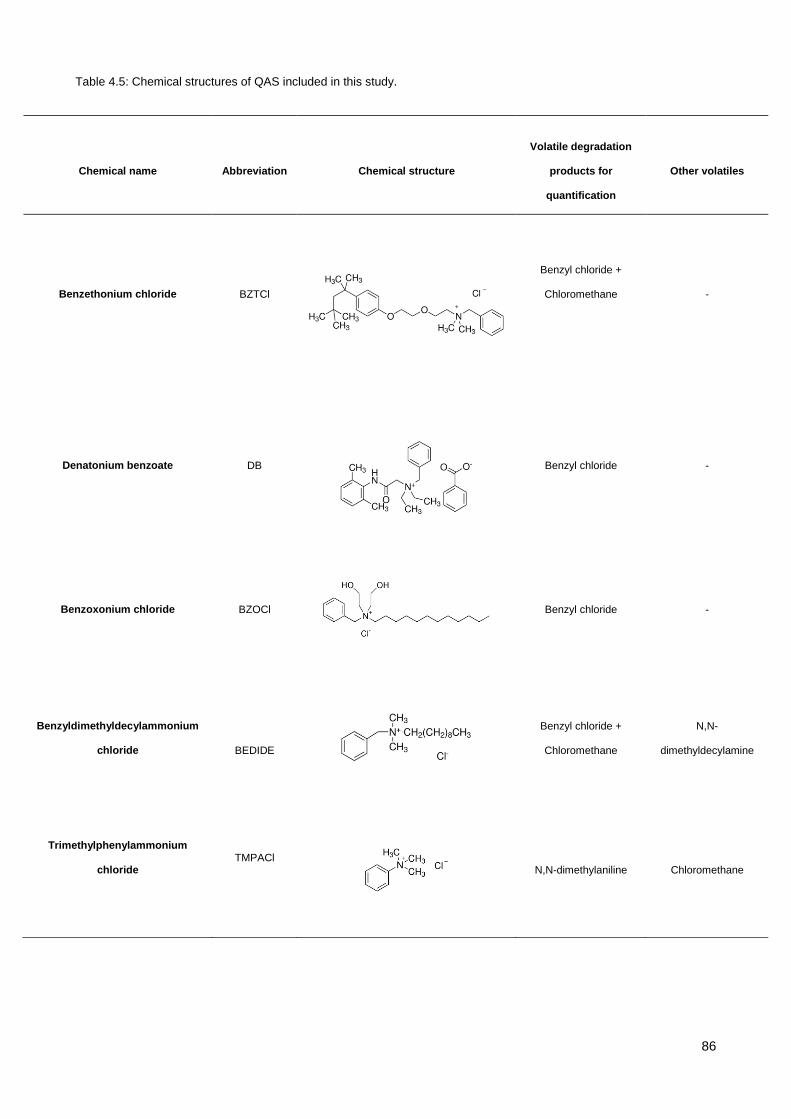
86
Table 4.5: Chemical structures of QAS included in this study.
Chemical name
Abbreviation
Chemical structure
Volatile degradation
products for
quantification
Other volatiles
Benzethonium chloride
BZTCl
Benzyl chloride +
Chloromethane
-
Denatonium benzoate
DB
Benzyl chloride -
Benzoxonium chloride BZOCl
Benzyl chloride -
Benzyldimethyldecylammonium
chloride
BEDIDE
Benzyl chloride +
Chloromethane
N,N-
dimethyldecylamine
Trimethylphenylammonium
chloride
TMPACl
N,N-dimethylaniline Chloromethane
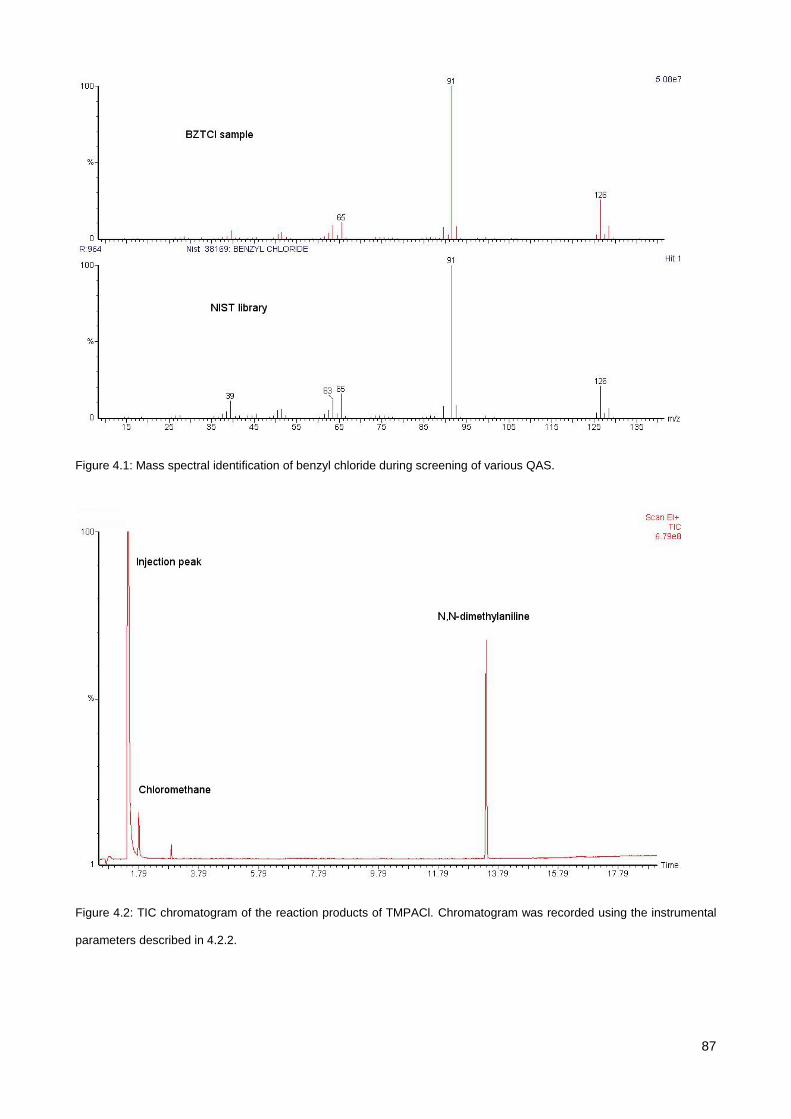
87
Figure 4.1: Mass spectral identification of benzyl chloride during screening of various QAS.
Figure 4.2: TIC chromatogram of the reaction products of TMPACl. Chromatogram was recorded using the instrumental
parameters described in 4.2.2.
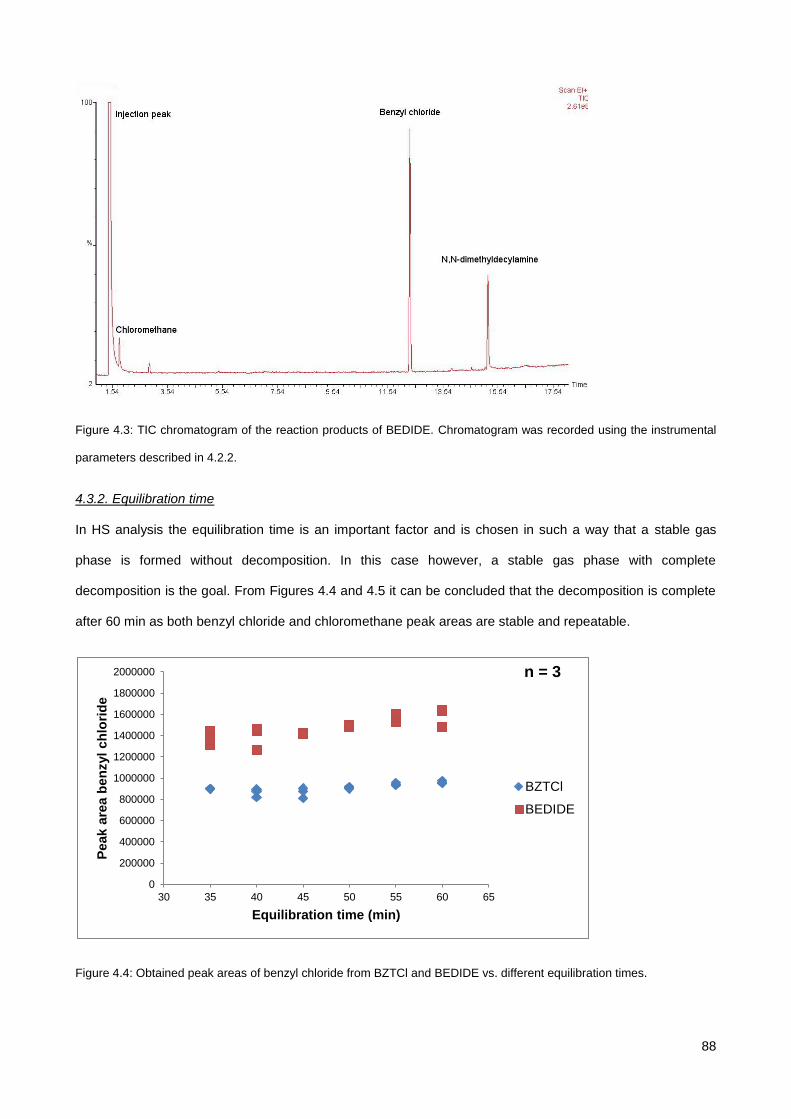
88
Figure 4.3: TIC chromatogram of the reaction products of BEDIDE. Chromatogram was recorded using the instrumental
parameters described in 4.2.2.
4.3.2. Equilibration time
In HS analysis the equilibration time is an important factor and is chosen in such a way that a stable gas
phase is formed without decomposition. In this case however, a stable gas phase with complete
decomposition is the goal. From Figures 4.4 and 4.5 it can be concluded that the decomposition is complete
after 60 min as both benzyl chloride and chloromethane peak areas are stable and repeatable.
Figure 4.4: Obtained peak areas of benzyl chloride from BZTCl and BEDIDE vs. different equilibration times.
0
200000
400000
600000
800000
1000000
1200000
1400000
1600000
1800000
2000000
30 35 40 45 50 55 60 65
Peak a
rea b
en
zyl
ch
lori
de
Equilibration time (min)
BZTCl
BEDIDE
n = 3
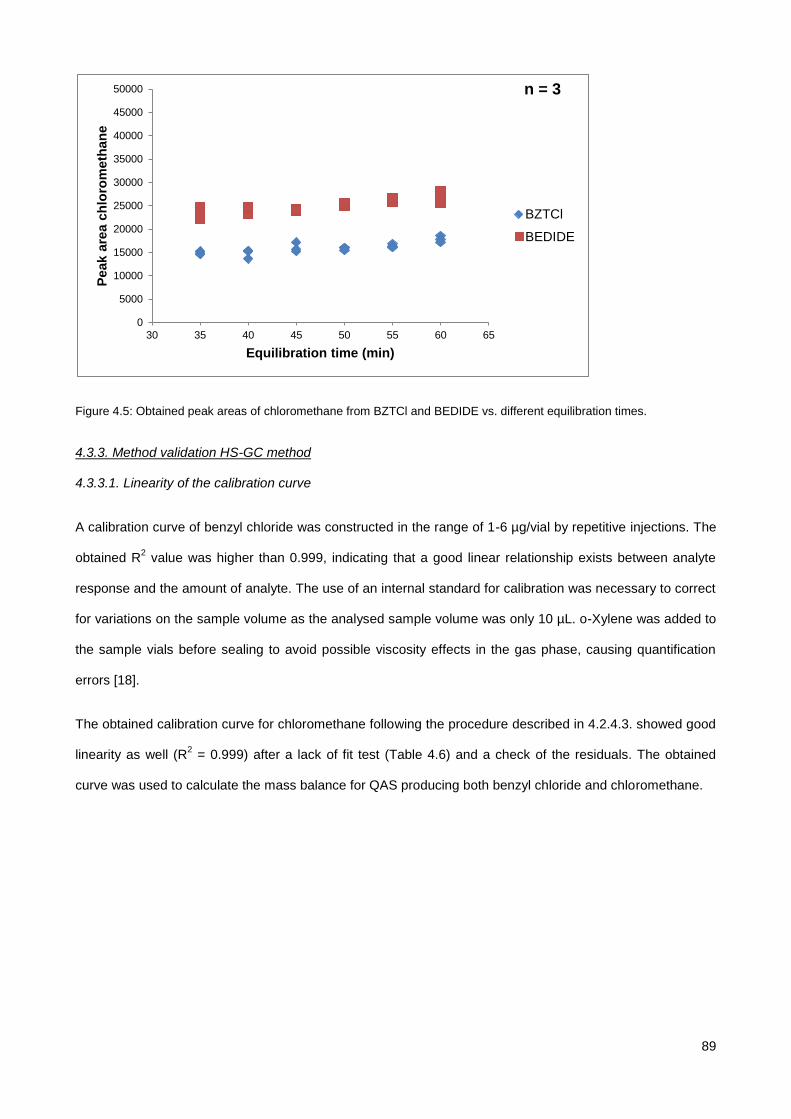
89
Figure 4.5: Obtained peak areas of chloromethane from BZTCl and BEDIDE vs. different equilibration times.
4.3.3. Method validation HS-GC method
4.3.3.1. Linearity of the calibration curve
A calibration curve of benzyl chloride was constructed in the range of 1-6 µg/vial by repetitive injections. The
obtained R2 value was higher than 0.999, indicating that a good linear relationship exists between analyte
response and the amount of analyte. The use of an internal standard for calibration was necessary to correct
for variations on the sample volume as the analysed sample volume was only 10 µL. o-Xylene was added to
the sample vials before sealing to avoid possible viscosity effects in the gas phase, causing quantification
errors [18].
The obtained calibration curve for chloromethane following the procedure described in 4.2.4.3. showed good
linearity as well (R2 = 0.999) after a lack of fit test (Table 4.6) and a check of the residuals. The obtained
curve was used to calculate the mass balance for QAS producing both benzyl chloride and chloromethane.
0
5000
10000
15000
20000
25000
30000
35000
40000
45000
50000
30 35 40 45 50 55 60 65
Peak a
rea c
hlo
rom
eth
an
e
Equilibration time (min)
BZTCl
BEDIDE
n = 3
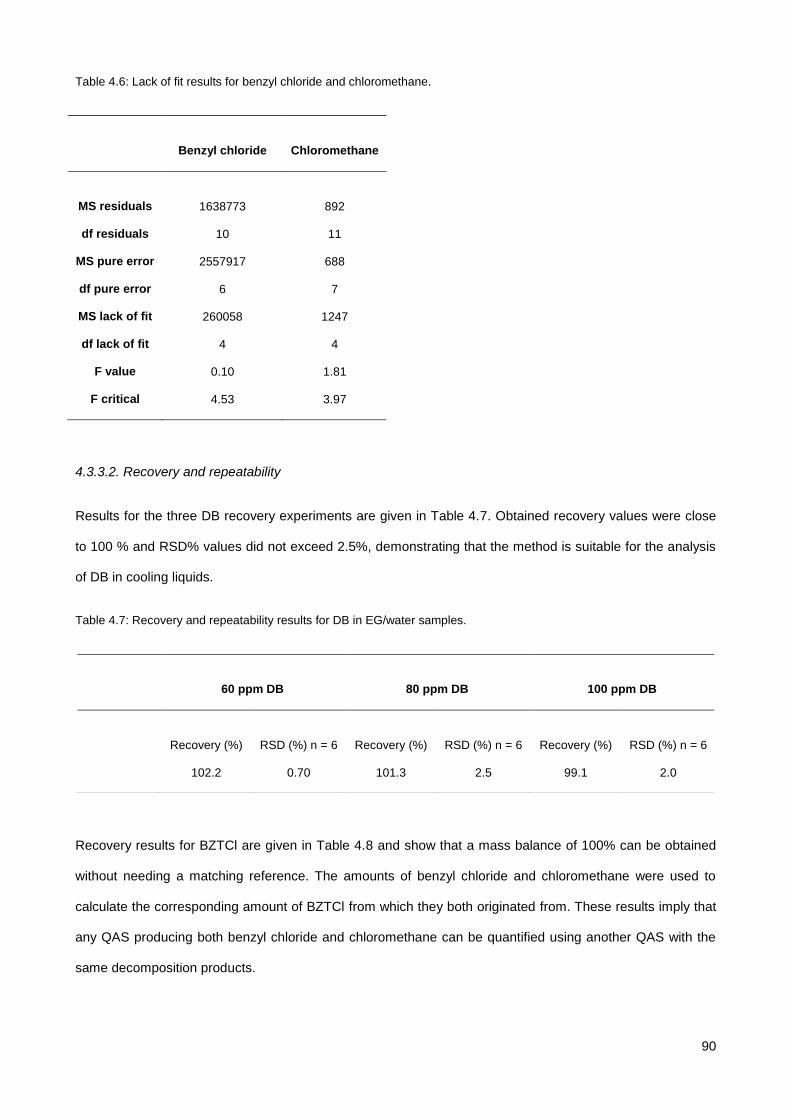
90
Table 4.6: Lack of fit results for benzyl chloride and chloromethane.
Benzyl chloride
Chloromethane
MS residuals
1638773
892
df residuals 10 11
MS pure error 2557917 688
df pure error 6 7
MS lack of fit 260058 1247
df lack of fit 4 4
F value 0.10 1.81
F critical 4.53 3.97
4.3.3.2. Recovery and repeatability
Results for the three DB recovery experiments are given in Table 4.7. Obtained recovery values were close
to 100 % and RSD% values did not exceed 2.5%, demonstrating that the method is suitable for the analysis
of DB in cooling liquids.
Table 4.7: Recovery and repeatability results for DB in EG/water samples.
Recovery results for BZTCl are given in Table 4.8 and show that a mass balance of 100% can be obtained
without needing a matching reference. The amounts of benzyl chloride and chloromethane were used to
calculate the corresponding amount of BZTCl from which they both originated from. These results imply that
any QAS producing both benzyl chloride and chloromethane can be quantified using another QAS with the
same decomposition products.
60 ppm DB
80 ppm DB
100 ppm DB
Recovery (%)
RSD (%) n = 6
Recovery (%)
RSD (%) n = 6
Recovery (%)
RSD (%) n = 6
102.2 0.70 101.3 2.5 99.1 2.0
91
Table 4.8: Recovery and repeatability results for BZTCl (as sum of benzyl chloride and chloromethane) in aqueous
samples.
4.3.4. Analysis of DB in commercial cooling liquid samples
Two cooling liquid samples consisting mainly of water and EG (with some glycerol and anti-corrosive agents
added) were analysed with the method described in 4.2.3.1.5. HCl was added as catalyst in the DMP
reaction, but also to ensure complete conversion of DB into its chloride form. After evaporation of the
solvents, another aliquot of 1.0 mL DMP was added to ensure the complete conversion of EG to 2,2-
dimethyl-1,3-dioxolane [15]. Analysis of the samples resulted in very complex chromatograms (Figure 4.6).
The benzyl chloride peak is situated around 12.3 min on the tail of a much bigger peak which was identified
using the NIST library as 2,2-dimethyl-1,3-dioxolane-4-methanol. This compound is the reaction product of
DMP and glycerol. The latter is often added to cooling liquids. Further evaluation of the MS-data revealed
that another compound co-eluted with benzyl chloride.
The MS spectrum of the co-eluting compound with a molecular mass of 145 Da and its comparison with the
NIST library is given in Figure 4.7. It is proposed to be 1-(2,2-dimethyl[1,3]dioxan-4-yl)ethanol.
10 ppm BZTCl
15 ppm BZTCl
20 ppm BZTCl
Recovery (%)
RSD (%) n = 4
Recovery (%)
RSD (%) n = 4
Recovery (%)
RSD (%) n = 4
99.7 6.9 100.5 4.3 102.6 5.3
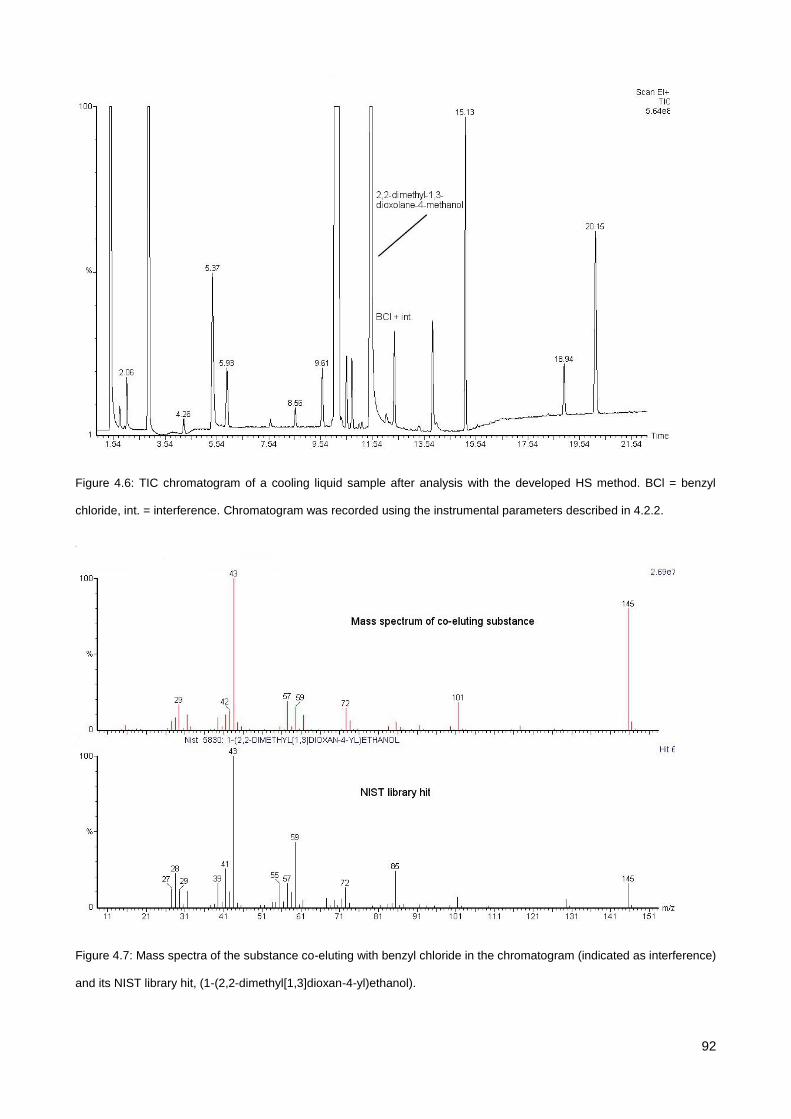
92
Figure 4.6: TIC chromatogram of a cooling liquid sample after analysis with the developed HS method. BCl = benzyl
chloride, int. = interference. Chromatogram was recorded using the instrumental parameters described in 4.2.2.
Figure 4.7: Mass spectra of the substance co-eluting with benzyl chloride in the chromatogram (indicated as interference)
and its NIST library hit, (1-(2,2-dimethyl[1,3]dioxan-4-yl)ethanol).
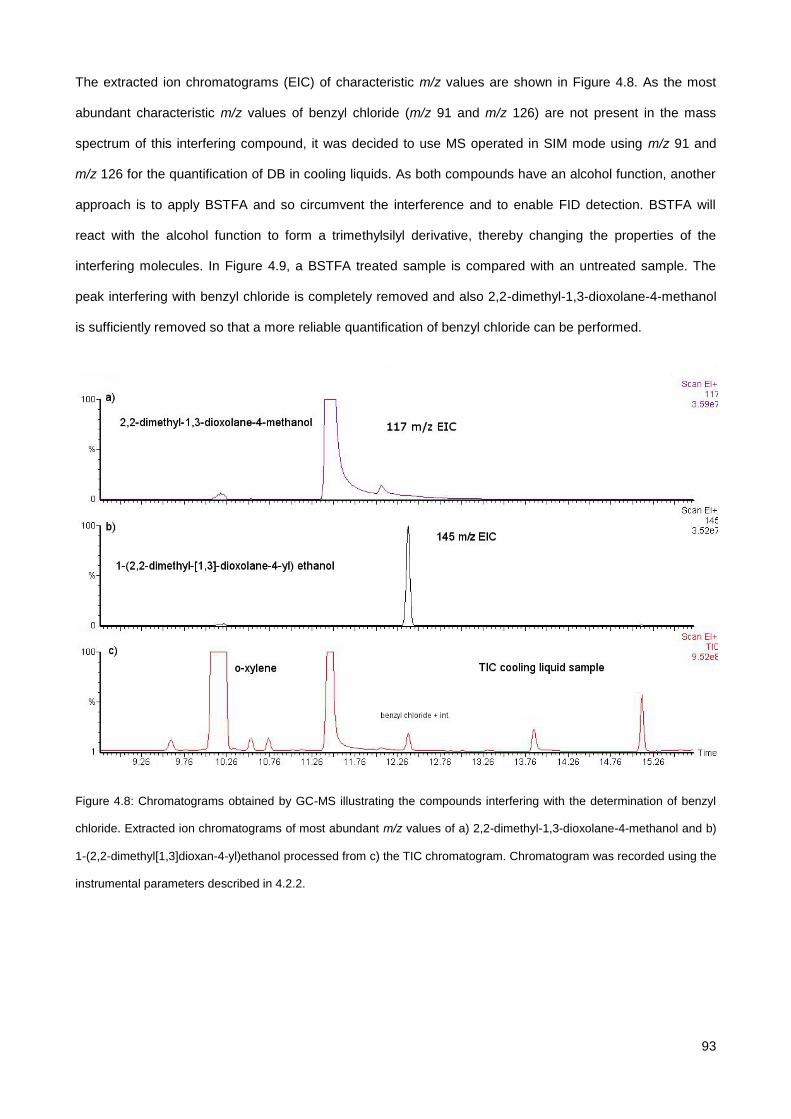
93
The extracted ion chromatograms (EIC) of characteristic m/z values are shown in Figure 4.8. As the most
abundant characteristic m/z values of benzyl chloride (m/z 91 and m/z 126) are not present in the mass
spectrum of this interfering compound, it was decided to use MS operated in SIM mode using m/z 91 and
m/z 126 for the quantification of DB in cooling liquids. As both compounds have an alcohol function, another
approach is to apply BSTFA and so circumvent the interference and to enable FID detection. BSTFA will
react with the alcohol function to form a trimethylsilyl derivative, thereby changing the properties of the
interfering molecules. In Figure 4.9, a BSTFA treated sample is compared with an untreated sample. The
peak interfering with benzyl chloride is completely removed and also 2,2-dimethyl-1,3-dioxolane-4-methanol
is sufficiently removed so that a more reliable quantification of benzyl chloride can be performed.
Figure 4.8: Chromatograms obtained by GC-MS illustrating the compounds interfering with the determination of benzyl
chloride. Extracted ion chromatograms of most abundant m/z values of a) 2,2-dimethyl-1,3-dioxolane-4-methanol and b)
1-(2,2-dimethyl[1,3]dioxan-4-yl)ethanol processed from c) the TIC chromatogram. Chromatogram was recorded using the
instrumental parameters described in 4.2.2.
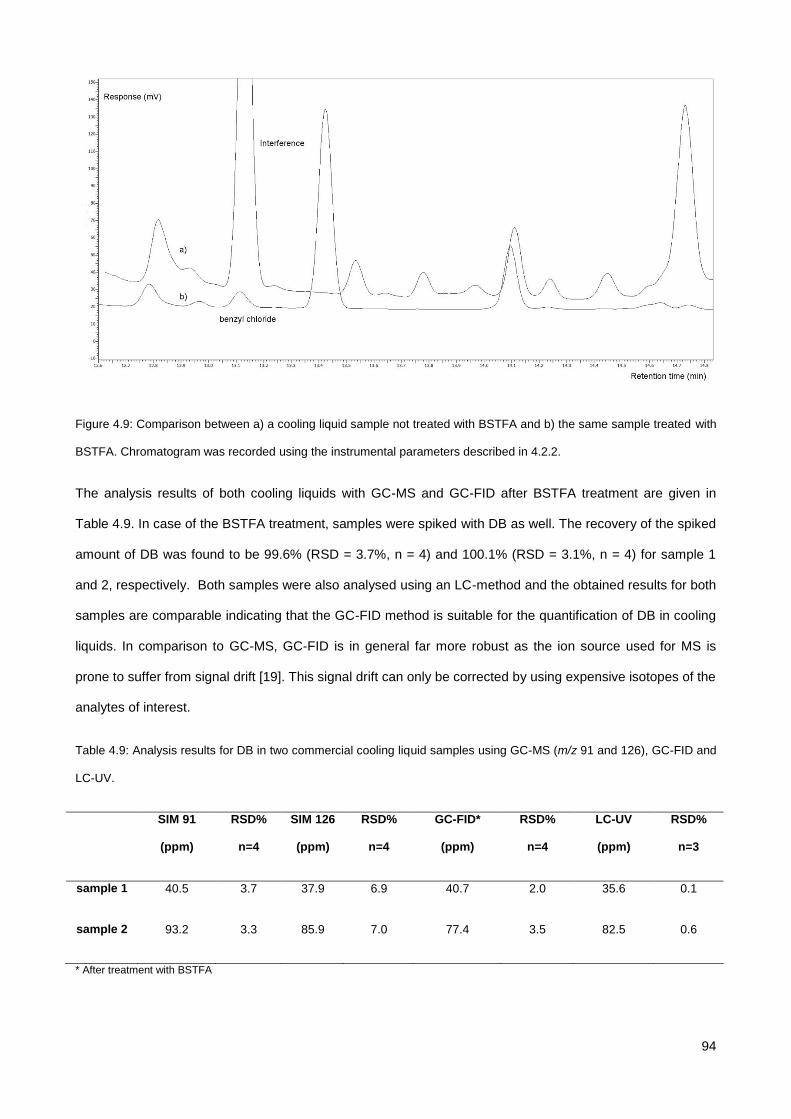
94
Figure 4.9: Comparison between a) a cooling liquid sample not treated with BSTFA and b) the same sample treated with
BSTFA. Chromatogram was recorded using the instrumental parameters described in 4.2.2.
The analysis results of both cooling liquids with GC-MS and GC-FID after BSTFA treatment are given in
Table 4.9. In case of the BSTFA treatment, samples were spiked with DB as well. The recovery of the spiked
amount of DB was found to be 99.6% (RSD = 3.7%, n = 4) and 100.1% (RSD = 3.1%, n = 4) for sample 1
and 2, respectively. Both samples were also analysed using an LC-method and the obtained results for both
samples are comparable indicating that the GC-FID method is suitable for the quantification of DB in cooling
liquids. In comparison to GC-MS, GC-FID is in general far more robust as the ion source used for MS is
prone to suffer from signal drift [19]. This signal drift can only be corrected by using expensive isotopes of the
analytes of interest.
Table 4.9: Analysis results for DB in two commercial cooling liquid samples using GC-MS (m/z 91 and 126), GC-FID and
LC-UV.
SIM 91
(ppm)
RSD%
n=4
SIM 126
(ppm)
RSD%
n=4
GC-FID*
(ppm)
RSD%
n=4
LC-UV
(ppm)
RSD%
n=3
sample 1 40.5 3.7 37.9 6.9 40.7 2.0 35.6 0.1
sample 2 93.2 3.3 85.9 7.0 77.4 3.5 82.5 0.6
* After treatment with BSTFA
95
4.3.5. Analysis of BZTCl in a mouth spray
Analysis and quantification of the sample was performed by the procedure described in 4.2.4.5.2. The
concentration of BZTCl in the mouth spray was found to be 438 ppm (RSD = 3.7%, n = 6). This analysis
result corresponds to 100.7% of the labelled value.
4.3.6. Analysis of BZOCl in a mouth spray
As with the commercial cooling liquids, the same interfering peak was also seen here with GC-MS.
Therefore, 100 µL of BSTFA was added to the sample vial after solvent evaporation to silanise the interfering
compound with the alcohol function. Samples were evaporated to dryness again. The concentration of
BZOCl was found to be 2010 ppm (RSD = 1.6%, n = 6), which is about the same as the label claim (0.2%) of
the mouth spray. This is an indication that the method has an adequate recovery towards BZOCl.
4.4. Conclusions
From the obtained results it can be concluded that the use of HS-GC is an excellent tool to quantify several
aromatic substituted QAS by calibration with the most abundant volatiles that are released after heating of a
sample in a HS vial. In contrast to pyrolysis methods in which samples are introduced directly in a hot
injection liner, this approach offers a clean way of sample introduction. After screening of several QAS, it was
revealed that all benzyl substituted QAS released benzyl chloride as the major volatile product when chloride
was the anion of the salt. Even when a particular QAS produces multiple volatiles, reliable quantification is
still possible. It has been demonstrated for QAS that produce benzyl chloride and chloromethane, the mass
balance is close to 100%. This means that it is possible to quantify all QAS that produce benzyl chloride and
chloromethane without the need of having a matching reference standard. This is an important advantage
towards LC or CE methodologies in which matching reference standards are necessary for quantification. In
combination with an in-vial water scavenging procedure, a powerful GC method for the analysis of QAS in
aqueous samples is established. The method was validated for the analysis of DB in cooling liquids during
which adequate recovery values (99.1 - 102.2%) were obtained with RSD values not exceeding 2.5%.
Obtained R2 values were always equal to or larger than 0.999.
Finally, the methodology was applied to
commercial cooling liquid samples and the analysis of BZTCl and BZOCl in mouth sprays. For the cooling
liquid samples and the BZOCl mouth spray, an interference that appeared to be an alcohol-like molecule,
made accurate analysis impossible at first instance. Silanisation of the sample after DMP treatment removed
this interference and enabled analysis of the samples. An advantage is also that all reactions can be
performed in one HS vial.
96
4.5. References
[1] M.J. Ford, L.W. Tetler, J. White, D. Rimmer, Determination of alkyl benzyl and dialkyl dimethyl quaternary
ammonium biocides in occupational hygiene and environmental media by liquid chromatography with
electrospray ionisation mass spectrometry and tandem mass spectrometry, J. Chromatogr. A, 952 (2002)
165-172
[2] E.N.M. Ho, W.H. Kwok, A.S.Y. Wong, T.S.M. Wan, Detection of singly- and doubly-charged quaternary
ammonium drugs in equine urine by liquid chromatography/tandem mass spectrometry, Anal. Chim. Acta,
710 (2012) 94-101
[3] K.C.H. Yiu, E.N.M. Ho, T.S.M. Wan, Detection of quaternary ammonium drugs in equine urine by liquid
chromatography-mass spectrometry, Chromatographia, 59 (2004) 56-50
[4] X. Li, B.J. Brownwell, Analysis of quaternary ammonium compounds in estuarine sediments by LC-ToF-
MS: Very high positive mass defects of alkylamine ions as powerful diagnostic tools for identification and
structural elucidation, Anal. Chem., 81 (2009) 7926-7935
[5] I. Ferrer, E.T. Furlong, Accelerated solvent extraction followed by on-line solid-phase extraction coupled
to ion trap LC/MS/MS for analysis of benzalkonium chlorides in sediment samples, Anal. Chem., 74 (2002)
1275-1280
[6] M.M. Ariffin, R.A. Anderson, LC/MS/MS analysis of quaternary ammonium drugs and herbicides in whole
blood, J. Chromatogr. B, 842 (2006) 91-97
[7] R. Castro, E. Moyano, M.T. Galceran, Determination of quaternary ammonium pesticides by liquid
chromatography-electrospray tandem mass spectrometry, J. Chromatogr. A, 914 (2001) 111-121
[8] R. Castro, E. Moyano, M.T. Galceran, On-line ion-pair solid-phase extraction-liquid chromatrography-
mass spectrometry for the analysis of quaternary ammonium herbicides, J. Chromatogr. A, 869 (2000) 441-
449
[9] P. Bassarab, D. Williams, J.R. Dean, E. Ludkin, J.J. Perry, Determination of quaternary ammonium
compounds in seawater samples by solid-phase extraction and liquid chromatography-mass spectrometry, J.
Chromatogr. A, 1318 (2011) 673-677
97
[10] O. Núñez, E. Moyano, M.T. Galceran, Solid-phase extraction and sample stacking-capillary
electrophoresis for the determination of quaternary ammonium herbicides in drinking water, J. Chromatogr.
A, 946 (2002) 275-282
[11] O. Núñez, E. Moyano, M.T. Galceran, Capillary electrophoresis-mass spectrometry for the analysis of
quaternary ammonium herbicides, J. Chromatogr. A, 974 (2002) 243-255
[12] F.P.W. Tang, G.N.W. Leung, T.S.M. Wan, Analysis of quaternary ammonium drugs in horse urine by
capillary electrophoresis – mass spectrometry, Electrophoresis, 22 (2001) 2201-2209
[13] W.J. Criddle, J. Thomas, Pyrolysis-gas chromatography of quaternary ammonium salts in aqueous
solution, J. Anal. Appl. Pyrol., 2 (1980) 361-365
[14] W.J. Criddle, A. Christofides, Pyrolysis-gas chromatography of model ‗‘all organic‘‘ quaternary
ammonium compounds in aqueous solution, J. Anal. Appl. Pyrol., 4 (1982) 163-173
[15] N. van Boxtel, K. Wolfs, A. Van Schepdael, E. Adams, Application of acetone acetals as water
scavengers and derivatization agents prior to the gas chromatogramphic analysis of polar residual solvents
in aqueous samples, J. Chromatogr. A, 1425 (2015) 62-72
[16] A. Faulkner, P. DeMontigny, High-performance liquid chromatographic determination of denatonium
benzoate in ethanol with 5% polyvinylpyrrolidone, J. Chromatogr. A, 715 (1995) 189-194
[17] [6] L.K. Ng, M. Hupé, J. Harnois, A. H. Lawrence, Direct injection gas chromatographic/mass
spectrometric analysis for denatonium benzoate in specific denatured alcohol formulations, Anal. Chem., 70
(1998) 4389-4393
[18] D.M. Kialengila, K. Wolfs, J. Bugalama, A. Van Schepdael, E. Adams, Full evaporation headspace gas
chromatography for sensitive determination of high boiling point volatile organic compounds in low boiling
matrices, J. Chromatogr. A, 1315 (2013) 167-175
[19] W. D‘Autry, K. Wolfs, S. Yarramraju, A. Van Schepdael, J. Hoogmartens, E. Adams, Chararacterization
and improvement of signal drift associated with electron ionization quadrupole mass spectrometry, Anal.
Chem., 82 (2010) 6480-6486

98
99
Chapter 5 - Development and characterization of an atmospheric micro cavity
hollow cathode discharge based GC-detector
Niels van Boxtel, Kris Wolfs, Ward D‘Autry, Ann Van Schepdael, Erwin Adams
Pharmaceutical Analysis, Department of Pharmaceutical and Pharmacological Sciences
KU Leuven, Leuven, Belgium
Anal. Chem, to be submitted

100
101
Abstract
Gas chromatography (GC) can be combined with many different types of both universal and selective
detectors to cover a large range of volatile analytes. The majority of detectors relies on the ionization of the
analyte to enable detection. Although they earned their praise in many different analytical fields, there is still
plenty of room for improvement related to their ion source.
In this work, the application of a micro cavity hollow cathode discharge (µCHCD) plasma as ion source in
combination with an ion capture electrode as a simple, versatile GC detector is investigated. The developed
low power consuming µCHCD ion source can be operated at atmospheric pressure as predicted by theory
using only one type of gas. It was found that the detector geometry (consisting of the hollow cathode,
dielectric spacer, anode and capture electrode) was of great importance for the obtained signal. By making
sure that the cathode-anode clearance angle is large enough, quantitative response with sensitivity in the
lower picogram range was obtained for a variety of analytes. Depending on the chemical properties of the
analyte, different ionization mechanisms may occur. For the non-halogenated analytes included in this work,
these are most likely photo-ionization or ionization by collision with helium metastables. Halogenated
analytes included in this study (carbon tetrachloride (CCl4) and trichloroethylene (TCE)) seemed to follow an
electron capture mechanism, generating negative ions in the electron rich µCHCD plasma. Actual detection
of ionized analytes was performed by either a negatively biased or positively biased capture electrode to
differentiate between positive and negative ions, respectively.
Keywords
Gas detection, microplasma, microhollow cathode discharge
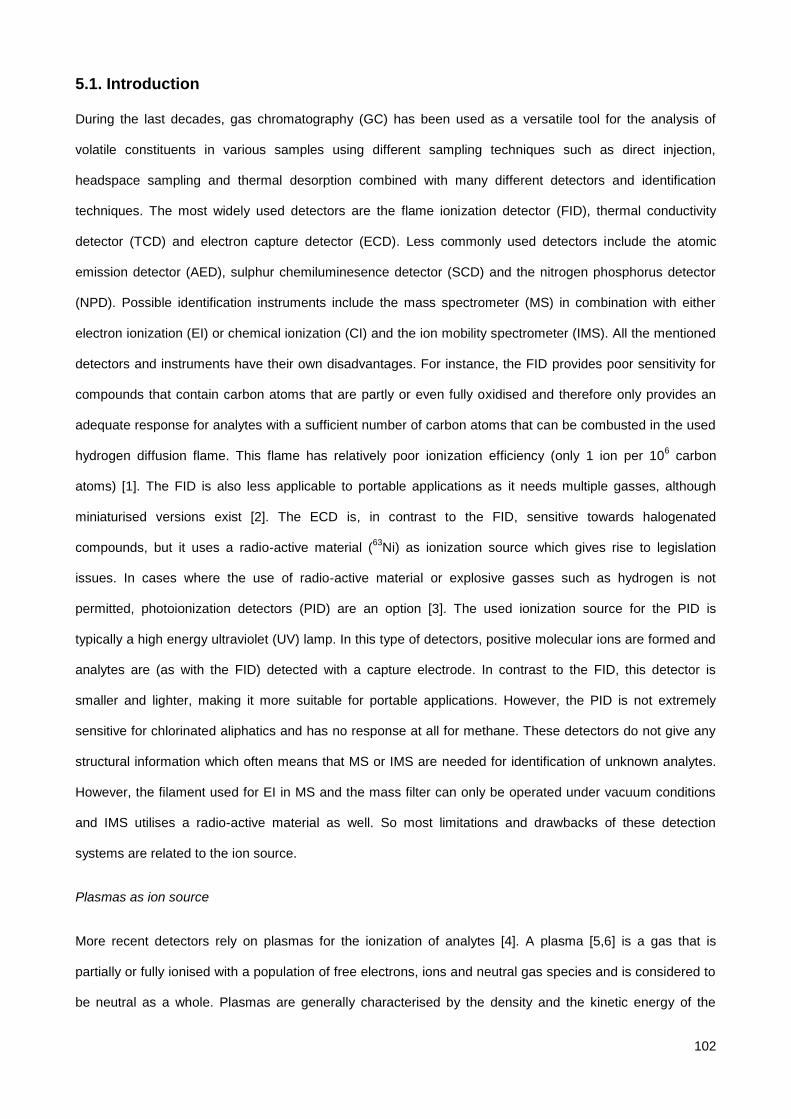
102
5.1. Introduction
During the last decades, gas chromatography (GC) has been used as a versatile tool for the analysis of
volatile constituents in various samples using different sampling techniques such as direct injection,
headspace sampling and thermal desorption combined with many different detectors and identification
techniques. The most widely used detectors are the flame ionization detector (FID), thermal conductivity
detector (TCD) and electron capture detector (ECD). Less commonly used detectors include the atomic
emission detector (AED), sulphur chemiluminesence detector (SCD) and the nitrogen phosphorus detector
(NPD). Possible identification instruments include the mass spectrometer (MS) in combination with either
electron ionization (EI) or chemical ionization (CI) and the ion mobility spectrometer (IMS). All the mentioned
detectors and instruments have their own disadvantages. For instance, the FID provides poor sensitivity for
compounds that contain carbon atoms that are partly or even fully oxidised and therefore only provides an
adequate response for analytes with a sufficient number of carbon atoms that can be combusted in the used
hydrogen diffusion flame. This flame has relatively poor ionization efficiency (only 1 ion per 106 carbon
atoms) [1]. The FID is also less applicable to portable applications as it needs multiple gasses, although
miniaturised versions exist [2]. The ECD is, in contrast to the FID, sensitive towards halogenated
compounds, but it uses a radio-active material (63
Ni) as ionization source which gives rise to legislation
issues. In cases where the use of radio-active material or explosive gasses such as hydrogen is not
permitted, photoionization detectors (PID) are an option [3]. The used ionization source for the PID is
typically a high energy ultraviolet (UV) lamp. In this type of detectors, positive molecular ions are formed and
analytes are (as with the FID) detected with a capture electrode. In contrast to the FID, this detector is
smaller and lighter, making it more suitable for portable applications. However, the PID is not extremely
sensitive for chlorinated aliphatics and has no response at all for methane. These detectors do not give any
structural information which often means that MS or IMS are needed for identification of unknown analytes.
However, the filament used for EI in MS and the mass filter can only be operated under vacuum conditions
and IMS utilises a radio-active material as well. So most limitations and drawbacks of these detection
systems are related to the ion source.
Plasmas as ion source
More recent detectors rely on plasmas for the ionization of analytes [4]. A plasma [5,6] is a gas that is
partially or fully ionised with a population of free electrons, ions and neutral gas species and is considered to
be neutral as a whole. Plasmas are generally characterised by the density and the kinetic energy of the
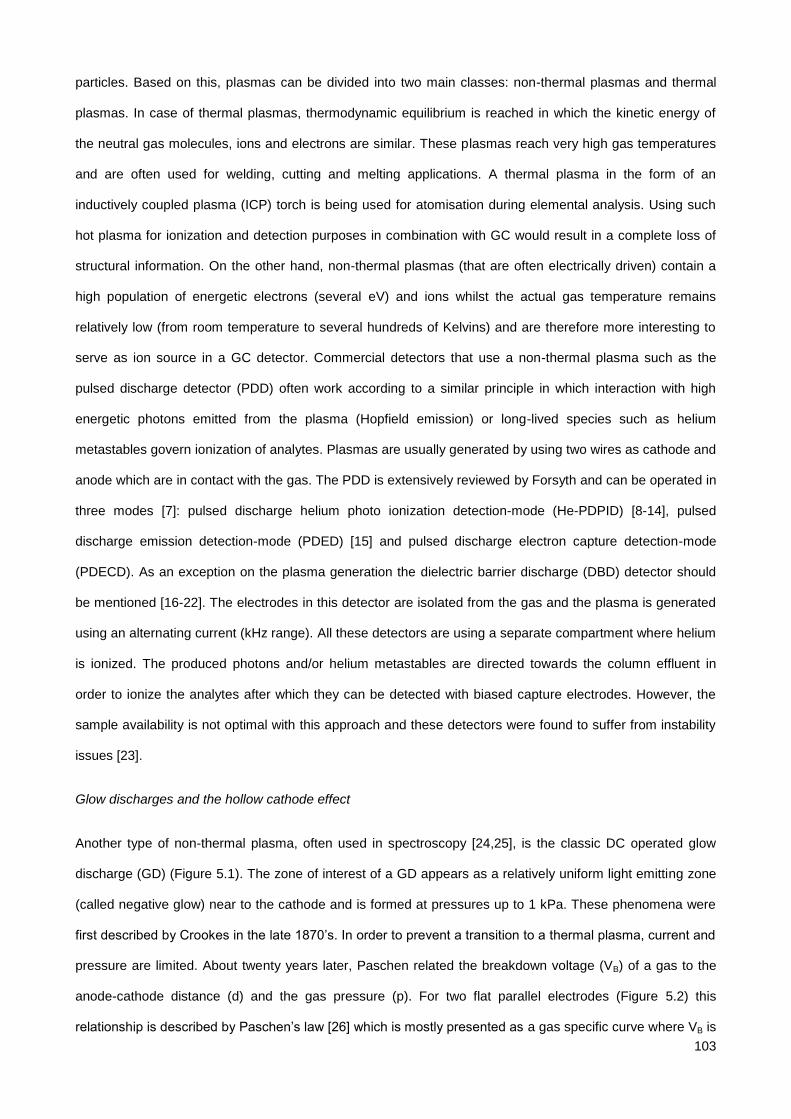
103
particles. Based on this, plasmas can be divided into two main classes: non-thermal plasmas and thermal
plasmas. In case of thermal plasmas, thermodynamic equilibrium is reached in which the kinetic energy of
the neutral gas molecules, ions and electrons are similar. These plasmas reach very high gas temperatures
and are often used for welding, cutting and melting applications. A thermal plasma in the form of an
inductively coupled plasma (ICP) torch is being used for atomisation during elemental analysis. Using such
hot plasma for ionization and detection purposes in combination with GC would result in a complete loss of
structural information. On the other hand, non-thermal plasmas (that are often electrically driven) contain a
high population of energetic electrons (several eV) and ions whilst the actual gas temperature remains
relatively low (from room temperature to several hundreds of Kelvins) and are therefore more interesting to
serve as ion source in a GC detector. Commercial detectors that use a non-thermal plasma such as the
pulsed discharge detector (PDD) often work according to a similar principle in which interaction with high
energetic photons emitted from the plasma (Hopfield emission) or long-lived species such as helium
metastables govern ionization of analytes. Plasmas are usually generated by using two wires as cathode and
anode which are in contact with the gas. The PDD is extensively reviewed by Forsyth and can be operated in
three modes [7]: pulsed discharge helium photo ionization detection-mode (He-PDPID) [8-14], pulsed
discharge emission detection-mode (PDED) [15] and pulsed discharge electron capture detection-mode
(PDECD). As an exception on the plasma generation the dielectric barrier discharge (DBD) detector should
be mentioned [16-22]. The electrodes in this detector are isolated from the gas and the plasma is generated
using an alternating current (kHz range). All these detectors are using a separate compartment where helium
is ionized. The produced photons and/or helium metastables are directed towards the column effluent in
order to ionize the analytes after which they can be detected with biased capture electrodes. However, the
sample availability is not optimal with this approach and these detectors were found to suffer from instability
issues [23].
Glow discharges and the hollow cathode effect
Another type of non-thermal plasma, often used in spectroscopy [24,25], is the classic DC operated glow
discharge (GD) (Figure 5.1). The zone of interest of a GD appears as a relatively uniform light emitting zone
(called negative glow) near to the cathode and is formed at pressures up to 1 kPa. These phenomena were
first described by Crookes in the late 1870‘s. In order to prevent a transition to a thermal plasma, current and
pressure are limited. About twenty years later, Paschen related the breakdown voltage (VB) of a gas to the
anode-cathode distance (d) and the gas pressure (p). For two flat parallel electrodes (Figure 5.2) this
relationship is described by Paschen‘s law [26] which is mostly presented as a gas specific curve where VB is
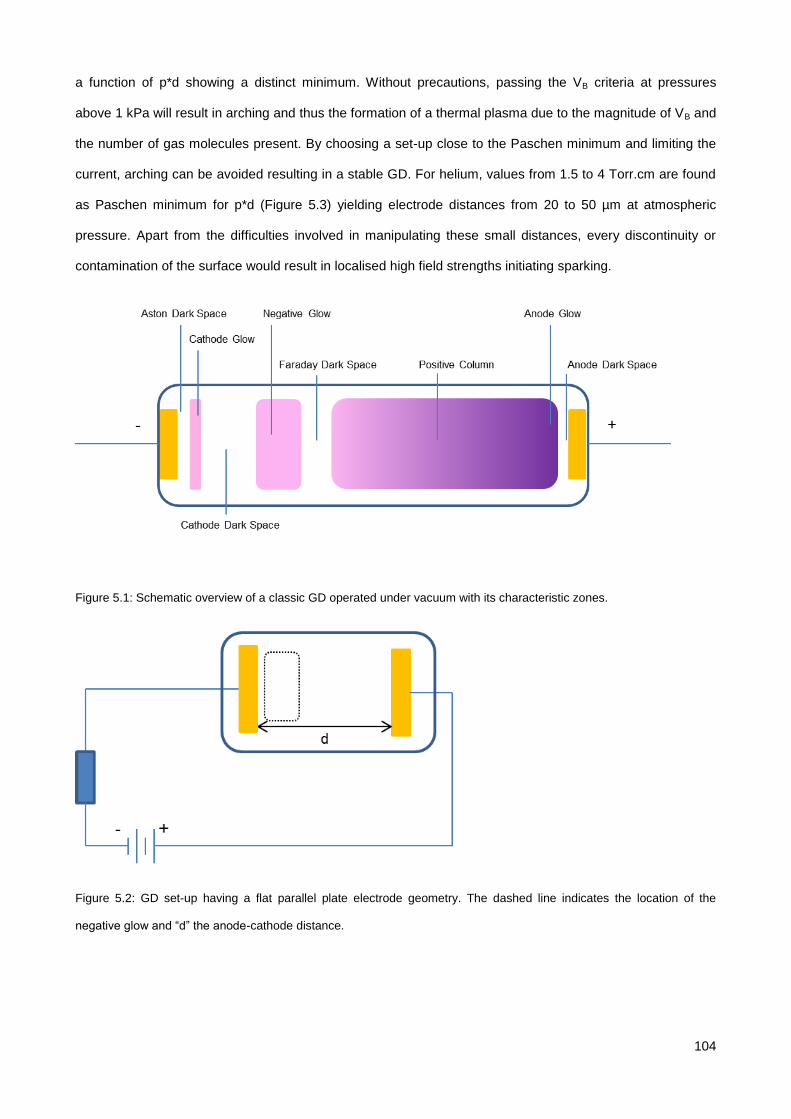
104
a function of p*d showing a distinct minimum. Without precautions, passing the VB criteria at pressures
above 1 kPa will result in arching and thus the formation of a thermal plasma due to the magnitude of VB and
the number of gas molecules present. By choosing a set-up close to the Paschen minimum and limiting the
current, arching can be avoided resulting in a stable GD. For helium, values from 1.5 to 4 Torr.cm are found
as Paschen minimum for p*d (Figure 5.3) yielding electrode distances from 20 to 50 µm at atmospheric
pressure. Apart from the difficulties involved in manipulating these small distances, every discontinuity or
contamination of the surface would result in localised high field strengths initiating sparking.
Figure 5.1: Schematic overview of a classic GD operated under vacuum with its characteristic zones.
Figure 5.2: GD set-up having a flat parallel plate electrode geometry. The dashed line indicates the location of the
negative glow and ―d‖ the anode-cathode distance.
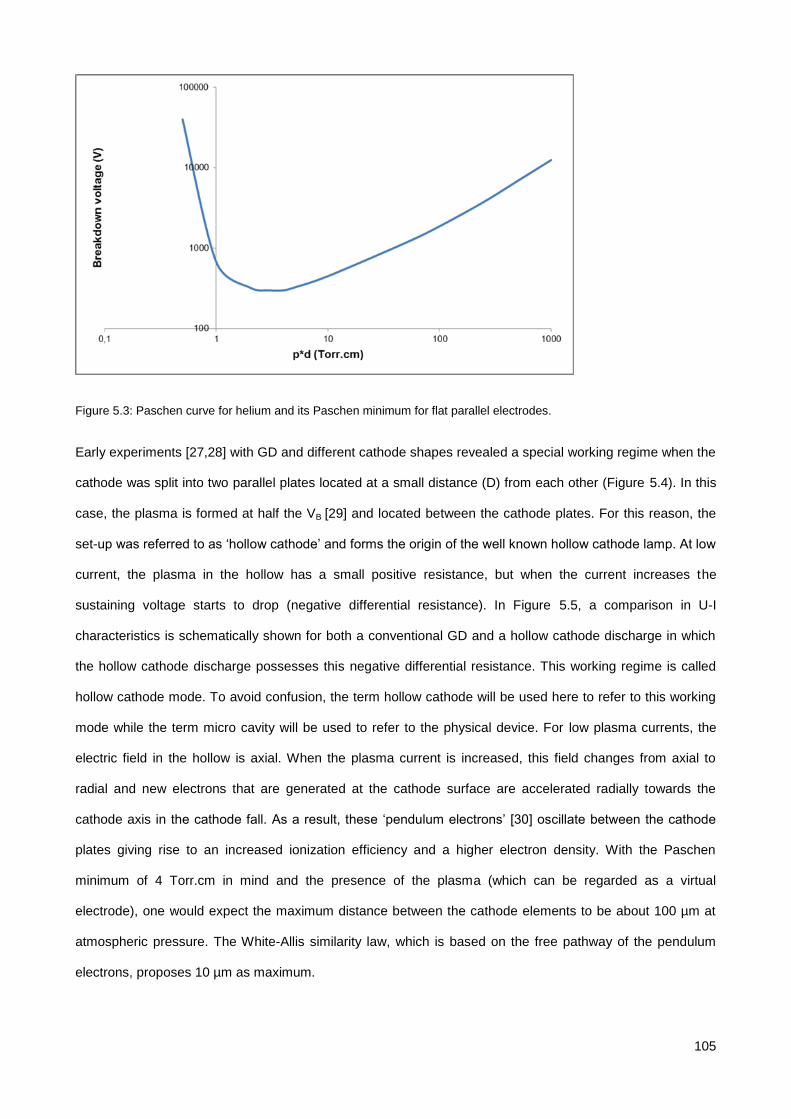
105
Figure 5.3: Paschen curve for helium and its Paschen minimum for flat parallel electrodes.
Early experiments [27,28] with GD and different cathode shapes revealed a special working regime when the
cathode was split into two parallel plates located at a small distance (D) from each other (Figure 5.4). In this
case, the plasma is formed at half the VB [29] and located between the cathode plates. For this reason, the
set-up was referred to as ‗hollow cathode‘ and forms the origin of the well known hollow cathode lamp. At low
current, the plasma in the hollow has a small positive resistance, but when the current increases the
sustaining voltage starts to drop (negative differential resistance). In Figure 5.5, a comparison in U-I
characteristics is schematically shown for both a conventional GD and a hollow cathode discharge in which
the hollow cathode discharge possesses this negative differential resistance. This working regime is called
hollow cathode mode. To avoid confusion, the term hollow cathode will be used here to refer to this working
mode while the term micro cavity will be used to refer to the physical device. For low plasma currents, the
electric field in the hollow is axial. When the plasma current is increased, this field changes from axial to
radial and new electrons that are generated at the cathode surface are accelerated radially towards the
cathode axis in the cathode fall. As a result, these ‗pendulum electrons‘ [30] oscillate between the cathode
plates giving rise to an increased ionization efficiency and a higher electron density. With the Paschen
minimum of 4 Torr.cm in mind and the presence of the plasma (which can be regarded as a virtual
electrode), one would expect the maximum distance between the cathode elements to be about 100 µm at
atmospheric pressure. The White-Allis similarity law, which is based on the free pathway of the pendulum
electrons, proposes 10 µm as maximum.
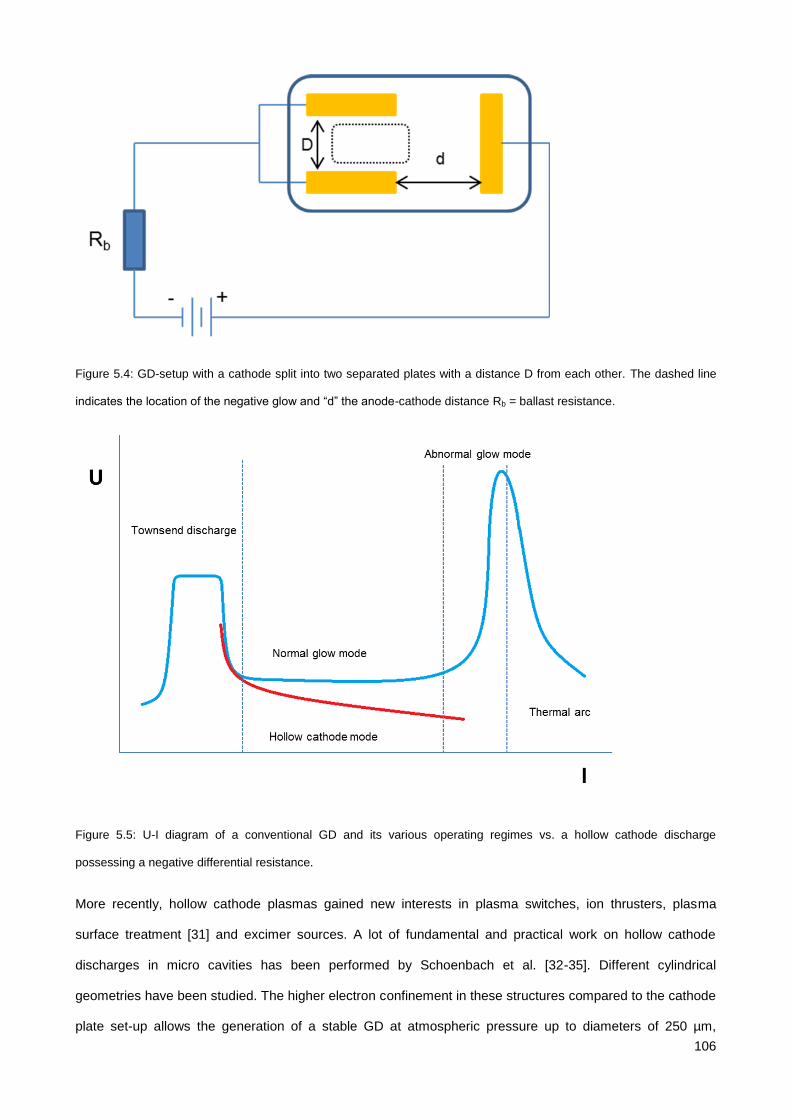
106
Figure 5.4: GD-setup with a cathode split into two separated plates with a distance D from each other. The dashed line
indicates the location of the negative glow and ―d‖ the anode-cathode distance Rb = ballast resistance.
Figure 5.5: U-I diagram of a conventional GD and its various operating regimes vs. a hollow cathode discharge
possessing a negative differential resistance.
More recently, hollow cathode plasmas gained new interests in plasma switches, ion thrusters, plasma
surface treatment [31] and excimer sources. A lot of fundamental and practical work on hollow cathode
discharges in micro cavities has been performed by Schoenbach et al. [32-35]. Different cylindrical
geometries have been studied. The higher electron confinement in these structures compared to the cathode
plate set-up allows the generation of a stable GD at atmospheric pressure up to diameters of 250 µm,
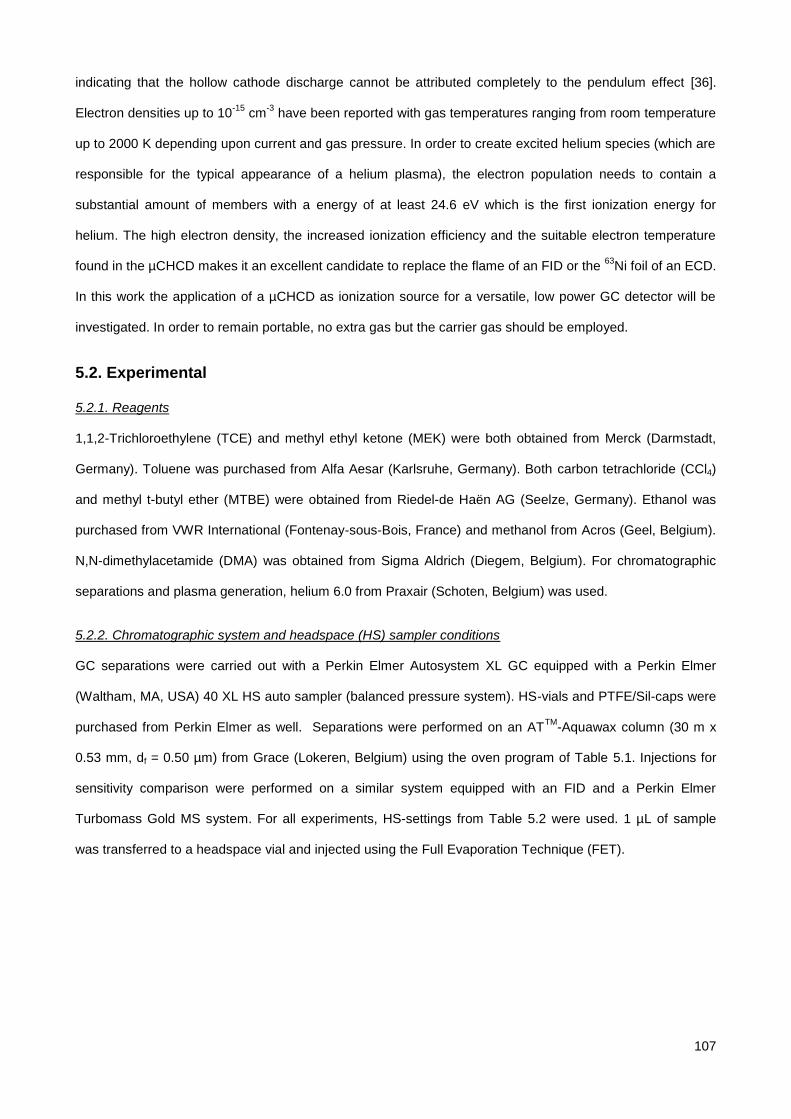
107
indicating that the hollow cathode discharge cannot be attributed completely to the pendulum effect [36].
Electron densities up to 10-15
cm-3
have been reported with gas temperatures ranging from room temperature
up to 2000 K depending upon current and gas pressure. In order to create excited helium species (which are
responsible for the typical appearance of a helium plasma), the electron population needs to contain a
substantial amount of members with a energy of at least 24.6 eV which is the first ionization energy for
helium. The high electron density, the increased ionization efficiency and the suitable electron temperature
found in the µCHCD makes it an excellent candidate to replace the flame of an FID or the 63
Ni foil of an ECD.
In this work the application of a µCHCD as ionization source for a versatile, low power GC detector will be
investigated. In order to remain portable, no extra gas but the carrier gas should be employed.
5.2. Experimental
5.2.1. Reagents
1,1,2-Trichloroethylene (TCE) and methyl ethyl ketone (MEK) were both obtained from Merck (Darmstadt,
Germany). Toluene was purchased from Alfa Aesar (Karlsruhe, Germany). Both carbon tetrachloride (CCl4)
and methyl t-butyl ether (MTBE) were obtained from Riedel-de Haën AG (Seelze, Germany). Ethanol was
purchased from VWR International (Fontenay-sous-Bois, France) and methanol from Acros (Geel, Belgium).
N,N-dimethylacetamide (DMA) was obtained from Sigma Aldrich (Diegem, Belgium). For chromatographic
separations and plasma generation, helium 6.0 from Praxair (Schoten, Belgium) was used.
5.2.2. Chromatographic system and headspace (HS) sampler conditions
GC separations were carried out with a Perkin Elmer Autosystem XL GC equipped with a Perkin Elmer
(Waltham, MA, USA) 40 XL HS auto sampler (balanced pressure system). HS-vials and PTFE/Sil-caps were
purchased from Perkin Elmer as well. Separations were performed on an ATTM
-Aquawax column (30 m x
0.53 mm, df = 0.50 µm) from Grace (Lokeren, Belgium) using the oven program of Table 5.1. Injections for
sensitivity comparison were performed on a similar system equipped with an FID and a Perkin Elmer
Turbomass Gold MS system. For all experiments, HS-settings from Table 5.2 were used. 1 µL of sample
was transferred to a headspace vial and injected using the Full Evaporation Technique (FET).
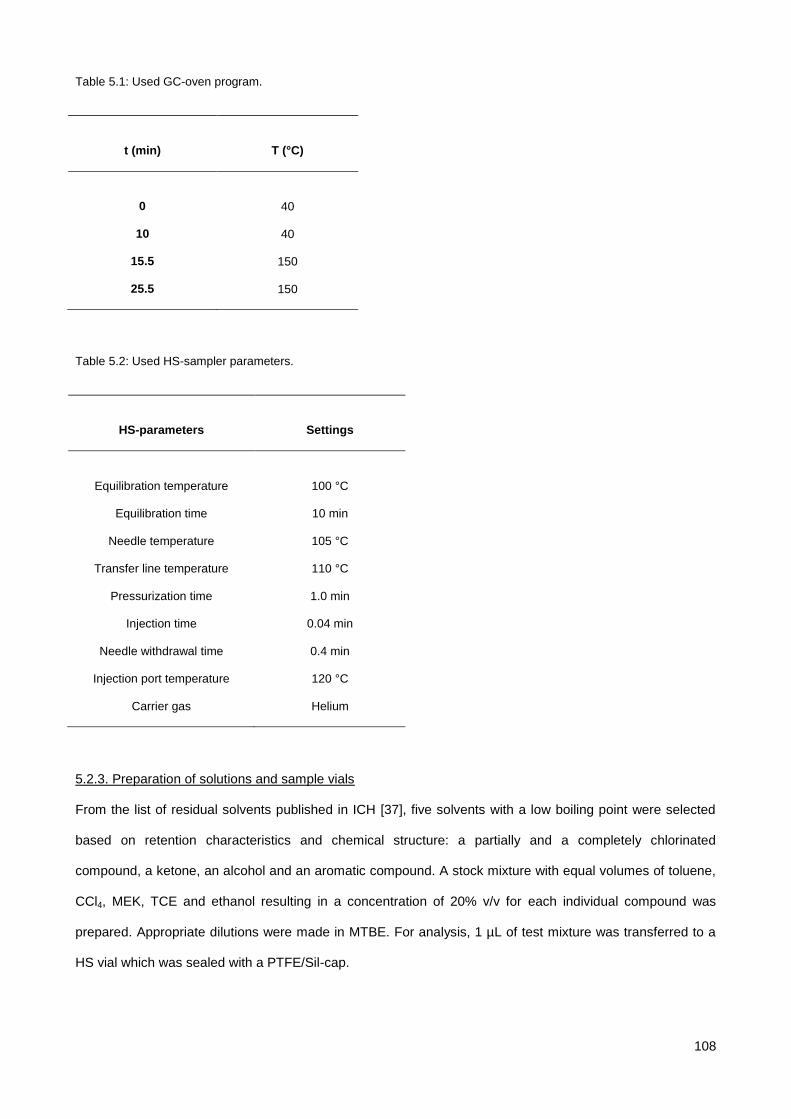
108
Table 5.1: Used GC-oven program.
t (min)
T (°C)
0
40
10 40
15.5 150
25.5 150
Table 5.2: Used HS-sampler parameters.
HS-parameters
Settings
Equilibration temperature
100 °C
Equilibration time 10 min
Needle temperature 105 °C
Transfer line temperature 110 °C
Pressurization time 1.0 min
Injection time 0.04 min
Needle withdrawal time 0.4 min
Injection port temperature
Carrier gas
120 °C
Helium
5.2.3. Preparation of solutions and sample vials
From the list of residual solvents published in ICH [37], five solvents with a low boiling point were selected
based on retention characteristics and chemical structure: a partially and a completely chlorinated
compound, a ketone, an alcohol and an aromatic compound. A stock mixture with equal volumes of toluene,
CCl4, MEK, TCE and ethanol resulting in a concentration of 20% v/v for each individual compound was
prepared. Appropriate dilutions were made in MTBE. For analysis, 1 µL of test mixture was transferred to a
HS vial which was sealed with a PTFE/Sil-cap.
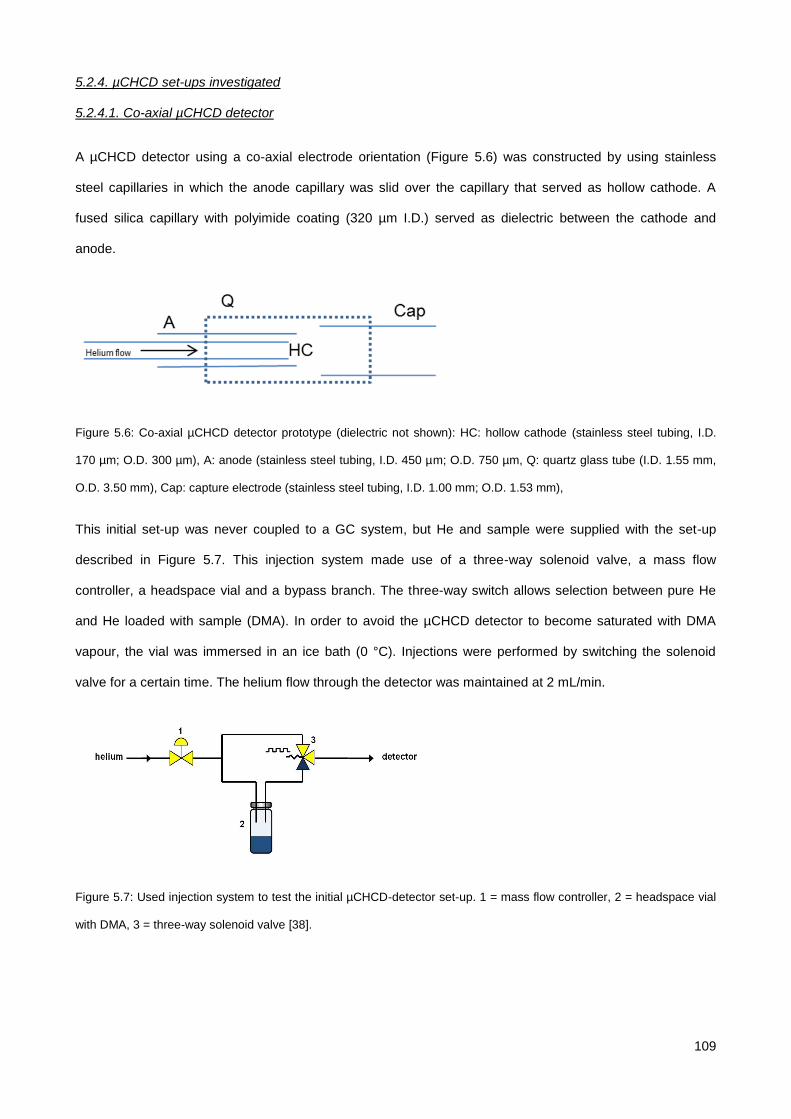
109
5.2.4. µCHCD set-ups investigated
5.2.4.1. Co-axial µCHCD detector
A µCHCD detector using a co-axial electrode orientation (Figure 5.6) was constructed by using stainless
steel capillaries in which the anode capillary was slid over the capillary that served as hollow cathode. A
fused silica capillary with polyimide coating (320 µm I.D.) served as dielectric between the cathode and
anode.
Figure 5.6: Co-axial µCHCD detector prototype (dielectric not shown): HC: hollow cathode (stainless steel tubing, I.D.
170 µm; O.D. 300 µm), A: anode (stainless steel tubing, I.D. 450 µm; O.D. 750 µm, Q: quartz glass tube (I.D. 1.55 mm,
O.D. 3.50 mm), Cap: capture electrode (stainless steel tubing, I.D. 1.00 mm; O.D. 1.53 mm),
This initial set-up was never coupled to a GC system, but He and sample were supplied with the set-up
described in Figure 5.7. This injection system made use of a three-way solenoid valve, a mass flow
controller, a headspace vial and a bypass branch. The three-way switch allows selection between pure He
and He loaded with sample (DMA). In order to avoid the µCHCD detector to become saturated with DMA
vapour, the vial was immersed in an ice bath (0 °C). Injections were performed by switching the solenoid
valve for a certain time. The helium flow through the detector was maintained at 2 mL/min.
Figure 5.7: Used injection system to test the initial µCHCD-detector set-up. 1 = mass flow controller, 2 = headspace vial
with DMA, 3 = three-way solenoid valve [38].
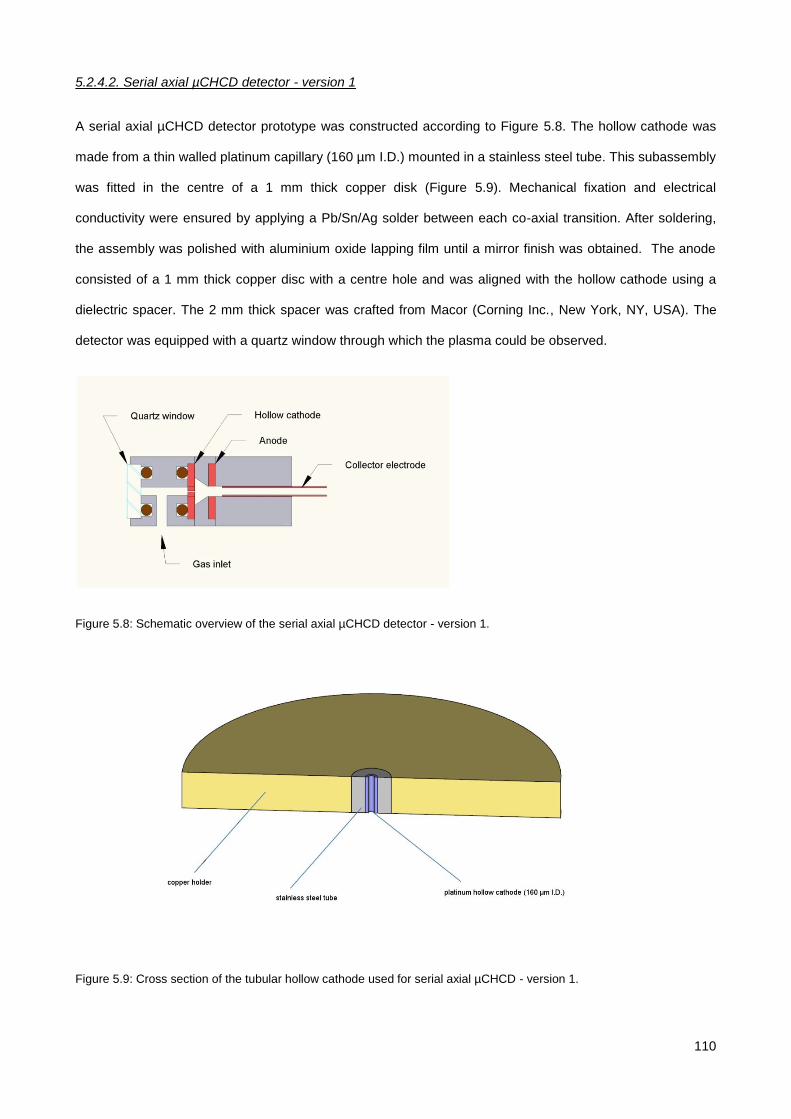
110
5.2.4.2. Serial axial µCHCD detector - version 1
A serial axial µCHCD detector prototype was constructed according to Figure 5.8. The hollow cathode was
made from a thin walled platinum capillary (160 µm I.D.) mounted in a stainless steel tube. This subassembly
was fitted in the centre of a 1 mm thick copper disk (Figure 5.9). Mechanical fixation and electrical
conductivity were ensured by applying a Pb/Sn/Ag solder between each co-axial transition. After soldering,
the assembly was polished with aluminium oxide lapping film until a mirror finish was obtained. The anode
consisted of a 1 mm thick copper disc with a centre hole and was aligned with the hollow cathode using a
dielectric spacer. The 2 mm thick spacer was crafted from Macor (Corning Inc., New York, NY, USA). The
detector was equipped with a quartz window through which the plasma could be observed.
Figure 5.8: Schematic overview of the serial axial µCHCD detector - version 1.
Figure 5.9: Cross section of the tubular hollow cathode used for serial axial µCHCD - version 1.
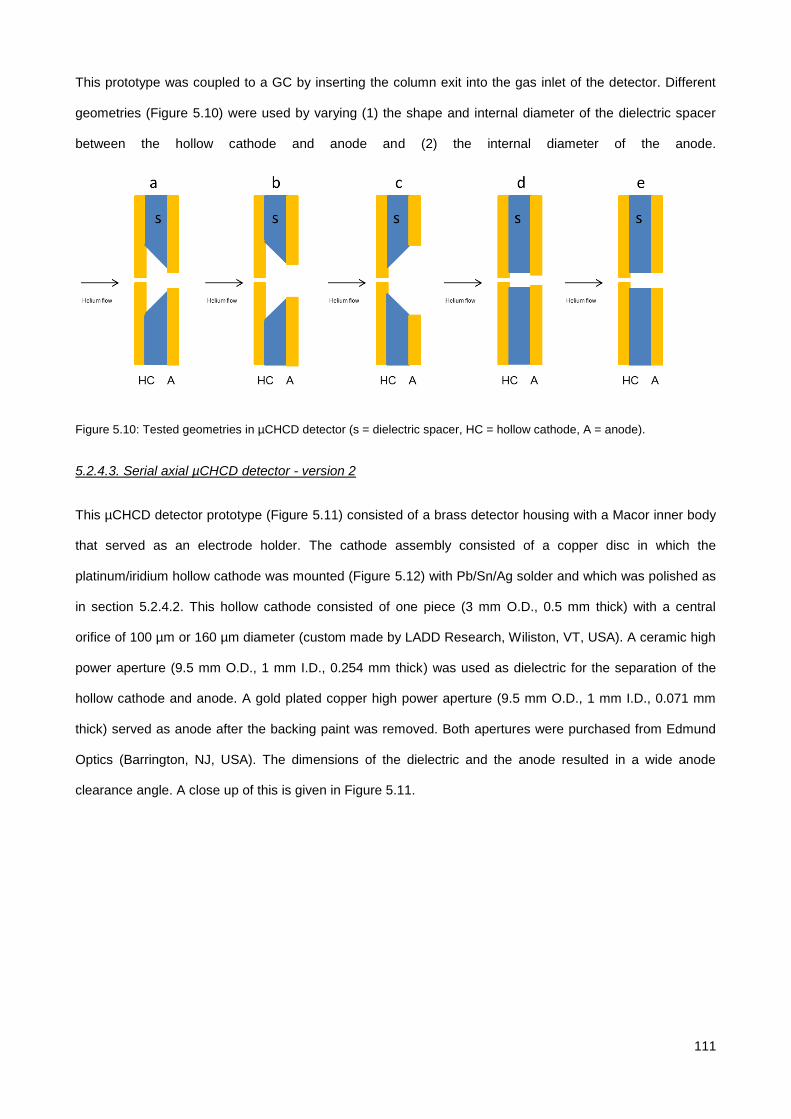
111
This prototype was coupled to a GC by inserting the column exit into the gas inlet of the detector. Different
geometries (Figure 5.10) were used by varying (1) the shape and internal diameter of the dielectric spacer
between the hollow cathode and anode and (2) the internal diameter of the anode.
Figure 5.10: Tested geometries in µCHCD detector (s = dielectric spacer, HC = hollow cathode, A = anode).
5.2.4.3. Serial axial µCHCD detector - version 2
This µCHCD detector prototype (Figure 5.11) consisted of a brass detector housing with a Macor inner body
that served as an electrode holder. The cathode assembly consisted of a copper disc in which the
platinum/iridium hollow cathode was mounted (Figure 5.12) with Pb/Sn/Ag solder and which was polished as
in section 5.2.4.2. This hollow cathode consisted of one piece (3 mm O.D., 0.5 mm thick) with a central
orifice of 100 µm or 160 µm diameter (custom made by LADD Research, Wiliston, VT, USA). A ceramic high
power aperture (9.5 mm O.D., 1 mm I.D., 0.254 mm thick) was used as dielectric for the separation of the
hollow cathode and anode. A gold plated copper high power aperture (9.5 mm O.D., 1 mm I.D., 0.071 mm
thick) served as anode after the backing paint was removed. Both apertures were purchased from Edmund
Optics (Barrington, NJ, USA). The dimensions of the dielectric and the anode resulted in a wide anode
clearance angle. A close up of this is given in Figure 5.11.
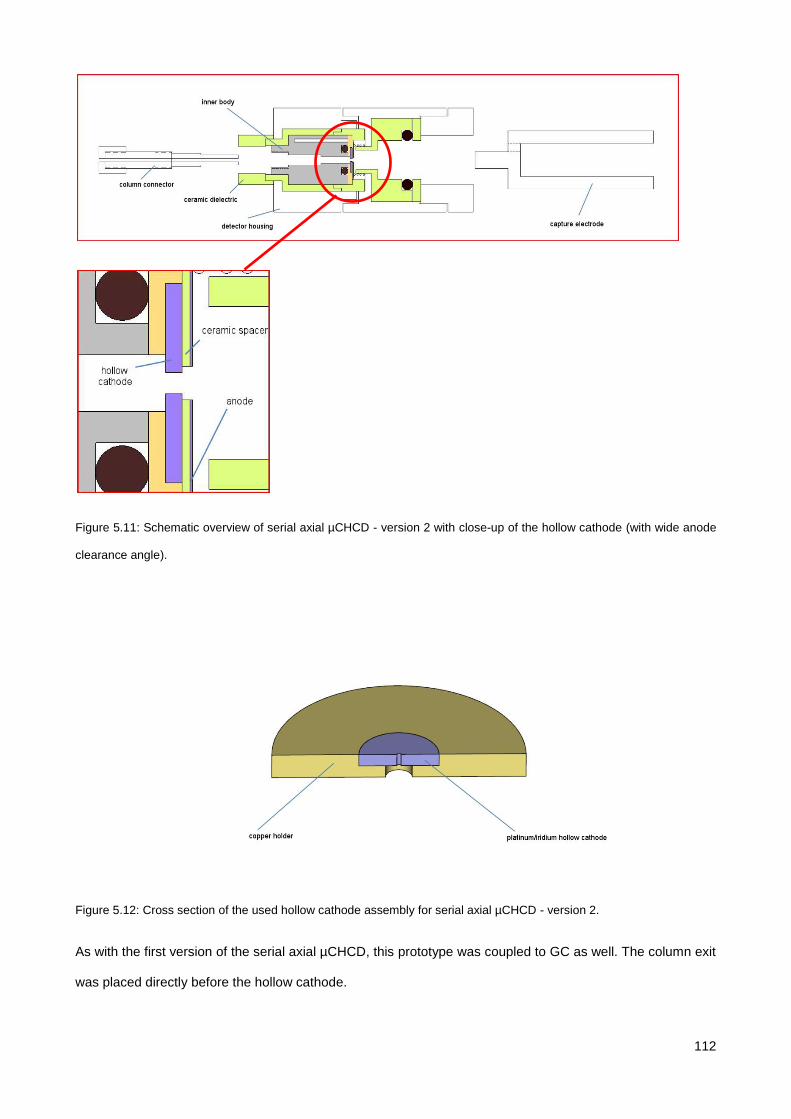
112
Figure 5.11: Schematic overview of serial axial µCHCD - version 2 with close-up of the hollow cathode (with wide anode
clearance angle).
Figure 5.12: Cross section of the used hollow cathode assembly for serial axial µCHCD - version 2.
As with the first version of the serial axial µCHCD, this prototype was coupled to GC as well. The column exit
was placed directly before the hollow cathode.
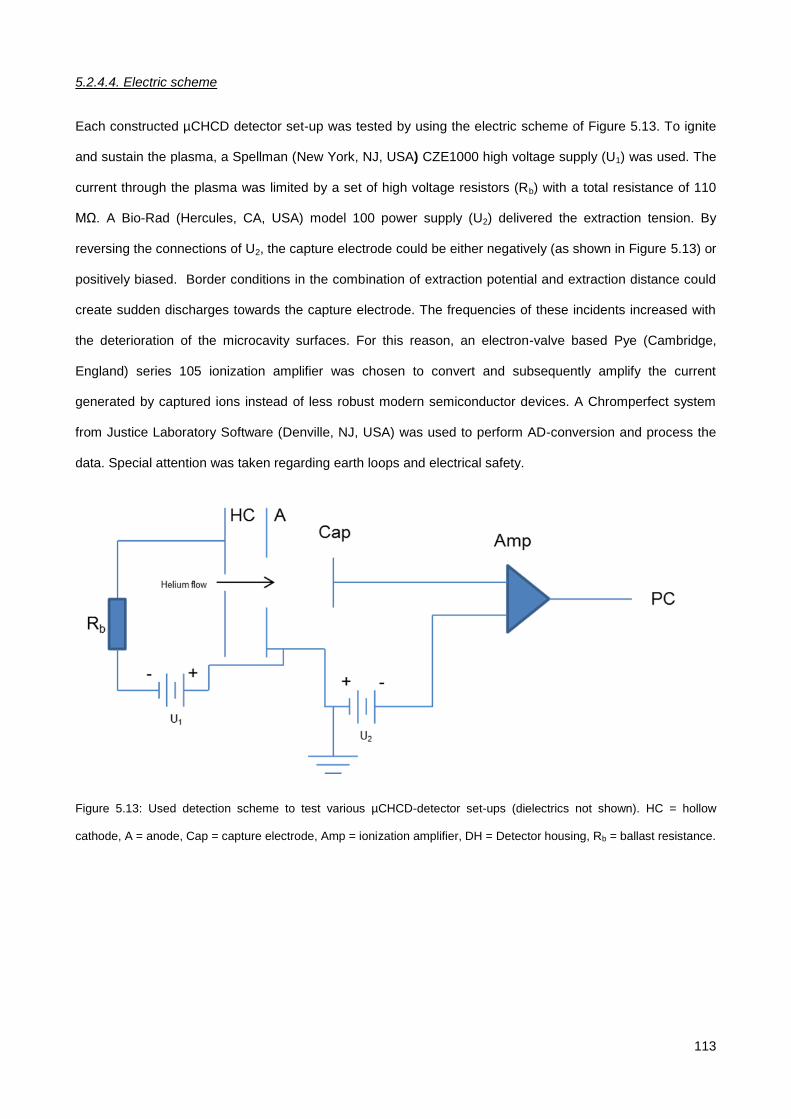
113
5.2.4.4. Electric scheme
Each constructed µCHCD detector set-up was tested by using the electric scheme of Figure 5.13. To ignite
and sustain the plasma, a Spellman (New York, NJ, USA) CZE1000 high voltage supply (U1) was used. The
current through the plasma was limited by a set of high voltage resistors (Rb) with a total resistance of 110
MΩ. A Bio-Rad (Hercules, CA, USA) model 100 power supply (U2) delivered the extraction tension. By
reversing the connections of U2, the capture electrode could be either negatively (as shown in Figure 5.13) or
positively biased. Border conditions in the combination of extraction potential and extraction distance could
create sudden discharges towards the capture electrode. The frequencies of these incidents increased with
the deterioration of the microcavity surfaces. For this reason, an electron-valve based Pye (Cambridge,
England) series 105 ionization amplifier was chosen to convert and subsequently amplify the current
generated by captured ions instead of less robust modern semiconductor devices. A Chromperfect system
from Justice Laboratory Software (Denville, NJ, USA) was used to perform AD-conversion and process the
data. Special attention was taken regarding earth loops and electrical safety.
Figure 5.13: Used detection scheme to test various µCHCD-detector set-ups (dielectrics not shown). HC = hollow
cathode, A = anode, Cap = capture electrode, Amp = ionization amplifier, DH = Detector housing, Rb = ballast resistance.
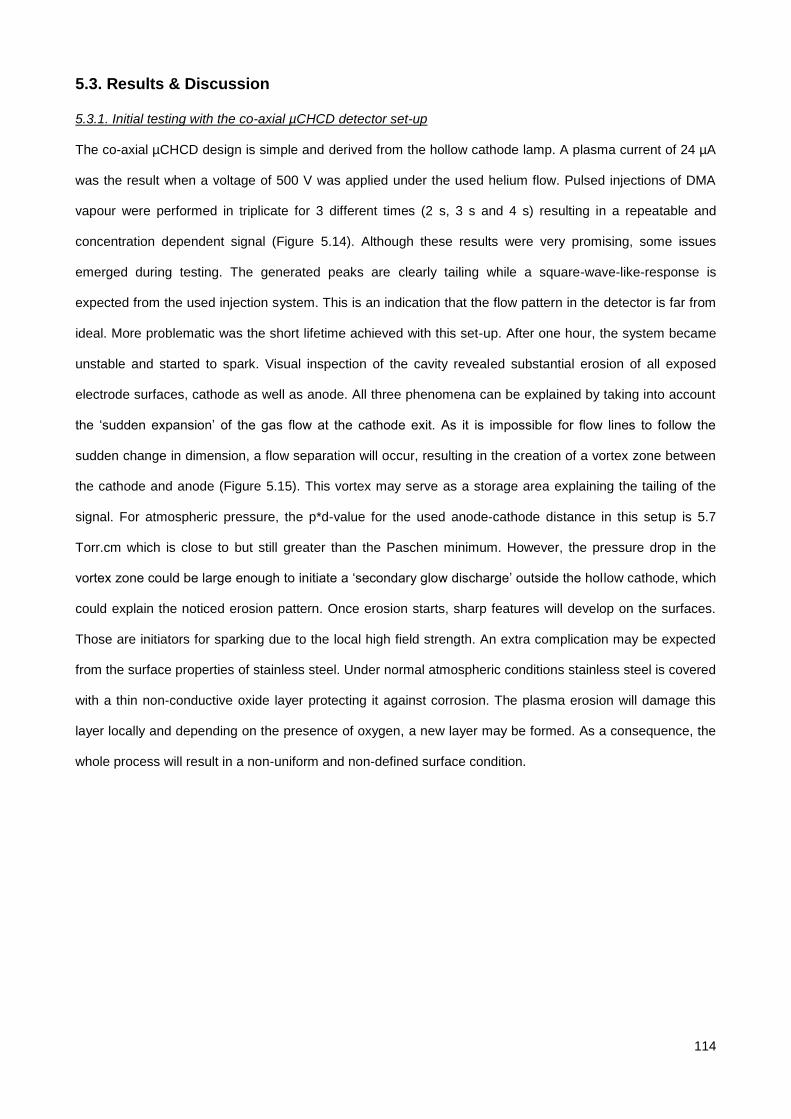
114
5.3. Results & Discussion
5.3.1. Initial testing with the co-axial µCHCD detector set-up
The co-axial µCHCD design is simple and derived from the hollow cathode lamp. A plasma current of 24 µA
was the result when a voltage of 500 V was applied under the used helium flow. Pulsed injections of DMA
vapour were performed in triplicate for 3 different times (2 s, 3 s and 4 s) resulting in a repeatable and
concentration dependent signal (Figure 5.14). Although these results were very promising, some issues
emerged during testing. The generated peaks are clearly tailing while a square-wave-like-response is
expected from the used injection system. This is an indication that the flow pattern in the detector is far from
ideal. More problematic was the short lifetime achieved with this set-up. After one hour, the system became
unstable and started to spark. Visual inspection of the cavity revealed substantial erosion of all exposed
electrode surfaces, cathode as well as anode. All three phenomena can be explained by taking into account
the ‗sudden expansion‘ of the gas flow at the cathode exit. As it is impossible for flow lines to follow the
sudden change in dimension, a flow separation will occur, resulting in the creation of a vortex zone between
the cathode and anode (Figure 5.15). This vortex may serve as a storage area explaining the tailing of the
signal. For atmospheric pressure, the p*d-value for the used anode-cathode distance in this setup is 5.7
Torr.cm which is close to but still greater than the Paschen minimum. However, the pressure drop in the
vortex zone could be large enough to initiate a ‗secondary glow discharge‘ outside the hollow cathode, which
could explain the noticed erosion pattern. Once erosion starts, sharp features will develop on the surfaces.
Those are initiators for sparking due to the local high field strength. An extra complication may be expected
from the surface properties of stainless steel. Under normal atmospheric conditions stainless steel is covered
with a thin non-conductive oxide layer protecting it against corrosion. The plasma erosion will damage this
layer locally and depending on the presence of oxygen, a new layer may be formed. As a consequence, the
whole process will result in a non-uniform and non-defined surface condition.
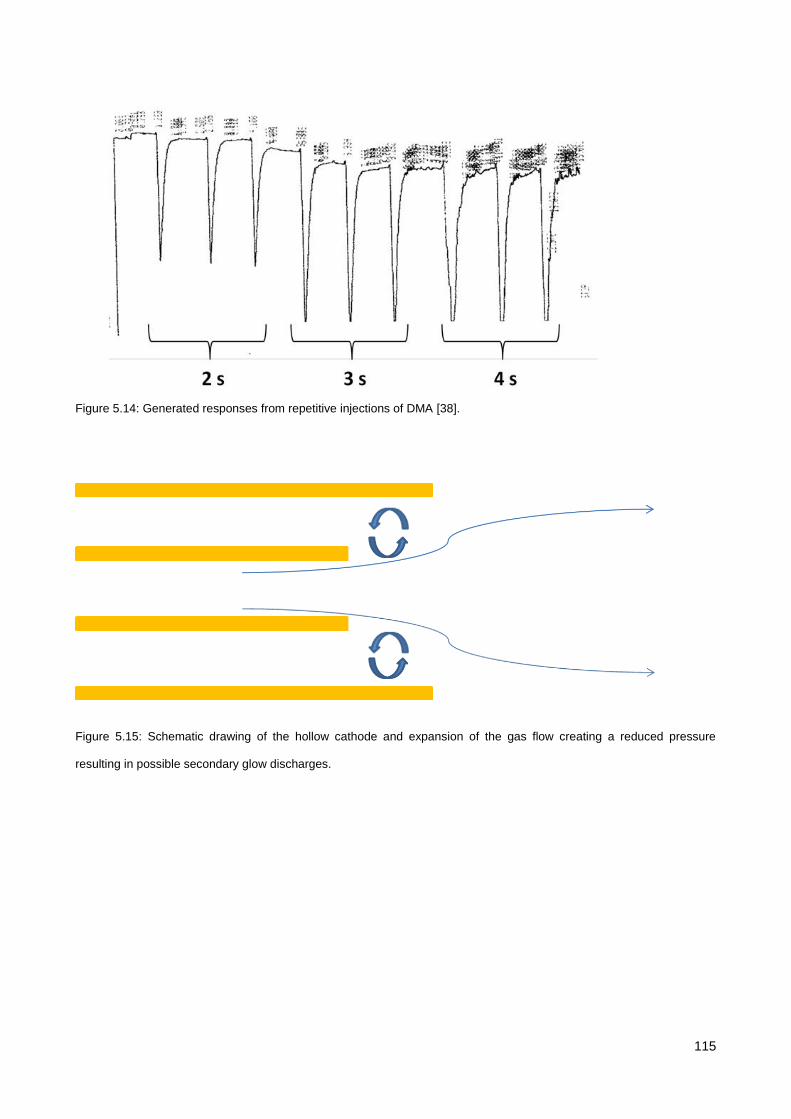
115
Figure 5.14: Generated responses from repetitive injections of DMA [38].
Figure 5.15: Schematic drawing of the hollow cathode and expansion of the gas flow creating a reduced pressure
resulting in possible secondary glow discharges.
116
5.3.2. Serial axial µCHCD detector – version 1
From the experiments with the coaxial set-up three areas for improvement were identified.
The coaxial approach was abandoned in favour of a serial axial set-up using two parallel disc shaped
electrodes with a central orifice. Several benefits are to be expected from this arrangement. This design
places the anode outside the low pressure area, created by the sudden expansion, reducing the risk on a
secondary glow discharge. The larger front area achieved by this arrangement translates in a more uniform
electric field and it is easier to achieve a smooth surface. Both items reduce the chance on sparking.
Instead of using stainless steel as electrode material, platinum/iridium was used for its better resistance
against plasma sputtering. Materials such as tungsten (W), molybdenum (Mo) or pure iridium (Ir) could be
used as well, but are very hard to manipulate due to the characteristic hardness of these materials. The
absence of an oxide layer results in a better conductivity and a more uniform surface chemistry.
A third area of optimization is the flow pattern. Nowadays, this kind of optimization is done with the aid of
Computational Fluid Dynamics (CFD) software. In this case however it is extremely difficult to collect the data
needed for the initiation and verification of such a process, without causing artefacts. Mainly the temperature
and the exact location of the plasma are unknown and could change under the influence of a passing
analyte. After establishing a flow pattern model, this should be used to study the ion trajectories, increasing
the complexity of the process. For these reasons it was decided to use a more hands on approach and study
the results generated with the geometries depicted in Figure 5.10. For each geometry, a set of
chromatograms was recorded covering the whole range of parameter combinations. The capture distance
was varied from 1 to 5 mm relative to the anode in steps of 1 mm. The plasma current ranged from 10 to 100
µA. For this range the µCHCD operates in hollow cathode mode as was indicated by the negative resistance
behaviour. The effect of the bias voltage was examined from 50 to 300 V with both polarizations. The
combination of sample size, sample concentration and split settings was calculated corresponding to 1 µg of
each compound on column.
The general appearance, peak shape, signals and noise levels of the generated chromatograms were
visually inspected and compared. Only the negative bias mode resulted in chromatograms. When the
capture electrode was positively biased only noise was recorded. The influence of the plasma current (within
one geometry) on the assessed parameters was negligible. As a consequence, a low current is preferred to
reduce power consumption and heat load. The capturing distance has a small effect on the peak shape,
117
while signal strength is proportional to the field strength, i.e. the ratio of bias potential to distance. High field
strength combined with short distances can create a destructive overload on the amplifier input.
Surprisingly the cavity shape turned out to be of major importance. Taking the general appearance of the
chromatograms as selection criterion, the geometries can be divided into two groups. Geometries ‗‘a‘‘, ‗‘d‘‘
and ‗‘e‘‘ (Figure 5.10) have a narrow anode bore in common. While a high baseline with negative peaks for
all components (thus less positive ions reaching the capture electrode) are the main characteristics for this
group (Figure 5.16), cell ‗‘e‘‘ performed slightly better concerning noise and signal level which is probably
attributed to the dielectric shielding of the anode. For geometries ‗‘b‘‘ and ‗‘c‘‘, a wide anode bore was used.
The resulting chromatograms (Figure 5.17) show a lower baseline and less noise, while all components
appear as positive peaks. Therefore it was decided to use geometries ‗‘b‘‘ and ‗‘c‘‘ as base for the next
design.
The lifetime was improved dramatically too. After a few weeks, the µCHCD started to draw current without
the generation of plasma. On inspection, a black gray deposit in the inner volume of the dielectric was
noticed and the cathode had a mat appearance. Treating the spacer with hot hydrochloric acid and
repolishing the cathode restored operation. After a few cycles it became clear that the solder between the
capillaries was slowly etched away causing the deposit. At the end, the resulting cavity will cause sparking
making the cathode useless. So, this issue was considered in the next design. It was however possible to
complete this part of the work with only one cathode assembly.
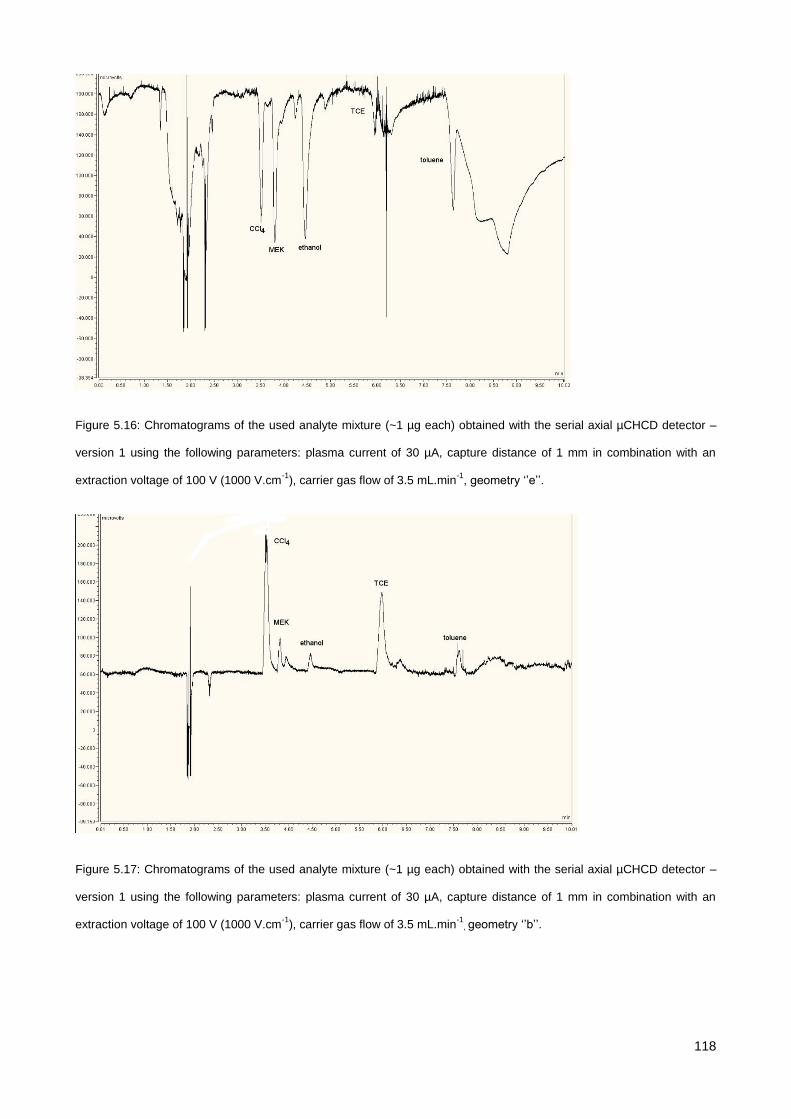
118
Figure 5.16: Chromatograms of the used analyte mixture (~1 µg each) obtained with the serial axial µCHCD detector –
version 1 using the following parameters: plasma current of 30 µA, capture distance of 1 mm in combination with an
extraction voltage of 100 V (1000 V.cm-1
), carrier gas flow of 3.5 mL.min-1
, geometry ‗‘e‘‘.
Figure 5.17: Chromatograms of the used analyte mixture (~1 µg each) obtained with the serial axial µCHCD detector –
version 1 using the following parameters: plasma current of 30 µA, capture distance of 1 mm in combination with an
extraction voltage of 100 V (1000 V.cm-1
), carrier gas flow of 3.5 mL.min-1
, geometry ‗‘b‘‘.
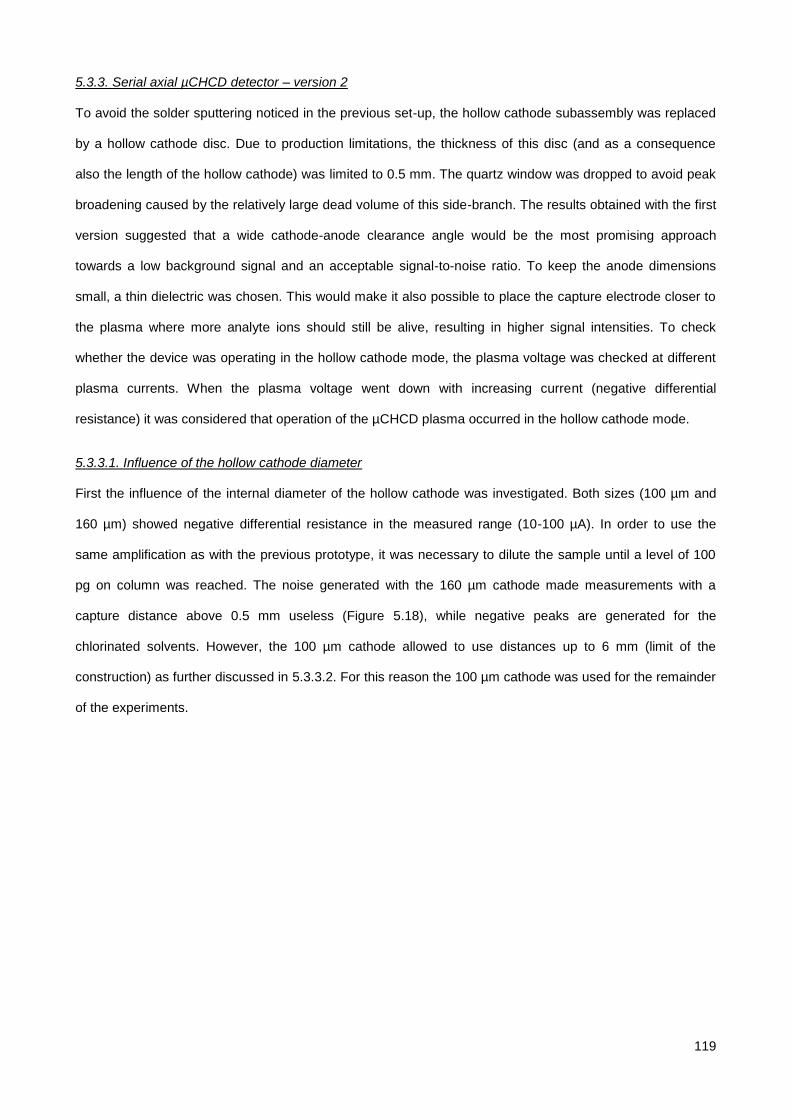
119
5.3.3. Serial axial µCHCD detector – version 2
To avoid the solder sputtering noticed in the previous set-up, the hollow cathode subassembly was replaced
by a hollow cathode disc. Due to production limitations, the thickness of this disc (and as a consequence
also the length of the hollow cathode) was limited to 0.5 mm. The quartz window was dropped to avoid peak
broadening caused by the relatively large dead volume of this side-branch. The results obtained with the first
version suggested that a wide cathode-anode clearance angle would be the most promising approach
towards a low background signal and an acceptable signal-to-noise ratio. To keep the anode dimensions
small, a thin dielectric was chosen. This would make it also possible to place the capture electrode closer to
the plasma where more analyte ions should still be alive, resulting in higher signal intensities. To check
whether the device was operating in the hollow cathode mode, the plasma voltage was checked at different
plasma currents. When the plasma voltage went down with increasing current (negative differential
resistance) it was considered that operation of the µCHCD plasma occurred in the hollow cathode mode.
5.3.3.1. Influence of the hollow cathode diameter First the influence of the internal diameter of the hollow cathode was investigated. Both sizes (100 µm and
160 µm) showed negative differential resistance in the measured range (10-100 µA). In order to use the
same amplification as with the previous prototype, it was necessary to dilute the sample until a level of 100
pg on column was reached. The noise generated with the 160 µm cathode made measurements with a
capture distance above 0.5 mm useless (Figure 5.18), while negative peaks are generated for the
chlorinated solvents. However, the 100 µm cathode allowed to use distances up to 6 mm (limit of the
construction) as further discussed in 5.3.3.2. For this reason the 100 µm cathode was used for the remainder
of the experiments.
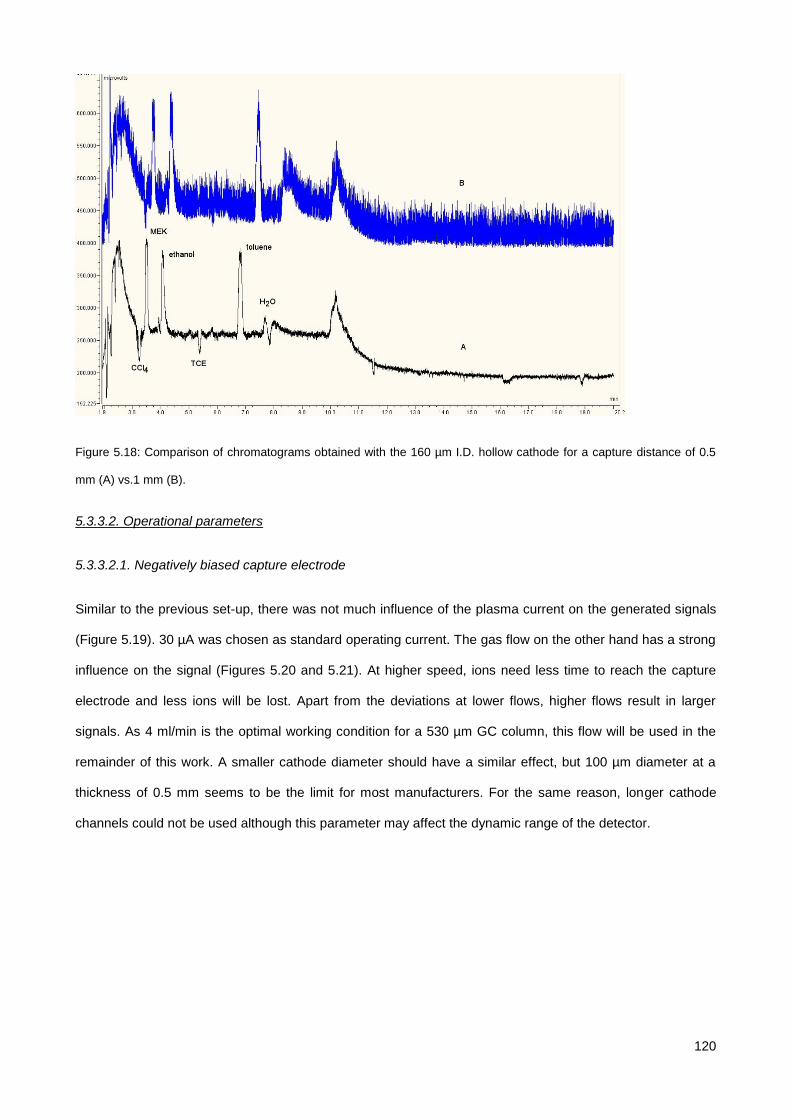
120
Figure 5.18: Comparison of chromatograms obtained with the 160 µm I.D. hollow cathode for a capture distance of 0.5
mm (A) vs.1 mm (B).
5.3.3.2. Operational parameters
5.3.3.2.1. Negatively biased capture electrode
Similar to the previous set-up, there was not much influence of the plasma current on the generated signals
(Figure 5.19). 30 µA was chosen as standard operating current. The gas flow on the other hand has a strong
influence on the signal (Figures 5.20 and 5.21). At higher speed, ions need less time to reach the capture
electrode and less ions will be lost. Apart from the deviations at lower flows, higher flows result in larger
signals. As 4 ml/min is the optimal working condition for a 530 µm GC column, this flow will be used in the
remainder of this work. A smaller cathode diameter should have a similar effect, but 100 µm diameter at a
thickness of 0.5 mm seems to be the limit for most manufacturers. For the same reason, longer cathode
channels could not be used although this parameter may affect the dynamic range of the detector.
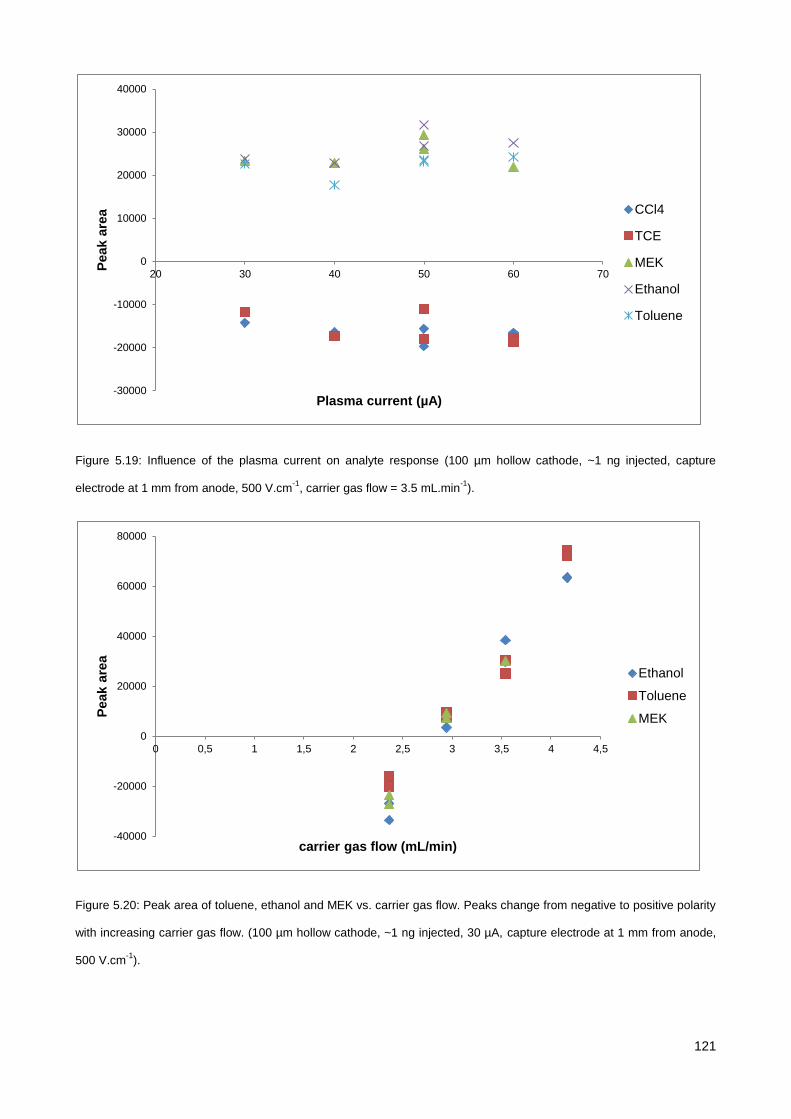
121
Figure 5.19: Influence of the plasma current on analyte response (100 µm hollow cathode, ~1 ng injected, capture
electrode at 1 mm from anode, 500 V.cm-1
, carrier gas flow = 3.5 mL.min-1
).
Figure 5.20: Peak area of toluene, ethanol and MEK vs. carrier gas flow. Peaks change from negative to positive polarity
with increasing carrier gas flow. (100 µm hollow cathode, ~1 ng injected, 30 µA, capture electrode at 1 mm from anode,
500 V.cm-1
).
-30000
-20000
-10000
0
10000
20000
30000
40000
20 30 40 50 60 70
Peak a
rea
Plasma current (µA)
CCl4
TCE
MEK
Ethanol
Toluene
-40000
-20000
0
20000
40000
60000
80000
0 0,5 1 1,5 2 2,5 3 3,5 4 4,5
Peak a
rea
carrier gas flow (mL/min)
Ethanol
Toluene
MEK
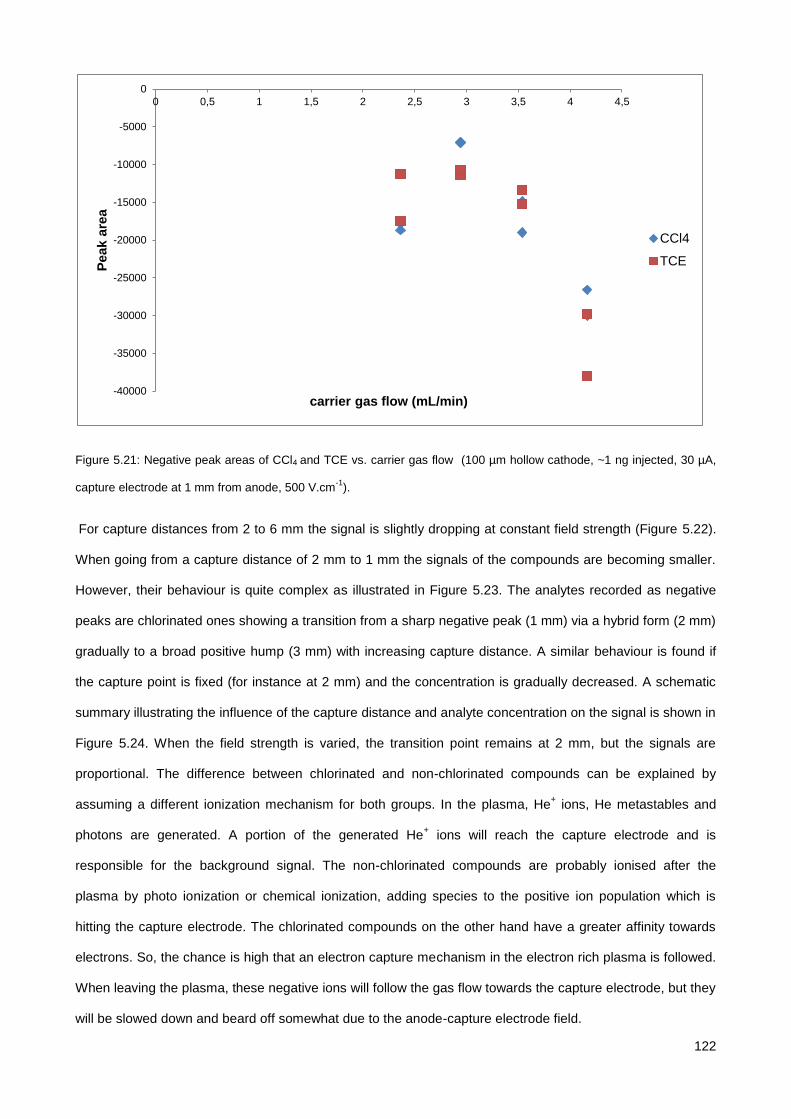
122
Figure 5.21: Negative peak areas of CCl4 and TCE vs. carrier gas flow (100 µm hollow cathode, ~1 ng injected, 30 µA,
capture electrode at 1 mm from anode, 500 V.cm-1
).
For capture distances from 2 to 6 mm the signal is slightly dropping at constant field strength (Figure 5.22).
When going from a capture distance of 2 mm to 1 mm the signals of the compounds are becoming smaller.
However, their behaviour is quite complex as illustrated in Figure 5.23. The analytes recorded as negative
peaks are chlorinated ones showing a transition from a sharp negative peak (1 mm) via a hybrid form (2 mm)
gradually to a broad positive hump (3 mm) with increasing capture distance. A similar behaviour is found if
the capture point is fixed (for instance at 2 mm) and the concentration is gradually decreased. A schematic
summary illustrating the influence of the capture distance and analyte concentration on the signal is shown in
Figure 5.24. When the field strength is varied, the transition point remains at 2 mm, but the signals are
proportional. The difference between chlorinated and non-chlorinated compounds can be explained by
assuming a different ionization mechanism for both groups. In the plasma, He+ ions, He metastables and
photons are generated. A portion of the generated He+ ions will reach the capture electrode and is
responsible for the background signal. The non-chlorinated compounds are probably ionised after the
plasma by photo ionization or chemical ionization, adding species to the positive ion population which is
hitting the capture electrode. The chlorinated compounds on the other hand have a greater affinity towards
electrons. So, the chance is high that an electron capture mechanism in the electron rich plasma is followed.
When leaving the plasma, these negative ions will follow the gas flow towards the capture electrode, but they
will be slowed down and beard off somewhat due to the anode-capture electrode field.
-40000
-35000
-30000
-25000
-20000
-15000
-10000
-5000
0
0 0,5 1 1,5 2 2,5 3 3,5 4 4,5P
eak a
rea
carrier gas flow (mL/min)
CCl4
TCE
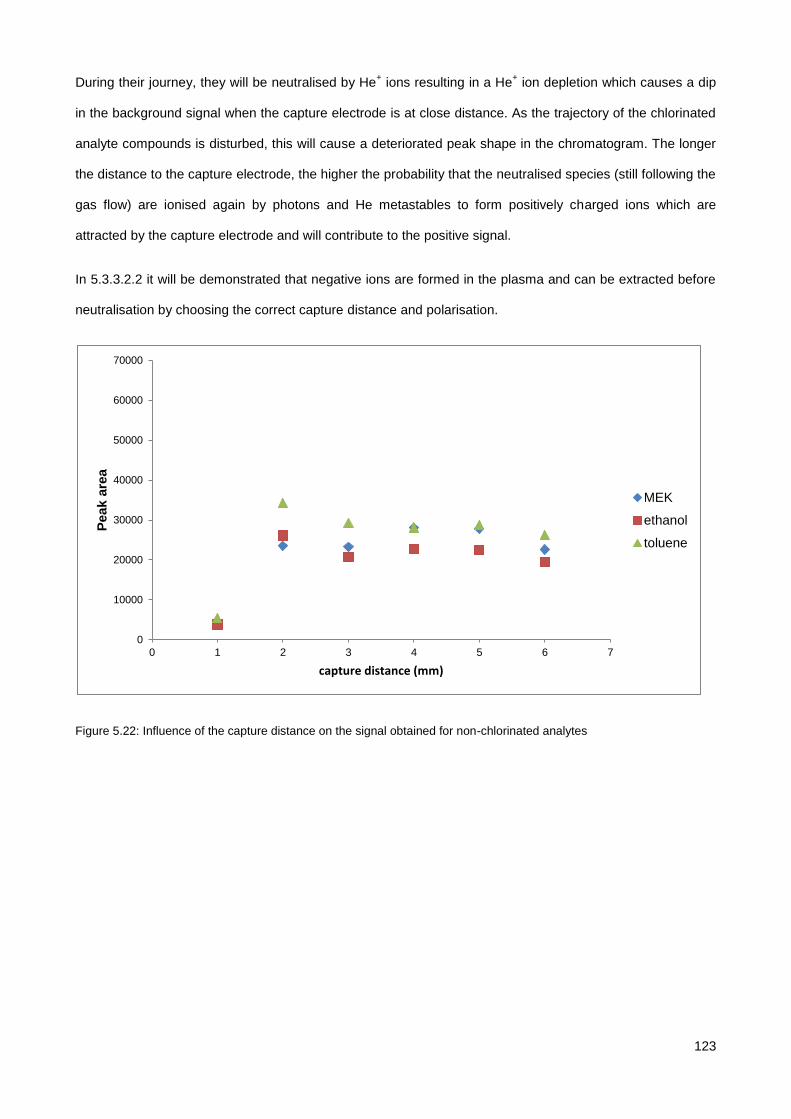
123
During their journey, they will be neutralised by He+ ions resulting in a He
+ ion depletion which causes a dip
in the background signal when the capture electrode is at close distance. As the trajectory of the chlorinated
analyte compounds is disturbed, this will cause a deteriorated peak shape in the chromatogram. The longer
the distance to the capture electrode, the higher the probability that the neutralised species (still following the
gas flow) are ionised again by photons and He metastables to form positively charged ions which are
attracted by the capture electrode and will contribute to the positive signal.
In 5.3.3.2.2 it will be demonstrated that negative ions are formed in the plasma and can be extracted before
neutralisation by choosing the correct capture distance and polarisation.
Figure 5.22: Influence of the capture distance on the signal obtained for non-chlorinated analytes
0
10000
20000
30000
40000
50000
60000
70000
0 1 2 3 4 5 6 7
Peak a
rea
capture distance (mm)
MEK
ethanol
toluene
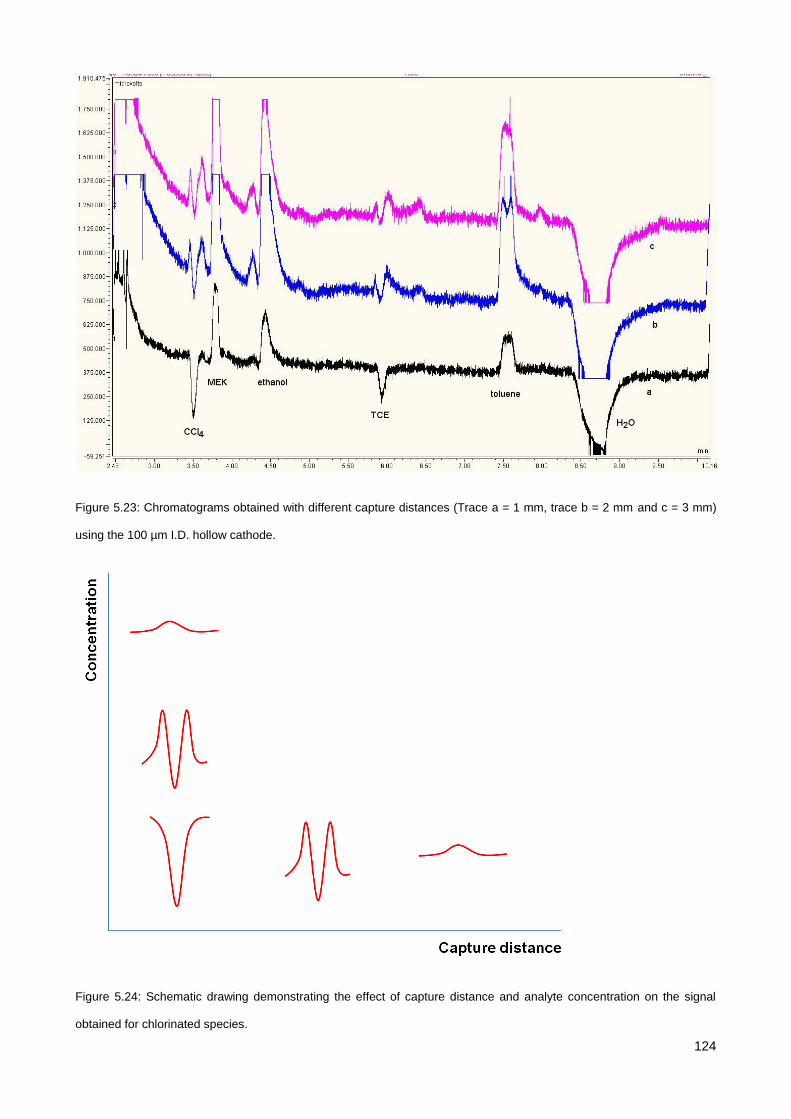
124
Figure 5.23: Chromatograms obtained with different capture distances (Trace a = 1 mm, trace b = 2 mm and c = 3 mm)
using the 100 µm I.D. hollow cathode.
Figure 5.24: Schematic drawing demonstrating the effect of capture distance and analyte concentration on the signal
obtained for chlorinated species.
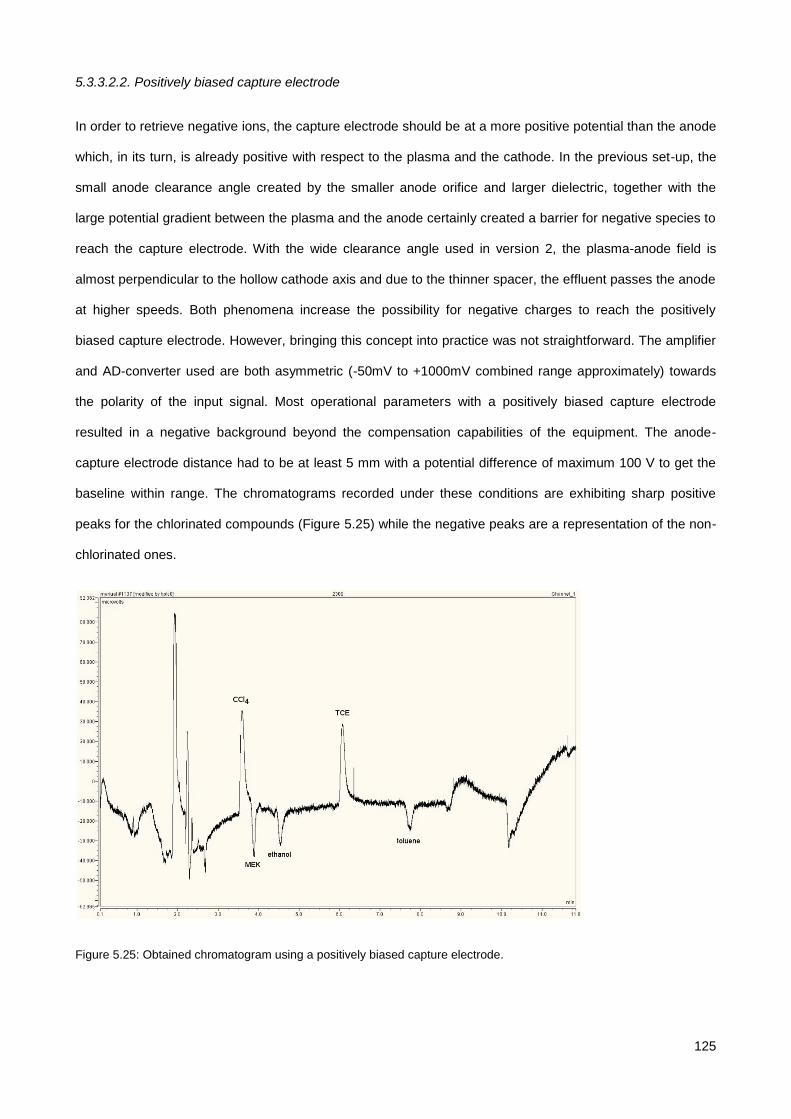
125
5.3.3.2.2. Positively biased capture electrode
In order to retrieve negative ions, the capture electrode should be at a more positive potential than the anode
which, in its turn, is already positive with respect to the plasma and the cathode. In the previous set-up, the
small anode clearance angle created by the smaller anode orifice and larger dielectric, together with the
large potential gradient between the plasma and the anode certainly created a barrier for negative species to
reach the capture electrode. With the wide clearance angle used in version 2, the plasma-anode field is
almost perpendicular to the hollow cathode axis and due to the thinner spacer, the effluent passes the anode
at higher speeds. Both phenomena increase the possibility for negative charges to reach the positively
biased capture electrode. However, bringing this concept into practice was not straightforward. The amplifier
and AD-converter used are both asymmetric (-50mV to +1000mV combined range approximately) towards
the polarity of the input signal. Most operational parameters with a positively biased capture electrode
resulted in a negative background beyond the compensation capabilities of the equipment. The anode-
capture electrode distance had to be at least 5 mm with a potential difference of maximum 100 V to get the
baseline within range. The chromatograms recorded under these conditions are exhibiting sharp positive
peaks for the chlorinated compounds (Figure 5.25) while the negative peaks are a representation of the non-
chlorinated ones.
Figure 5.25: Obtained chromatogram using a positively biased capture electrode.
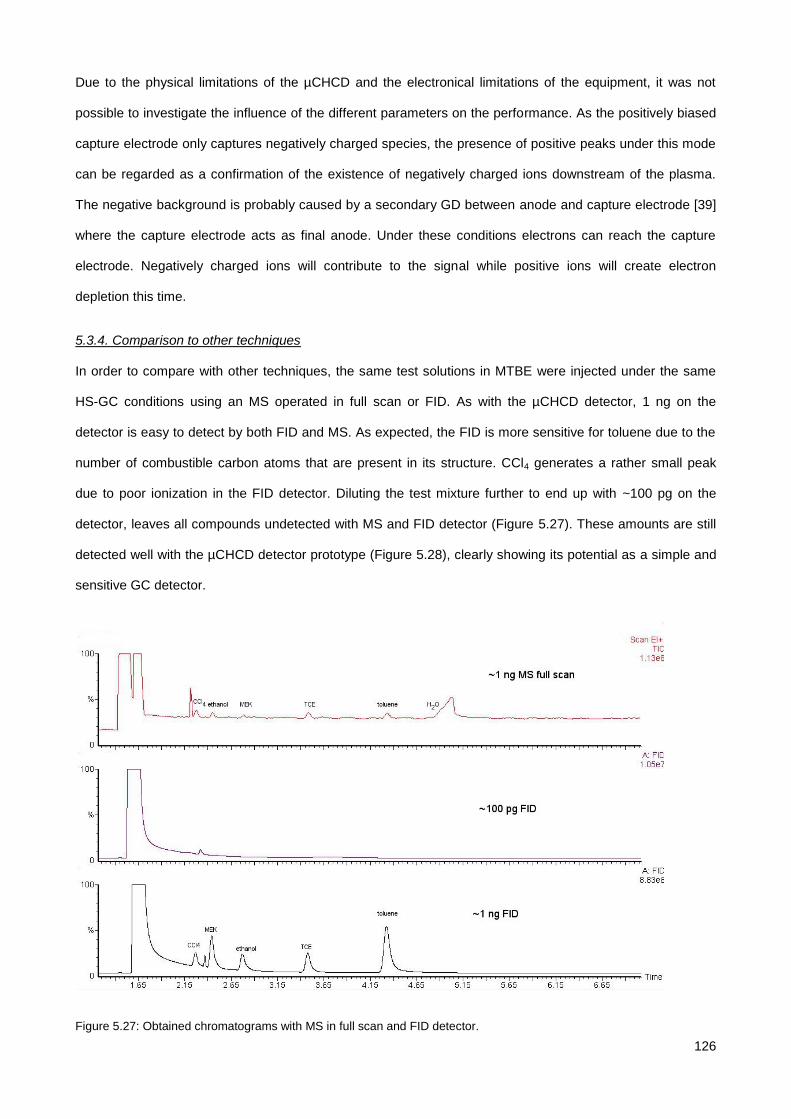
126
Due to the physical limitations of the µCHCD and the electronical limitations of the equipment, it was not
possible to investigate the influence of the different parameters on the performance. As the positively biased
capture electrode only captures negatively charged species, the presence of positive peaks under this mode
can be regarded as a confirmation of the existence of negatively charged ions downstream of the plasma.
The negative background is probably caused by a secondary GD between anode and capture electrode [39]
where the capture electrode acts as final anode. Under these conditions electrons can reach the capture
electrode. Negatively charged ions will contribute to the signal while positive ions will create electron
depletion this time.
5.3.4. Comparison to other techniques
In order to compare with other techniques, the same test solutions in MTBE were injected under the same
HS-GC conditions using an MS operated in full scan or FID. As with the µCHCD detector, 1 ng on the
detector is easy to detect by both FID and MS. As expected, the FID is more sensitive for toluene due to the
number of combustible carbon atoms that are present in its structure. CCl4 generates a rather small peak
due to poor ionization in the FID detector. Diluting the test mixture further to end up with ~100 pg on the
detector, leaves all compounds undetected with MS and FID detector (Figure 5.27). These amounts are still
detected well with the µCHCD detector prototype (Figure 5.28), clearly showing its potential as a simple and
sensitive GC detector.
Figure 5.27: Obtained chromatograms with MS in full scan and FID detector.
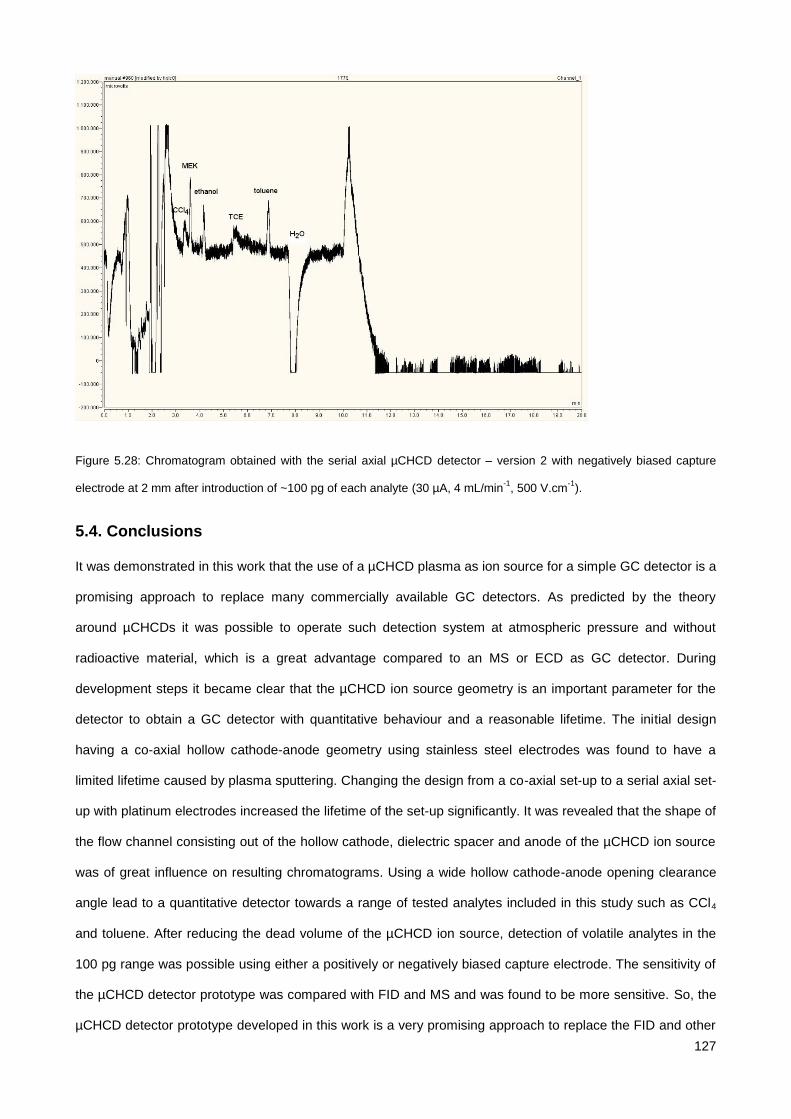
127
Figure 5.28: Chromatogram obtained with the serial axial µCHCD detector – version 2 with negatively biased capture
electrode at 2 mm after introduction of ~100 pg of each analyte (30 µA, 4 mL/min-1
, 500 V.cm-1
).
5.4. Conclusions
It was demonstrated in this work that the use of a µCHCD plasma as ion source for a simple GC detector is a
promising approach to replace many commercially available GC detectors. As predicted by the theory
around µCHCDs it was possible to operate such detection system at atmospheric pressure and without
radioactive material, which is a great advantage compared to an MS or ECD as GC detector. During
development steps it became clear that the µCHCD ion source geometry is an important parameter for the
detector to obtain a GC detector with quantitative behaviour and a reasonable lifetime. The initial design
having a co-axial hollow cathode-anode geometry using stainless steel electrodes was found to have a
limited lifetime caused by plasma sputtering. Changing the design from a co-axial set-up to a serial axial set-
up with platinum electrodes increased the lifetime of the set-up significantly. It was revealed that the shape of
the flow channel consisting out of the hollow cathode, dielectric spacer and anode of the µCHCD ion source
was of great influence on resulting chromatograms. Using a wide hollow cathode-anode opening clearance
angle lead to a quantitative detector towards a range of tested analytes included in this study such as CCl4
and toluene. After reducing the dead volume of the µCHCD ion source, detection of volatile analytes in the
100 pg range was possible using either a positively or negatively biased capture electrode. The sensitivity of
the µCHCD detector prototype was compared with FID and MS and was found to be more sensitive. So, the
µCHCD detector prototype developed in this work is a very promising approach to replace the FID and other
128
detectors, as the µCHCD detector offers good detection capabilities towards halogenated species such as
CCl4 and TCE using only one type of gas with the advantage of operation at atmospheric pressure.
Moreover, the µCHCD ion source can be used in small handheld portable detection devices as it has low
power consumption.
5.5. References
[1] T. Holm, Aspects of the mechanism of the flame ionization detector, J. Chromatogr. A, 842 (1999) 221-
227
[2] J. Wang, H. Wang, C. Duan, Y. Guan, Micro-flame ionization detector with a novel structure for portable
gas chromatograph, Talanta, 82 (2010) 1022-1026
[3] Application note AP-226, Comparison of photoionization detectors (PID‘s) and flame ionization detectors
(FIDs), RAE systems
[4] Q. Jin, W. Yang, A. Yu, X. Tian, F. Wang, Helium direct current discharge ionization detector for gas
chromatography, J. Chromatogr. A, 761 (1997) 169-179
[5] A. Bogaerts, E. Neyts, R. Gijbels, J. van der Mullen, Gas discharge plasmas and their applications,
Spectrochim. Acta B, 57 (2002) 609-658
[6] C. Tendero, C. Tixier, P. Tristant, J. Desmaison, P. Leprince, Atmospheric pressure plasmas: A review,
Spectrochim. Acta B, 61 (2006) 2-30
[7] D.S. Forsyth, Pulsed discharge detector: theory and applications, J. Chromatogr. A, 1050 (2004) 63-68
[8] W.E. Wentworth, H. Cai, S. Stearns, Pulsed discharge helium ionization detector. Universal detector for
inorganic and organic compounds at the low picogram level, J. Chromatogr. A, 688 (1994) 135-152
[9] S. Mendoca, W.E. Wentworth, E.C.M. Chen, S.D. Stearns, Relative responses of various classes of
compounds using a pulsed discharge helium photoionization detector: Experimental determination and
theoretical calculations, J. Chromatogr. A, 749 (1996) 131-148
[10] M.T. Roberge, J.W. Finley, H.C. Lukaski, A.J. Borgerding, Evaluation of the pulsed discharged helium
ionization detector for the analysis of hydrogen and methane in breath, J. Chromatogr. A, 1027 (2004) 19-23
129
[11] J.G. Dojahn, W.E. Wentworth, S.N. Deming, S.D. Stearns, Determination of percent composition of a
mixture analysed by gas chromatography. Comparison of a helium pulsed-discharge photoionization detector
with a flame ionization detector, J. Chromatogr. A, 917 (2001) 187-204
[12] H. Cai, S.D. Stearns, Pulsed discharge helium ionization detector with multiple combined bias/collecting
electrodes for gas chromatography, J. Chromatogr. A, 1284 (2013) 163-173
[13] S.H. Kim, S.M. Nam, K.O. Koh, Y.W. Choi, Analysis of natural gas using single capillary column and a
pulsed discharge helium ionization detector, Bull. Korean. Chem. Soc., 20 (1999) 843-845
[14] M.C. Hunter, K.D. Bartle, P.W. Seakins, A.C. Lewis, Direct measurement of atmospheric formaldehyde
using gas chromatography-pulsed discharge ionisation detection, Anal. Commun., 36 (1999) 101-104
[15] W.E. Wentworth, K. Sun, D. Zhang, J. Madabushi, S.D. Stearns, Pulsed discharge emission detector: an
element-selective detector for gas chromatography, J. Chromatogr. A, 872 (2000) 119-140
[16] R. Gras, J. Luong, M. Hawryluk, M. Monagle, Analysis of part-per-billion level of arsine and phosphine in
light hydrocarbons by capillary flow technology and dielectric barrier discharge detector, J. Chromatogr. A,
1217 (2010) 348-352
[17] R. Gras, J. Luong, M. Monagle, B. Winniford, Gas chromatographic applications with the dielectric
barrier discharge detector, J. Chromatogr. Sci., 44 (2006) 101-107
[18] K. Kunze, M. Miclea, J. Franzke, K. Niemax, The dielectric barrier discharge as a detector for gas
chromatography, Spectrochim. Acta B, 58 (2003) 1435-1443
[19] F.A. Franchina, M. Maimone, D. Sciarrone, G. Purcaro, P.Q. Tranchida, L. Mondello, Evaluation of a
novel helium ionization detector within the context of (low-)flow modulation comprehensive two-dimensional
gas chromatography, J. Chromatogr. A, 1402 (2015) 102-109
[20] L.A. Frink, C.A. Weatherly, D.W. Armstrong, Water determination in active pharmaceutical ingredients
using ionic liquid headspace gas chromatography and two different detection protocols, J. Pharm. Biomed.
Anal., 94 (2014) 111-117
[21] F. Pena-Pereira, L. Marcinkowski, A. Kloskowski, J. Namiesnik, Silica-based ionogels: Nanoconfined
ionic liquid-rich fibers for headspace solid-phase microextraction coupled with gas chromatography-barrier
discharge ionization detection, Anal. Chem., 86 (2014) 11640-11648
130
[22] C.A. Weatherly, R.M. Woods, D.W. Armstrong, Rapid analysis of ethanol and water in commercial
products using ionic liquid capillary gas chromatography with thermal conductivity detection and/or barrier
discharge ionization detection, J. Agric. Food. Chem., 62 (2014) 1832-1838
[23] R.T. Talasek, M.P. Schoenke, Comparison of universal chromatographic detectors for trace gas
analysis, J. Chromatogr. A, 667 (1994) 205-211
[24] A. Bogaerts, R. Gijbels, Fundamental aspects and applications of glow discharge spectrometric
techniques, Spectrochim. Acta B, 53 (1998) 1-42
[25] F. Leis, E.B.M. Steers, Boosted glow discharges for atomic spectroscopy-analytical and fundamental
properties, Spectrochim. Acta B: Atomic Spectroscopy, 49 (1994) 289-325
[26] F. Paschen, Ueber die zum Funkenübergang in Luft, Wasserstoff und Kohlensäure bei verschiedenen
Drucken erforderliche Potentialdifferenz, Ann. Phys., 273 (1889) 69-75
[27] F. Paschen, Bohrs Heliumlinien, Ann. Phys., 50 (1916) 901-940
[28] P. Gill, C.E. Webb, Electron energy distributions in the negative glow and their relevance to hollow
cathode lasers, J. Phys. D; Appl. Phys., 10 (1977) 299-311
[29] H. Eichhorn, K.H. Schoenbach, T. Tessnow, Paschen‘s law for a hollow cathode discharge, Appl. Phys.
Lett., 63 (1993) 2482-2483
[30] G. Stockhausen, M. Kock, Proof and analysis of the pendulum motion of beam electrons in a hollow
cathode discharge, J. Phys. D: Appl. Phys., 34 (2001) 1683-1689
[31] R.M. Sankaran, K.P. Giapis, High-pressure micro-discharges in etching and deposition applications, J.
Phys. D: Appl. Phys., 36 (2003) 2914-2921
[32] K.H. Schoenbach, A. El-Habachi, W. Shi, M. Ciocca, High-pressure hollow cathode discharges, Plasma
Scources Sci. Technol., 6 (1997) 468-477
[33] K.H. Schoenbach, R. Verhappen, T. Tessnow, F.E. Peterkin, Microhollow cathode discharges, Appl.
Phys. Lett., 68 (1996) 13-15
[34] K.H. Schoenbach, M. Moselhy, W. Shi, R. Bentley, Microhollow cathode discharges, J. Vac. Sci.
Technol. A, 21 (2003) 1260-1265
131
[35] K.H. Becker, K.H. Schoenbach, J.G. Eden, Microplasmas and applications, J. Phys. D: Appl. Phys., 39
(2006) 55-70
[36] K.H. Becker, K.H. Schoenbach, In Low Temperature Plasmas. Fundamentals, Technologies and
Techniques, 2nd ed.; R. Hippler, H. Kersten, M. Schmidt, K.H. Schoenbach, Eds.; Wiley-VCH Verlag GmbH
& Co: Weinheim, 2008; Vol. 2, pp 463-493
[37] Q3C(R4) Impurities: Guidelines for Residual Solvents, International Conference on Harmonisation of
Technical Requirements for Registration of Pharmaceuticals for Human Use: Geneva, 2009
[38] W. D‘Autry, Optimization and development of sampling and detection techniques coupled to gas
chromatography in pharmaceutical analysis, Doctoral thesis, Leuven 2010
[39] R.H. Stark, K.H. Schoenbach, Direct current high-pressure glow discharges, J. Appl. Phys., 85 (1999)
2075-2080

132

133
Chapter 6 - General discussion

134
135
Since its introduction, gas chromatography (GC) has been the tool of choice for the analysis of volatile
constituents in various samples from many different fields such as forensics, food, petrochemical and
pharmaceutical industries. GC is also often applied in environmental analysis of various organic
contaminants in water, soil, air, etc. In pharmaceutical analysis, GC is used in quality control to evaluate the
identity, purity and content of active pharmaceutical ingredients (APIs) and excipients. As mentioned above,
the analytes should be volatile as such or after derivatization. Another important area of application is the
identification and quantification of residual solvents. Guidelines about this are established by the
International Conference on Harmonization of Technical Requirements for Registration of Pharmaceuticals
for Human Use (ICH) and are adopted by compendia such as the European Pharmacopoeia.
The most common sampling method in combination with GC is direct injection in which an aliquot of sample
is introduced and evaporated in a hot injector liner. After evaporation, the sample is transferred to the
analytical column where it is separated into individual constituents followed by detection. This approach can
lead to robustness issues for the analysis of residual solvents as many of the APIs are non-volatile
molecules that cannot be evaporated in the injection liner. The repetitive introduction of such samples can
lead to clogging and contamination of the injection system and can possibly lead to the existence of active
sites and damage of the GC column. Another problem is related to the analysis of aqueous samples which
frequently occur in the aforementioned fields. The introduction of large amounts of water into a GC with
direct injection can lead to flooding of the injection liner due to the large expansion volume of water. This
flooding can lead to backlash into the gas lines leading to irreproducible results. Moreover, most GC columns
are not compatible with the introduction of large amounts of water leading to damage of the column.
To avoid laborious extraction procedures for such samples, GC analysis is often performed in combination
with static headspace (sHS) sampling. For detection, the flame ionization detector (FID) is most popular. This
hyphenation of techniques has proven to be a powerful tool for residual solvent analysis in pharmaceutical
products and aqueous samples. However, several shortcomings on both sample introduction and detection
still exist.
First, a typical issue that can be mentioned is the possible occurrence of matrix effects causing recovery
problems. A matrix effect is any interaction in the sample phase that can influence the established
equilibrium in a HS vial and will result in deviating behaviour towards a non-matrix matched calibration
standard. Normally, recovery problems caused by matrix effects are circumvented by matching the
calibration matrix with that of the sample.
136
Another possible way is the use of the standard addition method (SAM) or multiple headspace extraction
(MHE) in order to mathematically correct for a matrix effect. However, matching of calibration standards is
not always possible, as the exact matrix composition is often not known or blank matrix is not available. Both
SAM and MHE approaches are very laborious and SAM can only be performed when sufficient amounts of
sample are available. Apart from these possible matrix effects, a second issue is the poor sensitivity towards
high boiling analytes with a high affinity for the sample matrix when sHS sampling is applied. Increasing the
HS temperature generally promotes the transfer of analytes towards the gas phase leading to a higher
sensitivity. However, this can cause thermal degradation and has as limitation that the sample matrix can
start to boil in the HS vial when a certain HS temperature is reached. Boiling of the sample in a HS vial leads
to irreproducible injections caused by exceeding the maximum tolerable HS pressure. In case of a balanced
pressure system used in this study, vials are pressurised before injection. When the HS pressure is too high
as a result of a boiling sample, a preliminary injection takes place upon puncturing of the vial septum. The
mentioned issues especially play a role for high boiling analytes in a relatively low boiling matrix. By using
the full evaporation technique (FET) these issues can be addressed. By using FET, the complete amounts of
volatile analytes of interest are brought to the vapour phase whereby no analyte in the condensed phase is
left behind. As a consequence, no distribution of an analyte between the condensed and vapour phase is
established. In this way, analyte response cannot be influenced by a matrix effect and even high boiling
analytes can be completely evaporated to the vapour phase under the right analytical conditions. One of the
novelties of this work is the extension of the applicability of FET as explained in the next sections.
In Chapter 2 the use of the full evaporation technique (FET) is proposed as a methodology for the analysis of
a range of typical high boiling apolar analytes in a lower boiling apolar matrix (b.p. > 200 °C). Analytes
included in the study were camphor (C), menthol (M), methyl salicylate (MeS) and ethyl salicylate (EtS) in
various apolar matrices. It was demonstrated that matrix matching of calibration standards was not
necessary by comparison of calibration series to which blank matrix was added. It was found that the slope
and intercept were matching, meaning that possible matrix effects are circumvented by the use of FET for
sample introduction. The methodology was validated for the quantitative analysis of these analytes in several
topical pharmaceutical formulations showing excellent analytical performance. The method was compared to
a conventional sHS method as well and was found to produce similar quantification results for a commercial
sample. For the sHS approach, matrix matched calibration was necessary, making the method much more
laborious. Even with the smaller sample amounts in the HS vial, FET was found to be more sensitive than
the sHS method for the analytes included in the study.
137
The advantages of the FET approach are clear: possible matrix effects can be addressed and sensitivity
issues for high boiling analytes with a high affinity for the matrix can be resolved. Furthermore, FET can be
performed with standard HS equipment and avoids the use of the laborious matrix matching, SAM and MHE
approaches. Apart from these advantages, there are still problems that could arise when the FET approach
is used. For example, as with the conventional direct injection approach, care has to be taken that a certain
maximum sample volume is not exceeded. In case that the solvent and/or analytes are not completely
evaporated, sHS conditions will apply, and hence matrix effects could occur again. Also, HS pressure limits
can exceed the maximum tolerable value and lead to irreproducible injections. Due to its small molecular
mass compared to most solvents, water will give rise to a relatively large gas volume after evaporation, even
when small sample volumes are used. For this reason, the FET approach for aqueous samples does not
allow sample volumes larger than 10 µL to avoid the aforementioned problems. This limited sample volume
restricts the sensitivity for analytes in aqueous samples. To deal with these shortcomings around GC
analysis of aqueous samples, it is demonstrated in Chapter 3 that the use of acetone acetals such as 2,2-
dimethoxypropane (DMP) as water scavenger can be an efficient approach for GC analysis of typical high
boiling analytes with a large affinity for water. By using DMP, water is completely removed from the sample
in which methanol and acetone are formed as reaction products under acidic catalysis. As both these
products are rather volatile, removal of them by using vacuum or a stream of nitrogen is straightforward. This
allows analyte enrichment increasing the sensitivity of FET analysis of aqueous samples. The DMP water
scavenging approach was optimized and finally applied to the analysis of typical high boiling polar residual
solvents such as dimethylsulfoxide (DMSO) in aqueous matrices. It was demonstrated that at least a gain in
sensitivity of a factor 10 can be obtained as compared to FET with a sample volume of 10 µL. The sensitivity
of the method could be improved further by introducing a higher sample volume (e.g. 5 mL instead of 1 mL)
in the HS vial. The method was validated and provided good recovery results. An additional advantage of
DMP water scavenging is that it enables the derivatization of analytes to make them amenable for GC-
analysis. It was demonstrated that for the determination of ethylene glycol (EG) in water, EG is quantitatively
converted to a more volatile dioxolane. Like DMSO, EG is a high boiling polar residual solvent and is
notorious for adsorption to parts of the GC. By conversion to a less polar dioxolane with a significantly lower
boiling point, analysis of EG can be performed by using the simple sHS approach. This approach was
validated and applied to the determination of EG in contact lens fluids.
138
A bottleneck of the DMP water scavenging approach could be the fact that analytes have to be relatively
high boiling in order to be able to retain them in the sample vial during the solvent removal step prior to FET
analysis. In order to improve the sensitivity for more volatile analytes in aqueous samples, FET could be
combined with for instance HS trap that uses an adsorbent for analyte collection leading to a significant
improvement of the sensitivity and could be part of future research. Apart from using DMP as water
scavenger, other chemical reactions could be used as well. An example is the use of tetraethyl orthosilicate
which forms solely ethanol as solvent and silica particles under acid catalyzed reaction with water and could
possibly be used for sHS applications as well. However, it has to be investigated whether these silica
particles do not adsorp the analytes of interest in the HS vial.
Even more challenging is the GC analysis of analytes with a large affinity for water that are not volatile at all.
Examples of such analytes are quaternary ammonium salts (QAS) which are normally analysed by pyrolysis-
GC with a heated injector. This approach can leave non-volatile residues behind and contamination of the
system will occur. As explained before, introduction of large amounts of aqueous QAS samples on a GC
system should be avoided. As a consequence, QAS are usually analysed with capillary electrophoresis (CE)
or liquid chromatography (LC) often combined with mass spectrometry (MS). It is well known that CE does
not offer the best analysis repeatability and ion suppression can be a large issue with MS. As mentioned
above, thermal degradation of analytes could occur with higher HS temperatures. This is however not always
a disadvantage. Chapter 4 describes the analysis of various QAS using a novel in-vial HS reaction combined
with DMP water scavenging as an alternative to pyrolysis-GC, CE and LC. Compared to pyrolysis-GC, this
approach is a clean method of sample introduction leading to a robust method. After screening of various
benzyl substituted QAS with a chloride counter ion, it was revealed that these types of QAS disintegrate
during heating in the HS vial with the formation of benzyl chloride as most abundant volatile product. In case
of QAS that solely form benzyl chloride, quantification can be performed by calibration with benzyl chloride.
Some QAS included in the study, formed chloromethane as side-product and quantification of such QAS can
be performed by using the mass balance of the chlorinated species. The methodology was applied to various
QAS in aqueous samples including denatonium benzoate (DB). Using the approach on DB did not result in a
volatile compound that can be used for quantification of this QAS. However, it was discovered that after
treatment with DMP and hydrochloric acid as catalyst, benzyl chloride is formed during heating of the
sample, enabling the quantitative GC determination of DB.
139
A validation was performed for the analysis of DB in cooling liquids containing a large amount of EG. As in
chapter 3, EG was converted to the corresponding volatile dioxolane. This enabled enrichment of the
samples and provided excellent recovery towards DB in cooling liquids. Another validation was performed for
benzethonium chloride (BZTCl) in aqueous samples. BZTCl is a QAS that yields both benzyl chloride and
chloromethane. Quantification was performed by using the aforementioned mass balance approach leading
to good recoveries of BZTCl. Next to benzyl substituted QAS, other QAS might form other volatile analytical
targets and could possibly be used for quantification purposes. This was however not tested in this work and
could be included for future work.
Finally, within GC analysis many different detectors are used to universally or selectively detect various
volatile analytes after separation. The most commonly used detector is the flame ionization detector (FID)
due to its robustness and good sensitivity for carbon containing analytes. However, the hydrogen diffusion
flame used in the FID is not able to efficiently ionise analytes when they contain too many electronegative
atoms such as chlorine, bromine, sulphur, etc. For example, analytes such as polychlorobiphenyls (PCBs)
contain many chlorine atoms, but do not contain a lot of carbon atoms that can be oxidised. As a
consequence, for those compounds poor sensitivity will be obtained when FID is used for their detection. The
electron capture detector (ECD) is often used as an alternative for these types of analytes. The ECD uses
radioactive material for the production of electrons which gives rise to legislation issues. Although a mass
spectrometer (MS) is a hyphenated technique, it is often used for quantification purposes and can be
operated in modes such as single ion monitoring (SIM) and single reaction monitoring (SRM) to be selective
for a particular analyte. However, the sensitivity of an MS varies over time and the only way to address this
issue is the use of expensive isotopes. Most GC-MS implementations make use of electrons emitted by a hot
filament to perform electron impact ionization. However, this mechanism does not provide the most efficient
ionization of analytes. Only part of the produced electrons and part of the analyte molecules are involved in
the generation of ions. Moreover, MS systems need an expensive vacuum system to operate. So, most of
the disadvantages are related to the ion source of the aforementioned systems.
An alternative way to ionize analytes is the use of an electric plasma. Plasmas can be either in thermal
equilibrium or non-thermal equilibrium. Plasmas in thermal equilibrium possess very high gas temperatures
and are therefore used for typical applications that require heat such as welding and cutting. A typical
thermal plasma used for chemical analysis is an inductively coupled plasma (ICP) capable of atomising
molecules. The use of such plasmas has the disadvantage that all structural information about the analyte is
lost. Non-thermal plasmas have significantly lower gas temperatures, but have a high electron temperature
140
(kinetic energy). This makes it possible to carry out certain chemical reactions or treatments under relatively
mild conditions. Non-thermal plasmas are often used for surface treatment or coating applications. Recently,
a detector that was based on a non-thermal plasma, the dielectric barrier discharge (DBD) detector was
commercialised. In this system analytes are not directly fed into the plasma, but are merely ionised by photo-
ionization and detected by a collector electrode as with the FID. The plasma thus acts as a UV lamp that
emits ionizing photons and no interaction of the plasma with the analytes is established. A more interesting
type of plasma is the micro cavity hollow cathode discharge (µCHCD) for its special feature being the hollow
cathode mode. As the name implies, a cathode containing a hole is used. When the device is operated
under such conditions that the product of the internal diameter of the hollow and the gas pressure is below a
certain value, hollow cathode mode operation is governed. In this mode, electrons are trapped in the hollow
and continuously accelerated from one side of the cathode wall to the opposite side. This is called the
pendulum effect and results in a significant increase in ionization. A µCHCD can be operated at atmospheric
pressure without the need for additional gasses.
Due to these advantages, a detector set-up was developed and constructed using a µCHCD as ion source
and a collector electrode to detect ionized analytes. The results are reported in the last research chapter. It
was found that the orientation of the electrodes and selection of plasma erosion resistant materials are a
prerequisite for a detector with a long lifetime and low maintenance. When the electrodes are made from
more sputter resistant materials such as platinum and placed in a serial axial orientation, a more robust
detector is obtained. It was found that in a serial axial set-up, the clearance angle between the hollow
cathode and anode exit was of large influence on the resulting chromatograms. By adapting a large cathode-
anode clearance angle it was noticed that analyte peaks could generate peaks with either a negative or
positive polarity. At this point, it is possible to detect various analytes including halogenated species at the
lower pg range and the µCHCD detector was found to be more sensitive than an FID. The current prototype
is however still a proof of concept and several aspects of the detector can be improved. Experiments with the
different detector prototypes have been carried out using an electron-valve based ionization amplifier for
robustness reasons. By using a more modern semiconductor amplification device, a signal with less noise
could be obtained. Furthermore, heating of the detector would also be necessary for applications with
analytes that have a higher boiling point to avoid condensation effects inside the detector. For possible future
production, electrode materials other than platinum could be considered. Platinum is an expensive material
and could be replaced by diamond which can nowadays be produced at lower cost. The advantage of
141
diamond is that it can be used as both a dielectric material and electrode. By doping with boron, diamond
becomes conductive and could serve as electrode material in the µCHCD detector.
Next to further development of the above mentioned detector concept, the µCHCD ion source can be
coupled to an ion mobility spectrometer (IMS) for collision induced identification possibilities. In IMS, gas
phase separation of ions occurs in a drift tube against a flow of drift gas. The separation of ions is based on
the fact that every ion has a different charge, shape or size that will give rise to a different drift time. Analytes
can therefore be identified according to their drift time. Other advantages of IMS are apparent as, in contrast
to mass spectrometry, no vacuum system is needed. Moreover, the use of the µCHCD as ion source would
avoid legislation issues that are encountered with radioactive materials that are frequently used for
ionization. Furthermore, such system would be suitable to use as portable system for the detection of
warfare agents, illicit drugs, etc. on for example airports.
142
Summary
In this work, several aspects around headspace (HS) sampling and detection hyphenated with gas
chromatography (GC) were covered. Regarding HS sampling, the results of three studies were reported
around the problems encountered with the analysis of aqueous samples and/or high boiling analytes with a
high affinity for the matrix in chapters 2 to 4 in this manuscript, whilst the final chapter covers the
development and characterization of a novel GC detector.
In chapter 2, the use of the full evaporation technique (FET) for the analysis of high boiling analytes with a
high affinity for apolar matrices was evaluated and compared with the conventional static HS (sHS) sampling
approach. A FET method has been developed and validated for the analysis of typical high boiling analytes
(bp. > 200 °C) including camphor, menthol, methyl salicylate and ethyl salicylate that are often used in
various topical formulations. Data have shown that FET is an excellent approach to circumvent matrix effects
that are often encountered with sHS methods. The method showed excellent recovery and repeatability
during validation and was finally applied on commercial formulations such as Radosalil®, ThermoCream
®,
Vicks Vaporub® and Reflexspray
®.
In chapter 3, acetone acetals were employed as water scavengers for the analysis of aqueous samples
using HS-GC. After optimization of the scavenging reaction conditions, the approach was used for FET
analysis of various typical high boiling polar residual solvents that are miscible with water. The procedure
enabled sample enrichment which provided a significant gain in sensitivity of the FET analysis of these
analytes and it was finally applied on a cefotaxime sample for the quantification of residual N-
methylpyrrolidone (NMP). During experiments it was revealed that the same procedure can be used for the
quantitative derivatization of ethylene glycol (EG) in aqueous samples. The formation of the significantly
more volatile 2,2-dimethyl-1,3-dioxolane (2,2-DD) enabled determining EG using sHS sampling.
In chapter 4, a novel HS approach for the analysis of quaternary ammonium salts (QAS) in aqueous samples
is presented in which the reported water scavenging method from chapter 3 is used for the removal of water
and sample enrichment. Screening experiments revealed that QAS substituted with benzyl and methyl
groups degrade to form benzyl chloride and chloromethane under the used experimental conditions. By
using chloromethane and benzyl chloride for quantification of such QAS, matching calibration standards are
not needed. This means that one kind can be used for the determination of other QAS that also yield
chloromethane and benzyl chloride as reaction products. The methodology was used for the analysis of
denatonium benzoate (DB) in EG based cooling liquids and the analysis of benzoxonium chloride (BZOCL)
or benzethonium chloride (BZTCl) in mouth sprays.
143
Finally in chapter 5, work around the development and characterization of a novel GC detector is presented.
The detector used a micro cavity hollow cathode discharge (µCHCD) plasma as ion source combined with
an either positively or negatively biased capture electrode. Typical advantages of the used low power
µCHCD are the increased ionization efficiency compared to the hydrogen flame used in the flame ionization
detector (FID) and operation at atmospheric pressure without the need for additional gasses. During
development of the µCHCD ion source it was found that the detector geometry was of great influence on the
obtained signal. By adapting to a geometry with a wide anode clearance angle, a sensitive response in the
pg range was obtained for various analytes including carbon tetrachloride (CCl4) which is poorly detected
with the FID. It was noticed that halogenated analytes were possibly subjected to a different ionization
mechanism than the non-halogenated species. Halogenated ones most likely form negative ions in the
electron rich plasma as these were most efficiently detected by a positively biased capture electrode.
144
Samenvatting
In dit werk werden verschillende aspecten behandeld omtrent headspace (HS) extractie en detectoren in
combinatie met gaschromatografie (GC). In hoofdstuk 2 t/m 4 werden verschillende onderzoeksresultaten
gerapporteerd rond de problematiek met HS extractie en/of GC. Hoofdstuk 5 behandelt de ontwikkeling en
karakterisering van een nieuw type GC detector.
Hoofdstuk 2 beschrijft het gebruik van de zogenaamde ‗full evaporation technique‘ (FET) voor de analyse
van analieten met een hoog kookpunt en grote affiniteit voor apolaire matrices. De toepasbaarheid van de
techniek werd getest op typische apolaire hoogkokende analieten (kookpunt > 200 °C) zoals kamfer, mentol,
methylsalicylaat en ethylsalicylaat. Uit de onderzoeksresultaten is gebleken dat FET een goed alternatief is
om typische matrixeffecten te omzeilen waar sHS extractie vaak mee te maken heeft. De uiteindelijk
ontwikkelde methode werd gevalideerd en liet een goede accuraatheid en precisie zien voor de analieten in
kwestie. De gevalideerde methode werd toegepast op de analyse van commerciële producten zoals
Radosalil®, ThermoCream
®, Vicks Vaporub
® en Reflexspray
®.
In hoofdstuk 3 werd het gebruik van een chemische reactie met acetonacetalen behandeld voor de complete
verwijdering van water voor de analyse van waterige stalen met HS-GC. Na optimalisatie van de
reactiecondities werd de methodiek voor de FET analyse van verschillende hoogkokende polaire residuele
solventen in water toegepast. Dit type solventen zijn volledig mengbaar met water en vormen een probleem
voor de veelgebruikte sHS techniek. Het gebruik van acetonacetalen maakt het mogelijk om de gevoeligheid
voor FET significant te verhogen en voorkomt veel problemen rondom de GC analyse van waterige stalen
(kolomdegradatie, overschrijding gascapaciteit liner, etc.). Uiteindelijk werd de gevalideerde methode
toegepast op de analyse van residueel NMP in een cefotaximestaal. Gedurende het onderzoek werd er
aangetoond dat wanneer 2,2-dimethoxypropaan (DMP) wordt gebruikt voor de verwijdering van water,
ethyleenglycol (EG) kwantitatief omgezet kan worden naar 2,2-dimethyl-1,3-dioxolaan (2,2-DD) welk een
veel minder hoogkokend en meer apolair product is. Door deze omzetting met DMP kon EG uiteindelijk
bepaald worden door het toepassen van een eenvoudige sHS methode.
In hoofdstuk 4 werd een alternatieve aanpak gepresenteerd voor de analyse kan quaternaire
ammoniumzouten (QAS) in waterige stalen in combinatie met het verwijderen van water zoals in hoofdstuk
3. Uit initiële experimenten is gebleken dat QAS die gesubstitueerd zijn met methyl- en benzylgroepen
degraderen tijdens HS analyse onder de vorming van chloormethaan en benzylchloride. Door de
kwantificering van chloormethaan en benzylchloride kan de totale hoeveelheid van een QAS indirect bepaald
worden. Doordat verscheidene QAS van dit type op dezelfde manier reageren is een matchende
145
kalibratiestandaard niet nodig en kan elk ander QAS van dit type gebruikt worden. De ontwikkelde methode
werd vervolgens toegepast op de analyse van denatoniumbenzoaat (DB) in koelvloeistoffen. Ook werden
mondsprays geanalyseerd die benzoxoniumchloride (BZOCl) of benzethonium chloride (BZTCl) bevatten.
In hoofdstuk 5 werden onderzoeksresultaten beschreven rondom de ontwikkeling en karakterisering van
een nieuw type GC detector dat gebruik maakt van een ‗micro cavity hollow cathode discharge‘ (µCHCD)
plasma als ionenbron. Deze detector maakt gebruik van een vangstelektrode die negatief of positief
gepolariseerd is. Het gebruik van een (µCHCD) plasma brengt een aantal belangrijke voordelen met zich
mee. De detector kan gebruikt worden onder atmosferische druk zonder dat additionele gassen nodig zijn.
Ook heeft een dergelijk (µCHCD) plasma een verbeterde ionisatiegraad in verhouding tot de waterstofvlam
die gebruikt wordt voor de FID. Gedurende de ontwikkeling is gebleken dat de geometrie van de detector
een grote invloed heeft op het verkregen signaal. Door een grote kathode-anode openingshoek te kiezen
werd er een gevoelige respons (pg-gebied) verkregen voor verschillende types analieten. In tegenstelling tot
de FID was het ook mogelijk om gehalogeneerde verbindingen zoals tetrachloorkoolstof (CCl4) te detecteren
met goede gevoeligheid. Er werd opgemerkt dat de verschillende analieten waarschijnlijk op verschillende
manieren geïoniseerd kunnen worden. Gehalogeneerde analieten konden goed worden gedetecteerd met
een positief gepolariseerde vangstelektrode, wat erop duidt dat dit type verbindingen negatieve ionen
zouden kunnen vormen door de vangst van elektronen in het plasma.