curse or blessing? how institutions determine success in ... · 3 “ economic and social stagna -...
TRANSCRIPT

PolicyAnalysis
EXECUTIVE SUMMARY
Peter Kaznacheev, PhD, is a visiting lecturer and director of the Centre for Resource Economics at the Russian Academy of National Economy and Public Administration and managing partner at Khaznah Strategies Ltd.
One of the main reasons for the drop in oil prices that began in 2014 was a rapid in-crease in U.S. oil production—it reached the level of the other two biggest produc-ers, Russia and Saudi Arabia, that same
year. That, in turn, decreased U.S. demand for imported petroleum and hence put downward pressure on the oil price worldwide. There is one aspect of the shale revolu-tion which gets much less attention than geopolitical or environmental issues: what were the institutional condi-tions that allowed the technological innovation to happen? In essence, it was a combination of secure property rights, a favorable tax regime, minimal red tape, and a strong en-trepreneurial culture (there were around 13,000 small U.S. oil companies fiercely competing with each other).
This paper explains how the quality of institutions determines whether natural resource abundance is a bless-ing or a curse: will it boost or stifle innovation and eco-nomic development? Institutional deficiency in resource
economies perpetuates rent-seeking, autocracy, and slower economic growth as illustrated by multiple examples. One of the most alarming among them is Venezuela. While the country possesses the largest oil reserves in the world it is at a brink of economic collapse and is struggling with mass food shortages.
Nonetheless, the evidence presented in this paper is at odds with the “resource curse” hypothesis that mineral-exporting countries are doomed to stagnation. A number of countries with high levels of economic freedom, such as Australia, Canada, Chile, and Norway, demonstrate that it is possible to build a prosperous and innovative economy with a significant share of income from the sale of minerals. Furthermore, sound institutions can help diversify the economy and weather the storm of low com-modity prices. As exemplified by several countries in the 1980s and in later years, petroleum exporters with strong institutions can achieve positive growth even during oil price drops.
January 11, 2017 | Number 808
Curse or Blessing? How Institutions Determine Success in Resource-Rich EconomiesBy Peter Kaznacheev

2
“The lower the quality of institutions, the more profitable it became to engage in rent-seeking.”
INTRODUCTIONAlthough more than half a century has passed
since the creation of the Organization of the Pe-troleum Exporting Countries (OPEC) and its redistributive model of “resource nationalism,” many OPEC countries have not lived up to expec-tations and have not experienced an acceleration of growth.1 In general, the results were negative: pri-vate investment was crowded out, rent-seeking and corruption increased, and overall productivity fell.
Employing a barrage of populist anti-colonial rhetoric, authorities in the developing countries that account for most of the global production of hydrocarbons seized control of resources through expropriation, nationalization, and abrupt changes in the terms of contracts with international companies. Effective government control in the mineral industry, which was higher than in other sectors, created numerous oppor-tunities to extract rents. The peak of “resource nationalism” came in the 1960s—and in its wake OPEC was created. Institutional development in those countries then began to decline. And the lower the quality of institutions, the more profitable it became to engage in rent-seeking, and the less profitable it became to engage in productive entrepreneurship.
In the first decade of the 21st century, high oil prices served to prop up inefficiencies in public administration in a number of oil economies. Over time, even high prices became insufficient for boosting economic development because of corruption and institutional deterioration. As a result, economic and social stagnation occurred in many petrostates even during the long period of inflated oil prices (2002–14). Such stagnation is one of the reasons for growing discontent in several petroleum-based economies.
July 2014 marked the beginning of the most significant decline in oil prices since the 1980s (see Figure 1.) Several factors that increased supply and slowed demand have changed the global oil market. One of the main reasons for the drop in oil prices was a rapid increase in U.S. oil production, which in 2014 reached the level of the other two biggest producers, Russia and Saudi Arabia. Greater reliance on domestic production has decreased U.S. demand for im-
ported oil and hence has put downward pres-sure on the oil price worldwide.
In addition, the rapid increase in shale gas production, accompanied by a drop in domestic gas prices in the United States, has increased the share of gas in the overall U.S. energy mix, less-ening U.S. dependence on oil in particular.2 All in all, the U.S. “shale revolution” is having a ma-jor impact on global energy markets. Moreover, the drop in oil prices is a result not only of the rapid increase in production but also of the slow-down in consumption. The world as a whole and Western countries in particular have made a big leap toward efficient energy consumption. For instance, one major development has been the decrease in the volume of liquid fuel consump-tion in engines. Various types of technological innovations have occurred simultaneously that have contributed to the drop in oil prices.
Since oil prices began to fall in 2014, eco-nomic and institutional deterioration in many petrostates has accelerated. Other mineral com-modities, such as metals and coal, have also expe-rienced depressed prices since 2011. That factor has put many mineral-exporting countries under significant pressure to adjust their policies and institutions. In recent years, Russia, Venezuela, Nigeria, Brazil, and Malaysia all saw civil pro-tests. All in all, low commodity prices push gov-ernments to improve public administration and seek alternatives to old models of governance and the redistribution of rents.
This paper argues that resource economies (economies reliant on exports of natural resourc-es)3 with better economic and political institu-tions manage their revenues better than countries with poor institutions and can achieve superior results in economic growth and social develop-ment. The evidence presented here is at odds with the “resource curse” hypothesis that stipulates that mineral-exporting countries are doomed to stagnation. The quality of institutions is what es-sentially determines whether natural resource abundance is a blessing or a curse. Furthermore, strong institutions can help achieve long-term growth during periods of low commodity prices. To support that argument, the performance of re-source economies in different parts of the world

3
“Economic and social stagna-tion occurred in many petrostates even during the long peri-od of inflated oil prices.”
is compared in relation to their institutional rank-ings, the property structure of their extractive in-dustries, and other key parameters.
The first section provides an overview of ma-jor studies of resource economies. It compares various approaches to such issues as the “Dutch disease” and the effects of commodity price vol-atility. Experience shows that mineral-exporting countries are by no means cursed by their re-source wealth. An alternative to the resource curse hypothesis emphasizes the positive influ-ence of the rule of law and strong property rights and the negative role of rent-seeking, which ap-pears to be one of the main hindrances to eco-nomic development in resource economies.
The second section looks at policy choices facing resource-based economies. It examines such policy areas as the institutional climate, the government’s share in oil companies, sta-bilization funds, and government investments. The economic and social performance of re-source economies depends primarily on the
strength of their institutional framework, of which economic freedom is a key component.
The third section looks at the institutional conditions for major innovations in extractive in-dustries, such as the shale revolution and break-throughs in the development of other unconven-tional resources. It then briefly summarizes the experience of four countries—Australia, Canada, Chile, and Norway—and looks at particular poli-cies that allowed them to achieve more rapid growth and higher levels of social development compared with peer countries with resource-based economies. Finally, this section looks at the experiences of oil-exporting countries that managed to maintain high growth rates during the crude price drop in the 1980s.
RENT-SEEKING AND THE QUALITY OF INSTITUTIONS
This section provides an overview of major studies of resource economies and compares
Figure 1Real and Nominal Oil Price (monthly) since January 1972
Source: U.S. Energy Information Administration, author’s calculations, www.eia.gov/forecasts/steo/realprices/real_prices.xlsx.

4
“Greater reliance on domestic production has decreased U.S. demand for imported oil and hence has put downward pressure on the oil price world-wide.”
various approaches to problems associated with dependency on mineral rents. It analyzes the phenomenon of rent-seeking, which appears to be one of the main obstacles to economic de-velopment in resource-exporting states.
The Resource Curse Hypothesis vs. the Institutionalist Approach
Although some economists have raised doubts about the role of natural resources in economic development, up until the late 20th century, no significant efforts had been made to study the possible negative impact of re-source dependency. One of the possible rea-sons for that was the commonsense view that a country’s natural resources should positively affect its economic growth. Several authors have argued that natural resources—notably coal as a source of energy—were among the primary drivers of the Industrial Revolution.4
That approach started to change in the 1990s with the publication of several notable stud-ies. American scholar Terry Lynn Karl spent two decades studying the experience of trou-bled petrostates. The results of that research are contained in her 1997 book The Paradox of Plenty: Oil Booms and Petro-States.5 She identified some of the resource economies with the most evident institutional failures. One of the most notable cases is that of Venezuela. Venezuela’s economy is remarkable in several ways. With regard to its real gross domestic product (GDP) per capita, Venezuela went from being one of the most well-off countries in Latin America and worldwide in the 1950s to a period of stag-nation and even decline. Over two decades, its real income per capita declined by 25 percent. In 1988, 2.4 percent of Venezuelans were living below the poverty line. But by 1998, when Hugo Chávez was elected president, that figure had risen to 18.5 percent.6
Few people realize that Venezuela’s current oil reserves are the largest in world. They are about a dozen times larger than what Venezuela had at its disposal in the 1980s. An oil-abundant and oil-dependent autocratic government need not concern itself with income per capita, pov-erty, inequality, and other indicators of the well-
being of its general population, but one would imagine that it would at least maintain oil pro-duction in order to fill government coffers. Yet Venezuela’s example refutes even that intuitive assumption. It is hard to believe, but Venezue-la’s overall oil production is actually lower today than it was half a century ago.7
Venezuela is not the only country that has failed to realize its hydrocarbon potential. Iran is another peculiar case. It possesses the largest combined oil and gas reserves in the world and is second only to Russia in natural gas reserves. It could clearly have been a frontrunner in nat-ural gas exports with a booming economy. But although sitting on enormous reserves, in 2014 it was actually a net gas importer.8 Something must be wrong with a country’s institutions and policies if even its own oil and gas industry, a government cash cow, can go into stagnation. Apart from Venezuela and Iran, Libya repre-sents one of the most unfortunate examples of institutional failure among oil-exporting coun-tries. As shown in Figure 2, Libya’s GDP per capita went through a rapid adjustment from six times the world average in 1977 to below the global median income in a quarter of a century.
One of the first significant systematic stud-ies of economic problems associated with natu-ral resources was published in 1995 by Jeffery Sachs and Andrew Warner.9 That study laid the foundation for what later became known as the resource curse hypothesis. The study’s main finding was that economies with a high ratio of natural resource exports to GDP grew slower than the world average during the 20 years from 1970 to 1990. Even after accounting for a number of variables that correlate positively with economic growth, a negative relationship between economic growth and resource depen-dence was still evident. They also found that lowering the share of natural resources in over-all exports by 10 percent causes an increase in growth of 1 percentage point.
A number of economists conducted simi-lar analyses to test their findings. For example, Xavier Sala-i-Martin published a 1997 paper, provocatively titled “I Just Ran Two Million Regressions,”10 in which he confirmed the find-

5
“The qual-ity of institu-tions is what essentially determines whether natu-ral resource abundance is a blessing or a curse.”
ings of Sachs and Warner. Sala-i-Martin identi-fied 22 variables that had a statistically signifi-cant influence on economic growth—natural resources were one of those identified as having a negative effect.
In the 1990s many economists agreed on the existence of a “resource curse.” The phrase it-self was coined by Richard Auty, an economist who specializes in the influence of natural re-sources on economic development. But simply stating that mineral resources have a negative effect on growth was insufficient. An explana-tion was needed. Hence, several approaches emerged that emphasized various channels through which resource dependency hinders growth. The earliest explanations focused on economic channels. Sachs and Warner conclud-ed that it was the effect of the “Dutch disease”11 that economists had studied since the 1970s.12 The expression stems from the Dutch econom-ic crisis of the 1960s following the discovery of North Sea natural gas. It refers to the effect of an inflow of foreign currency from commodity
exports. The resulting local currency apprecia-tion makes the country’s nonmineral products less competitive on the global market. Cheaper imports can also suppress domestic manufac-turing. In the 2000s, a group of authors still following the economic channel approach also investigated the influence of commodity price volatility on growth and development.13
In recent years, as more rigorous econo-metric analysis has been conducted using new, more extensive data sets, doubts about the resource curse hypothesis have begun to emerge. Several economists arrived at dif-ferent conclusions concerning the effects of natural resources. First, there were doubts about the particular time period that Sachs and Warner chose to analyze. In 2001 Osmel Manzano and Roberto Rigobon14 argued that in the historical period used by Sachs and Warner (1970–1990), a significant commod-ity price drop that started in the 1980s lasted for 20 years (this period is sometimes referred to as the “1980s oil glut”). That price decrease
Figure 2Real GDP per Capita (PPP) As Percentage of World Average in Three Oil & Gas Economies Since 1963
Source: World Bank Open Data, author’s calculations, http://data.worldbank.org/topic/economy-and-growth.

6
“Mineral-exporting countries are by no means cursed by their resource wealth.”
might have had a negative effect on economic growth. Furthermore, they argued that the high commodity prices of the 1970s allowed governments of resource-exporting countries to go on a borrowing spree, which created a debt overhang that in turn further slowed growth. After correcting for those factors, the resource curse was no longer identifiable.
In 2007, two economists at the World Bank, Daniel Lederman and William Maloney, raised doubts over the very attempt to gener-alize about the effect of natural resources on growth and development.15 They suggested that some of the indicators used in previous analyses might be unrelated to relative natural resource endowments.16 They concluded that economists have been trying to generalize about the effect of resource abundance while failing to discover precisely which character-istic is affecting growth negatively. A number of other economists looked at more extensive
data sets covering longer time periods and dis-covered that natural resources had either no influence or a very weak influence on growth.17
Doubts about the direct economic impact of resource abundance encouraged a num-ber of authors to look for a hidden channel through which natural resources might affect development. Although the macroeconomic explanation emphasized such issues as the Dutch disease and price volatility, a dissenting group of institutional economists developed an alternative approach, one that considered institutional deficiencies as the main factor in-hibiting growth in resource economies.
It is important to stress the difference between two schools of thought within the institutional approach. One stems from the resource curse hypothesis and sees natural resource abundance as a cause of institutional degradation and corruption within the ruling elite, which consequently affects growth and
Figure 3Resource Abundance and Economic Growth: Major Schools of Thought

7
“Venezuela’s overall oil production is actually lower today than it was half a century ago.”
development. Essentially, the resource curse becomes an “institutional curse.”
The other school of thought, “institution-alism,” also emphasizes institutions, but the causality works in the opposite direction: countries abundant in natural resources are not condemned to develop deficient institu-tions, but rather weak institutions are them-selves the reason for the slowdown in growth and development. Figure 3 displays the various approaches to examining resource economics.
The two schools of thought—the resource curse hypothesis, which emphasizes the insti-tutional channel for the “curse,” and institu-tionalism, which considers weak institutions to be the primary issue—have a lot in common. Both stress the vital role of institutions. Yet the practical policy implications of the two approaches are distinctly different. It is easy to see why. For the resource curse hypothesis, natural resources are the problem, and hence the solution is essentially to decrease econom-ic reliance on resource sales. For the institu-tionalist approach, resources per se are not the issue or at least, one could argue, not the main issue. A number of countries illustrate how a large proportion of natural resource exports can exist alongside a developed institutional framework (I will look closer at such examples later). Institutions are thus viewed as the key factor determining the development trajec-tory of resource economies, and therefore policy recommendations are aimed mostly at improving the institutional framework.
The institutionalist approach has practical and analytical advantages. It looks at the root of the problem and provides a better foundation for long-lasting policies. As with any issue, how-ever, it is not black and white. Limiting oneself to a single school of thought is not a very practi-cal position. Although institutions are essential, that is not to say that natural resources per se do not matter. A balanced institutionalist position would acknowledge that although countries re-liant on resource exports are not doomed to fail or stagnate, they may face certain difficulties in implementing pro-growth policies. Certain institutions in resource economies may play a
greater role than in resource-poor economies; consequently, weak implementation of those institutions may have a stronger negative ef-fect. This subject will be discussed in more de-tail later. It would therefore be more accurate to speak of a “resource challenge” rather than a “resource curse.”
It is clear, however, that the institutional approach has been gaining ground in the field. The reason the institutional approach is start-ing to replace the resource curse hypothesis was well captured by Andrew Rosser.18
Scholars have been asking the wrong question: rather than asking why natural resource wealth has fostered various po-litical pathologies and in turn promoted poor development performance, they should have been asking what political and social factors enable some resource abundant countries to utilize their natu-ral resources to promote development and prevent other resource abundant countries from doing the same.
The outcomes of analyses of resource-abundant countries’ performances vary sig-nificantly depending on the data used and the time periods examined. As a result, the con-clusions of different authors range between a negative effect19 of resource abundance on growth and no significant effect20 or even a positive effect.21
Those findings raise another important question: what actually is resource abundance and which countries qualify as resource econ-omies? That question has many possible an-swers. The two most common measurements of resource abundance are the ratio of natural resource exports to overall exports and the ra-tio of natural resource exports to GDP. This paper uses both criteria in the following way: a country is resource dependent if over 25 per-cent of its exports consist of natural resources and the ratio of natural resource exports to GDP exceeds 10 percent. A number of authors use the former criterion, which is consistent with the definition of resource-dependent

8
“It would therefore be more accurate to speak of a ‘resource challenge’ rather than a ‘resource curse.’”
countries used by the International Monetary Fund (IMF). The latter criterion is added to ensure that countries with very low volumes of overall exports do not fall into the abundance category. The Appendix provides a full list of countries that qualify as resource economies, on the basis of data from both the IMF and the United Nations Conference on Trade and Development (UNCTAD).
The Dutch Disease and Its Impact At the end of the 1950s, several significant
offshore natural gas discoveries were made in the Netherlands. Gas exports had a strong economic effect, causing an appreciation of the Dutch guilder and a contraction in the nonextractive industries. That effect gave rise to the term “Dutch disease,” which was coined in 1977 by The Economist.22 The Dutch disease was the first instance where this economic phenomenon was thoroughly studied.23 To be more precise, the Dutch disease is not just a single consequence of increased mineral ex-ports but a series of several effects.
The impact of the oil or gas boom on the broader economy can be divided into three main effects: the “resource movement effect,” the “spending effect,”24 and the “exchange rate effect.” Let’s assume that a small open economy has three major sectors: a manufacturing sector, a nontradable (service) sector, and a resource sector, which emerges quickly as a result of, say, a major oil discovery, causing a boom in oil exports. The “resource movement effect” pro-duces a shift of labor and capital to the resource sector from the rest of the economy as profits and wages in the resource sector begin to rise. The “spending effect” occurs when—as a result of windfall earnings in the resource sector—de-mand for both tradable and nontradable goods rises. However, the effects on the two sectors differ. In the nontradable sector, increased de-mand for services is met by an increase of sup-ply and a consequent rise in both prices of non-tradables and wages in the nontradable sector. But increased demand for tradable goods is met by increased imports, not by an increase in de-mand for domestic manufacturing goods.
Here the “exchange rate effect” comes in. It occurs as a result of an increased inflow of foreign currency (U.S. dollars in the case of oil exports), which causes the domestic currency to appreciate. The appreciation of the real ex-change rate of domestic currency has a double effect on the manufacturing sector: (a) it sup-presses demand for domestically manufac-tured goods, as imported goods become more affordable; and (b) it decreases exports of manufactured goods, as they also become less competitive in the international market as the relative value of domestic currency increases.
The Dutch disease is a well-studied and well-documented phenomenon. The fact that it exists and that there are certain mechanisms through which it affects a resource-exporting country’s economy is accepted by almost all economists who study the issue. What is much less clear is whether it has any considerable negative effect on overall economic growth as such or on social development. If it has a nega-tive effect in either area, then it is important to determine how that effect, or effects, can be mitigated through public policies.
It is worth clarifying any confusion between two distinctively different questions. One is, does the Dutch disease change labor and capi-tal allocation in a resource economy and thus its very structure? Based on the evidence, the answer to that question is yes. However, a dif-ferent question is, are those structural changes negative and, more specifically, do they have a negative effect on growth? Although it may appear to many people that the Dutch disease slows down economic growth and is therefore an unambiguously negative phenomenon, some commonsense analysis casts doubts over that conventional view.
In essence, the Dutch disease is an ad-justment to a new economic situation that emerges as a result of increased commodity exports. Such economic adjustments happen in all open economies, not just in resource-exporting ones, as a reaction to higher returns on both labor and capital in specific industries. A contraction in the manufacturing tradable sector is simply evidence of relatively higher
9
“What is initially marketed as a remedy for the Dutch disease often becomes a source of economic problems itself.”
returns in other industries (extractive and nontradable). Such shifts in economic equilib-riums occur constantly because of technologi-cal progress and global competition. A major business or technological innovation may shift the balance of labor and capital allocation if an economy gets a boost from developing a new export product.
An example is a high-tech product that matches a certain trend in global technologi-cal development and thus rapidly increases international demand for it (Finnish corpora-tion Nokia’s mobile phones in the 1990s and 2000s come to mind). Few would see that as a negative development. Yet when a boom happens in the natural resources sector, it is received with a mixture of anxiety and suspi-cion. It is true that some empirical evidence points to cases of economic and institutional failure in resource-dependent countries. And the Dutch disease may exacerbate the state of such an economy through the channels de-scribed above. But that is different from say-ing that the Dutch disease is to blame for such misfortunes in the first place.
An increase in income through the sale of natural resources, other things equal, accounts for a proportionate increase in GDP. Although it may be accompanied by a contraction in nonresource manufacturing, that does not mean that GDP growth will unavoidably suf-fer from this reallocation of sources of income. It is, in fact, much more likely to increase. Fur-thermore, undermining the argument about the Dutch disease as a source of stagnation in many resource economies, Dutch disease ef-fects are very limited because there is either a very small or practically nonexistent manufac-turing sector to start with, such that, by defini-tion, no reallocation can occur. Nonetheless, countries with only resource and nontradable sectors have experienced slowdowns and even negative growth (for example, several Middle Eastern countries in the 1980s). To understand the nature of stagnation in some resource economies, one must seek a different explana-tion, which is explored later.
A number of economists subsequently
reached the conclusion that the effects of the Dutch disease were not the primary drivers of resource economies’ growth trajectories. For instance, Raymond Mikesell25 analyzed the performance of a group of resource-exporting economies and concluded that for the major-ity of them the Dutch disease had no effect on their growth patterns. Gary McMahon comes to similar findings in his study.26 Ragnar Tor-vik argues that output and productivity can ei-ther increase or decrease in both tradable and nontradable sectors, depending on the struc-tural and institutional characteristics of the economy.27 The latter view appears more accu-rate. An open-market economy with low entry barriers and minimal obstacles to businesses will adjust to both the “resource movement effect” and the “spending effect” of increased commodity exports, just as it adjusts to any other changes in its export structure.
Thus, the Dutch disease can be looked at in different ways. In a narrow sense, it is about the reallocation of resources among various sectors. To view it is a “disease”—a problem in and of itself—means to apply a certain value judgment and a preference toward a certain way of generating income, that is, the nonre-source tradable sector, usually concentrated in manufacturing. It then essentially becomes much more of a political than an economic issue. And that is indeed what has happened in many resource economies. In an attempt to “save” the contracting nonresource manu-facturing sector, governments created subsi-dized dependent industries, which dragged their respective economies into an economic slowdown. Thus, what is initially marketed as a remedy for the Dutch disease often becomes a source of economic problems itself.
The question, then, is whether any correc-tive action is required for the Dutch disease and specifically for the exchange rate effect. That question has no straightforward answer. It depends on the degree of resource depen-dence, the size of the economy, and its share in the production of a particular commodity on the world market. Furthermore, the exchange rate effect is not entirely negative either. It

10
“The price volatility hypothesis seems to make somewhat more sense than the Dutch disease hypothesis.”
may make some exported goods less competi-tive, but it does have the effect of making all imported goods more affordable. The net ef-fect depends on a variety of factors that are specific to each individual economy.
To prevent abrupt hikes of the nominal and real exchange rate of the domestic currency, it would be advisable for a government to have a mechanism in place to sterilize excess inflows of foreign currency, such as a stabilization fund or another similar venture. That practice has been widely adopted throughout the world and has generally allowed governments to keep a lid on the exchange rate of their respective currencies, as well as to save money for a rainy day when com-modity prices go down. Since the sharp drop of oil prices in 2014, the relevance of commodity price volatility and the importance of having enough government savings to weather the storm of low prices have risen tremendously. Consequently, worries about the Dutch disease and adverse ef-fects of windfall profits have diminished signifi-cantly as profits themselves have fallen sharply.
The Economic Influence of Commodity Price Volatility
Given the above-mentioned doubts about the negative influence of the Dutch disease, sev-eral economists sought an alternative economic channel that could have a negative effect on some resource-dependent countries. That led to the emergence of what can be described as the “vola-tility curse” hypothesis. The main idea is that the problem is not resource dependence per se, but rather the volatility of mineral commodity prices in the global market. Observation of the harmful effects of commodity price volatility was one of the outcomes of broader research into resource economics in the 1990s. Raymond Mikesell found that economies with a high proportion of natural resource exports over the two decades between 1972 and 1992 experienced an overall trade volatility three times greater than nonre-source economies.28 Both Mikesell and Auty sug-gested that revenue volatility may be one of the major causes of economic slowdowns in resource economies.29 Other studies published later fo-cused specifically on the price volatility effect.30
For example, regression analyses conduct-ed by Tiago Cavalcanti, Kamiar Mohaddes, and Mehdi Raissi showed that, for 62 primary commodity-exporting countries, price booms themselves had a positive impact on GDP growth.31 However, volatility of prices and con-sequent volatility of export earnings affected it negatively. For the remaining resource-poor countries, volatility of commodity prices had no effect on their total factor productivity, investment patterns, or GDP growth. Given that resource-poor countries are still consum-ing natural resources and thus are also affected by price volatility as consumers and import-ers of oil, gas, and other minerals, Cavalcanti, Mohaddes, and Raissi’s findings suggest that price volatility can harm growth only at a suffi-ciently high level of economic dependency on income from a certain export product. Thus, the more sophisticated argument is that only a sufficiently high degree of price volatility, of-ten seen in natural resources, is distractive.
The price volatility hypothesis seems to make somewhat more sense than the Dutch disease hypothesis. The Dutch disease hy-pothesis essentially argues that through sev-eral channels, high income from the sale of natural resources harms rather than accelerates growth. But common sense would lead us to the opposite conclusion: extra income generates extra growth. And many, though not all, eco-nomic regressions demonstrate exactly that. The price volatility hypothesis makes a differ-ent argument: reliance on mineral commodity exports harms growth through the external vol-atility of prices. Such fluctuations do not allow the economy and its main players, both private and public, to adjust; thus, such fluctuations impede innovation, investment, and develop-ment. Volatility harms fiscal policies, public spending in particular, as the government is left with less money to spend at times of low prices.
Although it raises legitimate questions, the volatility curse hypothesis suffers from several problems. First, exactly as with the Dutch dis-ease, it is difficult to see how natural resources generally differ from other commodities trad-ed in an open international market. Some de-

11
“Extractive industries have developed mechanisms to mitigate commodity price volatility and avoid a volatility curse.”
gree of volatility is inherent in the very nature of all commodity prices or indeed any prices in a free market. Second, many goods, such as certain consumer goods, medicines, and high tech devices, are subject to intense price vola-tility. Nonetheless, one never hears about a “gadget price volatility curse.”
There is another reason to be skeptical about the volatility curse hypothesis. If one is to believe that commodity price volatility is the source of trouble for economic growth in gen-eral, then that implies that the firms that are most exposed to that harmful volatility—that is, companies in extractive industries, refining, petrochemicals, and so forth—would be affected to an even greater extent. Oil companies, for example, suffer from a 100 percent exposure to oil price volatility, whereas governments of oil-producing countries are exposed to it only to the degree to which their budgets are dependent on oil incomes (that can be higher or lower, but only in a handful of countries does it come close to 100 percent). However, if we look at long periods of time, oil companies demonstrate roughly the same returns on investment as firms in other sec-tors. Evidently, extractive industries have devel-oped mechanisms to mitigate commodity price volatility and avoid a volatility curse.
Governments of resource economies could benefit from studying such mechanisms and applying them to government finances. Some of the methods used by private companies include hedging through various financial in-struments, insurance, scenario analysis, cor-porate planning, and cost reductions. Using such instruments in a competent and strategic manner could be generally described as efficient management. This efficient management is pre-cisely what allows some businesses to thrive under price volatility. And the lack of it is what makes other businesses go under.
Price fluctuations are just one of the many risks that any business has to take into account and manage. All of that seems to be self-evident when applied to businesses, but somehow it disappears entirely when economists look at countries and, particularly, their governments. Then volatility suddenly changes from a risk to
a “curse.” In that sense, the price volatility hy-pothesis does not fundamentally differ from the Dutch disease or any other similar approach that essentially falls into the resource curse paradigm.
One example of successful hedging policies in an oil-exporting economy is Mexico. Agus-tin Carstens, a Chicago University–trained economist and the current governor of the Central Bank of Mexico, has been pursuing a persistent and sophisticated hedging strategy in Mexico. Since the beginning of the decade, Mexico has been selling 25 percent of its an-nual crude output forward (about 200 million barrels). During the latest oil price plunge, the Mexican government benefited from the hedge quite substantially: although the price at which it hedged its sales in 2015 was $76.40 per barrel, the actual average price that year fell about a third below that number.32
The basic argument—explored in the fol-lowing section—is that instead of fighting vari-ous “curses” and “diseases,” governments would do much to look inward and analyze their own performance, along with the shape and role of the institutions that they create, maintain, and occasionally destroy. In that sense, both the Dutch disease and the effect of commodity price volatility are essentially institutional rather than purely economic problems. Both become ob-stacles under specific circumstances, which are usually associated with the lack of certain insti-tutions. It would also be helpful to supplement public administration tools with those already successfully employed by companies (for exam-ple, those for managing price volatility). Various governments have done exactly that by creating stabilization funds and other similar measures.
Mikesell captured the role of price volatil-ity and the effects of the Dutch disease in re-source-reliant economies in the following way:
A legitimate question is whether the shocks caused by primary commodity export booms are more serious than the shocks experienced by resource poor countries. Perhaps they are, but they can be handled by adopting appropriate policies.33

12
“Instead of fighting various ‘curses’ and ‘diseases,’ governments would do much to look inward and analyze their own perfor-mance.”
On a more fundamental level, although adopt-ing private-sector practices may alleviate some of the difficulties that publicly owned corporations face, it won’t solve multiple problems inherent in state-dominated industries. The more efficient solution (which is often also more politically cumbersome) is to introduce more actual private management into resource industries through the process of privatization. For instance, a study by Erika Weinthal and Pauline Jones Luong ar-gues that more private ownership in the industry would increase overall efficiency and also boost government income. Thus, in their view, to avoid the resource nationalism problem, domestic pri-vate ownership by national private companies is a more feasible solution.34
Producers vs. “Grabbers”: Rent-Seeking under Different Institutional Frameworks
Rent-seeking is a prominent feature of many petrostates. It is certainly not unique to petro-states, but it does appear to have a particularly strong effect on them and to cause institutional weaknesses. Rent-seeking is not just corruption through bribery. Although the latter is very often part of rent-seeking, it is helpful to distinguish between illegal and legal rent-seeking activities. Corruption and bribery are in the first category, whereas the second includes a broad range of activities, such as creating regulatory barriers to entry, ring-fencing mineral licenses for a certain group, or channeling state subsidies.
Several authors have explored the phenome-non of rent-seeking.35 In 2006, Halvor Mehlum, Karl Moene, and Ragnar Torvik suggested an analytical model for examining which econom-ic forces are at play in resource economies.36 They also went one step further and looked at why some countries are negatively affected by rent-seeking, and some are not. Mehlum, Moene, and Torvik’s model suggests how rent-seeking can influence economic growth under different institutional conditions.
They begin by establishing the distinc-tion between production and special forms of rent-seeking. They argue that all forms of rent-seeking can be harmful to economic develop-ment but not to the same degree. The produc-
tive economy and rent-seeking can be either complementary or competing, and it is the lat-ter that is more harmful to growth and develop-ment. Rent-seeking competes with production when institutional quality is poor. The authors provide some illustrations:
Dysfunctional democracies invite po-litical rent appropriation; low transpar-ency invites bureaucratic corruption; weak protection of property rights in-vites shady dealings, unfair takeovers and expropriation; weak protection of citizens’ rights invites fraud and venal practices; weak rule of law invites crime, extortions and mafia activities; a weak state invites warlordism.37
Mehlum, Moene, and Torvik call the most harmful type of rent-seeking“grabbing” and call institutions that increase returns on such rent seeking “grabber-friendly.” The better the qual-ity of institutions, the less profitable it is to be engaged in grabbing, and the more profitable it is to be engaged in production.
They then go on to establish two possible frameworks: a resource economy with grabber-friendly institutions and one with producer-friendly institutions. Let us imagine that in both of those economies, a major new oil discovery is made, which swiftly increases income from oil ex-ports. In an economy with grabber-friendly insti-tutions, resource income provides a new source of income for grabbers, bringing their profits up, while producers’ profits remain unchanged. The result is fewer producers, more grabbers, and lower income for all. That is exactly the situation that is described as “the paradox of plenty,” when higher resource income reduces total income.
Under grabber-friendly institutions, the se-quence of developments is as follows: high re-source rents pull entrepreneurs into grabbing. That causes profits in production to go down, which in turn pushes even more entrepreneurs into grabbing. Grabbers generate negative ex-ternalities, and producers generate positive externalities. This explains why the negative income effect from this reallocation of entre-

13
“A better institutional environment in resource countries correlates with higher income per capita, higher living standards, and more social develop-ment.”
preneurs dominates the direct positive income effect of more resources.
In an economy with producer-friendly in-stitutions, increased receipts from the sale of natural resources provide an additional source of income for producers and consequently shift production profits upward. The result is more producers and fewer grabbers. Furthermore, in a producer-friendly system, increased income from natural resources stimulates overall produc-tion. Its boost to overall incomes is higher than the incremental increase from the sale of miner-als alone. That happens because positive com-plementarities exist between various producers. Thus, Mehlum, Moene, and Torvik’s model has a multiplier effect in resource economies, such that both positive and negative tendencies get amplified. In essence: “With producer-friendly institutions natural resources stimulate produc-tion. With grabber-friendly institutions natural resources hamper production.”38
Mehlum, Moene, and Torvik suggest a vi-sual representation of patterns of growth in different economies (see Figure 4). They com-
pare four hypothetical countries: resource-poor countries A and A*, where country A has grabber-friendly institutions, and country A* has producer-friendly institutions; and re-source economies B and B*, where country B has grabber-friendly institutions and country B* has producer-friendly institutions. The four countries initially have the same income level Y0. The country with producer-friendly institutions, A*, grows faster than the coun-try with grabber-friendly institutions, A. Similarly, country B* has a higher growth rate than country B. One of the main features of this model is that resource economies with producer-friendly institutions outperform re-source-poor countries with producer-friendly institutions (B* and A*, respectively), whereas among grabber-friendly countries, it is the other way round: resource economies (B) end up lagging behind all other groups. Hence, Mehlum, Moene, and Torvik’s main conclu-sion is that the quality of institutions deter-mines whether natural resource abundance is a blessing or a curse.
Figure 4Growth Paths of Resource-Rich and Resource-Poor Economies According to the Mehlum, Moene and Torvik model
Source: Halvor Mehlum, Karl Moene, and Ragnar Torvik, “Cursed by Resources or Institutions?” World Economy 29 (2006): 1117–1131, http://onlinelibrary. wiley.com/doi/10.1111/j.1467-9701.2006.00808.x/ abstract.

14
“A mineral-exporting country can catch up in its economic development if it improves its level of economic freedom.”
Empirical Data Analysis To examine the performance of different
resource economies depending on the strength of their institutions, I analyzed empirical data that illustrate their economic and social devel-opment. I then took the three most frequently quoted indexes, deliberately using three dif-ferent reports, to assess the effect of institu-tional quality as measured by different research teams. I grouped the economies according to their score on the global indexes. The following three indexes were used:
■ The Fraser Institute’s Economic Freedom of the World report
■ The World Bank’s Doing Business report ■ The Global Competitiveness Report of the
World Economic Forum
The list of resource economies includes 68 countries. The Appendix provides a full list of the countries that qualify, based on IMF and UNCTAD data, as well as groups of countries according to their scores on the three indexes used. This list does not include some of the world’s major oil and gas producers, such as the United States, Mexico, and Brazil. The reason is that although those countries produce a signifi-cant amount of hydrocarbons (as well as other mineral commodities), their share as a percent-age of GDP and overall exports is lower than the criteria for resource economies (10 percent of GDP and 25 percent of exports).
The resource economies are divided into four quartiles in accordance with their performance on the three indexes. The performance of those quartiles is then compared using five parameters as measures of economic and social development:
■ Real GDP per capita PPP ■ Foreign direct investment ■ Human Development Index (HDI) ■ Freedom from corruption ■ Violations of civil liberties
A trend is visible in all groups and for all pa-rameters. That trend confirms a previous hy-pothesis: a better institutional environment in
resource countries correlates with higher income per capita, higher living standards, and more so-cial development. Comparing groups with the most developed institutions (the first quartile) with the world average also demonstrates that development levels in resource countries with strong institutions are greater than that of the world average. The strong performance of that first quartile is particularly important, as it re-futes the popular resource curse hypothesis. The findings of this empirical research are demon-strated in Figures 5 through 9.
THE ROLE OF GOVERNMENTThis section looks at policy choices facing
resource-based economies. It examines such policy areas as the institutional climate, the government’s share in oil companies, stabiliza-tion funds, and government investments. In this section I argue that economic and social perfor-mance of resource economies depends primarily on the strength of their institutional framework, of which economic freedom is a key component.
The Influence of Economic Freedom on Development in Resource Economies
How should economic freedom be defined? The Economic Freedom of the World (EFW) re-port provided a definition:
Individuals have economic freedom when property they acquire without the use of force, fraud, or theft is protected from physical invasions by others and they are free to use, exchange, or give their prop-erty as long as their actions do not violate the identical rights of others. An index of economic freedom should measure the extent to which rightly acquired property is protected and individuals are engaged in voluntary transactions.39
The EFW measures 42 government policies that affect economic freedom.40 The Fraser In-stitute measures those policies using quantifi-able characteristics and independent surveys. The data are organized into five main catego-

15
“Diversifica-tion makes sense only when it actually in-creases overall efficiency, which is hardly pos-sible if the government is picking win-ners.”
ries, which, broadly speaking, define the insti-tutional framework that constitutes economic freedom:
■■ Rule of law and property rights■■ Size of government and taxation■■ Soundness of money■■ Trade regulation and tariffs■■ Regulation of business, labor, and cap-
ital markets
Economic freedom is important because it is a major prerequisite for economic growth and development. Economic growth is strongly associated with economic freedom.41 It is also strongly related to certain other parameters of human development. Higher economic free-dom is positively correlated with such indica-tors as life expectancy, literacy, and civil and political rights. It is negatively correlated with poverty and corruption.42 And since economic rights and, more narrowly, property rights are an inalienable part of fundamental human rights, political and civil liberties are incomplete in the absence of economic freedom.
Where do resource economies stand in re-lation to economic freedom? If one first looks at the bottom 10 global economies’ economic freedom scores, they may appear to prove the resource curse hypothesis. Eight out of 10 qualify as resource economies: Mozambique, Algeria, the Democratic Republic of Congo, Angola, the Republic of Congo, Zimbabwe, Myanmar, and—closing the global list as least economically free—Venezuela.
However, this gloomy picture for resource economies is somewhat improved when one then switches to the top 10 most free econo-mies. Half of them are resource economies to varying degrees: Australia, Canada, Bahrain, Finland, and Chile. What seems to be the case here is not the “resource curse” but rather “re-source polarization,” consistent with Mehlum, Moene, and Torvik’s producers vs. grabbers model, in which resource economies with in-stitutional deficiencies perform worse than resource-poor countries with the same level of institutional development. At the same time,
mineral resources can boost those economies with more developed institutions.
A number of economists have analyzed the role of institutions, which determines the overall level of economic freedom and influences growth in resource economies.43 Overwhelmingly, those authors concluded that institutional develop-ment is both positively and strongly correlated with economic success in resource economies. The mechanisms through which economic free-dom fosters growth and development are largely related to its effect on rent-seeking. Secure prop-erty rights, fair and efficient enforcement of contracts, freedom of trade, and limits on the government’s ability to transfer wealth through subsidies and regulation in effect reduce the rate of return on unproductive economic activities.
On the other hand, the stronger those insti-tutions are, the more profitable it is to generate wealth through productive entrepreneurship instead of grabbing. One other channel through which economic freedom can stimulate growth and development is the reduction of conflict. Erik Gartzke found that economic institutions are by far more effective than noneconomic in-stitutions in diminishing violence.44
A study by Louis-Philippe Béland and Raaj Tiagi45 looks at how economic freedom, as mea-sured by the EFW index, correlates with eco-nomic growth in countries with a high share of income from exports of metals and ores (in min-ing but not oil and gas economies). The study ex-amined real GDP per capita from 1970 to 2006.
Béland and Tiagi indicate that, in countries with low scores for economic freedom, natural resources hamper growth, whereas countries with high levels of economic freedom perform significantly better.46 They even outperform their resource-poor peers with the same score in economic freedom. Those results also show that a mineral-exporting country can catch up in its economic development if it improves its level of economic freedom. Even with relatively small improvements in economic freedom, the effect on growth and development is positive and quite significant. All of that is consistent with Mehlum, Moene, and Torvik’s model, which suggests a multiplier effect in resource

16
Figure 5Real GDP per Capita (PPP) in Resource Economies, 2014Countries Grouped According to Their Rankings in Three Reports Measuring Institutional Strength (Fraser Institute, World Bank, and World Economic Forum)
Source: World Bank Open Data, author’s calculations, http://data.worldbank.org/topic/economy-and-growth.
Figure 6Foreign Direct Investment in Resource Economies, 2013Countries Grouped According to Their Rankings in Three Reports Measuring Institutional Strength (Fraser Institute, World Bank, and World Economic Forum)
Source: World Bank Open Data, author’s calculations, http://data.worldbank.org/topic/financial-sector.

17
“The average net income per barrel of the six lead-ing privately owned oil companies in 2013 was 56 percent higher than that of the six leading state-owned oil compa-nies.”
economies, so that both positive and negative tendencies are amplified, as producer-friendly institutions stimulate production, whereas grab-ber-friendly institutions hamper production.47
Andrei Illarionov of the Cato Institute and the Institute for Economic Analysis un-dertook a number of studies examining the role of institutions and economic freedom in various groups of countries, including oil producers. He used both the Economic Free-dom of the World index and other measures of institutional development. Illarionov divided various groups of economies into subgroups according to their rating of economic free-dom. In particular, he looked at the perfor-mance of oil-producing countries in the Arab world and concluded that the main reason for slow growth in many of those countries is insufficient progress in economic freedom.48 Illarionov analyzed the performance of other petrostates, specifically Russia, and came to similar conclusions.
As shown in Figures 5–9, there is a strong
positive correlation between economic freedom in resource economies and the level of real GDP per capita (PPP) and other economic and social indicators. Similar to the other two institutional ratings, in all groups and for all parameters, in countries with higher levels of economic freedom, both real per capita income and human development scores are higher, and there is more investment and more civil rights. Greater economic freedom also correlates with lower crime and corruption. The most important conclusion is that the economic and social performance of resource economies depends primarily on the strength of their institutional framework, of which eco-nomic freedom is a key measurement.
Resource Economies, Excessive State Interference, and Associated Inefficiencies
Government interference in resource economies is often more significant than in nonresource economies. The most important reasons, in my view, are the following four:
Figure 7Human Development Index (HDI) in Resource Economies, 2013Countries Grouped According to Their Rankings in Three Reports Measuring Institutional Strength (Fraser Institute, World Bank, and World Economic Forum)
Source: United Nations Development Program, author’s calculations, http://hdr.undp.org/en/data.

18
“Most private international oil majors demonstrate more resilience during the collapse of oil prices.”
1. Immobility. A specific feature of extrac-tive industries is their intrinsic depen-dence on mineral resources that are im-movable while they remain underground. As a result, effective government control is much higher than in other sectors. Globalization has allowed companies to choose jurisdictions in both the manu-facturing and service industries, estab-lishing their offices, production lines, and call centers where conditions are best. In contrast, a company cannot relocate a mine or an oil well. Businesses have a lim-ited choice of location before the start of operations. Once investments are made and drilling or digging has started, such choice no longer exists. That factor gives bureaucrats much more control. An addi-tional characteristic of natural resources that allows higher levels of control is the fact that they can be easily accumulated in one place, concentrated through refin-ing, and stored for long periods.
2. Resource nationalism. In practically all countries (with the exception of the United States and very limited cases in Canada), underground natural resources are the property of the state. That fac-tor creates a strong bias toward govern-ment down the entire chain of mineral extraction, refining, and distribution. This paradigm is often referred to as “re-source nationalism,” and the resources are often referred to as the “property of the people,” but that does not change their actual status, which is government ownership. Consequently, the govern-ment tightly controls any business activ-ity related to minerals, which generates vast opportunities for extorting rents.
3. Redistribution. Extractive industries employ a small percentage of the popula-tion but often generate the lion’s share of the gross national income. Thus, redistri-bution in its many forms (transfers, subsi-dies to the nonresource sector, large scale state-run infrastructure projects, privi-leges, etc.) constitutes a very significant
function of a rentier state. One key rent-seeking activity is capturing such transfers to satisfy private interests. High levels of redistribution tend to increase both the intrusiveness of the state and the size of government spending as a share of GDP. That practice is often supplemented by economies of scale for rent-seeking that emerge in large petrostates operating mas-sive budgets. In such countries, even a mi-nor position in the rent-seeking hierarchy can generate significant returns.
4. Insulation of the elite. For reasons mentioned above, rents from natural resources are easily extractable and thus can greatly enhance the wealth of the ruling elite. A portion of those profits are also redistributed among the rest of the population. Consequently, dissatis-faction among the population with the status quo of a rent-seeking elite may be stifled for a time by creating depen-dency on various government transfers. That situation develops into a vicious cycle of rent-seeking, which pervades the society from top to bottom and does so in a very unequal measure. Rents from natural resources can be used ei-ther as carrots—through transfers—to buy loyalty or as sticks, if discontent per-sists and develops into political protest. Thus, many petrostates spend a signifi-cant part of their budgets on police, the military, and intelligence.
Although government interference in re-source economies is often more significant than in nonresource economies, certain fea-tures of state intervention have universal char-acteristics across all countries. All in all, vari-ous types of government involvement in the economy fall into three broad categories: reg-ulation, redistribution, and ownership.
Some areas of regulation are essential for a well-functioning institutional system (as dis-cussed earlier), such as independent courts or law enforcement agencies. However, the fur-ther a specific area of regulation is removed

19
Figure 8Freedom from Corruption in Resource Economies, 2014Countries Grouped According to Their Rankings in Three Reports Measuring Institutional Strength (Fraser Institute, World Bank, and World Economic Forum)
Source: Transparency International, author’s calculations, http://www.transparency.org/cpi2014/results.
Figure 9Violations of Civil Liberties in Resource Economies, 2014Countries Grouped According to Their Rankings in Three Reports Measuring Institutional Strength (Fraser Institute, World Bank, and World Economic Forum)
Source: Freedom House, author’s calculations, https://freedomhouse.org/report/freedom-world-aggregate-and-subcategory-scores.

20
“Although the peak of nationaliza-tions of the 1960s and 1970s is long gone, the idea of resource nationalism is still going strong.”
from the core functions of government, the more likely it is to have negative effects on economic growth. Regulation possesses a “multiplier effect,” which can be either posi-tive or negative: efficient regulation, which reinforces the rule of law, can boost economic development, whereas even small regulatory agencies can slow down growth through red tape, bottlenecks, and market distortions. In resource economies, the multiplier effect for both positive and negative aspects of regula-tion tends to be especially pronounced.
The second category of government ac-tivity is redistribution. The process of taxing individuals and business and spending the re-ceipts through various government programs has several costs associated with it. Among such costs, as outlined by Daniel J. Mitchell, are the following three.49
■■ Displacement cost. The government cannot spend money without first taking that money from someone; thus, government spending displaces private-sector activity.
■■ Behavioral subsidy cost. Govern-ment spending subsidizes choices that would otherwise not be desir-able, such as high unemployment ben-efits encouraging some people to stay out of work.
■■ Stagnation cost. Subsidies often hamper innovation by constraining Schumpeterian “creative destruction,” as government programs are inflexible because of their centralization and bureaucracy.
In resource economies, redistribution of-ten takes the form of government direct in-vestments, which are typically large-scale in-frastructure developments and are commonly “white elephant” projects with low rates of return. Government investment initiatives often boost politicians’ popularity and not co-incidentally provide excellent opportunities for extracting rents and committing outright misappropriation.
Since direct government investment is of-ten hard to defend because of its poor repu-tation, some governments in resource econo-mies embrace a somewhat more sophisticated policy, which is often referred to as “diversifi-cation.” That policy entails supporting com-panies in certain sectors through subsidies and loans. It is defended on the grounds that a more diversified economy is less vulnerable to commodity price volatility and is thus more sustainable. The general premise is reasonable and may even seem to derive from the same concerns articulated above. Other things be-ing equal, diversified economies usually have a more balanced growth trajectory and often en-joy higher growth rates. But the devil is in the details. Diversification is a means to an end, namely, to higher growth through increased economic efficiency. The problem with gov-ernment-subsidized diversification is that it reverses this logic by making diversification a goal of government policies in itself.
Diversification makes sense only when it ac-tually increases overall efficiency, which is hard-ly possible if the government is picking win-ners. When a given economy is not diversified, it is usually the result of economic inefficiency and bureaucratic red tape in certain sectors, which prevents businesses from making a prof-it. By pouring money into those sectors, the ef-ficiency problem is not resolved but rather ag-gravated, because greater capital is allocated to inefficient businesses without alleviating their inefficiency. As Maria Sarraf and Moortaza Ji-wanji point out, “Governments tend to invest in projects with low rates of return compared to the private sector.”50 And government-driv-en diversification suffers from the same rent-seeking and corruption problem as direct in-vestments and infrastructure programs.
Apart from redistribution by the state, an-other category of government involvement is direct ownership of companies: when the gov-ernment owns certain enterprises, either creat-ing a monopoly or competing with private com-panies. Lower efficiency of government-owned enterprises can affect the overall economy in several ways, including by underperforming
21
“The earnings that govern-ments receive in taxes from the operations of private firms are often higher on a per- barrel basis than the earnings from the operations of government-owned enter-prises.”
relative to the private sector, by crowding out private investment, and by monopolizing a cer-tain industry. In many countries—for instance, many members of OPEC—the natural resourc-es sector is the most state-dominated among all industries. It is worth looking at how different structures of ownership in the extractive indus-tries (private, state, or mixed) and various poli-cies related to redistribution (such as stabiliza-tion funds) can affect overall economic growth and development in resource economies.
The Influence of the Government’s Share of Ownership in Extractive Industries on Overall Economic Performance
OPEC was founded in 1960. It developed into a club of countries with mostly govern-ment-dominated oil sectors. Since then, the world oil and gas industry has gone through a profound evolution of ownership. In the many developing countries that account for most of global hydrocarbon production, govern-ments took control of their oil and gas sectors by expropriations, nationalization, or renego-tiations with international companies. Such takeovers resulted in an industry in which not only the reserves in the ground were owned by governments, but also most of the oil and gas was produced by government-controlled cor-porations. The latter are usually referred to as national oil companies, whereas major private-ly owned transnational corporations are called international oil companies.
National oil companies dominate the in-dustry for various reasons, including particu-larly the appeal to resource nationalism. For the purposes of this paper, however, what interests us is the relative economic perfor-mance of oil companies that adopted different models of ownership and sector organization. It is helpful to separate the issue of overall management efficiency from political senti-ments. As Thorvaldur Gylfason from the Uni-versity of Iceland argued:
What seems to matter for economic growth is not the abundance of natural resources per se, but rather the quality
of their management, and of economic management and institutions in general.51
One way to evaluate the efficiency of various ownership models is to compare the world’s largest oil companies by one key pa-rameter that characterizes their performance: net income per barrel of oil equivalent pro-duced (which includes combined production of both oil and gas). The average net income per barrel of the six leading privately owned oil companies in 2013 was 56 percent higher than that of the six leading state-owned oil compa-nies ($17.35 and $11.12 per barrel, respectively, as shown in Figure 10). That number includes leading oil companies with production above 2 million barrels a day for which detailed finan-cial reporting is available. It is worth noting that for many government-owned oil compa-nies such reports are unavailable, specifically companies in Gulf countries.
Moreover, most private international oil majors demonstrate more resilience during the collapse of oil prices (see Figure 11). Consider companies’ performance in 2014, the year when Brent lost half its value—from a peak $115 per barrel to $58 per barrel by the end of the year. In 2014, the performance gap broadened even further: the net income per barrel of leading privately owned oil companies was as much as 87 percent higher than that of leading state-owned oil companies ($15.28 and $8.19 per bar-rel, respectively). Remarkably, three out of six of the private corporations had even higher incomes per barrel in 2014, the year of the oil price crash, than they did in 2013. These results demonstrate not simply the higher efficiency of privately owned companies but also their stron-ger resilience to oil price fluctuations, which is an important attribute in this industry, given significant commodity price volatility.
Oil companies differ in various ways, in-cluding in their property structures and or-ganizational models. Their portfolios have varying ratios between production and refin-ing, their fields have distinct geological char-acteristics, and they operate under different regulatory regimes. The above-mentioned

22
“Without strong and transparent institutions, private companies are quickly corrupted through rent-seek-ing.”
results are largely achieved in otherwise un-equal circumstances as well. Most of the state-owned companies operate in their home ter-ritory, where they enjoy favorable conditions and access to more reserves with higher qual-ity, which is not the case with most privately owned companies. The latter nonetheless manage to outperform government produc-ers while normally facing tougher environ-ments, which often include abrupt changes of contract terms, higher taxes, and occasional license revocations and expropriations.
Despite such telling evidence, the balance of ownership has even of late continued to shift in the direction of state oil companies. Although the peak of nationalizations of the 1960s and 1970s is long gone, the idea of re-source nationalism is still going strong. The irony is that, from the available evidence, not only the income per barrel is significant-ly higher among private companies, but the earnings that governments receive in taxes
from the operations of private firms are often higher on a per-barrel basis than the earnings from the operations of government-owned enterprises. As demonstrated by the cases of Iran, Venezuela, and Mexico, a prolonged state monopoly of the oil industry results in its stagnation and an overall fall of government income. Mexico’s Pemex is a very powerful ex-ample. Mexico’s petroleum sector was nation-alized in the 1930s, which makes Pemex one of the longest-surviving state oil monopolies. Overall results are telling: even under the high oil price of 2012, the company was on the verge of receiving a negative return on a barrel of oil produced (its net profit was only 10 U.S. cents per barrel). Before 2012 it had actually been operating at a loss.
At the same time, the shale revolution in the United States demonstrates the efficiency of private ownership in the energy sector. The examples of Australia and Canada also show how, on the back of a surge in hydrocarbon pro-
Figure 10Net income per Barrel of Leading Oil Companies in 2013
Source: Companies’ annual reports, U.S. Energy Information Administration, author’s calculations.

23
“Iran and Venezuela are among the top three countries with hydrocarbon reserves. Both lag far behind several other countries in production because of low investment and industry mismanage-ment.”
duction, they enjoyed rapid economic growth even in the aftermath of the financial crisis of 2007–08, whereas many other member coun-tries of the Organisation for Economic Co-operation and Development (OECD) have struggled with a recession.
It is worth noting that although evidence argues strongly in favor of private resource production, privately owned companies are not a universal remedy. Without strong and transparent institutions, private companies are quickly corrupted through rent-seeking, as returns on grabbing outweigh returns on productive enterprise. The result is a struc-ture that may look privately owned on the sur-face but is actually a system of state-affiliated interest groups and clans. That is the case in a number of petrostates with poor ratings on the corruption index.52
The importance of institutional quality is once again highlighted when we compare oil and gas production in resource economies
grouped by their ratings in the World Bank’s Doing Business report. Production volumes are only partially determined by reserves in a par-ticular country; institutions play a crucial role. That factor is evident particularly when we re-call that Iran and Venezuela are among the top three countries with hydrocarbon reserves. Both lag far behind several other countries in production because of low investment and in-dustry mismanagement.
The superior results of private firms are not limited to oil economies; they are also evident from the experiences of countries with sub-stantial mining industries.53 As a consequence of opening its mining sector to private invest-ment, Indonesia was able to boost its produc-tion of gold, tin, nickel, and copper by about 50 percent in less than 10 years. The Indonesian government increased its revenues from the mining sector almost fivefold, from $700 mil-lion in 2000 to $3.4 billion in 2006, while (not coincidentally) actually reducing its overall tax
Figure 11Net income per Barrel of Leading Oil Companies in 2014
Source: Companies annual reports, U.S. Energy Information Administration, author’s calculations.
24
“It would therefore be fair to look at Gulf Arab countries as outliers that need to be analyzed separately from most other resource econo-mies.”
and royalty rates on mining companies, from 60 percent to 45 percent.54 Armenia managed to become one of the main global producers of molybdenum after the government sold the country’s largest processing complex to a private consortium of Armenian and German companies, which led to higher output. To-day, 12 private companies operate functioning mines in Armenia, which account for 17 percent of industrial production and make a significant contribution to economic development.55
Finally, there is the difficult question of how to analyze the unique models that exist in the six Gulf Cooperation Council (GCC) countries—Bahrain, Kuwait, Oman, Qatar, Saudi Arabia, and the United Arab Emirates. Their main character-istic is a combination of unmatched hydrocarbon reserves and production, and small (sometimes very small, as in Qatar or Bahrain) populations. The exception is Saudi Arabia, which has a pop-ulation of 28.8 million. The overall reliance on expatriate labor is unparalleled: immigrants rep-resent between 30 percent (in Oman and Saudi Arabia) and over 80 percent (in Qatar and the United Arab Emirates) of the population.56
Oil and gas production in GCC countries is predominantly state controlled, but it relies heavily on international service companies and highly skilled expat specialists working for Gulf national companies. GCC oil compa-nies are arguably the most cosmopolitan in the world—even more so than international oil cor-porations. Although the hydrocarbon sector is state controlled, in many of the Gulf countries overall economic policies outside of the oil in-dustry are very open and favorable to foreign investors. Gulf states generally rate highly on the Economic Freedom of the World index. At the same time, high levels of economic freedom coexist with very low ratings on civil liberties. Governments of all Gulf Arab countries are or-ganized as traditional monarchies.
Given the proportion of foreign nationals, most of whom do not integrate into the social and cultural fabric of the host nation, it is pos-sible to argue that GCC countries have, in fact, not one but two parallel societies that coexist and codepend on each other. Whatever one
might think of the unusual economic and so-cial arrangement that exists in the Gulf Arab states, one thing is certain: that particular sys-tem is largely an anomaly and is unlikely to be replicated elsewhere for a variety of economic, political, and cultural reasons. It would there-fore be fair to look at Gulf Arab countries as outliers that need to be analyzed separately from most other resource economies.
Stabilization Funds and Alternative Solutions
The idea of stabilization funds has cer-tainly gained popularity over the past several decades, as some countries have successfully developed such national entities. Comparing economies with and without them, the overall results moderately favor stabilization funds.
From 1966 to 1989, Botswana was the fastest-growing economy in the world, transforming itself over that period from one of the poorest states to an upper-middle-income country (its performance over half a century relative to an-other African mining economy, the Republic of the Congo, is shown in Figure 12). That success has largely been due to both strengthened insti-tutions and prudent management of Botswana’s diamond revenues (nearly a quarter of the world’s diamond reserves are located in Botswana).
Botswana follows a strategy of fixed public spending, allowing the government to accu-mulate revenue surpluses during boom years. Recurrent revenue surpluses that are not spent are transferred into Botswana’s Foreign Reserves Fund. By the mid-1990s, interest payments on those reserves became the larg-est source of Botswana’s government revenue after diamond sales. Between 1976 and 2008, foreign exchange reserves grew from $75 mil-lion to $10 billion, which equaled 33 months of import cover. Those reserves mitigate the impact of price volatility, allowing the govern-ment to maintain public spending when com-modity markets turn bearish.
In Norway, a large part of the state income from oil and gas exports is diverted into the Government Pension Fund of Norway. It is the second-largest sovereign fund in the world, only

25
“If mineral wealth belongs to every citizen in the country, then one might argue that everyone has a claim to an equal share of that wealth.”
after the Abu Dhabi Investment Authority. The overall value of its assets is 1.5 times Norwegian GDP, and it controls over 1 percent of all pub-licly traded shares in the world. Stabilization and sovereign funds have significantly aided public administration in a diversity of countries, such as Malaysia and Oman. In Russia, the Stabiliza-tion Fund helped the country weather the storm of the financial crisis and the oil price drop in 2008–09 by providing an emergency reserve for the economy.
In summary, governments usually allocate some part of receipts from mineral exports to a special fund in order to alleviate the Dutch disease and to save for a rainy day. Stabiliza-tion funds, if designed and run properly, can serve the following purposes:
■ Sterilize revenue inflows57 when com-modity prices are high, to mitigate up-ward pressure on the national currency exchange rate, which is one of the main effects of the Dutch disease;
■ Manage price volatility risks and main-tain public spending levels during down-turns; and
■ Introduce some budgetary discipline by capping government spending.
Whether a stabilization fund achieves those goals depends on whether it is suf-ficiently insulated from political pressures. With weak institutions, a stabilization fund will simply become another vehicle for redis-tributing mineral revenues into the hands of political cronies.
Assuming the fund operates independently of political pressures, what should be done with the accumulated reserves? The most common option for a stabilization fund is to invest in the global stock and bond market. That strategy is often politically inconvenient for the government, because it can be per-ceived as unpatriotic. Despite that, it does have some advantages. It can be a partial so-lution to the Dutch disease by sterilizing the
Figure 12Real GDP per Capita (PPP) in Two African Resource Economies since 1962
Source: World Bank Open Data, author’s calculations, http://data.worldbank.org/topic/economy-and-growth.

26
“The shale revolution in the United States is having a major effect on global energy markets.”
inflow of foreign currency into the domestic economy during commodity price booms. Some people argue that such a strategy is also more detached from domestic interest groups and thus less prone to rent-seeking.
If implemented properly with the right lev-el of self-discipline, stabilization funds may be a useful economic policy tool. But they are not a panacea. As outlined earlier, the Dutch dis-ease and the negative impact of price volatility are essentially institutional rather than purely economic problems. Thus, both should have an institutional solution. A freer economic en-vironment with equal opportunities stimulates private investment, entrepreneurial activity, and innovation in nonresource industries. As to price volatility, vulnerability to price fluc-tuations is reduced, because a freer economy relies less on redistribution and payouts by the government. Private-sector firms are better at dealing with the effects of commodity price volatility than state-run corporations.
Stabilization funds that invest in global markets—assuming they attract qualified fund managers and stay as far from politics as pos-sible—can be effective if implemented on a limited scale. Whether they are an optimal way to manage government income is still an open question. One might argue that, for economies that depend almost entirely on exports of a single mineral commodity, such as Oman or Botswana, it is important to maintain sizable reserves in order to manage public spending when prices are low. For those countries, having a limited emergency fund would be a good idea.
But where is the limit? What happens when reserves in the fund continue to grow on the back of high prices during commodity price booms? Should the government reduce (or even suspend) the amount of money diverted into the fund af-ter it reaches a certain level? These are not rhe-torical questions. If the government manages to maintain a balanced budget while more and more money flows into the sovereign fund, it simply means that the state extracts from the economy far more than is necessary to fulfill its obligations.
The question then is, should the govern-ment continue to take that much from the
economy if it is not even sure what to do with the money? Would it not be fairer and more efficient if the surplus money was left in the economy when commodity prices are high? Some would argue that, in a resource-depen-dent economy, there would not be enough do-mestic businesses to invest in, and thus people and companies would choose to take their in-creased incomes abroad. But even if that were the case, it is no different from what the gov-ernment is doing through its sovereign fund anyway. Put simply, do people really need the government to manage their money? As ab-stract as these questions might seem during a period of low oil prices, they expose some important dilemmas concerning the role and scope of government in a resource economy.
Several economists have suggested that resource economies should distribute part of their natural resource revenues directly to their citizens.58 In the U.S. state of Alaska, that takes the form of a special oil dividend, known as the Permanent Fund Dividend, which has been paid to all residents of Alaska since 1983. In 2015 each citizen received $2,072. The dividend is paid once a year from the Alaska Permanent Fund, a sovereign entity that accu-mulates a share of government revenues from the oil industry. The fund has grown an initial $734,000 in 1977 to $54.5 billion in market val-ue of its assets in 2016.59
The idea of a citizen’s dividend can be traced back to the pamphlet Agrarian Justice written in 1795 by Thomas Paine, an influential political thinker during the American Revolution. Such an idea takes the common notion that natural resources in the ground “belong to the people” back to its actual meaning. If mineral wealth belongs to every citizen in the country, then one might argue that everyone has a claim to an equal share of that wealth. What share of export revenues the government should be allowed to retain is subject to a separate discussion, as is the way such a transfer would be administered. In practical terms, a special “oil account” could be opened for every citizen in an oil-producing country or perhaps merged with individual pen-sion accounts. Although this idea may seem far-

27
“What is happening with shale reserves is conceptually closer to the Silicon Valley model and venture capitalism than traditional oil and gas with its multi-billion dollar projects.”
fetched and has not yet gained broad support, it would be unfair to rule it out. In the future, with the increasing automation of even the in-tellectual workforce, a citizens’ dividend might become more appealing.
COMPETITION, INNOVATION, AND GROWTH
The section looks at the institutional con-ditions for major innovations in extractive industries, such as the shale revolution and breakthroughs in the development of other un-conventional resources. It then briefly summa-rizes the experience of four countries—Austra-lia, Canada, Chile, and Norway—and looks at particular policies that allowed them to achieve more rapid growth and higher levels of social development compared with peer countries with resource-based economies. Finally, this section looks at the experiences of oil-export-ing countries that managed to maintain high growth rates during the crude price drop in the 1980s.
The Shale Revolution: Its Causes and Implications
Since July 2014 the rapid oil price decrease has prompted strong interest in the changing dynamics of the global hydrocarbon market, specifically how it is influenced by technologi-cal breakthroughs in developing unconven-tional hydrocarbons. Most observers believe that one of the main reasons for the drop in oil prices was the rapid increase of U.S. oil production, which in 2014 reached the level of the other two biggest producers, Russia and Saudi Arabia (and even surpassed it for several months). Greater reliance on domes-tic production decreases U.S. demand for im-ported oil and hence puts downward pressure on the oil price worldwide. In addition, the rapid increase in domestic shale gas produc-tion accompanied by a drop in domestic gas prices has increased the share of gas in the overall energy mix in the United States, thus further strengthening American energy inde-pendence.
All in all, the shale revolution in the United States is having a major effect on global en-ergy markets. Consequently, many industry analysts have drawn their attention to the commercial, technological, institutional, and regulatory aspects of hydrocarbon produc-tion from shale deposits. As shale gas and oil technologies gradually spread worldwide, the likelihood of their having an even stronger ef-fect on the global energy balance in the not so distant future increases.
One of the characteristics of shale depos-its is the small size of their wells. Drilling ex-penses are significantly lower than those of big wells on traditional deposits. Simultaneously, the production cycle of shale wells is relatively short. When oil prices decrease below produc-tion costs, it is possible to quickly extract oil on the existing wells and stop drilling afterward until the prices rise again. The volume of pro-duction can then be increased just as quickly by drilling new wells. That increased rate of production is not accompanied by consider-able capital expenses, which is a big advantage under conditions of price volatility.
That factor directly affects the structure of the shale industry. In one sense, what is happen-ing with shale reserves is conceptually closer to the Silicon Valley model and venture capitalism than traditional oil and gas with its multibillion dollar projects, which only larger, vertically in-tegrated companies can carry out. As a result, the shale revolution’s main driving force comes from junior independent innovation compa-nies, which fiercely compete with one another.
Extractive industries have seen growth and innovation in countries around the world, due in no small part to favorable economic policies. The shale revolution in the United States is one of the most powerful examples. It started with the economic success of the Barnett Shale play in Texas in 1997. In 2000 shale gas provided only 1 percent of U.S. natural gas production; by 2012, it reached over 25 percent. The U.S. Energy Infor-mation Administration forecasts that by 2035, 46 percent of the U.S. natural gas supply will come from shale gas. Furthermore, by 2017, the United States is expected to become a net exporter of

28
“In 2000 shale gas provided only 1 percent of U.S. natural gas production; by 2012, it reached over 25 percent.”
natural gas because of growing shale gas produc-tion. The success of new hydrocarbon technol-ogy stretches beyond the United States. Innova-tion in shale oil and gas was accompanied by a breakthrough in heavy crude production from oil sands, specifically in Canada. As a result, in 2012, the United States and Canada accounted for 25 percent of global natural gas production and 14 percent of oil production.60
As shown in Figure 13, the United States ranks fourth in world shale gas resources. At the same time, according to the BP Energy Out-look,61 virtually all current shale gas comes from the United States. Other regions are expected to start producing shale gas in the future, but the United States will still produce the bulk of it for quite some time (Figure 14). The shale revolution supports the hypothesis that the development of a certain commodity depends more on insti-tutions than on physical resources in the ground.
Other countries are catching up. China is esti-mated to have the largest shale gas reserves in the world and is expected to be the global center of shale gas development outside North America.
By 2030, shale could account for 20 percent of to-tal Chinese gas production. And visible progress is being made in developing other unconvention-al hydrocarbons, such as coalbed methane.
Breakthroughs in shale oil and shale gas technologies are having a strong influence on the broader global energy landscape. First, gas price formulas are increasingly delinked from oil prices. That is an important change in the gas market, reflecting the growing supply of un-conventional gas. Second, such breakthroughs are having a strong influence on the geopolitics of global energy, as the balance of hydrocarbon production is shifting toward countries that were for a long time viewed as being dependent on foreign oil and gas.62
The emergence of new centers of produc-tion, such as the United States, Canada, Aus-tralia, and potentially China, is seriously un-dermining the influence of OPEC as a global oil cartel, whereas traditional importers are becoming more energy independent. OPEC’s weight in global energy is further undermined by the growing significance of gas as a global
Figure 13World Resources of Technically Recoverable Shale Gas, in Billions of Cubic Feet
Source: U.S. Energy Information Administration, https://www.eia.gov/analysis/studies/worldshalegas/.

29
“The success of new hydrocarbon technology stretches beyond the United States.”
fuel. The International Energy Agency predicts that by 2030, a quarter of global energy will be produced from gas—the same share as oil.63
The consequences of those developments go beyond the energy sector itself. The increas-ing share of gas in fuel consumption is already having a profound effect on the environmental debate. The burning of natural gas emits half the greenhouse gases that coal does, and 30 percent less than oil. For those politicians and nongovernmental organization activists who have argued in favor of curbing greenhouse gas emissions, natural gas may become a game changer. Tellingly, as gas has partially replaced other fuels in the United States (which did not sign the Kyoto Protocol, to the dismay of many eco-campaigners), in 2012 U.S. carbon dioxide emissions dropped to their lowest level in 20 years, whereas European countries that signed the Kyoto Protocol are failing to meet their emissions targets. As a result, a growing num-ber of environmentalists are fine-tuning their
position from anti–fossil fuel to “pro-gas.” The BP Energy Outlook64 estimates that
200 trillion cubic meters of technically recov-erable shale gas and 240 billion barrels of shale oil exist worldwide. By 2030, their develop-ment will account for over 20 percent of the in-crease in the world’s hydrocarbon supply. What brought about such a significant shift in the global energy landscape? On a technical level, a breakthrough in three key technologies made it possible: horizontal drilling, hydraulic fractur-ing, and advances in seismic data collection and its digital interpretation.
Shale oil and gas are different from conven-tional resources only in the way they are trapped in the ground: they are diffuse rather than con-centrated in isolated wells. Horizontal drilling is required to identify concentrations of shale oil and gas, and then the rock needs to be fractured with water to release the crude or gas so that it can flow to the surface. Most shale deposits had been identified long before their development became
Figure 14Forecast of World Shale Gas Production, in Billions of Cubic Feet per Day
Source: BP Energy Outlook 2035, January 2014, http://www.bp.com/content/dam/bp/pdf/energy-economics/energy-out-look-2016/bp-energy-outlook-2014.pdf.

30
“In 2012 U.S. carbon dioxide emissions dropped to their lowest level in 20 years, whereas European countries that signed the Kyoto Protocol are failing to meet their emissions targets.”
economically feasible. Technological progress al-lowed companies to book those deposits as com-mercial reserves and start production.
An important externality of the shale boom is that it helped undermine a common preju-dice against extractive industries as being in-sufficiently innovative. Politicians who are ea-ger to be viewed as “cutting-edge” have often repeated the idea that to modernize and enter the postindustrial era, a country needs to shift away from mineral production. That outdated attitude is quickly becoming history. The shale revolution is in essence a technological break-through of the highest caliber.
The Role of Strong Institutions and Competition in Extending the Frontiers of Exploration
One aspect of the shale revolution and breakthroughs in other unconventional hydro-carbons gets much less attention in the media than geopolitical, technical, or environmental issues: what were the conditions that allowed the technological innovation to happen? It is no coincidence that advances in unconvention-al hydrocarbons took place in countries that are in the top of the Economic Freedom of the World rating. Those advances were also helped by other conditions, such as high gas prices in the 2000s. But the institutional component—the combination of secure property rights, a favorable tax regime, transparent and efficient regulation, and minimal red tape—was the de-cisive factor. The institutional conditions that allowed the shale revolution to happen should be carefully studied by policymakers in other countries, especially in resource economies.
It is also important to point out that the Unit-ed States, Canada, and Australia have extractive sectors with multiple private companies, rang-ing from small exploration firms to vertically integrated multinationals. It was not one cor-poration alone, but several—including Chevron, Shell, Devon, Talisman Energy, Chesapeake, and Range Resources—that developed technologies for the commercial extraction of shale gas. They were all in tough competition for limited capital and human resources, which made them focus
on the most efficient technologies. It is not sur-prising then that despite the world’s largest shale gas reserves, the shale gas boom did not start in China, in which the sector is dominated by gov-ernment oil and gas companies.
In December 2014, the Russian Academy of National Economy and Public Administration’s Centre for Resource Economics published the findings of its research into the role of institu-tions and companies’ property structure in the shale gas revolution in the United States.65 The results of the econometric modeling demon-strate the following: institutional parameters, such as competition and private ownership, had a positive effect on the production of uncon-ventional hydrocarbons, including shale gas. Because of extensive innovative development and strong institutions, the United States tran-sitioned from almost exclusively conventional gas production to unconventional production.
In 2012 the United States had about 13,000 small oil companies, which accounted for more than 54 percent of hydrocarbon production. Small companies are currently providing much of the increase in U.S. hydrocarbon production. Most of them produce deep in the continent from hard-to-recover and residual reserves of marginal wells or small deposits. A strong posi-tive dependence exists between shale oil and gas production and independent companies’ investment in research and development.
It is a well-known fact that the United States is a leader in shale oil production today, but few people know that it is also a leader in oil produc-tion on the Arctic Shelf. As with shale oil, the key determinants for success in developing the Beau-fort Sea deposits in U.S. Arctic waters are an effec-tive and stable tax system, guarantees of property rights, and the absence of a state monopoly. Like the shale revolution, the biggest breakthroughs in Arctic offshore production are not correlated with amounts of resources but with institutional quality. Tellingly, the United States and Norway (two major countries that operate on the shelf be-yond the Arctic Circle) are significantly ahead of Russia in production volumes. At the same time, according to estimates, Russia has 41 percent of all technically extractable global resources of

31
“The United States, Canada, and Australia have extractive sectors with multiple private compa-nies.”
Arctic oil and 70 percent of the gas.66
Although multiple comparisons demon-strate that private oil companies largely out-perform government-owned companies, the latter vary significantly in their performance. Within the right policy framework, some state corporations achieve impressive results. What matters are the way a particular company is or-ganized and the overall institutional environ-ment. State-owned firms that rely on strong and lasting partnerships with international companies tend to perform much better than those that develop in autarchy. The best ex-ample is Malaysia’s Petronas. Petronas is state owned and for decades has relied on alliances with foreign companies to effectively run the Malaysian oil and gas sector and rapidly grow its business both domestically and overseas.
The Malaysian model of the extractive in-dustries could be described as a symbiosis be-tween state and private companies. Although the government maintains 100 percent owner-ship of Petronas, the overall government share in oil and gas production is about 60 percent. The remainder is divided among various inter-national and national oil companies, such as Shell, ExxonMobil, Murphy Oil, and Nippon Oil, all of which operate through production-sharing agreements with Petronas.
International alliances have allowed Ma-laysia to keep an edge in the global market by, for example, becoming a leading exporter of liquefied natural gas (LNG). Malaysia’s strat-egy could be viewed as “clever” diversification; instead of trying to run away from its resource base and its competitive advantage, the coun-try fine-tuned its economy to developments in the global market. As oil reserves started to de-cline, Malaysia commercialized its natural gas resources by joining the LNG market and be-coming one of the leading exporters of LNG.
Another stage of diversification started when Petronas went global. Petronas’s overseas proj-ects account for 36 percent of its total hydro-carbon production. Petronas operates in over 30 countries, producing oil from about 50 proj-ects in Asia, the Middle East, Africa, and Cen-tral Asia, more than half of which it operates.
Bringing about strong international opportuni-ties allowed Petronas to effectively manage the lowering of its production levels in mature areas of Malaysia. Today, industry experts agree that Petronas is the most efficient national oil com-pany.67 Currently, Malaysia is already one of the most prosperous countries in Asia, and it quali-fies as a so-called newly industrialized economy (its performance over half a century relative to another Asian oil exporting economy, Vietnam, is shown in Figure 15). Although in recent years a major corruption scandal cast a shadow on the Malaysian system, in previous years many had seen it as a role model for other Asian econo-mies. It is a notable example of relative success in a non-OECD country without a preexisting set of Western-style institutions.
Four Resource-Exporting Countries with High Levels of Economic and Social Development
This section compares experiences of four resource economies: Australia, Canada, Chile, and Norway. It provides a brief overview of particular policies that allowed them to achieve high levels of social and economic development. These overviews are based on situations that preceded the metal and oil price drops in recent years. Lately these four countries, like most min-eral exporters, are going through radical adjust-ments. It remains to be seen how they adapt to the new situation in global commodity markets.
AUSTRALIA. Following a series of economic reforms that started in the mid-1980s, Australia began a period of rapid growth that exceeded its peers in the OECD club. Before Paul Keat-ing, then Australia’s treasurer, launched those reforms, the country was viewed by many as gradually moving toward the periphery of the global economy. Some of the key reforms un-dertaken in Australia included new regulation of the labor market to increase its flexibility and lower taxes, as well as reform of the financial system to enable it to meet the financing needs of the economy and to make it more attractive to investors, both domestic and foreign. Impor-tantly, the government liberalized the system of mineral licensing and permits, which boosted

32
investment in greenfield mineral exploration. Minerals account for 70 percent of the
value of Australia’s exports and about 12 per-cent of its GDP. An additional 9 percent of the economy consists of services that are linked to energy and mining.68 By our metrics, that qualifies Australia as a resource economy. Fur-thermore, until recently, the share of extractive industries had been growing. Before the drop in oil prices, industry analysts had expected Australia to triple its gas production by 2020 and to overtake Qatar as the world’s largest LNG producer, as Australia’s conventional and unconventional gas projects came to the pro-duction stage. Hydrocarbons aside, Australia is the world’s second-largest producer of gold, nickel, and zinc, the third-largest producer of iron ore and uranium, and the world’s fourth-largest producer and leading exporter of coal.
Contrary to the predictions one might make from the resource curse hypothesis, the 1997 Asian financial crisis did not drag Austra-lia down. Neither did it go into a recession like
most other industrialized nations during the financial meltdown of 2008–09. Consistent reforms, strong property rights, immigration-friendly policies, and low barriers to doing business allowed Australia to become one of the world’s leaders in economic growth and so-cial development.
Australia is also one of the world leaders in economic freedom. It ranks 12th in the Eco-nomic Freedom of the World rating69 and 13th in World Bank’s Doing Business rating.70 It also has the 18th-highest GDP per capita (PPP) in the world.71 The country has a highly developed framework of economic, social, and political institutions, which has allowed it to maintain a highly diversified economy and avoid the pit-falls of the Dutch disease.
Its extractive industries are diverse and con-sist of various players from world supermajors like BHP Billiton to independent exploration companies. Australian companies have also es-tablished themselves as active global explorers, especially in the mining industry. The sector is
Figure 15Real GDP per Capita (PPP) in Two Oil and Gas Exporting Economies since 1962
Source: World Bank Open Data, author’s calculations, http://data.worldbank.org/topic/economy-and-growth.

33
“State-owned firms that rely on strong and lasting partnerships with international companies tend to perform much better than those that develop in autarchy.”
fully competitive and completely private, with no state companies in either energy or mining. The property rights of mineral license holders are secure, and access to new exploration and production licenses is relatively transparent, uncomplicated, and free of red tape.
Australia has been a pioneer in many areas, including the world’s first floating LNG facility (Prelude FLNG), which is under development in the North West Shelf area. It also became a leader in the production of coalbed methane. Australia’s innovation is helped not least by a pragmatic immigration policy, which attracts talented and entrepreneurial people from all over the world. Australia’s and Canada’s immi-gration policies are often considered to be role models for other countries. Curiously, their immigration levels, around 20 percent of the general population, are higher than the OECD average and are also higher than in many coun-tries where immigration causes much greater controversy and hostility than in either Canada or Australia.
CANADA. Canada is often mentioned as a role model of economic growth and social develop-ment for other resource economies. Canada’s resource reliance is somewhat less than that of Australia, but nonetheless Canada’s economic growth has been to a large degree driven by its mineral sector, especially since the shale oil breakthrough. Canada’s overall mineral exports account for 34 percent of the value of its overall exports and about 9 percent of its GDP.72 It’s also one of the world leaders in economic free-dom: Canada ranks 9th in the Economic Free-dom of the World rating73 and 14th in the World Bank’s Doing Business rating.74 Additionally, it has the 17th-highest GDP per capita (PPP) in the world.75 The country has a highly developed framework of economic, social, and political institutions.
According to the Canadian government, be-fore the drop in oil prices, the energy sector was the greatest contributor to Canada’s balance of trade and a major job creator, employing more than 550,000 people. In 2012 alone, domestic and international businesses invested $55 bil-lion in Canadian hydrocarbon projects.76 Suf-
ficient technological advances also enabled the commercial production of Canadian oil sands. Many of the oil sand deposits had been iden-tified long before their development became economically feasible. Technological progress allowed companies to book those deposits as commercial reserves and to start production.
Canada’s mining sector also served as a source of economic growth. Foreign direct in-vestment into mining was between $50 billion and $70 billion annually in the second half of the 2000s.77 Mining output was not only grow-ing domestically but also spilling over inter-nationally through multiple Canadian firms’ investments in mining projects in emerging markets. Remarkably, Canadian companies ac-count for between 30 percent and 45 percent of total global exploration activity in the min-ing sector worldwide.
Canada’s hydrocarbons are developed by a range of companies both domestic (e.g., Atha-basca Oil Corporation and Canadian Natural Resources) and international (e.g., Shell and ConocoPhilips). Extractive industries are com-pletely private, with no state companies in ei-ther energy or mining. Canada’s mineral tax re-gime is profit based and is generally lower than in many other jurisdictions.
The country possesses the third-largest proven reserves of crude after Saudi Arabia and Venezuela. Canada benefits from its prox-imity to its biggest trading partner, the United States. Canada is currently the world’s largest producer of heavy oil from oil sands and is at the forefront of technological innovation in unconventional hydrocarbons.
In addition, Canada is using sovereign funds to hedge government finances against com-modity price volatility. The largest sovereign fund in Canada is the Alberta Heritage Savings Trust Fund. Also, the Toronto Stock Exchange is the world’s leader in extractive industries: more mining and oil companies are listed there than on any other exchange in the world. Can-ada’s institutional strength has allowed it to be-come a worldwide financial hub for hundreds of mining companies, which list their shares on the Toronto Stock Exchange.

34
“Canada’s institutional strength has allowed it to become a worldwide financial hub for hundreds of mining companies, which list their shares on the Toronto Stock Exchange.”
CHILE. Chile today is the largest producer of copper, natural nitrates, iodine, and lithium, as well as the 2nd-largest producer of molybde-num, the 5th-largest supplier of silver, and 13th-largest producer of gold. Chile ranks 10th in the Economic Freedom of the World rating.78 It is the only country in South America that is a mem-ber of the OECD. The strength of Chile’s in-stitutions and its favorable investment climate have made it the most successful Latin Ameri-can economy. Figure 16 shows Chile’s perfor-mance over half a century relative to Venezuela, another South American country that relies on natural resources exports.
It is remarkable how Chile’s economy and public policy has reacted to global copper prices. In 1971 the government of Salvador Al-lende nationalized all copper mines in Chile, along with banks and various companies in the manufacturing sector. That change caused an exodus of foreign capital and a suppression of domestic investment. Despite a strong in-crease in copper prices in the early 1970s, real
GDP declined during the Allende regime, and inflation was at 100 percent a year.79
A period of severe economic and political instability led to the overthrow of the Allende government in 1973. The military government instituted a decisive anti-inflation program and devalued the real exchange rate. Unlike Chile’s first copper export boom, Chile’s sec-ond, which occurred in 1979–1980, was ac-companied by substantial growth in real GDP. Even after the decline of copper prices in 1981, GDP grew by about 5 percent annually during the remainder of the 1980s, and the real ex-change rate appreciated only modestly. More-over, Chile’s stable institutional and regulatory framework kept investors on board during Lat-in America’s turbulent economic conditions in the 1990s, allowing the country to outperform its regional peers. The government retained export windfalls in a stabilization fund and prevented the nonmining tradable sector from being suppressed by the effects of the Dutch disease.
Figure 16Real GDP per Capita (PPP) in Two South American Resource Economies since 1962
Source: World Bank Open Data, author’s calculations, http://data.worldbank.org/topic/economy-and-growth.

35
“Following the success of mining reforms in the 1990s, the private concession system was extended to the Chilean infrastructure sector.”
The mining sector reforms were crystal-lized in Chile’s 1981 Constitutional Mining Law (note that the term “constitutional” makes the law as immutable as the constitution). The law is a one-stop legislative shop for potential investors, outlining the rights and obligations of concession holders. The Constitutional Mining Law treats a concession as private property and allows concession holders to de-velop a mine in accordance with their strategy and market conditions. It also provides strong protection against expropriations. Important-ly, the existence and termination of the conces-sion are in the hands of the judicial branch, not the legislative branch or the executive. The law was drafted by José Piñera, then Chile’s secre-tary of mining.80
It is worth noting that Chile’s mining sec-tor has a mixed property structure. Because of political pressures, during mining sector reforms in the early 1980s, it was decided that the biggest copper mining company, Codelco, would remain majority state owned. But cop-per production, which rose fivefold in the 1980s and 1990s, grew fastest among private companies. As a result, government-owned Codelco controls less than a third of overall copper production in Chile today.81
Following the success of mining reforms in the 1990s, the private concession system was extended to the Chilean infrastructure sector (highways, airports, and ports), which had tra-ditionally been deemed “public works” to be carried out by the state.
NORWAY. Norway’s GDP per capita (PPP) is the sixth-highest in the world.82 Norway ranks 27th in the Economic Freedom of the World rating,83 9th in World Bank’s Doing Business rating,84 and 1st on the UNDP Human De-velopment Index.85 Its institutional system is considered to be one of the most reliable and developed in the world. Up to a quarter of national income is generated by oil and gas production—the largest in Europe. Despite its reliance on mineral exports, Norway managed to avoid economic overheating and success-fully mitigated the effects of oil price volatil-ity thanks to disciplined and efficient policies.
Norway’s policy framework for managing rev-enues from hydrocarbon exports, especially the Government Pension Fund, is used as a model by several resource economies. These policies are relatively new. Although oil was discovered in Norway in 1969, it was not until the early 1980s that crude production started to generate a positive income.
Until 1981, when a Conservative govern-ment replaced the Labor Party, Norway’s eco-nomic policies had been predominantly state led and included subsidized industrialization, rationing, and price controls. Inflation was high and real income growth low. The new govern-ment introduced a degree of deregulation and limited economic liberalization, which played an important role in attracting investment into the hydrocarbon industry. Today, Norway con-tinues to maintain a large welfare state, but the current model differs from the pre-1981 one in one critical aspect: it is based on fiscal responsi-bility and financial discipline. In short, Norway chose a model with a large government that it can actually afford. Such a welfare state model differs from many other Western countries, where welfare obligations are financed though government borrowing and the central bank’s printing press.
Through the national companies Statoil and Petoro, the government controls about 60 percent of oil and gas production and about the same share of reserves in Norway. The remaining share is divided among various in-ternational companies, such as ExxonMobil, Total, Shell, and ConocoPhilips.
An important feature of Norway’s model is prudent and strategic management of its natu-ral resources. Following a decline in oil produc-tion due to depletion of mature fields, natural gas production has risen to reach 10 billion cubic feet a day, more than five times what it was 20 years ago. Furthermore, international operations of Statoil, Norway’s majority state-owned oil company, allow Norway to leverage its operational expertise in other regions, while compensating for the decline in domestic oil production. All in all, Statoil participates in oil and gas projects in 15 countries.
36
“Five oil exporters witnessed positive growth exceeding 1 percent of GDP during the oil price collapse.”
Strong Institutions and Economic Growth during Periods of Low Oil Prices: The 1980s Experience
Soon after the Islamic Revolution of 1979, Iran started the second wave of nationalization of its oil industry, which led to a slump in pro-duction. That outcome caused panic in the oil market, which worsened with the beginning of the Iran–Iraq War in 1980—Iran’s oil produc-tion even came to a halt for some time. Those events led to a sharp rise in oil prices, a period that became known as the second oil crisis. The first oil crisis of 1973 was triggered by the Yom Kippur War and the oil embargo of the Arab countries against the West. All in all, those developments from 1973 through 1981 led to a twelvefold increase of the oil price (in nominal terms) from $3.22 to $38.85 per barrel. Real prices adjusted for inflation climbed 5.8 times from $18.09 per barrel to $105.48 per barrel.
By January 1981, it was evident that various conflicts in the Middle East would not greatly su-press global oil production: the fall in production in Iran and Iraq was compensated for by other ex-porters who managed to increase supply swiftly and consequently satisfied global demand. That realization resulted in the greatest price collapse in history: in nominal terms, prices declined 3.6 times 1981–1986.86 In real terms—adjusted for inflation—prices returned to the exact same level from which they started to skyrocket back in 1973. The oil cycle was thus complete.
From 1980 to 1986, the world saw one of the deepest and longest declines in oil prices—they dropped by 72 percent throughout that period. Price movements of then and now have much in common. Hence, the economic lessons of the 1980s are quite relevant today, because they demonstrate possible scenarios for oil econo-mies under the pressure of low oil prices. In the 1980s, many oil-exporting countries expe-rienced a severe economic shock, from which some have not fully recovered to this day. Such an outcome seems logical. In this group of countries, a sharp fall in prices causes a drop in budget revenues and a suppressed inflow of money into the overall economy. As a con-sequence, the majority of oil-exporting coun-
tries were hit by an economic crisis—the rate of GDP per capita growth was negative. However, there were exceptions. In particular, five oil exporters witnessed positive growth exceeding 1 percent of GDP during the oil price collapse (see Figure 17). Those countries were Oman, Indonesia, Norway, Malaysia, and Canada.
The political systems of those five coun-tries were vastly different from one another. For instance, only Canada and Norway were democracies. What made their cases similar were their high rankings or increases in their positions on the Economic Freedom of the World index. Canada was continuously ranked among the top leaders of the index (it was fifth in 1980 and sixth in 1990). By rejecting the pol-icy of import substitution and liberalizing its economy in the 1980s and 1990s, Malaysia also reached leading positions in the rankings, 13th and 15th, respectively. In 1981, the Norwegian Social Democrats were succeeded by a market-oriented government. As a result, Norway im-proved its position from 36th place in 1980 to 21st in 1990.
Unlike those three countries (Norway, Cana-da, and Malaysia), Indonesia is not used as a case study of economic success in this paper. Indeed, Indonesia’s experience has been mixed. Its de-velopment deteriorated significantly following the Asian financial crisis of 1997. Nonetheless, in the 1980s, Indonesia was one of the regional leaders in economic growth. Following a partial economic liberalization under the “New Order” of President Suharto, Indonesia rose from 62nd to 37th place within a decade.
Because of the relatively small size of its economy, Oman also does not appear as a case study in this paper. Oman’s achievements as an oil-exporting country are nevertheless quite significant. Because of economic reforms un-dertaken by Sultan Qaboos bin Said, who rose to the throne in 1970 Oman rapidly increased its income per capita and accompanied that growth with a leap in institutional improve-ments. In 1980 Oman was not listed on the Economic Freedom of the World index, but by 1990 it was ranked 34th—above the majority of its neighbors from the Arab world.

37
“Strong institutions allow economies to achieve long-term growth despite unfavorable economic conditions, such as low oil prices.”
An important condition for positive growth rates in an oil-exporting economy under low commodity prices is its ability to increase pro-duction. Such an increase may partially or fully compensate for the decline in revenues from lower unit prices for a barrel of oil. Four of the five examined countries—Oman, Canada, Nor-way, and Malaysia—increased oil production in 1981–86. Oman, Norway, and Malaysia almost doubled it. Indonesia could not follow their example because it was the only country in this group that at that time was a member of OPEC and thus was forced to comply with the cartel’s quotas (Indonesia subsequently left the organi-zation). However, Indonesia managed to par-tially compensate for those losses by doubling its gas production. Malaysia and Oman also sig-nificantly increased their gas production in the covered period. In Norway, a gas boom began a bit later and became a locomotive of growth during low oil prices in the 1980s and 1990s.
Not all oil exporters have the ability to quick-
ly increase their production. That requires ad-vanced management and strategic production planning. In particular, companies need to invest in exploration ahead of time—before the period of low prices. They also need to boost efficiency by increasing oil recovery rates.
If we look at the longer period from 1980 to 2000, which was characterized by suppressed oil prices (see Figure 18), one thing stands out in the group of oil-exporting countries. The same five countries with stronger economic institu-tions are again among the growth leaders. The main conclusion is that strong institutions allow economies to achieve long-term growth despite unfavorable economic conditions, such as low oil prices. An institutional solution is essential for long-term growth. Strong institutions can allow increases in production and can prop up efficiency. Furthermore, they can also diversify the economy when investments in oil, gas, and metals generate a smaller return because of fall-ing prices.
Figure 17Average GDP per Capita Annual Growth in Oil Economies for the Period 1981–1986
Source: World Bank Open Data, author’s calculations, http://data.worldbank.org/topic/economy-and-growth.

38
“It is possible to build a modern and prosperous economy that derives a significant share of in-come from the sale of minerals.”
CONCLUSIONThis paper argues that resource economies
with better economic and political institutions manage their resource revenues better and can achieve superior results in economic growth and social development. Evidence presented here is at odds with the resource curse hypothesis and with the idea that mineral-exporting countries are doomed to stagnation. Instead of battling with various “curses” and “diseases,” govern-ments might do a better job by looking inward and analyzing their own performance, along with the institutional conditions in the economies that they govern. It is the quality of institutions that essentially determines whether natural re-source abundance is a blessing or a curse.
This paper reaches the following main con-clusions:
■ Natural resources themselves are not the root of the problems facing many
mineral-exporting economies. It is pos-sible to build a modern and prosperous economy that derives a significant share of income from the sale of minerals.
■ In resource-exporting countries with bet-ter institutions and higher levels of eco-nomic freedom, both real per capita in-come and human development scores are higher, people live longer, and more invest-ment and more civil rights exist. Higher economic freedom correlates with lower levels of crime, corruption, and illiteracy.
■ One of the main obstacles to economic growth and social development in many resource economies is rent-seeking. It is not a unique feature of resource econo-mies, but it does appear to have a par-ticularly strong effect on them and to produce institutional weaknesses.
■ Both the Dutch disease and the effect of commodity price volatility are first and
Figure 18Average GDP per Capita Annual Growth in Oil Economies for the Period 1980–2000
Source: World Bank Open Data, author’s calculations, http://data.worldbank.org/topic/economy-and-growth.

39
foremost institutional rather than purely economic problems. Both become prob-lems under specific circumstances, which are usually associated with the lack of strong and transparent institutions.
■ If implemented properly with the right level of self-discipline, stabilization funds may be a useful economic policy tool for resource economies. Whether they are an optimal way to manage government income is still an open question.
■ Innovation is one of the key drivers of growth and social development. The shale revolution is in essence a techno-logical breakthrough of the highest cali-ber that helped undermine a common prejudice against extractive industries as being insufficiently innovative.
■ It is no coincidence that a breakthrough in unconventional hydrocarbons (i.e., shale oil, shale gas, oil sands, and coal-bed methane) should have taken place in some of the most economically free countries of the world, such as the Unit-ed States, Canada, and Australia. The combination of secure property rights, transparent and efficient regulation, a fa-vorable tax regime, and minimal red tape made it possible.
■ Private oil companies generally perform more efficiently than state-owned firms: the average net income per barrel of the six largest privately owned oil companies is roughly 60 percent to 85 percent higher (depending on the year) than that of the six leading state-owned oil companies.
■ Under certain conditions, and within the right policy framework, some state corporations manage to achieve impres-sive results (examples include Norway’s Statoil and Malaysia’s Petronas). What matters is the way a particular company is organized, and, even more important, the overall institutional environment in which it operates.
■ Five oil exporters witnessed positive GDP growth during the oil price collapse in the 1980s. Those countries are Oman, In-
donesia, Norway, Malaysia, and Canada. Their examples demonstrate that strong economic institutions can help weather the storm of low commodity prices.
■ More government participation in re-source economies does not increase growth. On balance, it generates a nega-tive return by crowding out private investment, fueling rent-seeking and corruption, and decreasing overall pro-ductivity.
■ A mineral-exporting country can catch up in its economic development if it strengthens its institutions. Even with relatively small improvements, the re-sults are positive and quite significant.
APPENDIXFor the purposes of this paper, a country is
a resource economy if over 25 percent of its ex-ports consist of natural resources and the ratio of resource exports to GDP exceeds or is close to 10 percent (I also add some countries whose share is slightly below 10 percent of GDP but that nonetheless have a very high share of natural resources in their exports). The for-mer criterion is used by a number of authors and is consistent with the IMF definition of resource-dependent countries. The latter is added to ensure that countries with very low volumes of overall exports do not fall into that category. Below is a full list of countries that qualify, based on IMF and UNCTAD data.
Altogether, this paper examines 68 re-source economies and 39 oil and gas econo-mies. Below is a list of resource economies as well as groups of countries according to their scores in the following three indexes:
■ The Fraser Institute Economic Freedom of the World report
■ The World Bank’s Doing Business report ■ The Global Competitiveness Report of the
World Economic Forum
The groups include only those countries that actually receive a score in those indexes.
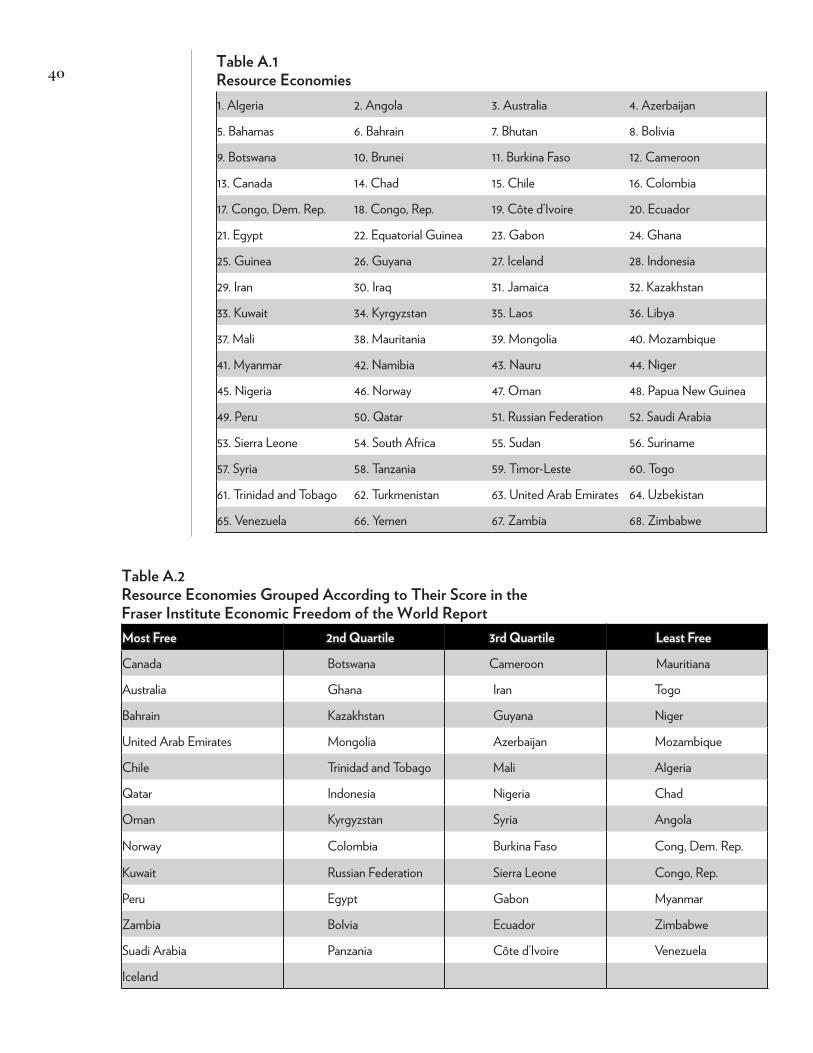
40 Table A.1Resource Economies1. Algeria 2. Angola 3. Australia 4. Azerbaijan
5. Bahamas 6. Bahrain 7. Bhutan 8. Bolivia
9. Botswana 10. Brunei 11. Burkina Faso 12. Cameroon
13. Canada 14. Chad 15. Chile 16. Colombia
17. Congo, Dem. Rep. 18. Congo, Rep. 19. Côte d’Ivoire 20. Ecuador
21. Egypt 22. Equatorial Guinea 23. Gabon 24. Ghana
25. Guinea 26. Guyana 27. Iceland 28. Indonesia
29. Iran 30. Iraq 31. Jamaica 32. Kazakhstan
33. Kuwait 34. Kyrgyzstan 35. Laos 36. Libya
37. Mali 38. Mauritania 39. Mongolia 40. Mozambique
41. Myanmar 42. Namibia 43. Nauru 44. Niger
45. Nigeria 46. Norway 47. Oman 48. Papua New Guinea
49. Peru 50. Qatar 51. Russian Federation 52. Saudi Arabia
53. Sierra Leone 54. South Africa 55. Sudan 56. Suriname
57. Syria 58. Tanzania 59. Timor-Leste 60. Togo
61. Trinidad and Tobago 62. Turkmenistan 63. United Arab Emirates 64. Uzbekistan
65. Venezuela 66. Yemen 67. Zambia 68. Zimbabwe
Table A.2Resource Economies Grouped According to Their Score in the Fraser Institute Economic Freedom of the World ReportMost Free 2nd Quartile 3rd Quartile Least Free
Canada Botswana Cameroon Mauritiana
Australia Ghana Iran Togo
Bahrain Kazakhstan Guyana Niger
United Arab Emirates Mongolia Azerbaijan Mozambique
Chile Trinidad and Tobago Mali Algeria
Qatar Indonesia Nigeria Chad
Oman Kyrgyzstan Syria Angola
Norway Colombia Burkina Faso Cong, Dem. Rep.
Kuwait Russian Federation Sierra Leone Congo, Rep.
Peru Egypt Gabon Myanmar
Zambia Bolvia Ecuador Zimbabwe
Suadi Arabia Panzania Côte d’Ivoire Venezuela
Iceland

Table A.3Resource Economies Grouped According to Their Score in the World Bank’s Doing Business ReportMost Business Friendly 2nd Quartile 3rd Quartile Least Business Friendly
Norway Azerbaijan Tanzania Equatorial Guinea
Australia Botswana Papua New Guinea Sudan
Iceland Kazakhstan Yemen Burkina Faso
Canada Trinidad and Tobago Sierra Leone Suriname
Saudi Arabia Kyrgyzstan Iran Mauritania
United Arab Emirates Mongolia Mozambique Timor-Leste
Chile Bahamas Mali Angola
South Africa Brunei Algeria Zimbabwe
Qatar Kuwait Gabon Niger
Bahrain Namibia Côte d’Ivoir Guinea
Peru Zambia Laos Nigeria
Colombia Ecuador Uzbekistan Venezuela
Jamica Egypt Iraq Syria
Russian Federation Guyana Bolvia Congo, Dem. Rep.
Oman Indonesia Togo Congo, Rep.
Ghana Bhutan Cameroon Chad
Table A.4Resource Economies Grouped According to Their Score in the Global Competitiveness Report of the World Economic ForumMost Competitive 2nd Quartile 3rd Quartile Least Competitive
Qatar Kazakhstan Gabon Mali
Canada Oman Kyrgyzstan Libya
Norway South Africa Zambia Nigeria
Saudi Arabia Peru Mongolia Burkina Faso
Australia Iran Ghana Mauritania
United Arab Emirates Russian Federation Bolivia Venezuela
Brunei Colombia Egypt Timor-Leste
Iceland Botswana Guyana Mozambique
Chile Algeria Cameroon Chad
Indonesia Trinidad and Tobago Suriname Yemen
Bahrain Ecuador Côte d’Ivoire Guinea
Kuwait Namibia Tanzania Sierra Leone
Azerbaijan Namibia Zimbabwe
Azerbaijan Jamaica
41
42
NOTESThis paper is based on an earlier study published by the Russian Academy of National Economy and Public Administration (RANEPA) titled “Resource Rents and Economic Growth: Economic and Institutional Development in Countries with a High Share of Income from the Sale of Natu-ral Resources—Analysis and Recommendations Based on International Experience,” December 2013, http://cre.ranepa.ru/wp-content/uploads/ 2014/06/1_131201_Resource-rents-and-economic- growth-report.pdf. The author would like to thank Nikola Kjurchiski and Regina Samoilova at RANEPA for their assistance in this research.
1. OPEC was established in 1960 and currently comprises 12 countries: Algeria, Angola, Ecuador, Iran, Iraq, Kuwait, Libya, Nigeria, Qatar, Saudi Arabia, the United Arab Emirates, and Venezuela. In most OPEC member countries, governments dominate oil and gas production and control hy-drocarbon reserves.
2. Shale gas is natural gas that is trapped within fine-grained sedimentary rocks.
3. The term “natural resources” here refers to what are known as “point resources”—essentially, raw and refined mineral commodities. A broader defi-nition might include land, water basins, and other such natural resources that are not considered here. This paper’s definition, however, is consistent with most studies on the subject and includes two broad categories of minerals: mineral nonfuels and fuels. The former comprises nonferrous metals, metalliferous ores, crude fertilizers, and other min-erals, including precious and semiprecious stones. The latter category includes oil and oil products, natural gas, and coal. The precise list of commodi-ties included in the definition is based on the Stan-dard International Trade Classification and the database of merchandise exports developed by the United Nations Conference on Trade and De-velopment, which has the most detailed statistical database on global merchandise trade.
4. See Raymond Mikesell, “Explaining the Re-source Curse, with Special Reference to Mineral-
Exporting Countries,” Resources Policy 23 (1997): 191–99, http://www.sciencedirect.com/science/article/pii/S0301420797000366; and Tobias Kronenberg, “The Curse of Natural Resources in the Transition Economies,” Economics of Transi-tion 12 (2004): 399–426. http://www.econstor.eu/bitstream/10419/83802/1/wp241.pdf.
5. Terry Lynn Karl, The Paradox of Plenty: Oil Booms and Petro-States (Berkeley: University of California Press, 1997).
6. See William C. Gruben, “The ‘Curse’ of Ven-ezuela,” Southwest Economy (May–June 2004): 17–18, http://www.dallasfed.org/assets/documents/ research/swe/2004/swe0403d.pdf.
7. See BP Statistical Review of World Energy: June 2015, http://www.bp.com/content/dam/bp/pdf/energy-economics/statistical-review-2015/bp-statistical-review-of-world-energy-2015-full- report.pdf.
8. Ibid.
9. Jeffery D. Sachs and Andrew M. Warner, “Natu-ral Resource Abundance and Economic Growth,” NBER Working Paper no. 5398, National Bureau of Economic Research, Cambridge, MA, 1995, https://www.google.ru/url?sa=t&rct=j&q=&esrc=s&source=web&cd=3&ved=0CC4QFjAC&url=https%3A%2F%2Facademiccommons.columbia.edu%2Fdownload%2Ffedora_content%2Fdownload%2Fac%3A138843%2FCONTENT%2FNaturalResourceAbundanceWarner.pdf&ei=4hj_U4bzOuOm4gSl1YDQAQ&usg=AFQjCNHFfHUj64F2QfGCeWA58zDn5h44Bw&sig2=zGIgVQ6pSJkGOa8_PRS99A&bvm=bv.74035653,d.bGE&cad=rjt.
10. Xavier Sala-i-Martin, “I Just Ran Two Million Regressions,” American Economic Review 87 (1997): 178†–83, http://faculty.lebow.drexel.edu/lainczc/cal38/Growth/SalaiMartin_1997.pdf.
11. The Financial Times Lexicon defines it in the following way: “Dutch disease is the negative im-pact on an economy of anything that gives rise to

43
a sharp inflow of foreign currency, such as the dis-covery of large oil reserves. The currency inflows lead to currency appreciation, making the coun-try’s other products less price competitive on the export market. It also leads to higher levels of cheap imports and can lead to deindustrialization as industries apart from resource exploitation are moved to cheaper locations.” http://lexicon.ft.com/Term?term=dutch-disease.
12. Economists such as Ronald McKinnon, “In-ternational Transfers and Non-Traded Commodi-ties: The Adjustment Problem,” The International Monetary System and the Developing Nations, ed. Danny M. Leipziger (Washington: Agency for International Development, 1976); and Warner Max Corden and Peter Neary, “Booming Sec-tor and De-Industrialization in a Small Open Economy,” Economic Journal 92 (1982): 825–48. See also Sweder van Wijnbergen, “The ‘Dutch Dis-ease’: A Disease After All?” Economic Journal 94 (1984): 41–55, http://www.aae.wisc.edu/cox head/courses/731/PDF/vanWijnbergen-DutchDisease ADiseaseAfterAll-EJ-1984.pdf; RichardAuty, “Industrial Policy Reform in Six Large Newly Industrializing Countries: The Resource Curse Thesis.” World Development 22 (1994): 1, 11–26, http://www.sciencedirect.com/science/article/pii/0305750X94901651; and Thorvaldur Gylfa-son, Tryggvi Thor Herbertsson, and Gylfi Zoega, “A Mixed Blessing: Natural Resources and Economic Growth,” Discussion paper no. 1668, Centre for Economic Policy Research, London, 1999.
13. See Tiago V. de V. Cavalcanti, Kamiar Mohad-des, and Mehdi Raissi, “Growth, Development and Natural Resources: New Evidence Using a Heterogeneous Panel Analysis,” Cambridge Work-ing Paper in Economics no. 0946, University of Cambridge, 2009, http://www.caf.com/media/3119/CMR_04Nov09_CAF.PDF; and Tiago V. de V. Cavalcanti, Kamiar Mohaddes, and Mehdi Raissi, “Commodity Price Volatility and the Sources of Growth,” IMF Working Paper no. WP/12/12, Inter-national Monetary Fund, Washington, 2011, http://www.imf.org/external/pubs/ft/wp/2012/wp1212.pdf. See also Frederik van der Ploeg and Steven Poel-hekke, “Volatility and the Natural Resource Curse,”
Oxford Economic Papers 61 (2009): 727–60; and Weishu Leong and Kamiar Mohaddes, “Institu-tions and the Volatility Curse,” Cambridge Work-ing Paper in Economics no. 1145, University of Cam-bridge, http://www.econ.cam.ac.uk/research/repec/cam/pdf/cwpe1145.pdf.
14. Osmel Manzano and Roberto Rigobon, “Re-source Curse or Debt Overhang?” NBER Work-ing Paper no. 8390, National Bureau of Economic Research, Cambridge, MA, 2001, http://web.mit.edu/rigobon/www/Robertos_Web_Page/Re-search_files/resourcecurse.pdf.
15. Daniel Lederman and William F. Maloney, eds., Natural Resources Neither Curse nor Destiny (Palo Alto, CA: Stanford University Press; Wash-ington: World Bank, 2007), https://open knowl-edge.worldbank.org/bitstream/handle/10986/7183/378930LAC0Natu101OFFICIAL0USE0ON LY1.pdf?sequence=1; Daniel Lederman and Wil-liam F. Maloney, “In Search of the Missing Re-source Curse,” Policy Research Working Paper no. 4766, World Bank, Washington, 2008, https://openknowledge.worldbank.org/bitstream/handle/ 10986/6901/WPS4766.pdf?sequence=1.
16. Ibid. After accounting for fixed effects in their analysis, the negative impact of resources disap-peared, suggesting that it is not their particular proxy but rather the natural resources proxy’s cor-relation with certain unobserved national charac-teristics that is influencing the result.
17. See Jean-Philippe C. Stijns, “Natural Resource Abundance and Economic Growth Revisited,” Resources Policy 30 (2005): 107–30, http://agecon search.umn.edu/bitstream/25127/1/dp01st01.pdf.
18. Andrew Rosser, “The Political Economy of the Resource Curse: A Literature Survey,” IDS Working Paper no. 268, Institute of Development Studies, Brighton, UK, 2006, p. 9, https://www.ids.ac.uk/publication/the-political-economy-of-the-resource-curse-a-literature-survey.
19. Sachs and Warner, “Natural Resource Abun-dance”; Auty, “Industrial Policy Reform”; Rosser,

44
“Political Economy”; Cavalcanti, Mohaddes, and Raissi, “Growth, Development and Natural Re-sources.”
20. Stijns, “Natural Resource Abundance Revis-ited.”
21. See Nathan Nunn, “Long-Term Effects of Af-rica’s Slave Trades,” Quarterly Journal of Economics 123 (2008): 139–76, http://scholar.harvard.edu/files/nunn/files/the_long_term_effects.pdf; and Christa N. Brunnschweiler, “Cursing the Bless-ings? Natural Resource Abundance, Institutions, and Economic Growth,” World Development 36 (2006): 399–419.
22. “The Dutch Disease,” The Economist, Novem-ber 26, 1977, pp. 82–83.
23. See Corden and Neary, “Booming Sector”; Warner Max Corden, “Booming Sector and Dutch Disease Economics: Survey and Consolidation.” Oxford Economic Papers 36 (1984): 359–80, , http://oep.oxfordjournals.org/content/36/3/359.full.pdf; and Thorvaldur Gylfason, “Nature, Power, and Growth,” Scottish Journal of Political Economy 48 (2001): 558–88. Also see Paul Stevens, “Resource Impact: Curse or Blessing? A Literature Survey,” Centre for Energy, Petroleum and Mineral Law and Policy, University of Dundee, Dundee, UK, 2003. For a critical analysis of the “Dutch disease” hypothesis based on a case study of Great Britain, see Jürg Niehans, The Appreciation of Sterling: Causes, Effects, Policies (Rochester, NY: Center for Research in Government Policy and Business, 1981).
24. See Corden and Neary, “Booming Sector.”
25. Mikesell, “Explaining the Resource Curse.”
26. Gary McMahon, “The Natural Resource Curse: Myth or Reality?” Economic Develop-ment Institute, World Bank, Washington, 1997, http://www.scribd.com/doc/90191398/McMahon-Natural-Resource-Curse-Myth-or-Reality.
27. Ragnar Torvik, “Learning by Doing and the Dutch Disease,” European Economic Review 45
(1999): 285–306, http://www.sv.ntnu.no/iso/Rag-nar.Torvik/science.pdf.
28. Mikesell, “Explaining the Resource Curse.”
29. See ibid.; and Richard M. Auty, “Resource Abundance and Economic Development,” Unit-ed Nations University, Helsinki, 1998, https://www.wider.unu.edu/publication/resource-abun dance-and-economic-development.
30. Cavalcanti, Mohaddes, and Raissi, “Com-modity Price Volatility”; van der Ploeg and Poel-hekke, “Volatility and the Natural Resource Curse”; Christa Brunnschweiler and Erwin Bulte, “The Resource Curse Revisited and Re-vised: A Tale of Paradoxes and Red Herrings,” Journal of Environmental Economics and Manage-ment 55 (2006): 248–64 ; Rabah Arezki and Mu-stapha Nabli,”Natural Resources, Volatility, and Inclusive Growth: Perspectives from the Middle East and North Africa,” IMF Working Paper no. 12/111, International Monetary Fund, Wash-ington, 2012, https://www.imf.org/external/pubs/ft/wp/2012/wp12111.pdf.
31. Cavalcanti, Mohaddes, and Raissi, “Growth, Development and Natural Resources,” The Quar-terly Review of Economics and Finance 51 (2011): 305–318, http://faculty.smu.edu/millimet/classes/eco6375/papers/cavalcanti%20et%20al%202011.pdf.
32. See Eric Martin, “Mexico Hedges 2016 Oil Exports at Average of $49 Per Barrel,” Bloom-berg, August 19, 2015, http://www.bloomberg.com/news/articles/2015-08-20/mexico-hedges-2016-oil-exports-at-average-of-49-per-barrel.
33. Mikesell, “Explaining the Resource Curse.”
34. For a discussion on this issue, see Erika Wein-thal and Pauline Jones Luong, “Combating the Re-source Curse: An Alternative Solution to Managing Mineral Wealth,” Perspectives on Politics 4 (2006): 35–53.
35. See Aaron Tornell and Philip R. Lane, “The

45
Voracity Effect,” American Economic Review 89 (1999): 22–46, http://lib.cufe.edu.cn/upload_files/other/4_20140530024219_[56]Aaron%20Tor-nell%20and%20P.%20Lane,%201999.%20The%20Voracity%20Effect.%20American%20Economic%20Review%2089,%2022-46.pdf; Mi-chael Ross, “The Political Economy of the Re-source Curse,” World Politics 51, 297–322; Richard M. Auty, “The Political Economy of Resource-Driven Growth,” European Economic Review 45 (2001): 839–46, http://www.sciencedirect.com/science/article/pii/S001429210100126X; Thor-valdur Gylfason,” Natural Resources, Education, and Economic Development,” European Economic Review 45 (2001): 847–59, http://www.sciencedi rect.com/science/article/pii/S0014292101001271; William Easterly and Ross Levine, “Tropics, Germs, and Crops: How Endowments Influence Economic Development,” NBER Working Paper no. 15, National Bureau for Economic Research, Cambridge, MA, 2002, http://www.nber.org/pa pers/w9106.pdf; and Ragnar Torvik, “Natural Re-sources, Rent-Seeking and Welfare,” Journal of Development Economics 67 (2001): 455–70, http://www.svt.ntnu.no/iso/ragnar.torvik/jde.pdf.
36. Halvor Mehlum, Karl Moene, and Ragnar Tor-vik,” Cursed by Resources or Institutions?” World Economy 29 (2006): 1117–1131, http://onlinelibrary.wiley.com/doi/10.1111/j.1467-9701.2006.00808.x/abstract.
37. Ibid., p. 1121.
38. Ibid., p. 1125.
39. James Gwartney and Robert Lawson, Econom-ic Freedom of the World: 1996 Annual Report (Van-couver, BC: Fraser Institute, 1996), http://www.freetheworld.com/index.php.
40. The Economic Freedom of the World (EFW) re-port is published under the auspices of the Cana-dian Fraser Institute. Since the 1990s, the annual EFW report has provided data representing the various factors that make countries economically free. Today, the report covers 159 economies (95 percent of the world’s population) for which rel-
evant data are available. In its data, Fraser relies on a network of associated institutes from 85 countries that contribute to its research. The EFW index is one of the most broadly acknowledged measure-ments of the quality of institutions. A number of economists and organizations have used the EFW index as a benchmark of institutional development; the IMF’s World Economic Outlook, for instance. The EFW is possibly the most comprehensive of the in-dexes, as it incorporates some of the data from the other two ratings (the World Bank’s Doing Business and the Global Competitiveness Report of the World Economic Forum) among dozens of other sources. The Appendix to the EFW publication contains explanatory notes and a full list of data sources. The Fraser Institute also publishes an annual Survey of Mining Companies, which examines the invest-ment climate in mining economies, and a Global Petroleum Survey, an annual survey of petroleum executives regarding barriers to investment in oil- and gas-producing regions around the world.
41. See Fred McMahon, “Economic Freedom of the World: 2011 Annual Report,” presentation at the “Competition: Engine for Prosperity” confer-ence, Kuala Lumpur, October 10–13, 2011.
42. Ibid.
43. See, for example, Anne Krueger, Maurice Schiff, and Alberto Valdés, eds., Latin America: The Political Economy of Agricultural Pricing Poli-cy—Volume 1 (Baltimore: Johns Hopkins Univer-sity Press, 1991), http://documents.worldbank.org/curated/en/1991/06/439571/latin-america-political-economy-agricultural-pricing-policy-volume-1; The Political Economy of Agricultural Pricing Policy: Asia—Volume 2, http://siteresourc-es.worldbank.org/INTTRADERESEARCH/Resources/544824-1146153362267/ThePoliti-calEconomyofAg_Pricing_Policy_vol2_ASIA.pdf; and Africa and the Mediterranean: The Po-litical Economy of Agricultural Pricing Policy—Volume 3, http://econ.worldbank.org/external/default/main?pagePK=64165259&theSitePK=477872&piPK=64165421&menuPK=64166093&entityID=000178830_98101911014528. See also Deepak Lal and Hla Myint, The Political

46
Economy of Poverty, Equity and Growth: A Com-prehensive Study (Oxford: Clarendon Press, 1999), http://global.oup.com/academic/prod-uct/the-political-economy-of-poverty-equity-and-growth-9780198294320;jsessionid=A14205CDF68FE89B4E34F9E9B6081CF5?cc=ru&lang=en&; William Easterly and Ross Levine, “Africa’s Growth Tragedy: Policies and Eth-nic Divisions,” Quarterly Journal of Economics 112 (1997): 1203–50, http://williameasterly.files.wordpress.com/2010/08/17_easterly_levine_ africasgrowthtragedy_prp.pdf; Gary McMa-hon, “Natural Resource Curse: Myth or Re-ality?” (Economic Development Institute, World Bank, 1997); Mikesell, “Explaining the Resource Curse”; and Auty, “Industrial Policy Reform.” Also take a look at Michael L. Ross, “Does Oil Hinder Democracy?” World Poli-tics 53 (2001): 325–61, http://www.maxwell.syr.edu/uploadedFiles/exed/sites/ldf/Academic/Ross%20-%20Does%20Oil%20Hinder%20Democracy.pdf; Giles Atkinson and Kirk Ham-ilton, “Savings, Growth and the Resource Curse Hypothesis,” World Development 31 (2003): 1793–1807, http://www.sciencedirect.com/science/article/pii/S0305750X03001529; and Andrei Illarionov, “Freedom around the Globe (since 1776): March? Crawl? Retreat? Zig Zag?” presentation at Cato University, San Diego, 2008.
44. Erik Gartzke, “Chapter 2: Economic Free-dom and Peace,” Economic Freedom of the World: 2005 Annual Report (Vancouver, BC: Fraser Insti-tute, 2005), http://www.cato.org/pubs/efw/efw 2005/efw2005-2.pdf.
45. Louis-Philippe Béland and Raaj Tiagi, “Eco-nomic Freedom and the ‘Resource Curse’: An Empirical Analysis,” Studies in Mining Policy, Fraser Institute, Vancouver, BC, 2009, https://www.google.ru/url?sa=t&rct=j&q=&esrc=s&source=web&cd=1&ved=0CBwQFjAA&url=http%3A%2F%2Fwww.fraserinstitute.org%2FWorkArea%2FDownloadAsset.aspx%3Fid%3D2574&ei=tqkDVMngLaHl4QSQx4GQBw&usg=AFQjCNH_xME5PwJC81j_xJilk9CaEE9ocA&bvm=bv.74115972,d.bGE&cad=rjt.
46. Ibid.
47. Mehlum. Moene, and Torvik, “Cursed by Re-sources?”
48. Andrei Illarionov, “What Is to Be Blamed for Economic Stagnation in the Arab World?” presentation at the Second Economic Freedom of the Arab World Conference, Amman, Jordan, November 23, 2007, http://www.iea.ru/article/econom_svoboda/22_11_2007.ppt.
49. Daniel J. Mitchell, “The Impact of Govern-ment Spending on Economic Growth,” Heritage Foundation, Washington, 2005, http://www.heri tage.org/research/reports/2005/03/the-impact-of-government-spending-on-economic-growth.
50. Maria Sarraf and Moortaza Jiwanji, “Beat-ing the Resource Curse: The Case of Botswana,” Environmental Economics Series, Paper no. 83, World Bank, Washington, 2001, p. 11.
51. See Gylfason, “Nature, Power and Growth,” p. 558.
52. See Weinthal and Jones Luong, “Combating the Resource Curse.”
53. For a detailed discussion of economic de-velopment in mining economies, see “Treasure or Trouble? Mining in Developing Countries,” World Bank, Washington, 2002, http://site re-sources.worldbank.org/INTOGMC/Resources/treasureortrouble.pdf.
54. PriceWaterhouseCoopers, MineIndonesia 2007: Review of Trends in the Indonesian Mining Industry (Jakarta: PWC, 2008).
55. “Mining Sector Attracting Major Investments,” Armenia (London: European Times, 2010), p. 39, http://www.european-times.com/publications/ armenia.pdf.
56. See Philippe Fargues, “Immigration without In-clusion: Non-Nationals in Nation-Building in the Gulf States,” Asian and Pacific Migration Journal 20

47
(2011): 273–92, http://www.smc.org.ph/administra tor/uploads/apmj_pdf/APMJ2011N3-4.pdf.
57. Sterilization of revenue inflows in oil- and gas-exporting countries has been most commonly as-sociated with actions taken by a country’s central bank to neutralize the harmful effects of capital inflows causing domestic currency appreciation and inflation and the consequent possible de-crease of export competitiveness.
58. See Benn Eifert, Alan Gelb, and Nils Borje Tallroth, “The Political Economy of Fiscal Policy and Economic Management in Oil-Exporting Countries,” in Fiscal Policy Formulation and Imple-mentation in Oil-Producing Countries, ed. J. M. Da-vis, R. Ossowski, and A. Fedelino (Washington: International Monetary Fund, 2003), pp. 82–122; and Xavier Sala-i-Martin and Arvind Subramani-an,” Addressing the Natural Resource Curse: An Illustration from Nigeria,” IMF Working Paper no. 03/139, International Monetary Fund, Wash-ington, 2003, http://www.imf.org/external/pubs/ft/wp/2003/wp03139.pdf.
59. See Fund market value estimates by the Alaska Permanent Fund Corporation, http://www.apfc.org/home/Content/home/index.cfm.
60. See BP Statistical Review of World Energy: June 2015 for oil and gas production data by energy source and by country.
61. BP Energy Outlook 2013, Slide 45, http://www.bp.com/content/dam/bp/pdf/energy-economics/energy-outlook-2015/bp-energy-outlook-book-let_2013.pdf.
62. See Bruce Jones, David Steven, and Emily O’Brien, “Fueling a New Order? The New Geo-political and Security Consequences of Energy,” Brookings Institution, Washington, 2014, http://www.brookings.edu/research/papers/2014/04/14-geopolitical-security-energy-jones-steven.
63. Robert Priddle, ed., EIA World Energy Out-look 2011: Are We Entering a Golden Age of Gas? (Paris: International Energy Agency, 2011),
http://www.worldenergyoutlook.org/media/weowebsite/2011/WEO2011_GoldenAgeofGas Report.pdf.
64. See BP Energy Outlook 2013, Slides 22-24, http://www.bp.com/content/dam/bp/pdf/energy-economics/energy-outlook-2015/bp-energy-out-look-booklet_2013.pdf.
65. See Peter Kaznacheev and Irina Grinets, “The Role of Innovative Development in Unconven-tional Hydrocarbon Exploitation in the Con-text of the Shale Gas Revolution in the USA,” Journal of Social, Political, and Economic Studies 39 (2014): 436–66, http://papers.ssrn.com/sol3/papers.cfm?abstract_id=2553720.
66. See Lars Lindholt and Solveig Glomsrød, “The Role of the Arctic in Future Global Petroleum Sup-ply,” Discussion Papers No. 645, February 2011, p. 8, Statistics Norway, Research Department, https://www.ssb.no/a/publikasjoner/pdf/DP/dp645.pdf.
67. Fred R. von der Mehden and Al Troner, “Petro-nas: A National Oil Company with an Internation-al Vision,” Baker Institute for Public Policy, Rice University, Houston, 2007, http://bakerinstitute.org/media/files/page/9dd51576/noc_petronas_tro nervdm.pdf. Also see Valérie Marcel, Oil Titans: National Oil Companies in the Middle East (London: Chatham House; Washington: Brookings Institu-tion Press, 2006), http://books.google.ru/books?id=jUU0mkUyuNQC&pg=PA69&lpg=PA69&dq=petronas+is+the+most+efficient+national+oil+company&source=bl&ots=4g-tOeoseA&sig=73JkBxa8lUP2T22dZuG-iGaWUVU&hl=en&sa=X&ei=FUcEVM3uCuHXyQPmrYHgAw&ved=0CE0Q6AEwBw#v=onepage&q=Petronas&f=false.
68. The share of natural resources in overall ex-ports and in a country’s GDP is calculated us-ing data from the UNCTAD Statistics Data Center website, http://unctadstat.unctad.org/wds/ReportFolders/reportFolders.aspx?sCS_ChosenLang=en.
69. James Gwartney, Robert Lawson, and Joshua Hall, Economic Freedom of the World: 2015 Annual
48
Report (Vancouver, BC: Fraser Institute, 2015).
70. Doing Business 2016: Measuring Regulatory Quality and Efficiency (Washington: World Bank, 2016), http://www.doingbusiness.org/~/media/GIAWB/Doing%20Business/Documents/Annual- Reports/English/DB16-Full-Report.pdf.
71. World Bank, “GDP per Capita, PPP” web page, http://data.worldbank.org/indicator/NY.GDP. P C A P. P P. C D ? o r d e r = w b a p i _ d a t a _value_2014+wbapi_data_value+wbapi_data_value-last&sort= desc.
72. UNCTAD Statistics Data Center website.
73. Gwartney, Lawson, and Hall, 2015 Annual Report.
74. See Doing Business 2016.
75. World Bank, “GDP per Capita, PPP” web page.
76. Natural Resources Canada, “Key Facts and Figures on the Natural Resources Sector” web page, https://www.nrcan.gc.ca/publications/key-facts/16013.
77. See Chapter 3 on Canada in “Fostering Foreign Investment in Mineral Exploration and Develop-ment in Russia,” Kinross Gold Corporation, Mos-cow, 2011.
78. Gwartney, Lawson, and Hall, 2015 Annual Report.
79. See Inflation.eu website, http://www.inflation.eu for the worldwide inflation data. For the historic data for Chile, see “Inflation Chile—1971,” Inflation.eu, http://www.inflation.eu/inflation-rates/chile/
historic-inflation/cpi-inflation-chile-1971.aspx.
80. See José Piñera, “Wealth through Ownership: Creating Property Rights in Chilean Mining,” Cato Journal 24 (2004): 295–301, http://object.cato.org/sites/cato.org/files/serials/files/cato-jour nal/2004/11/cj24n3-7.pdf.
81. Overall, Chile’s copper production in 2014 was 5.8 million tons, of which Codelco produced 1.8 million tons or 32 percent of overall Chilean cop-per production. For details, see “Codelco Update,” Codelco, Santiago, April 2015, https://www.codel co.com/prontus_codelco/site/artic/20110803/asoc-file/20110803155044/codelco_update_april2015.pdf. Also see statistical information about Chil-ean copper mining, Statista website, http://www.statista.com/statistics/254845/copper-production-of-chile/.
82. World Bank, “GDP per capita, PPP” web page.
83. See Gwartney, Lawson, and Hall, 2015 Annual Report.
84. See Doing Business 2016.
85. United Nations Development Programme, Human Development Report 2014: Sustaining Human Progress—Reducing Vulnerabilities and Building Resil-ience (New York: UNDP, 2014), http://hdr.undp.org/sites/default/files/hdr14-report-en-1.pdf.
86. For details on the historical movement of the oil price, see data from the archives of the U.S. Energy Information Administration “Petroleum & Other Liquids” website, https://www.eia.gov/dnav/pet/pet_pri_spt_s1_d.htm.