c:usrlibroslibro devouring pdev.ico.org/projects/cabi_cdrom/pdffiles/librodevouringp.pdf · reduce...
TRANSCRIPT

Devouring
Hernando Duque-O.2
Peter S. Baker3
1 IPM: Integrated Pest Management
2 MSc. Agricultural Economics. Researcher, National Research Coffee Centre, Cenicafé,Colombia. E-mail: [email protected]
3 PhD. Coffee projects coordinator, CABI, Bakeham Lane, Egham, TW20 9TY, UK.E-mail: [email protected].
Profitthe socio-economicsof coffee berry borer IPM1

2
Credits EDITORIAL COORDINATION
Héctor Fabio Ospina Ospina
DESIGN AND LAYOUTCarmenza Bacca Ramírez
PHOTOGRAPHYGonzalo Hoyos Salazar
Héctor Arévalo Martínez
Printed by:FERIVA S.A.
Cali, ColombiaFebruary 2003
© The Commodities Press1
20031A joint CABI-CENICAFÉ enterprise
5M7Mcaa6Mc/D86
DUQUE O., H. ; BAKER, P.S. Devouring profit; the socio-eco-nomics of coffee berry borer IPM. Chinchiná, The CommoditiesPress - CABI-CENICAFÉ, 2003. 105 p.
EntomologíaHypothenemus hampeiAnálisis económico de Hypothenemus hampeiContro integrado de Hypothenemus hampei

3
Markets can be efficient, but nobodyever said they are fair.
The question is: what do we owe thefuture?
[Robert Stavins]

4
WAcknowledgments
We thank the many people directly involved in the project execution as wellas the decision-makers interviewed. Thanks to their fully collaborative rolewe gained a wealth of information that was a key factor in allowing us toconstruct this book. Likewise we are most grateful to the coffee farmers wemet in our visits because their viewpoints gave us many insights into the fieldrealities of IPM, CBB and their struggle to produce coffee.

5
Contents
Acknowledgments
Glossary
Executive summary
Chapter 1Introduction
Chapter 2Talking to the farmers
Chapter 3How the coffee berry borer is controlled: evidence from sixcountries
Chapter 4The economic losses caused by CBB
Chapter 5Case studies in CBB economics
Chapter 6CBB: towards a socio-economic synthesis
Chapter 7Conclusions and recommendations for CBB control policy
Bibliography
Appendix AThe coffee growers
Appendix BThe role of coffee in the countries studied
19
69
11
4
31
4251
6472
7884
96

6
Glossary
n ANACAFÉ, Asociación Nacional del Café, the Guatemalan Coffee Institute.
n ANECAFÉ, Asociación Nacional de Exportadores de Café, the Coffee Exporters Associa-tion of Ecuador.
n Arroba, a weight unit, used in Colombia, equal to 12.5 kg.
n Biological Control, using nature to control pests. All organisms have predators, but somemanage to escape them by migrating. The coffee berry borer is one of them, its co-evolvednatural enemies stayed in Africa. Projects such as the one from which this work sprang, aim toreunite them.
n CABI, CAB International is a not-for-profit treaty level intergovernmental organisation with41 member countries including several major coffee-producing countries. It consists of twodivisions - CABI Bioscience and CABI Publishing. Its main goals are generation and brokering ofscientific knowledge for developing countries. CABI Commodities is an initiative of CABIBioscience.
n CBB, coffee berry borer (Hypothenemus hampei (Ferrari 1867)) a 2 mm long black scolytidbeetle (related to wood-boring beetles) that is the most significant pest of the world’s mostimportant tropical agricultural commodity.
n CENICAFÉ, Centro Nacional de Investigaciones del Café, the Colombian coffee researchinstitute, a division of the Federation of Colombian Coffee Growers.
n CFC, Common Fund for Commodities is an intergovernmental financial institution, fund-ing commodity development projects globally. The Agreement establishing the Common Fundfor Commodities was negotiated in the United Nations Conference on Trade and Develop-ment (UNCTAD) in the 1970s, concluded in 1980 and came into force in 1989. Currently theCommon Fund has 104 Member Countries plus the European Community, the Organisationof African Unity/African Economic Community (OAU/AEC) and the Common Market for East-ern and Southern Africa (COMESA).
n Cherry, a term for the ripe intact coffee fruit with (from outside in) skin, pulp, mucilage,parchment and bean.
n Cultural control, a broad term, in this book it involves the manual removal of berries fromtree and/or ground.
n Green coffee, the dried bean with the outer parchment removed by milling. In this formcoffee is exported, ready to roast.
n ECOSUR, El Colegio de la Frontera Sur, Chiapas, Mexico

7
n Gleaning, the term for cultural control used in India, chiefly for cleaning up all berries afterthe main harvest.
n Graniteo, frequent collection of coffee berries from the trees, a form of cultural control(q.v.).
n ICO, The International Coffee Organization (ICO) is an intergovernmental body whoseMembers are coffee exporting and importing countries. Established in 1963 it administers theInternational Coffee Agreement from its headquarters in London, and is committed to improv-ing conditions in the world coffee economy through international co-operation, helping priceequilibrium by developing demand for coffee in emerging markets and through projects toreduce damage from pests and improve marketing and quality, enhancing coffee growers’long-term competitiveness and contributing to the fight against poverty.
n IHCAFÉ, Instituto Hondureño del Café, the Honduran coffee institution.
n IPM, Integrated Pest Management, a knowledge-intensive strategy for controlling pestswhere the farmer estimates current and future damage to his crop and picks from a range oftechniques to optimise profit. The basic principle is that control measures should cost less thanthe losses incurred by inaction. It requires knowledge of pest biology, continual monitoring ofthe crop, an appreciation of the worth of control methods, simple maths and an understand-ing of commodity price dynamics.
n Parasitoid, a specialised predator that lays its eggs on or (as in the case of Phymastichuscoffea,) in the insect. The egg hatches out and kills its host by consuming it. Parasitoids differfrom parasites in that the former always kill their host to complete their life-cycle.
n Ochratoxin, a toxin produced by (amongst others) the fungus Aspergillus ochraceus whichforms on poorly dried coffee.
n Parchment coffee, the coffee bean with a hard outer covering (the endocarp) dried toabout 12% relative humidity.
n Pepena, a form of CBB cultural control used in Central America, involving the collectionof the coffee berries remaining on the ground, after the harvesting period.
n Promecafé, Programa Cooperativo Regional para el desarrollo tecnológico y Modernizaciónde la caficultura - a Central America coffee technology network formed under the auspices ofIICA.
n Repela, a form of CBB cultural control used in Central America, involving the collection ofthe coffee berries remaining on coffee trees, after the harvesting period.
n Quintal (qq), a weight unit, equal to 46 kg.
n RRA, Rapid Rural Appraisal, a participatory method for gathering data, opinions etc. fromfarmers on a wide range of issues.
n USDA, United States Department of Agriculture, specifically the Biological Control & MassRearing Research Unit at Starkville Miss.

8

9
T
Executive summary
The coffee berry borer (CBB) is the most important pest of coffee due to its globalspread and negative effects on coffee quality and yield. Coffee is the most valuableexport crop of tropical countries and it has a social importance as a stable cash earnerfor millions of the rural poor.
In 1998 a project started on integrated pest management (IPM) of the CBB, financedby the Common Fund for Commodities (CFC). The project, (involving Colombia, Ecua-dor, Guatemala, Honduras, India, Jamaica, Mexico, USDA, ICO and CABI Commodi-ties) included a socio-economic component in order to understand the relationshipsbetween CBB and coffee farmers in terms of wage costs, production costs, productiv-ity and coffee prices. The present book summarises this work and attempts to drawsome conclusions on ways to overcome this enduring problem in a sustainable fashion.
We visited six countries to gather data from farmers, extensionists and decision-makerson CBB management and programmes, the idea being to gain first-hand data wherepossible of field realities from a ‘bottom-up’ standpoint. Through interviews, researchand case histories, we pieced together the various ways that CBB causes economicdamage, the costs of controlling it and the ways it is tackled in different countries. From this approach we conclude that CBB is part of the current coffee quality problem.It should be viewed as a quality issue that especially affects smallholders because theylack access to buyers who are willing to pay them a sufficiently high price to warrantcontrolling it.
Current efforts at promoting higher quality coffee have concentrated on removal of thepoorest or ‘triage’ coffee after it has been milled. We suggest in this book that anappreciable part of the triage problem is that farmers are not sufficiently rewarded forproducing high quality coffee that is free of CBB and other defects.
This is because of poorly developed nation-wide standards and premiums as well aslocal market structure. We further suggest that adoption of IPM is hampered becauseof the same problem; it can be costly and farmers do not see sufficient reason to takeit up.
We also conclude that the spread of CBB and the nature of the damage it causes,highlights shortcomings in the commodity chain that require comprehensive actionfrom a range of stakeholders. In the context of the current coffee crisis, the CBBproblem accentuates the difficulties that producer country institutions have encoun-tered in responding adequately to new problems that threaten livelihoods of resource-poor coffee farmers. Baker et al. (2002) explore this subject further.

10
Some of the recommendations of this book are:
n Rewarding farmers for producing good quality coffee will stimulate interest incontrolling CBB.
n When this happens, a range of techniques and ways of imparting knowledgeneed to be available to satisfy demand.
n These techniques are most likely to be developed through participatory interac-tion with farmers.
n The methods need to be practical, economically viable and objectively validatedin the field.
n These will take time to develop and researchers and extensionists will need to beretrained to accomplish it.
For a discussion and a more expanded set of conclusions, turn to Chapter 7.

11

12
1.0 Setting the scene
n India: “Reduced to penury by low prices for more than two seasons, coffeegrowers in the southern Indian state of Karnataka have started taking their own lives. Theburden of debt and continuing heavy losses in spite of recent marginal price improve-ments have led at least half a dozen planters to commit suicide at Chikmagalur andKodagu. As gloom pervades the country’s two most productive coffee growing centres,small planters are being chased by moneylenders for recovery of dues. [Kunal Bose,Financial Times; Aug 15, 2002]
n Ecuador: “The campesinos of Orellana [NE Ecuador] are struggling in order toimprove their production so that they won’t be forced to cultivate coca, Pedro Garcia, afarmer of the province, told IPS. “We want to continue planting coffee or some otherprofitable crop, but for this we need credits, subsidies, roads to transport our harvest. Ifnot, we will have to plant coca,” as has happened in Colombia, Peru, and Bolivia, heinsisted. Garcia explained that “strange people” have approached him offering to pay fiveto seven times as much for coca as he receives from coffee. “Coca is a more resistantcrop, and they will give us everything we need in order to cultivate it, they pay five toseven times as much as for coffee, and they take out the crop from our farms for us. If thegovernment doesn’t help us, we are being pushed into planting coca”. [Kintto Lucas,Interpress Service News Agency, Quito, 28 Feb, 2002]
n Guatemala: “…the coffee crop’s role as life support system for the region’smass of poor tenant farmers has been highlighted this year by a famine. Farmers, manyof them indigenous Indians, survive poor harvests by hiring themselves out to pick coffeebetween November and March. But after drought withered the crops there were 300,000fewer jobs this year. At least 125 people have died of malnutrition in Guatemala and60,000 face starvation”. Coffee has been the sector that has given life to Guatemala.”[Fernando Montenegro, president of Anacafé, cited by Andrew Bounds Financial Times;Jun 26, 2002]
n Honduras: “Coffee in Honduras is fundamental for the national economy, notonly by being the country’s principal export but also for its ability to directly redistributewealth to more than 109,000 families. Coffee generates employment, develops internaltransport to many regions, backs public finances and encourages commerce in both theindustrial and rural sectors. The economic, political and social life of many towns inHonduras revolves around this bean.” [La Central, 2001]
n Mexico: “The Mexican government has started to distribute a long promisedUS$147 m. aid package to coffee farmers. The distribution had been delayed until theMexican government completed a census of coffee farmers. The government is aiming toprovide a subsidy of US$20 for each 46 kg bag of coffee produced by the farmer in 01/02. The census found that there were 369,000 coffee farmers in Mexico cultivating650,000 hectares. The majority of farmers are in serious trouble with the internal pricewell below the cost of production, which is estimated by the Mexican Coffee Council at53 ¢/lb.” [NKG Statistical Unit, www.nkgstat.com, September 2002]

13
n Colombia: “Authorities from the police and army confirmed that in the lastthree years, as the coffee sector crisis deepened, the Departments of Caldas, Tolima,Risaralda, Quindío and N Valle suffered a severe fracturing of public order. Robberies roseby 90% in the last 3 years, kidnappings shot up and the insecurity on the highwaysbecame generalised.” [El Tiempo, Colombia, December 2001]
Coffee is globally significant for development. As the most valuable product of thetropics, for more than a century it has been a principal product of national economiesin many developing countries. Some rough calculations estimate that about 22 millionfamilies live from coffee. Additionally, the coffee industry as a whole generates about100 million jobs with 60% of them in the producer countries (Federación Nacional deCafeteros, 2001).
The coffee berry borer (CBB) is the most important coffee pest because of its world-wide distribution (present now in all coffee-producing countries except Hawaii, PapuaNew Guinea and Panama) and its cryptic lifestyle (Le Pelley, 1968). Hidden inside thebean for most of its life, it causes direct loss of value to the product and is hard tocontrol by pesticide applications.
A problem such as CBB throws into high relief many of the issues caused by therapidly changing and globalising coffee industry. These include: the quest for higherquality, health and environmental concerns about pesticide abuse, the applicability ofdeveloped country concepts to solve developing country problems, the declining for-tunes of research/extension services and the difficulties of providing the rural poorwith new knowledge and techniques.
To understand the issues, we will first resume some relevant knowledge about CBBand how it is presently controlled. We will then examine the problem in specificcountries from several sources including data collected through interaction with poorsmallholder farmers. From this we develop both an economic analysis of CBB andthen generate some hypotheses about the underlying forces involved. We end bymaking recommendations to improve CBB control in the future.
1.1 The berry borer problem
The female CBB perforates the berry and penetrates into the developing coffee bean.She then starts to feed from the bean and the reproductive cycle commences, causingvery significant losses (Decazy, 1990). The degree of damage is complex to definebecause the pest can cause at least three types of loss: premature drop of youngerberries, loss in weight and loss in quality (see Chapter 4).
CBB live almost exclusively in coffee berries. There are a few records of them attack-ing other seeds, but alternative hosts are insignificant. Each female (2 mm long) will lay30 or more eggs that take four to six weeks to mature to new adults. Siblings incestu-

14
ously mate inside the berry. Some females will then emerge but others will stay andstart laying their own brood. Eventually the whole bean and its pair inside the berry canbe eaten out. But this takes many months and the majority of berries are harvestedbefore this happens so that most berries harvested with a CBB entry-hole have oneinfested and one normal bean.
It was previously thought that CBB could only fly short distances. Now we know thata kilometre or more is well within their range. This is a significant factor in times of lowcoffee prices when some farmers abandon their plots leaving a source of CBB to infestsurrounding areas.
Only the female flies and when she finds a new berry she immediately starts boringinto it. When she gets as far as the bean (endosperm), she makes a decision thatdepends on its consistency. If it is more than about 20% dry weight she will carry onboring and start laying eggs within two or three days. If it is less than 20%, she will stopand most often she will wait in the short tunnel until the bean has developed further.Not surprisingly, the borer has the ability to locate mature berries so that if these arepresent, they will be preferentially attacked. This gives rise to the following rules:
n When CBB levels are low, most of them will be found in maturing berries (>180days after flowering).
n As CBB levels rise, available ideal berries will be occupied and they will increasingly attack younger berries.
n Younger berries are less suitable hosts for the CBB, fecundity is lower and mortal-ity is higher.
n Hence as populations rise there is a density dependent effect tending to reducethe rate of increase.
n This means that it may be very difficult to control CBB at low levels but easier athigh levels because in the former case most of the population is deep inside theberry and consequently harder to kill.
The critical period for applying control of the CBB is before it does damage to theendosperm, i.e. before about 110 to 120 days after flowering. In some countriesfarmers are exhorted to record moments of major flowering and carry out spraying atabout 100 days after each of these events. This can work well where there are one ortwo major flowerings and a few very minor ones. But in Colombia for instance, withmany flowerings, well-timed sprays become more difficult.
This leads to the idea of integrating various methods and observations into a controlstrategy known as integrated pest management (IPM). Thus from the knowledge above,the farmer could take two sorts of measurements, pest levels (so that he monitors thepopulation and takes action before CBB multiply) and flowerings and then, accordingto what he finds, make a decision to control or not. Unfortunately, smallholder farmers

15
are not used to making measurements and recording them for future reference andaction. We will return to IPM later.
1.2 Ways to control CBB
Insecticides: a number of products are employed, though endosulfan is the over-whelming favourite of farmers and regrettably this is also a highly toxic product tohumans.
n Advantages of insecticides: efficient (up to 80% mortality) to kill adult females inthe entry tunnel.
n Disadvantages of insecticides: health risk; environmental damage; costly to apply(up to 5 man-days/ha for a small farmer); not so effective at killing mature infes-tations; CBB can develop resistance to insecticides; poor image for coffee ex-ports.
Until recently, it was common for governments, commodity boards and donors tosubsidise pesticide inputs. Now subsidies are out of fashion and NGOs have done agood job of pointing out the perils of the cheap provision of poisons. The use ofchemicals is becoming increasingly unacceptable in modern coffee production and inthe case of CBB, the two most effective pesticides, endosulfan and chlorpyrifos, arealso two of the most dangerous to apply. At the policy level, the argument for sustain-able agriculture has been won, the chemical approach is no longer acceptable, as isnow confirmed by the approaching EU-wide ban on many of these substances. But noone has told the farmers and simple alternatives are not easy to come by.
Biological control (parasitoid wasps): there are four principal wasps, Cephalonomiastephanoderis, Prorops nasuta, Heterospilus coffeicola, and Phymastichus coffea. Thefirst two have been studied extensively and released in many countries; although theyestablish readily in most regions, the control they exert is small and even when re-leased in large numbers their control effect has been disappointing. H. coffeicola hasbeen studied in the field and seems promising, but as yet rearing it has proved toodifficult to allow it to be quarantined and shipped to other countries. P. coffea on theother hand can now be reared successfully and preliminary experiments suggest it ismore effective than the previously tried wasps.
n Advantages of wasps: environmentally clean; no health risk; easy to use.
n Disadvantages of wasps: still too expensive for commercial augmentative re-lease, though this may change in the short to mid-term.
Biological control (pathogens): Beauveria bassiana (Bb) is the most studied and field-tested. Lifetable studies in Colombia suggest that Bb is the major natural biotic mortal-

16
Box 1. The farmer’s treadmill.
Coffee production increased in many countries over the last decades of the 20th
century through the use of high yielding varieties, fertilisers, high-density plant-ing and pesticides. Indeed, because of increasing competition leading to over-production and declining prices, farmers may feel forced to intensify produc-tion further in order to increase margins and stay in profit. A Brazilian coffeegrowers’ leader recently stated that only Brazilian farmers who produce about40 bags4 per ha, more than double the Brazilian average (and several timesmore than many countries) will survive and prosper in the future (Knight,2002).
Before the arrival of CBB in Latin America, farmers had few pest problems. Intimes of low prices, poor farmers could effectively abandon their coffee but stillreturn to pick a crop, albeit smaller, but at a profit. Furthermore, their lack ofhusbandry would lead to lower yields that would help to restore prices. Butnow, if farmers do nothing, CBB may often render the crop worthless. So eitherthey abandon the crop altogether, which is difficult because of few alternativeson mountain slopes, or they intensify production to pay for control costs.
Another problem is that CBB control tends to become more difficult as produc-tion intensifies and trees are planted close together, making them harder tospray effectively without increasing self-contamination of the spray operative.Thus farmers risk the health of family members or hired hands, and lay them-selves open to opposition and action from NGOs, unions, environmentalistsand consumers. If they use full protective gear against poisoning, costs spiralbecause operatives are slower, uncomfortable and require frequent rest. Inpractice very few take more than the most rudimentary precautions; one Co-lombian farmer explained to us that although it was his son that now ran thefarm, he still carried out the spraying to protect his son and any future grand-children from harm.
4 One bag = 60 kg green coffee
ity factor affecting the CBB in Colombia. Its effect is especially heavy when CBB areattacking young berries and in this case, and under rainy conditions, mortalities of >80% have been recorded.
Considerable data is now available from small scale spraying trials (Baker, 1999).Mortalities of 80% of adults in entry tunnels have been achieved, i.e. equivalent to themost efficient insecticides, but at doses far above the commercial rate. Furthermore,full mortality takes about a month to become apparent so even if sprayed, the femalelives long enough to enter the berry and damage it.

17
n Advantages of Bb: environmentally safe; little health risk.
n Disadvantages: slow acting; kills CBB in the entry tunnel but at a commercialdose only at about a half of the rate of insecticides; difficult to apply (up to 5man days/ha for a small farmer), quality control problems of commerciallyproduced Bb; needs to be stored cool; has a shorter shelf-life than chemicals.
Cultural control: the simplest method, consists of hand removal of infested berries,most usually by paying extra labour to pick off all berries (clean and infested) afterharvest or by picking more regularly. It sometimes includes picking berries off theground where, if conditions are not too wet, CBB can build up to very high numbers(in some cases more than 100 CBB per berry).
n Advantages of cultural control: environmentally clean; no health risk; easy tounderstand; no equipment required; it is very effective if done rigorously, cansometimes generate an extra income to the farmers.
n Disadvantages of cultural control: costly and tedious; difficult to do on old trees;very dependent on quality of labour; coffee collected by this method may be oflow quality but could still be sold.
Overview: there exists no simple way of controlling this pest, that is clean, efficient,easy to understand and carry out and moderately priced. One response made byfarmers is to intensify production so that the extra income can pay for the control (Box1). Another is to do little, which causes loss of income and leads to increase in infes-tation of neighbours’ plots as CBB migrate in.
1.3 Integrated Pest Management (IPM)
Due to the potential damage caused by CBB, many countries have adopted controlpolicies to reduce economic losses without deleterious environment effects. Thesehave focused on the integrated pest management strategy (IPM) of which there areseveral definitions. One of them states that: “IPM is an ecological and multidisciplinarystrategy that uses several control and compatible tactics in one co-ordinated system inpest management” (Prudot, 1986). Definitions tend to emphasise that IPM gives thebest combination of methods for pest control in order to maximise the harvest value,minimise the human health risks and avoid environmental damage. Some definitionsgive more or less emphasis to the environmental or economic component and moststress the need to determine pest damage before control is taken, weighing up thecost of the intervention against the likely benefit.
Thus with IPM of CBB, the farmer chooses from a range of options that may includecultural control (manual methods, trapping, etc.), biological control (parasitoids and

18
microbials) and, if necessary, the occasional use of safer pesticides. In theory, thefarmer should be sufficiently knowledgeable about CBB to estimate its economicpotential to eat into his profit and employ the right control method at the right time tooptimise his income by rationalising costs incurred.
This is a tall order. The farmer is expected to make quite detailed field-measurements,take notes, calculate damage and employ a “just-in-time” approach to control. Thereality is that the farmer’s understanding and resources severely limit his ability toaccomplish this. He therefore frequently adopts a “just-in-case” approach where hesprays insecticide, perhaps several times a year, to suppress the problem. This maycost him more money, damage the environment, his health and the image of coffee tothe consumer.
IPM was not developed in the tropics for smallholder farmers but in northern coun-tries. According to Morse and Buhler (1997) the broad approach of IPM as we under-stand it today had its origins in North America and as such it can be seen as a techno-logical innovation born out of the industrialisation of capital-intensive agriculture wherethe expansion of production based on price supports generated an appreciable surplusfor the U.S. government in the 50’s. This expansion of agriculture developed a particu-lar dependence upon chemical pest control that inevitably led to environmental prob-lems. Under these circumstances IPM emerged as a new alternative to deal with pestproblems as an environmentally friendly strategy with the aim of reducing the worryingdependence of farmers on pesticides.
Morse and Buhler observe that since IPM stems from capital-intensive agriculture: “itcan not be easily transferred into the social context of resource-poor farmers doing agri-cultural work in developing countries”. As we will see, the adoption of IPM compo-nents in the case of CBB illustrates this important insight.
A further problem with IPM is that everyone, from organic farmers to agrochemicalcompanies, claim to adopt its principles. As such it has lost a certain amount of forcedue to the broadness of its constituency.

19
I believe that a man who has spent a considerable partof his life growing coffee, and on extension work in
coffee country, has a right to air opinions and advanceideas that may prove of value.
[AE Haarer, 1956]

20
Although the project (CFC/ICO 02) was focused on only one of the most importantproblems in coffee production, it was considered important to have an overall view ofcoffee farmers’ concerns to gain perspective and help guide future research and ex-tension efforts. The following analysis involves the information gathered in rural meet-ings, using methodologies such as Rapid Rural Appraisal (RRA). More background dataon farmers can be found in Appendix A.
The advantage of this participatory approach is that much of the data collected is up todate and gathered directly from the mouths of stakeholders. In consequence how-ever, it has the disadvantage of being less rigorous than a long-term in-depth study.Nevertheless, we believe the results obtained are a reliable estimate of the true socio-economic state of small coffee farmers in all these countries.
As development scientists we have to make a pragmatic balance between scientificmethod and practicability, to give an analytical but useful contribution to the economicimplications of the problems caused by CBB and how they are affecting coffee grow-ers lives. We hope that the information here can serve as the basis for future researchand extension activities. More general information on coffee in each country can befound in Appendix B.
The coffee producers in all the countries in this case study were mainly smallholders.They are a heterogeneous group but many displayed some or most of the followingcharacteristics:
n Widespread lack of the legal property rights to land, which implies lack of collat-eral.
n A low education level, many with less than full primary education.
n The majority of them above 50 years old, with sons and daughters apparentlyunwilling to take over from fathers.
n Aversion to risk.
n Low income, and diversification of income such as employment off-farm; therebyincreasing the opportunity cost of labour on the farm and thus reducing the like-lihood of adopting new and labour-intensive activities.
n Lack of entrepreneurial capability.
n Resignation to the status quo and/or passively expecting government assistance.
n Small farms (less that 3 ha in coffee).

21
n Table 1. Problems in coffee production, Kogadu region.
2.1 India
In India two main regions were analysed. At Chettalli Coffee Research Sub Station, ameeting was carried out with coffee growers from the region. Firstly an RRA on themain coffee production problems was done and then a survey related to CBB manage-ment was also carried out. The main problems in coffee production identified andranked by the farmers appear in Table 1.
n Table 2. Kogadu farmers’ potential solutions to price and marketing problems.
Thus the main problems are to do with how the coffee is sold, lack of infrastructurewhere irrigation facilities are seen as very important in coffee production and in thirdplace the cost of inputs needed in coffee production such as fertilisers, herbicides,etc. CBB is in the fifth place though a lot of concern about this problem was ex-pressed. Additionally, this group of farmers saw the following strategies as potentialsolutions to the price fluctuations and market problems (Table 2).
Apart from government responsibilities, farmers’ opinions are oriented towards im-proving economic conditions of their business but as active participants, which meanstaking action by themselves in order to overcome difficulties that they see as theirresponsibility.

22
n Table 3. Problems in coffee production, Kalpetta.
The results of the survey carried out on perceptions of CBB are as follows: all of thefarmers thought that CBB is a very important problem; 57% of them have sufferedeconomic damage from the pest; the average level of infestation for the 2000-2001coffee harvest was 3.6%. 83% of them have the opinion that phytosanitary controlmeasures are the most important against CBB, whilst just 17% thought that chemicalcontrol was the most important. 71% of the growers find control measures easy toadopt. Finally, 85% consider they have enough resources to deal with the pest whilethe other 15% lacked financial assistance to manage it.
On the other hand, in a meeting held in Kalpetta (Wayanad district), farmers listed thefollowing problems (Table 3).
Problem Importance Low coffee prices & general market situation 1 High wage costs & low labour efficiency 2 Lack of technical knowledge on spraying 3 Rainfall pattern 4 Assessment of CBB losses 5
In this case the main problems are similar to those of Kogadu farmers with low pricesand the poor market situation identified as the most serious problems. However farm-ers here rated labour problems higher, believing workers to be costly and inefficient.Another key point is that they were worried about lack of knowledge on sprayinginsecticides and the difficulty of assessing CBB losses.
As potential solutions to their problems, coffee planters suggested diversification ofagricultural production in order to spread their income sources, to reduce productioncosts, to have government support and to promote coffee consumption.
In this meeting a survey was also held on CBB with the following results: 57% of thefarmers indicated that CBB is a very important problem, 29% classified it as “impor-tant” whilst 14% felt that CBB is less important. 42% of them have suffered economicdamage due to CBB attacks whilst the other 58% have not experienced significantdamage caused by this insect. The average level of infestation was about 7.8%, i.e.about twice as high as the other group and this has clearly influenced their prioritisationof problems. Over which is the most important control measure, opinions were di-vided: 42% believed that chemical control is best, another 42% indicated that culturalcontrol is sufficient while 16% thought that alcohol traps were more useful. Whenasked about whether they have enough resources to carry out CBB control, 71% toldus that they have no problems, whilst 29% of the farmers indicated that they do nothave enough money to do these activities.

23
n Table 5. Potential solutions for coffee productivity.
2.2 Ecuador
An RRA was carried out in Las Flores (Manabi). The goal was to understand farmers’opinions about the main problems in coffee production. They listed the problems andranked them (Table 4).
n Table 4. Main problems in coffee production, Las Flores.
Problem Score Lack of community organisation 5 Low productivity 3 Commercialisation problems 3 Coffee berry borer 2 Pelicularia koleroga – a coffee disease 2 Coffee rust disease – H. vastatrix 0
Problem Score
Fertilisation 4 Prune coffee trees 2 Improve harvest efficiency 2 New coffee varieties 1 Change shade trees 1
5
5 This means to collect more selectively red berries
Thus when farmers were asked in an informal but systematic manner about the gravityof the problems facing coffee production, ‘lack of community organisation’ was thoughtto be the main problem followed by low productivity and problems in the commer-cialisation process. Despite all the farmers being aware of the CBB problem this is nottheir main worry. For instance a group of farmers from Piñas, mentioned that they hadhad this pest for more than 8 years and during this period its advance was slow withoutserious attacks. Having categorised the problems listed above, we focused on lowproductivity as a topic and invited farmers to suggest possible solutions. Table 5 de-scribes the potential solutions for these problems.
It seems clear that fertilisation is seen as the first step to improve coffee productivity,but credit access difficulties were raised as a difficult hurdle to overcome. Neverthe-less, the key point here is the generalised perception of low coffee productivity bymost coffee farmers and that it was considered more important than CBB. Productiv-ity is a relevant variable to take into account when dealing with CBB since experiencesin other countries facing this pest have shown that coffee productivity and CBB aretwo sides of the same coin. Thus low productivity will not provide sufficient economicconditions to stimulate CBB control among the coffee growers. From this we concludethat if coffee production in Ecuador remains generally unintensive, high IPM adoptionlevels for this pest will always be difficult. We suggest that actions aimed at improvingcoffee profitability are vital in order to help change the coffee farmers’ attitudes to-wards IPM.

24
n Table 6. Price fixing analysis in February, 2000.Commercialisation Stages US$ cents/green pound
1. International price –arabica washed 103 (minus) quality penalty 16 2. Sub-total 87 (minus) exporter’s fixed costs 12 3. Sub-total 75 (minus) exporter’s profit 3 4. Sub-total 72 (minus) first intermediary 8 (minus) second intermediary 8 (minus) third intermediary 8 5. Coffee farmers’ price 48
Commercialisation problems: this is one of the most serious problems of coffeeproduction in Ecuador, because the present set up is squeezing farmers’ income. Alarge part of the profit seems to remain in the hands of the intermediaries, whichgenerates dissatisfaction among the coffee farmers. This sentiment could be observedduring all our rural meetings.
In fact between the coffee farmer and the coffee exporter there are a number ofintermediaries, which in the best of cases we encountered was two, and in the worst,four. The coffee farmers sell their product in different forms: 61% sell as berries, 4% aspartly dried parchment, 14% as dry parchment, 19% as dry berries and 2% as greenbeans. However in each case the intermediary assigns a price in an apparently arbitraryway. E.g., during the previous harvest (May to July 1999), for the same week and inthe same municipality the price was about US$16/qq cherries for some farmers but forothers it was about US$12/qq without any apparent reason to justify this differential.Moreover, this internal market structure does not pressure farmers to improve thequality of Ecuadorian coffee and the general rule when buying coffee is to take intoaccount only its weight and no other characteristics. Thus these coffee intermediariesgenerally do not check coffee quality for both damage caused by CBB and otherdefects. This situation militates against production of good quality coffee because themarket does not pay for it. Indeed it was mentioned that an additional factor seriouslyaffecting quality is that these same intermediaries provide inadequate care of thecoffee during the time they hold it, so that delays in the subsequent processing jeop-ardises its quality.
The cost of the commercialisation chain: an example given by the farmers. Atypical situation encountered in the coffee chain is explained below. The case is forarabica coffee, which is assumed to have an international price US 103 cents of dollarper pound on the New York exchange (price at the time of the survey in early 2000).Taking this price as a baseline, we can see how the price erodes until it arrives at farmlevel (Table 6).
In real terms, price has decreased by about 53%, a serious reduction of the farmer’spotential income. A similar situation happens in the case of robusta coffee but in this

25
n Table 7. Main problems in coffee production, Agua de Piedra region.
n Table 8. Main problems in coffee production, El Tigre region.
case reduction for quality is smaller than arabica (US$0.08/pound). Hence anotherpreliminary conclusion is that prices depend far too much on the various interests ofthe many intermediaries involved in this process. In broad terms, ultimately Ecuado-rian farmers are risk takers because there are no measures in place to protect theirincome.
2.3 Honduras
Two meetings were carried out and each of them detected different problems, whichare analysed independently.
n Agua de Piedra farmersThis group was from the small town of San Luis. They were asked about their mainproblems as coffee producers. Table 7 shows their choices.
The main two difficulties were commercialisation and low coffee prices, which con-firmed what local extensionists had told us. Again CBB is not regarded as a mainproblem in coffee production. But it was evident that farmers think that poor com-mercialisation and low prices are negatively affecting crop management. Hence fromthis lack of management we expect increased CBB attacks in the future and in thisway increased losses and poorer quality.
n El Tigre coffee farmersThis group of farmers is near to Lake Yojoa, an important coffee zone. Table 8 summa-rises the perspectives of this group on coffee production.

26
For farmers in this area, low coffee prices and lack of credit are the main problems,followed by the cost of the inputs needed to produce coffee. New pests, such as CBBand the role of intermediaries are also important. They gave higher importance to pestproblems, especially CBB; perhaps climatic conditions in this region are more favour-able to pests because of the more humid climate. Intermediaries there can demandan interest rate of about 40% per year from farmers, which is significantly higher thanthe interest rate offered by the local banks.
Commercialisation problems: an imperfect market, which is the case of the Hondu-ran internal coffee market, can lead to seasonal and normally low coffee prices be-cause of the harvesting peaks. The result is a highly vulnerable production systembecause of fluctuating availability of labour and assets. For instance, labour costs tendto be higher during the harvest period because it is scarce and in many cases farmershave to bus workers to and from distant villages. Another important factor is that theinternal market buys coffee by weight and discounts the price reduction according tolevel of CBB damage. There is no national standard for these penalties, for instanceone trader reduces the price by 1% for each 3% of perforated dry cherry coffee froma 500g sample, which should correspond to 1.5% in parchment coffee. At the CoexCompany, coffee exporters take a sample of 100 g of cherry coffee. If CBB damage isover 2%, the company will refuse the coffee, which seems a very severe penalty.
2.4 Guatemala
The case of the Chocola community: Chocola is a peasant coffee community, with anarea of about 2,450 ha. This enterprise was founded by the Guatemalan governmentin 1972, giving the land to 772 farmers as a result of a programme of land reform.Although Chocola has its own post-harvest infrastructure, this has been rented toCoex, a coffee trading firm. For this reason most of the coffee producers sell theircoffee to this firm which buys the coffee by weight, ignoring any potential differentia-tion by quality. So farmers here are not encouraged to achieve better coffee qualitybecause the market does not reward it. We had a meeting with 12 coffee growersfrom Chocola who we involved in a RRA; Table 9 shows the results.
From this analysis, it seems that lack of commitment to maintain a sound coffee cropis the main problem. Farmers were almost unanimous that people from their commu-
Problem Score Lack of community interest 5 Lack of community organisation 4 Low coffee prices 3 Lack of money 2 Coffee berry borer 1 Coffee leaf rust 0
n Table 9. Main coffee production problems in Chocola.

27
6 US$1=7.7 Quetzales (2000)
nity are not paying enough attention to their coffee crops. They felt that the state ofthe coffee business is so difficult that they are discouraged to invest time or money toimprove productivity. They also cited the lack of organisation at the community levelas a principal reason for lack of enterprise. However all of them were concerned aboutCBB; they considered that this pest is able to substantially reduce the out-turn (con-version rate) of coffee cherries to parchment coffee. Asked about the possible solu-tion to the lack of interest, these farmers analysed all the factors they could think ofand Table 10 summarises their deliberations.
Thus from the farmers viewpoint, education is seen as the main path to self-motiva-tion. Despite these difficulties, farmers were asked about CBB management before
n Table 10. Potential solutions to Chocola farmers’ lack of interest.
and after the project started. They admitted that before the project began CBB man-agement was non-existent. After the activities carried out by the project the situationhad improved, at least for the farmers interviewed, because they were trying to adoptsome of the proposed practices.
Selling the coffee: there is frequently a long commodity chain for smallholder farmersin Guatemala. The first actor in the chain is the coffee producer who sells his coffee toan intermediary. There can be two or three intermediaries that buy coffee in differentways such as ripe cherries, parchment coffee or even green coffee. The longer thechain, the lower the price paid to the farmers. These intermediaries sell the coffee tothe exporters who apply discounts according to quality.
In the case of Chocola, the farmers could sell their coffee to the community organisa-tion that was paying 58 Quetzals6 /qq of cherries, but they preferred to sell to theintermediary who pays 60 Quetzals /qq, though some farmers had doubts about thereliability of the weighing machines used. Intermediaries also act as an informal bankbecause farmers borrow money from them. The amount they lend varies between3,000 and 8,000 Quetzals per farmer; sometimes as much as 15,000 Quetzals. Theinterest rate is very high, about 5% a month. But this credit facility leads many small-holders to sell their coffee to the intermediaries most of the time. Larger farms tradetheir coffee themselves, many of them are also exporters so this most likely makesthem more aware of losses due to CBB. The quality problem is worth highlighting: themiddlemen simply weigh the coffee and pay for it, ignoring the real quality. Hencethere is no encouragement to improve quality of the coffee. This must negativelyaffect the efforts to encourage active CBB management.
28
n Table 11. Main problems in coffee production, Ejido Mixcun.
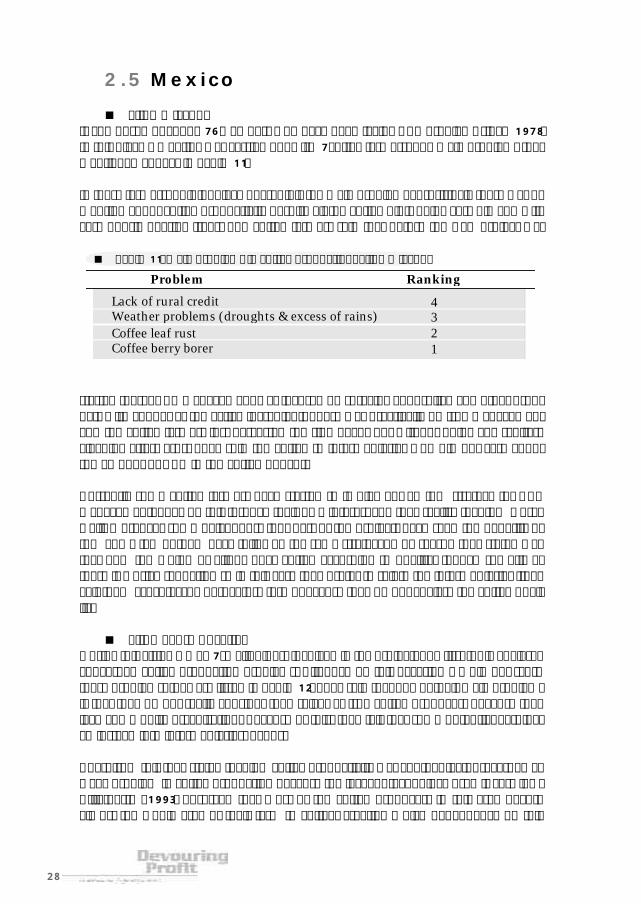
2.5 Mexico
n Ejido Mixcun:Is composed of about 76 members who have been facing CBB problems since 1978.In this place a meeting was carried out with 7 coffee farmers. The main problems theymentioned appear in Table 11.
In these farmers’ opinion, lack of credit is the main problem. Surprisingly there was nomention about coffee productivity despite all the coffee plots being very old and withvery poorly bearing trees. The coffee farmers said that before the CFC project was
Lack of rural credit 4 Weather problems (droughts & excess of rains) 3 Coffee leaf rust 2 Coffee berry borer 1
Problem Ranking
started there, CBB management was focused on spraying endosulfan and other prod-ucts with copper as the active ingredient. There was practically no true managementand the coffee farmers just harvested the ripe beans but without doing any sanitarycleaning afterwards. They sold the coffee to intermediaries who did not care aboutthe amount of CBB in the coffee bought.
Currently some coffee farmers have started to implement an IPM strategy for CBBmanagement. They do this through their own interest and they realise that IPM workswell. Moreover some neighbours (not part of the project) have seen the benefits ofIPM and a few of them have followed the same strategy. One reason they stated wasthat now the Union of Ejidos buys coffee according to quality, though sometimesthere is a price reduction so in this case they prefer to sell to the intermediaries (theycall them “coyotes”, a derogatory term) because they do not analyse the coffee qual-ity.
n Ejido Santa Rosalia:During this visit we met 7 smallholders involved in the project. The first topic analysedconcerned coffee production problems. Although on this occasion we did not scorethese problems, they are listed in Table 12. They said that one of their main problemsis that they do not really consider themselves as true coffee producers because theylack community organisation. Because of this, they felt that some potential earningsgo instead into intermediaries’ hands.
Apart from this they stated that low coffee productivity was another factor regarded asa key problem in coffee production because the level of technology used is very low.Villafuerte (1993) observed that most of the coffee producers in this area devotealmost the whole area of their farm to coffee, creating a high dependency on this

29
n Table 12. Main problems in coffee production, Ejido Sta. Rosalia.
crop. A key point is that average productivity is only about 10.5 qq of parchmentcoffee per hectare, similar to the national average. The density of trees per hectaresuggests the coffee production in this locality is intermediate (between tradi-tional,- 1500 to 2000 trees/ha, and intensive, - at least 4000 trees/ha). Each year theyrenew an average of 370 coffee trees per hectare (range 200 to 500), which demon-strates interest in having new trees even though crop management is not intensive.Regarding coffee varieties, they prefer the traditional Borbon and Typica, observingthat a coffee tree is considered old when it is more than 50 years old. In the case ofCaturra or Catimor varieties on the other hand, trees over 12 years are considered asold and unproductive. We developed a work calendar with the farmers, from whichwe estimated total labour needs at about 200 working days/ha distributed throughoutthe year, presenting a peak in November due to the coffee harvest. Labour require-ments are significantly less than would be the case with intensive production.
They commented that the “coyotes” (private buyers) check the coffee and mark downthe price for poor quality. If the coffee farmer does not control CBB, price reductionscan be about 8 to 10%; moreover it can be further affected by a weight reduction ofaround 2 kg in a 60 kg sack. In both cases this is a significant amount of money forthem to lose.
The role of the intermediary: Belisario Dominguez is the name of a village wheremost local coffee farmers sell their coffee to intermediaries. In this place Mr. JuventinoVelásquez, a local coffee trader, was interviewed. He has been buying coffee for morethan 15 years; sometimes he also lends money to farmers. Normally he works with acapital of $100,000 Mexican pesos, which can be distributed among 20 farmers, i.e.an average of $5,000 per person (about US$500). The interest rate he charges is about5% per month, which was six times the national Mexican inflation rate. At the begin-ning of harvest, farmers often lack funds so they are more or less forced to approachthe intermediaries. But he is worried because since 1998-99 the people to whom hesells on the coffee have been sampling the quality and make deductions for poorquality.
The cost calculation he does is very simple: if the coffee price is about US$62.5/qq inHuixtla7, the baseline price in Belisario would be around US$59 to 60. Intermediaries
7 Huixtla is in this case the nearest most important coffee market where all theintermediaries of this locality sell coffee.
Lack of economic resources High transportation costs, due to distance between farm & selling point Low coffee prices Lack of government support
Mycena citricolor)
Problems (not ranked)

30
n Figure 1. Main problems affecting IPM participatory research project farmers
get the daily coffee price from nearest main towns: Huixtla & Motozintla. With a priceof US$60.0/qq, to be paid to the farmers, if in a handful of parchment coffee there are4 fermented or defective beans, the purchase price will be reduced to US$55 to 56/qq. If there are 6 beans broken or damaged by CBB, the price will be US$56 to 57/qq.
Farmers claimed that some traders bias the scales in order to pay less money for thesame amount of coffee. It is believed that the intermediary can gain 2 or maybe 2.5 kgper sack of 60 kg.
2.6 Colombia
Colombian coffee growers are facing many problems. As in other countries, the mostimportant is the low coffee price, which has been ruling the coffee market over recentyears, leading in 2002 to the lowest real price ever. Social conditions have also changedbecause of the economic crisis leading to increased violence and insecurity. Despitethese circumstances the internal coffee market continues to operate well. Colombiancoffee farmers are in a fortunate minority of those who receive immediate paymentfor their coffee at a transparent rate closely related to the international coffee price.They achieve this because of the well established co-operative system and a soundcoffee institutional structure. However at the beginning of the project ICO/02 a sur-vey was carried out in order to determine the main problems faced by the Colombiancoffee producers. Figure 1 describes these problems.
Hence low coffee prices and CBB were the main problems and comprised 71% of thetotal. Of the countries visited for this study, only in Colombia did CBB figure as aprincipal problem. In the other countries it appeared more to be a symptom of otherstructural problems which were weighing heavily on farmers.
In the Colombian case we can conclude that CBB was one of the most importantproblems because the internal coffee market punishes the price if the level of damageexceeds certain limit. The main consequence was a severe price reduction.

31
“Agricultural production has evolved into a complex business. It requires the accumula-tion and integration of knowledge and information from many diverse sources includingmarketing, horticulture, pest management, accounting and tax laws. Emerging sustain-able practices require even more information (to substitute for purchased inputs such aspesticides) for implementation. Growers seldom have at their disposal all informationavailable in a usable form when major management decisions must be made. Increas-ingly, modern growers must become experts in the acquisition of information for deci-sion making in order to remain competitive.
Unfortunately assistance from specialists is becoming relatively scarce as the complexityof agriculture is increasing. As growers struggle with the new “rules” of agricultural pro-duction, they are faced with a still greater problem. The public wants reduced pesticideresidues, but high quality fruit. The rapid change in pest control is further complicated bynew labour, marketing and social concerns that threaten to exceed the capacity of whatgrowers can manage.”
[Travis & Edwin, 1995]

32
3.1 CBB control strategies
Before we get to the main economic analysis of CBB IPM, in this chapter we presenta synopsis of our field survey data showing what is actually happening on farms. Thepurpose is collect first-hand information to inform our analysis and help generate newideas. The methods used for collecting data were through direct interviews and ruralmeetings. The former was used mainly at the decision-maker level and the latter atthe level of technicians, agronomists and farmers. All countries have officially adopteda broad IPM approach to CBB control, though a clear statement about what IPMmeans and how to transfer it to farmers we found to be mostly lacking. There weredifferences in approaches between countries, but the main elements were shared incommon. Although it was impossible to get a comprehensive picture of countrywideIPM we are confident that the following account is reasonably accurate.
Researchers have a good grasp of IPM principles, though the regimes they have sug-gested tend to be overly complex and seemingly not designed for resource-poor farm-ers, indeed we found that many scientists had an imperfect appreciation of rural socio-economic realities. For example, when suggesting a new activity, coffee institute ex-perts may be unaware of the labour needs of other crops grown by the farmer. For thebest of motives, biological control is recommended, though the economic utility of sodoing has still not been established clearly in most cases. Cultural control (manualcollection of berries) is the main recommendation and the dangers of chemical controlare duly stressed.
In no country has every candidate element of IPM had a full cost-benefit assessmentand then been integrated into an optimal IPM regime. Instead researchers have had tomake more ad hoc recommendations to respond to urgent demands from farmers.Generally they have made sensible suggestions but long-term research to approach anoptimal system, adaptable to farmers of differing means, has not been set up. Withthe current scarcity of funds it seems unlikely that this will be carried out in theforeseeable future. Prior to the project from which this book stemmed, research wasnot participatory, i.e. farmers were not formally contracted as partners in the researchprocess to develop practical ways of building an IPM strategy. To an extent then, wefeel that IPM theory has dominated the research process, rather than the more mod-ern approach of research as an inclusive and pragmatic process-driven exercise.
3.2 CBB IPM in six countries
3.2.1 IPM in India
In order to cope with the CBB problem the Coffee Board of India has structured anIPM strategy based on the following components:

33
n Picking of the infested berries and treating them with hot water, then burying inthe soil.
n Timely and thorough harvest.
n Proper gleanings using harvesting picking mats to collect the falling berries.
n Drying coffee to the standard test weight.
n Early disposal of the crop.
n Spraying insecticides in hot spots (in extreme cases only).
The Indian Coffee Board has proposed a standard method for CBB sampling at plotlevel as a component of the IPM strategy. Farmers are instructed to take 10 plants peracre at random and then to select 5 branches per coffee tree (50 branches/acre intotal). They establish the infestation level by counting both attacked and non-attackedberries. This process should be carried out once a month and the decision level forcontrol is when CBB attacks exceed 5% infestation.
Awareness of the pest a report of the extension campaign on CBB awareness held inKogadu district (Coffee Board, 2001), covering 130 holdings, reported the followingfindings:
n All coffee growers were aware of CBB. Personnel from the coffee board hadtrained 52% of them, 44% got information through mass media and 4% knewabout the pest from neighbouring farmers.
n Knowledge of the pest: 97% of the coffee planters were able to identify the CBBattack symptoms.
n Chemical control: about 11% were acquainted with chemical control measures,doses, time of spraying, etc. Many of them did not use this measure because ofthe low infestation level.
n Phytosanitary measures: 65% of coffee growers showed good knowledge of thiscontrol measure.
n Biological control: in the survey just one grower was using it. Farmers were quitesceptical about the utility of bio-pesticides.
n Post harvest measures: only 24% were aware of possible control measures duringpost harvest processing.
Technology adoption: A socio-economic study carried out by Coffee Board and re-cently analysed by Duque (2002), showed that the adoption of the components pro-posed for CBB management was variable. For instance, components such as gleaningcollections and the use of picking mats were the most adopted. However the fungusB. bassiana was poorly adopted by the farmers as was the use of sticky traps. Table 13summarizes the adoption of all the components of the IPM strategy for controllingCBB in India.

34
n Table 13. Adoption of components in Indian IPM.
8 Coffee Board – India, 2000
Component Adoption (%) Beauveria bassiana 5 Spot sprayings 35 Blanket sprayings 41 Hot water treatment 20 Sticky traps 3 Picking mats 74 Gleaning collections 95
Month Main CBB Operations January
February Complete crop harvest / treat the floats in boiling water / dry the coffee as
indicated. March
April Continue collection of leftover fruits and gleanings, boil and bury them. May e pest / spray insecticide if needed / remove all of the off-
season fruits or monsoon coffee / give them the boiling water treatment. June Monitor the pest closely / remove off- season coffee / spray insecticide if
needed. July to August
Monitor the pest closely / spray insecticide only if absolutely needed.
September Programme insecticide spraying depending on the level of infestation. October Monitor the pest closely as also the development of the berries / spray
insecticide if required and not done before. November Monitor the pest closely, identifying hot spots in the estate / deploy
biological control if needed. December Monitor the pest closely identifying hot spots in the estate / deploy
biological control if needed.
Start harvest from infested blocks / leave few plants unharvested / dry the coffee to the standard weight.
Similar operations as February / harvest remaining crop near the drying collect gleanings and leftover berries and subject these to boiling
water before drying.yard /
n Table 14. Calendar of operations in Indian CBB management – robusta coffee8 .
CBB – calendar of operations: despite some differences in CBB management be-tween arabica and robusta the following calendar of operations represents the mostimportant practices in CBB management in robusta coffee. Table 14 describes thesemonthly operations.
As may be concluded from Table 14, there are some key months for CBB manage-ment, such as those around the beginning of the year and also those from August toDecember.
Inter-crops are also important income generators. Approximate estimates that we madewith the farmers suggest that inter-crops represent from 20 to 30% of total income,which confirms their importance in the coffee production systems in India. Table 15

35
9 Used just during establishment, 2-3 years10 National Coffee Council of Ecuador
shows the harvesting periods for the inter-crops in three coffee zones of India. It isclear that all of them have non-coffee labour needs that compete with those opera-tions required for coffee. Despite cheap labour in India, if coffee prices continue low,some critical decisions for optimal deployment of labour may be necessary. For in-stance if certain CBB operations need to be carried out at the same time that orangeor pepper have to be collected, a problem of labour allocation could arise. This is agood example of the importance of a comprehensive analysis of the whole farm budgetto assess the likely impact of new control recommendations.
3.2.2 IPM in Ecuador
The Consejo Cafetalero Nacional, Cofenac10 (1999) has made recommendations toreduce the infestation levels of CBB. These recommendations include:
n Pick up and burn the berries attacked by CBB, especially from minor flowerings.
n Carry out shade regulation in order to increase illumination, which is less favour-able to the pest.
n Prune the coffee trees to promote healthy and vigorous plantations.
n Carry out sufficient weeding to avoid competition for sunlight, water and nutri-ents.
n Apply fertiliser to ensure good crop productivity.
Anecafé (1999), an exporter organisation working in CBB control, principally promotesthe use of cultural control. This control measure is based on coffee harvesting of allripe beans, collection of the fallen berries and pruning the coffee tree. The use oforganic insecticides and biological control is also increasingly promoted.
Thus the main IPM message given to farmers concerns the employment of culturalcontrol. We believe this to be the correct approach but since farmers are not paidmore for CBB-free coffee, the usefulness of carrying out this measure depends en-
Regions Crops Harvesting months Kogadu Orange September / October
Pepper December / January / February Wayanad Pepper December / January / February
Ginger9 September / October Pulneys Pepper December / January / February
n Table 15. Harvesting periods of some inter-crops in India.

36
11 For example, pruning and weeding.
tirely on convincing farmers that the extra weight they save by selling CBB-free berriesis worth more than the extra labour cost. This may well be true, but there is noexperimental evidence to back it up. Hence the need for farmer participatory studiesto quantify these fundamental IPM parameters in a form that can be readily assimi-lated.
3.2.3 IPM in Honduras
Since in Honduras coffee trees flower in January and February, problems caused byCBB start to be seen in the developing berries by May, June and July. In this countrythe IPM strategy is based on five components: use of parasitoids, cultural control (thetwo main activities are ‘pepena’ and ‘repela’), chemical control, sampling of the pestpopulations and general crop management practices. The extension service of IHCAFÉhas been involved in transferring all these components to the coffee farmers.
During a meeting in Santa Barbara with a group of extensionists, an RRA was carriedout on the various components of this IPM strategy. They were asked about severalfeatures of each IPM component: effectiveness, easiness, cost, environmental effectsand effects on human health. Table 16 shows the score given to each component ona set of characteristics.
n Table 16. Components of IPM strategy and their characteristics (higher score indicates more of the attribute).
According to Table 16, the most effective components are both manual CBB removaland chemical controls, where “effective” means that they are good at reducing pestpopulations. The lowest effectiveness is seen with crop management, which is logicalbecause these activities are addressed to general activities and are not related directlyto CBB population control. Regarding “easiness to carry out”, which should play animportant role in the readiness to adopt the component, pepena/repela and culturalpractices are seen as the best. In reality this means they are not difficult to understandand require no special equipment or skills and that they have been accustomed tocarrying out these activities over a long period.
Related to the cost of each element, the use of parasitoids, pepena/repela and sam-pling are considered as most costly, followed by cultural practices and chemical control
Component Effectiveness Easiness to carry out
Costly Environment friendly
Healthy
Parasitoids 17 8 14 24 24 Pepena /Repela 24 24 15 24 24 Chemical Control 24 8 9 8 8 Sampling 22 9 16 20 23 Crop management11 14 21 10 18 16

37
which is in fact the cheapest component of all. This is not a desirable combination; ifchemical control is regarded as both effective and cheap, it may well encourage farm-ers to choose this component over others. Nevertheless, chemical control is consid-ered the most dangerous for both the environment and human health.
In the meeting we convened in Agua de Piedra, coffee farmers were asked how theyranked in importance the different IPM components, results appear in Table 17.
n Table 17. Ranking of importance of CBB practices. Aguade Piedra farmers.
As can be deduced from Table 17, the collection of coffee berries is the most impor-tant activity carried out in CBB management by these coffee farmers. This is an en-couraging result because they do not consider the use of insecticides before tryingcultural control. However, we cannot ignore that these very resource-poor farmersmostly lack spray equipment.
3.2.4 IPM in Guatemala
The recommended CBB management strategy is based on several components (Camposet al., 1998). Sampling methods should be used to support control decision-making.CBB sampling should start 90 days after the most important flowering in order toknow both the infestation level and to identify infestation “hot spots” in the coffeeplots. Manual control is the second component. This is based on the collections ofremaining berries after harvesting on both coffee tree and ground. Also, new perfo-rated fruits from the new harvest should be removed from the plot. Biological controlis implemented by using the parasitoid Cephalonomia stephanoderis. This natural en-emy of CBB should be released from the finishing of the harvest up to the beginningof the new one (January to September), but so far this recommendation is made onlyfor large plantations.
Accurate information about IPM uptake at a national level was hard to accuratelyassess. We suspect that most large estates still use significant amounts of chemicalinsecticides under an IPM framework whereas smallholders use much less. The CFCproject concentrated on one community of smallholders and, although this may notbe representative of Guatemalan smallholders in general, an account of CBB manage-ment there now follows.
CBB Management in the Chocola Community: a survey was carried out here in1998, when coffee farmers were asked about CBB management. The findings were

38
remarkable, 81% of them said that they did not manage CBB as such. The mainreasons were lack of advice and economic problems. However all of them carried outat least one activity against this pest. Cultural control was done by 38% of farmers butmore than 30% were ignorant of the benefit/cost aspect of this activity. Chemicalcontrol was carried out by 22% of them, by spraying with endosulfan; those that didnot spray cited lack of money as the main reason. However when spraying they do itover the entire plot, and not in hot-spots as recommended under IPM criteria. Moreo-ver, of those that use insecticides almost 60% spray twice despite the recommenda-tion of once a year. Regarding biological control, none of them were carrying out thismeasure; just 19% had received information about this but 81% of them indicated thatthey would be interested to test this control measure.
97% of the farmers did not sample. The cause seems to be lack of knowledge andinformation. Only one farmer reported using flowering as a reference to calculatespraying time. None of the other farmers who sprayed assessed pest levels in theirplots and perhaps the low education level is one of the barriers to adoption of thiscomponent of the IPM strategy. Remarkably, despite CBB having arrived in Guatemalain 1971, farmers stated that they do not have enough information about samplingCBB. This is a similar result to the other countries we visited, where most farmers donot sample, one of the main reasons being the lack of mathematical ability to carry outthe calculations. But despite this problem, most coffee farmers have developed atleast a subjective method to assess pest levels in their farms but we do not haveenough knowledge of it to recommend its use and implementations. Clearly this wouldbe a suitable area for a participatory approach, but Anacafé staff has not taken this up.If they truly want to introduce IPM they need to intensify their efforts in this areabecause estimation of pest numbers is a fundamental component of IPM.
3.2.5 IPM in Mexico
In the case of Mexico, it was clear that the almost total absence of a solid and func-tional extension service has left the coffee farmers in a unenviable state to face CBB.
Farmers’ basic IPM strategy concerns the use of cultural control, which has two keycomponents: graniteo and pepena. This strategy is very similar to that observed inHonduras and Guatemala. The approach is understandable since farmers are poorlypaid for their coffee whether CBB-free or not, and they do not have enough money toobtain external inputs. However we could see that many small farmers carry out somecontrol measures such as cultural control (though not intensively), but lack concepts orexpected results. In the case of the larger producers it was clear that insecticides werethe most used tool against CBB.
3.2.6 IPM in Colombia
Colombia has prominently promoted an IPM strategy for dealing with CBB. This strat-egy consists of a combination of cultural and biological control; the most important

39
benefit seen as a consequence of the adoption of this system is the maintenance ofthe ecological balance in the coffee area and hence sustainability of the coffee regionsin Colombia (Cadena, 1991). Cenicafé has designed a group of technological compo-nents for the management of this pest, which have been transferred to the coffeegrowers through the extension service of the National Federation of Coffee Growersover the last decade. This has been carried out using an educational campaign, whichhas as a main goal the continued production of good quality exportable parchmentcoffee despite the presence of CBB (Saldías, 1996).
The strategy stresses cultural control, which consists of maintaining the coffee plotsfree of ripe, over ripe and dry coffee beans through frequent collections (FederaciónNacional de Cafeteros de Colombia, 1994, 1995). This activity (“Re-re”) reduces theCBB populations and avoids the build up of fallen berries, which are an importantsource of new infestations.
Another component is field sampling of CBB to establish the infestation level of CBBand should be, as explained previously, the baseline to take actions related to pestcontrol. Sampling allows farmers also to know the “hot spots” in the coffee plots (fociof infestation where for some reason CBB is more concentrated) and, if dissectionsare made, to become aware of the state of progress of the CBB’s penetration to theendosperm. To record flowerings is also important in order to know the critical periodsof CBB attacks. There have also been several advances in CBB management duringthe post harvesting process (Bustillo et al., 1998).
Technology adoption: since the introduction of the IPM strategy, Cenicafé has stressedthat the various components are divisible, and that IPM is not a ‘package’ of controlmeasures that need to be adopted concurrently. Some components, such as evalua-tion, are effectively pre-requisites to the effective use of others, such as chemicalcontrol. Few farmers though have adopted sampling. Cenicafé recommends that grow-ers decide on which control components to deploy according to the level of infesta-tion and the resources available.
Cenicafé assessed the adoption of the various IPM components by growers. The re-sults suggested that cultural control (Re-re) is by far the most common control method.Table 18 describes the adoption of IPM components in Colombia (Duque et al., 2000).
n Table 18. Indices of adoption of IPM components in 2000.

40
n Table 19. Adoption of IPM components by IPM participatory re- search projectgrowers 1998 and 2001.
Despite the individual adoption index for each component, a weighted adoption indexwas calculated according to the estimated individual contribution of each method tooverall control. The weighted index was 0.64, which is a good level, considering thatIPM is more a concept than a technology. The adoption of the cultural component washigher than in the other countries involved in the project.
In 1998 Cenicafé commenced an IPM participatory research project with 115 smallcoffee growers affected by CBB in the central coffee zone (Baker et al. 2002). Of thetotal, 68% were intensive growers (5000 or more trees/ha) and 9% were traditionalgrowers, with the remainder placed in the intermediate category. The objectives ofthe project were to:
n Increase adoption of components of the IPM strategy.
n Develop a process to facilitate understanding of IPM by coffee growers.
As part of the project, the change in the adoption rate of the IPM components be-tween 1998 and 2001 was measured. Cultural control (Re-re) remained a predomi-nant form of control, whilst the use of chemical control was significantly reducedbetween 1998 and 2001; significant increases occurred in the use of other compo-nents, such as biological and post-harvest control (Table 19).
2.7 Synopsis
What were farmers who we met trying to tell us? Looking at the problems of the non-Colombian countries together, there is little doubt that most farmers find commercialproblems in their broadest sense, centring around credit and marketing, as their prin-cipal difficulties. They tend to focus blame for their problems on intermediaries andgovernment; they never mentioned the wider world and the globalisation debate.
Because of the lack of premiums for quality, too many farmers simply do not see theircoffee as a high value product that will repay careful tending. Probably the single mostimportant step towards controlling CBB would be the introduction of a country-widequality scheme such as in Colombia.

41
But we have to consider also that the use and implementation of the IPM strategy hasnot been easy for the coffee farmers. IPM is a knowledge-intensive strategy which isdifficult to adopt due to the many measurements, calculations and estimations re-quired to arrive at an optimally cost-effective control regime.

42
As one reviews IPM research programmes for small farmers in theThird World what is most striking is how frequently these pro-
grammes avoid the economic bottom line: is IPM worth thefarmers’ effort?
[Goodell, 1984]

43
CBB is a complex pest because it can cause different types of loss. Normally coffeefarmers are aware of one or maybe two, but in reality it can cause up to three types ofloss. Duque (2000) made an assessment of the economic importance of this pest.
4.1 Categories of losses caused by CBB
Drop of immature berries: CBB may cause considerable shedding of young berries.In Colombia it has been observed that berries less that 90 days old can drop easily ifthey are attacked by CBB. Unfortunately we do not currently have measurements forthis damage though a project by Cenicafé is under way to quantify this effect.
Loss in weight: because of pest damage, the quantity of ripe cherries required toobtain a certain amount of parchment coffee can vary. For instance a normal propor-tion is 5:1, e.g. 5 kilograms of ripe picked cherries to make 1 kilogram of a tradablestandard of parchment coffee, e.g. the Tipo Federación standard in Colombia. Farm-ers’ comments informed that with high CBB attacks this proportion can rise from 5:1to 6, 7 or even 8:1, which translated in economic terms, means heavy losses. Saldarriaga(1994) observed that at high infestation levels, large amounts of ripe cherries wereneeded to get 1 kilogram of parchment coffee, e.g. for a coffee plot with no controlcarried out, she found for the period June to August 1992, that the relationship reached17:1. Likewise when visiting the project in Mexico, we interviewed a farmer (Mr.Estanislao) about coffee and CBB management. He told us that under normal condi-tions 2 baskets of ripe coffee should yield 1 kg of parchment coffee but with CBB henow needed up to 3 coffee baskets to obtain 1 kg of parchment coffee. So the farmerhad reasoned out that this loss was due to CBB attacks.
In the above cases, the farmer understands the weight loss effect because he proc-esses his coffee to the parchment stage (dried to 12% humidity) where he can confirmthe quality of his coffee and probable causes of defects by simple visual inspection.The problem arises when farmers sell coffee cherries, where the true damage levelmay be much harder to determine. In this case the buyer, who often buys by volume,not weight, would most likely adopt a ‘worst case scenario’ and pay the farmer a lowprice that would include a tacit discount for the likely quality of the resulting parch-ment coffee.
Loss in quality: in Colombia, the National Federation of Coffee Growers has definedstandard rules to buy coffee from farmers. These rules aim to ensure that Colombiancoffee meets a certain quality in order to attract a favourable international price. Cof-fee that meets the established norms gets the full official price (Tipo Federación).
A bean that has been the host of a developing brood of CBB is clearly defective and ifpresent in roasted coffee will cause a decline in organoleptic (taste and aroma) quality.The authors do not know the threshold for detection although Montoya (1999), study-ing different types of damage in coffee, found that if the percentage of beans with

44
12 Assuming a exchange rate of $ 2,255/1US$D; 1 arroba = 12.5 kg
even the minimum CBB damage (known in Colombia as the Broca’s kiss - el beso dela broca) rises above 3%, the aroma begins to be altered. Puerta (2000) mentions thatif a sample of beans has 25% perforations, and these perforated beans have lost up to30% of their total weight, this will produce a marked deterioration in the taste of thecoffee. However this figure should be taken as an upper limit over which the qualitycan be regarded as unacceptable.
In Colombia, at the point of sale, buyers sample quality in order to define the finalprice. From the sample taken, the coffee beans are split in two parts: normal beansand defective beans. The defective beans are then separated into two sub-groups. Inone sub-group go traditional defects such as beans with abnormal colours, over fer-mented, vinegar beans, etc. Beans with CBB damage are placed in the second sub-group. Both fractions are weighed in order to estimate the percentage of each defect.According to the weight of each group, the price is defined.
In the Colombian case, the buyers exact quite severe penalties for bad coffee quality.In Figure 2 we can see a simulation of price reduction per unit weight as CBB levelsrise. For this simulation it was assumed that the traditional defects remained constantand below the penalty limit, with a national purchase price of US$13.3/arroba12. WhenCBB levels are zero, the price in the graph is higher because of an extra price pre-mium for this case. As CBB levels increase, the price falls steeply. This situation caneventually lead to considerable economic losses per hectare, which for many farmersnow on very small or negative margins, could mean unsustainable losses.
n Figure 2. Parchment coffee price penalties in Colombia due to CBB inci-dence, a simulation.

45
4.2 Estimation of a lossfunction for CBB in India
According to Zadoks (1987) any reduction in quantity and/or quality of yield is called“damage” which is equivalent to “crop loss”, expressed as reduction in revenue orincome per unit of yield (kg, pound, etc.). As population densities of harmful organ-isms can be determined directly by counting (e.g. insects) or indirectly by injury assess-ment (e.g. foliar pathogens), the loss function aims to equate losses to damage orincidence measurements:
Where:L= LossD= DamageI= Incidence
In a study carried out in India, Prakasan (Central Coffee Research Station, 2001), madean estimation of crop loss due to CBB. Crop loss was estimated at different levels ofinfestation from 0% up to 100%. The study included loss in weight only, because theinternal coffee market in India does not have a clear standard of rules to penalize orreward coffee depending on low or high quality. However the study is important fromthe point of view of CBB-induced yield loss and the findings should be used to teachthe Indian coffee growers about the potential damage caused by CBB. Loss data fromthis study is listed in Table 20.
13 Study conducted by C.R. Prakasan. Central Coffee Research Institute, India 2001.14 A forlit = 40 litres
% infestation Loss in Forlits per 1000 kg of green coffee
Loss in Percentage of green coffee
0 0 0 10 2.8 2.7 30 5.2 5.1 50 12.8 12.6 70 23.8 23.4 90 31.6 31.3 100 37.9 37.2
14
n Table 20. Loss due to CBB according to rising levels of infestation13.
From this information a loss function was estimated (Duque, 2002), using as inde-pendent variable the percentage of infestation caused by CBB and as dependentvariable the loss in percentage of green coffee. A quadratic loss model was obtained(P < 0.0001; R2 = 0.992). The main features of the model appear in Table 21.

46
15 Rs = Rupees
n Table 21. Characteristics of the loss function modelderived from Indian data.
Hence the model is expressed as:
Where:Y = Loss in percentage of green coffeeINF = Percentage of infestation
Figure 3 depicts the model. The nature of the function, from the farmers’ point ofview is especially worrying because losses increase more than proportional to the levelof pest attack. Why the curve should be this shape is not entirely clear but it is possiblethat higher infestations are the result of more mature attacks where CBB have hadlonger to develop, so that their progeny have had more time to proliferate. Thus thedamage curve could be a reflection of population dynamics of CBB inside the berry.
n Figure 3. Loss function due to CBB attacks in India.
Infestation Level 0 20 40 60 80 100
0
10
20
30
40
Los
s in
wei
ght%
Using the model, a simulation of economic loss can be carried out assuming an averageyield of green coffee/acre and a coffee price in Rs15 /kg of green coffee. Apart from thecrop loss analysis made by Prakasan above, other estimates were carried out in a similarfashion, Sreedharan (1995) indicates that in India severe infestations of CBB can causeup to 80% crop loss, while Bheemaiah et al. (1996) observe that preliminary trials inIndia have revealed that at 100% infestation, a crop loss of about 66% can be ex-pected.

47
During the field visits many farmers told us about potential losses due to CBB. E.g. Mr.Vijayakumar pointed out that with poor control of CBB, 30% of the yield could be lost.Mr. Manojkumar explained that when attacks were high, the expected yield would bereduced by 20%.
4.3 Farmers incomereduction due to CBB
Through loss of quality: according to research conducted by Cenicafé, one of themost important losses caused by CBB is deteriorating coffee quality. This is due to theconsumption of the bean by the CBB as well as secondary fungal or bacterial infec-tions. This is manifested in the level of defects found in the routine sample taken atthe buying point, which determines the price received by the grower. Under theFederation’s current buying rules, when the level of defects exceeds 5.5% of thesample due to CBB damage, a 1% price reduction is applied for each 1% increase indefects over 3.5%. On the other hand, a premium is applied at the same rate whenthe level of defects (traditional defects – “pasilla”, as well as those caused by CBBdamage) is below 3.5%.
Figure 4 shows the income reduction in US dollars per hectare, according to differentlevels of attack of CBB in the parchment coffee in Colombia. In this simulation wetake a coffee purchase price of US$13.30/arroba and an average yield of 150 arrobas/ha/year for intensively farmed coffee (1,875 kg parchment coffee/ha).
n Figure 4. Simulation of income reduction through loss of quality due toCBB attacks.
‘

48
n Figure 5. Simulation of crop loss due to CBB infestation levels, Rupees/acre.
These expected losses can be very severe; under present low price conditions thiscould represent more than the potential income per hectare. Hence the pest by itselfcan threaten the economic viability of the business when the farmer faces severeattacks.
Through weight loss: in this case we can use the loss function as estimated from theIndian data as described above. Assuming an average yield of 468 kg of green coffee/acre with a price of Rs 28.5/kg of green coffee, the percentage loss can be calculatedas in Table 22.
0
2000
4000
6000
0 10 20 30 40 50 60 70 80 90 100
Rup
ees/
acre
% of CBB in dry cherry coffee
n Table 22. Simulation of crop losses.
The potential losses relating to different infestation levels, expressed in Rupees/acreare shown in Figure 5, and can be severe.

49
4.4 Cost structure forCBB management
In case studies carried out in Colombia (Duque et al., 2002), the cost of CBB manage-ment varied between 5.5% and 11.0% of the total production cost. Here it is impor-tant to clarify that a higher or lower percentage is related not only to the intensity ofthe pest management but also with the proportion of coffee in production or undernew plantings. When there are extensive areas with young trees, CBB control costsless. On the other hand if coffee is not being renovated (the case with most smallhold-ers), the effect of CBB and its costs of control become greater. A theoretical model ofCBB cost management developed in Cenicafé (Duque, 2001), shows clearly thatwhen the coffee plots are younger the management cost is lower than for older plots.In these latter plots the average cost was about 8.7% whilst the estimated nationalaverage is about 7%. 8.7% is an appreciable extra cost burden and shows why CBBmanagement has become a key component of coffee production in Colombia. Of thisCBB management cost, labour costs comprise 89% because of the high dependenceon laborious cultural control.
This high dependence on labour is a severe problem and has many ramifications:
n It has long been recognised that smallholders can produce better quality coffeethan large farmers because they know their plots well, carry out timely controlsand can pick the berries at the optimum moment to achieve peak quality.
n It is customarily believed that smallholder farmers have abundant family labour toaccomplish these tasks.But results from this (Appendix A) and a previous study(Baker, 1999) suggest that this is not necessarily so; families are now not alwaysso large and in some places farmers see more future for their family in keepingtheir children in school.
n Smallholder farmers may work on neighbouring large farms because of their needfor ready cash.
n Larger farmers may tend to reduce labour costs by resorting to insecticides,sprayed by these same smallholders.
n Smallholders may therefore neglect their own farm, leading to higher pest levelsand lower quality. In this case, migration of CBB from their untended plots spreadsthe problem.

50

51
Economics is the science which studies human behaviouras a relationship between ends and scarce means which
have alternative uses.
[LC Robbins]

52
The previous chapter dealt with the losses due to CBB damage. We now draw onstudies to look further at the implications of the pest in different countries. Data oncoffee farmers in each country can be found in Appendix A; data on coffee in thesecountries in Appendix B.
5.1 Economics of CBB in India
5.1.1 Losses due to CBB
Figure 6 simulates income reduction in Rupees per hectare due to different levels ofCBB damage. As can be seen, reductions will depend on the expected yield. E.g. fora yield of 1,200 kg of green coffee/ha losses will be approximately Rs 7,000 for 20%damage, equivalent to US$155, which is a serious loss.
27000
29000
31000
33000
35000
2 4 6 8 10 12 14 16 18 20 % of CBB
Inco
me/
ha(R
upee
s)
1,200 kg/ha
900 kg/ha
n Figure 6. Income reduction per hectare due to CBB damage rates.
5.1.2 Cost of controlling CBB
Although it is always difficult to establish a standard cost of CBB management, in thesurvey with extensionists at Kalpetta we tried to estimate it. They reckoned the aver-age cost per hectare at about Rs 2,800 but with a skewed distribution (Figure 7).
So if we assume that the CBB management cost is about Rs 2,500 with potentiallosses of around Rs 7,000 if damage rises to 20%, it is quite profitable to carry out thepest control. In a subsequent study carried out by the Coffee Board (Setti et al., 2001)and analysed by Duque (2002), the real costs of CBB management tend to be lowerthan those calculated by the extensionists (Figure 8). It is likely that the decliningcoffee prices between the two studies had caused farmers to reduce costs further andthat this to some extent explains the discrepancy.

53
It is evident that to find coffee growers investing more than 1,500 Rs/acre whencontrolling CBB is now rare. The majority of the farmers tend to spend up to 600 Rs/acre, with 78.3% of the sample is placed in that range. The average cost for CBBmanagement was 426 Rs/acre/year, which equals US$22.6/ha/year.
n Figure 8. Cost of CBB management, farmers’ cost estimates.
n Figure 7. Cost per hectare of CBB management; extensionists point of view in Kalpetta.

54
On average the share of CBB management of total production costs was 3.8% whichis lower than in other countries studied, e.g. Colombia where the share is about twicethat. The CBB cost also varies with farm size. Table 23 shows the CBB cost estimatedfor three farm size categories.
n Table 23. Cost of CBB management according to farm size.
n Figure 9. Crop losses and estimated average CBB management cost (horizontal line).
If we take into account that the survey was carried out in year 2000-2001 before thesubsequent fall in prices, it is likely that farmers are currently prepared to spend less tocontrol CBB, leading to increased levels of infestation.
In order to establish the case for control, costs have to be less than estimated losses.This is best done graphically and Figure 9 depicts potential losses together with theCBB control cost. It should be noticed that when the loss line crosses over the CBBcost, an equilibrium point is reached, meaning that for this particular loss, the cost ofthe IPM strategy matches the loss. Using a graph of this sort can help to make arational decision on whether to control or not, assuming that the farmer can estimatefuture losses. In reality the farmer does not resort to a graph but may make some formof mental calculation which approximates to this. It would be interesting to knowmore about how farmers arrive at their control decisions since this might guide futureextension efforts as well as research aimed at helping them to come to the rightdecision.
In practice, because farmers do not sample, and extrapolation some months ahead toharvest losses is difficult, they will probably tend to expend too much on control. Over

55
several years they may well begin to get an idea of how much damage at variousstages of the crop cycle relates to final harvest yields. This could be an area for futureparticipatory research, presumably a few farmers become experts at knowing whenand when not to apply control.
It should be stressed that CBB control is a function of productivity because if the latteris high, potential losses are correspondingly higher. Conversely if productivity is verylow there could be less interest in carrying out sound control. We will see an exampleof this now from Honduras.
5.2 Economics of CBB in Honduras
Figure 10 depicts potential losses according to different levels of CBB in parchmentcoffee. This simulation (for three different yields per hectare) is based on a price of600 lempiras/Quintal (US$40/qq = US$0.40/lb parchment coffee), and a 1% pricepenalty for 3% damage.
At a meeting at La Fe research station in Honduras, we estimated the cost of CBBmanagement at about 600 lempiras/ha/year (US$40). To make the management ofthis pest worthwhile, the cost/benefit relationship should be higher than zero, butfrom Figure 10, we can see that this would be achieved only if the practices carriedout reduce damage levels by 6 or more percentage points. And it would seem risky forthe small farmer to try to achieve the export (Coex) standard of 2%, since he couldinvest a lot of resources to try to achieve the standard but still fail. Hence an “all-or-nothing” quality standard could discourage farmers trying to improve quality.
n Figure 10. Potential losses due to different levels of CBB for different yields (Honduras)16
16 Exchange rate: 1 US$ = 15 Lempiras
0
33
66
100
1.5 3.0 4.5 6.0 7.5 9.0 10.5 12.0 13.5 15.0 % of CBB in parchment coffee
Loss
(US$
/ha) 15 qq/ha
20 qq/ha
25 qq/ha

56
5.3 Economics ofCBB in Guatemala
Several experiments and studies about economic aspects of CBB have been devel-oped in Guatemala, e.g. Decazy (1989), Ochoa et al. (1989), Zelaya et al. (1989),demonstrating that this problem has received considerable attention there.
5.3.1 Losses due to CBB
Ochoa et al. (1989) found that losses in weight increased proportionally as infestationlevel rose. They estimated losses at two different altitudes, the first at 457 m abovelevel sea and the second at 762 m. The average function over 3 harvests for thehigher altitude was as follows:
Where:
Y= % of total losses in the harvest (including all parchment coffee qualities, by weight)X= % of beans perforated by CBB
If we take the case of Santa Isabel, a large Guatemalan coffee estate as an example,according to Mr. Bartolo Lacan the manager, the average productivity for the last threeyears would be around 45 quintals (qq) of parchment coffee / ha.
For this productivity we can simulate potential losses due to different levels of CBB incoffee fields following Ochoa’s function assuming a price of US$42/qq of parchmentcoffee.
Figure 11 shows the losses per manzana (0.7 ha) and the cost of the cultural control,assuming this is constant at 136 Quetzals/manzana (US$17 at 1999 farm prices). Be-cause we know losses for different levels of CBB, a loss function can be estimated inthis case, which is as follows.
Where:
Y= Loss in US$ per manzanaX= % of beans perforated by CBBSo we have now two functions. On the one hand the loss function as estimated and
XY .6.46=

57
on the other hand we can also estimate a cost function for cultural control, whichwould be:
Where:
Y= Cost of cultural control in US$.
17.7=Y
n Figure 11. Losses due to CBB, with cultural control costs.
0
20
40
60
80
100
120
0 2 4 6 8 10 12 14 16
Potential Economic
Losses
Cultural
Control Cost
Infestation Level (%)
Los
s(U
SD/M
anza
na)
If we make both equations equal, we can obtain the infestation level (X), at whichlosses and costs are the same. In this case it is 2.7%, which is a low infestation level.So if the farmer allows CBB to rise above this threshold, losses will be higher than thecultural control cost, and so this control starts to become profitable. However we alsohave to consider the dynamics of CBB populations because the ideal control momentmay be long before harvest and even a small population could cause economic dam-age some months in the future. In addition, variations in coffee price and/or produc-tivity can change the threshold percentage. For instance, if the coffee price shifts toUS$65 per quintal, the new threshold will be 1.7%. So CBB management is verysensitive to change in prices and productivity. The key point here is that in CBBmanagement the coffee farmers should be aware of the infestation level in order totake better decisions because economic losses due to this pest can be large. Even so,interpreting what they have measured is not always easy and this inevitably makes thissort of technique more difficult to promote.

58
5.4 Economics ofCBB in Mexico
Using the same Guatemalan studies by Decazy (1989), Ochoa et al. (1989), Zelaya etal. (1989), we can apply them to a Mexican case of a small producer from Ejido SantaRosalia, to estimate losses. Mr. Amado Bartolon is the owner of a small farm whoseproductivity is about 13 qq of parchment coffee/ha/yr. For this productivity we cansimulate potential losses due to various levels of CBB following the Ochoa et al.function, assuming a price of US$52 per quintal of parchment coffee.
From Figure 12, losses vary depending on the level of CBB attack, ranging betweenUS$0 and US$69/ha/year when CBB reaches 30%. Hence losses can be important;US$69/ha/yr is equivalent to 22 days work/year in Mexico, approximately one month’sbasic salary, a lot of money in the context of this peasant economy.
n Figure 12. Yield losses due to CBB attack.
0 10 21 32 41 52 62 73
0 5 10 15 20 25 30 % CBB in coffee plots
US$
/ha
Cultural control seems the most appropriate IPM component for the smallholder’scase. According to the coffee farmers from Santa Rosalia, on average they are collect-ing about 1 coffee box (18 kg of dried coffee) when doing pepena (removing remain-ing coffee from trees after harvest), involving about 4 days labour costing about US$12.5.This could save up to US$69, equivalent to the expected loss when CBB reaches 30%infestation. This looks like a good return on investment, with a large safety factor.

59
5.5 Economics ofCBB in Colombia
In Colombia, the area infested by CBB is about 715,000 hectares. CBB was consid-ered to be one of the main reasons for the decline in national production from 13million to 11.5 million bags, at an estimated cost in excess of US$100 million (Duque,2000).
Consider the impact of the level of sample defects on the benchmark “Tipo Federación”parchment price of Col$26,150/arroba of parchment being paid at the Chinchiná Co-operative on 24 January 2002. To give a simple example, a sample containing 6.5%defects would earn Col$25,366 /arroba, 3% less than the “Federation” price, while asample containing 25% defects would earn Col$20,266/arroba, 23% less than the“Federation” price.
5.5.1 Potential losses due to CBB
Table 24 relates the economic losses (due to quality penalties) from CBB defects perunit of parchment coffee to the average yields of two production modes (intensiveand traditional). The table shows that the economic impact of CBB depends on pro-ductivity: with CBB defects of 4% of the parchment sample, intensive growers wouldlose US$64.8 per hectare while traditional growers would only lose US$24.3. A 20%defect level would result in a loss of US$387 per hectare for intensive growers com-pared to US$145 for traditional ones.
CBB defects (%)17 Traditional (60 arrobas/ha)
Intensive (160 arrobas/ha)
4 24.3 64.8 5 31.9 85.0 6 39.4 105.2 7 47.0 125.4 8 54.6 145.5 9 62.1 165.7 10 69.7 185.9 12 84.8 226.3 14 100.0 266.6 16 115.1 307.0 18 130.2 347.3 20 145.4 387.7
n Table 24. Average total (quality penalty) economic losses according to CBB defects by production mode, 2002 (US$/hectare).
17 Keeping constant the other defects

60
For the same percentage of CBB the potential economic losses are obviously muchhigher when the farms have intensive rather than traditional production systems. Be-cause of greater potential losses they may thus resort to too many control activities,especially excessive spraying.
Figure 13 shows for instance the case of a coffee farm with a productivity of 80arrobas/ha, where levels of 20% of CBB in the parchment coffee would present lossesof about USD$145/ha. For the same level of CBB but on a farm producing 200 arrobas/ha, the loss would correspond to USD$484/ha.
n Figure 13. Potential economic losses due to CBB for different productivities.
0
87
177
266
355
443
532
1% 4% 7% 10% 13% 16% 19% (%) Infestation level
80 @/ha/year 120 @/ha/year 160 @/ha/year
200 @/ha/year
Coffee Productivity
Loss
in U
SD/h
a/ye
ar
5.5.2 CBB management costs
Since CBB management can vary widely between farms, Cenicafé has developed atheoretical model that analyses these costs. Two assumptions are made, firstly the costof the management can vary depending on the age of the coffee plot and secondly,the coffee plantation should be split into five plots with ages of between 1 and 5years, corresponding to the recommended 5 year life cycle of the crop in Colombia.Table 25 describes the pattern (Duque, 2001).
The model additionally assumes intensive control of CBB which would only be justi-fied in cases of severe attacks. It further assumes that the cost of the IPM strategyduring the first two years of the plantation is very low and that as the plot ages thecosts markedly increase.
From the costs presented in the table those corresponding to cultural control shouldbe considered as fixed costs of CBB control and therefore should be executed inde-pendently of the infestation level. However the other costs (biological, chemical, etc.)

61
n Table 25. Theoretical model of CBB cost management, 2001 (US$/ha)18 .
should taken as variable costs and their execution will depend on the results obtainedwhen measuring the infestation level and the position of the CBB in the berries. In thisway the decision to spray insecticide for instance and therefore of incurring more costswill be subject to an action threshold.
5.5.3 CBB impact at thenational level – a simulation for Colombia
After we visited all the countries involved in the project ICO/02, it was clear thatColombia has a sound structure for buying coffee. Currently the set of rules estab-lished for buying coffee are clear and transparent for any coffee farmer who should beable to understand how the rules establish the price to be paid. The fundamental ruleis that when the coffee quality is high the price is also higher. Therefore it is in Colom-bia where we have the best chance to estimate the full effects of the pest. In othercountries the problem is confounded with other causes of quality loss, such as poorprocessing.
The Colombian norms are established according to the national strategy with the aimof producing the best coffee quality attainable. The quality assessment is complex andincludes:
n A determination of the ratio of green coffee produced from a given quantity ofparchment coffee.
n Presence of traditional defects (“pasilla”) such as broken and vinegar beans.
n Presence of beans perforated by CBB.
n Bean size.
18 Exchange rate 1 US$ = $ 2,200 pesos
Age of the Plot Cultural Control
Biological Control
B. bassiana
Chemical Control
Insecticides
Machinery and
Equipment
Total Cost per hectare
0 – 12 months 0 0 0 0 0 12 – 24 months 47 0 0 0.9 48 24 – 36 months 17.3 16 25 3.1 152.1 36 – 48 months 149.8 30.3 41.3 4.9 226.4 48 – 60 months 149.8 30.3 82.7 7.1 270
Average 91.0 139.7

62
Because of these factors it can be difficult to isolate the true national economic impactdue solely to CBB attacks because variables interact and affect the price. However itis possible to carry out a simulation of the CBB impact, in economic terms, based ona ceteris paribus analysis, i.e. to analyse the effect of one variable (in this case CBB), itis isolated from the influence of other factors, which should remain constant (Hill,1990). Hence we make some basic assumptions about the coffee quality variablesthat remain constant whilst the CBB damage varies. It should be noted that this sce-nario is developed in absence of any control costs against the pest.
Thus we first estimate that the annual Colombian coffee production as about 10.5millions sacks and the internal price at US$0.38/lb (US$10.4 per arroba19) of parch-ment coffee. Then by keeping the percentage of traditional defects constant as well asthe yield of green coffee from parchment coffee, we can simulate the national eco-nomic loss due to CBB alone.
The economic loss is estimated as the income not received by the coffee farmers dueto quality reduction and it is depicted in Figure 14, with the infestation level on theparchment coffee plotted against losses expressed in millions of dollars. As can beseen the economic impact is very significant because if the national production wouldface only 3% CBB damage on average, the loss would be equivalent to about US$16millions. For CBB damage of 10%, the income lost would rise to US$66 millions.
But the economic losses seen generally in Colombia are those resulting from efforts tocontrol CBB. If CBB were not controlled at all in Colombia we estimate that there
% of CBB in Parchment coffee
0
20
40
60
80
100
120
140
160
1% 3% 5% 7% 9% 11% 13% 15% 17% 19%
Econ
omic
loss
(mill
ions
ofU
S$$/
year
)
n Figure 14. Simulation of economic impact of CBB country-wide.(Expressed as income reduction through loss of quality).
19 Arroba= 12,5 kg

63
would be at least 25% of damaged beans, equivalent to a loss of US$180 million. Infact the cost would probably be higher because sorting could not remove all thedamaged beans and the international status of Colombian coffee would suffer as aresult, leading to a lower market price. If we estimate that the mean cost of controllingCBB down to, say, a level of 5% is US$100/ha and 500,000 ha are currently control-led, this leads to CBB control costs of about US$50 million. If we add to this value thelosses incurred despite control, including weight and quality losses, the total cost ofCBB could be at least US$ 75 million. Since this problem has been widespread inColombia for about 10 years, current accumulated losses must be around three quar-ters of a billion dollars.
5.6 Conclusions
n Despite some detailed studies in several countries, the true economic costsassociated with CBB are not transparently obvious to all stakeholders in all coun-tries.
n The full cost of CBB to a country’s coffee industry, in terms of yield, quality andcontrol costs, have mostly not been calculated.
n There have been no studies on the various externalities of insecticide use, includ-ing water pollution, medical costs, days off work, negative effects on naturalresources, etc.
n More work needs to be done to develop simple ways to help farmers assess fullcosts of CBB.
n More effort should be made to ensure a full understanding by the farmers, ofthe economic implications of CBB damage on both quantity and quality.

64
Pest control needs to be viewed within thecontext of farmers’ goals – which are not
necessarily the maximisation of yields.
[Croxton, 1994]

65
We have attempted to show that CBB is a very complex pest with many factorsaffecting both its abundance and control. In the following analysis we will integrate allthe information we have gathered to formulate a strategic view of the problem.
6.1 IPM strategy
According to the International Pest Management Institute (2002), IPM is: “a systemusing multiple methods, a decision making process, a risk reduction system, informa-tion intensive, biological based, cost effective and site specific”. If this is a widelyaccepted definition it is very clear that IPM is a complex strategy to be understood andcarried out by farmers whatever their socio-economic conditions. This approach im-plies a concerted effort by farmers to comprehend the relationships between thedifferent components and concepts of IPM. We broadly support this approach to pestcontrol but it needs to be made clear that IPM is neither easy to understand nor easyto carry out.
Indeed we submit that the above description meshes uneasily with our own percep-tions of resource-poor farmers’ present capabilities. Either IPM has to become easierto undertake or farmers will require intensive re-skilling.
6.2 How IPM strategy clashes with socio-economic reality
If we look at the requirements of IPM against farmers’ needs and abilities, we deducethat smallholder coffee farmers are not ready for IPM. It presupposes a certain level ofeducation that is frequently lacking and a way of looking at things that is foreign.Intrinsically it is a very modern concept, a “knowledge intensive” solution and webelieve it is emblematic of smallholders’ problems as they try to survive in a globaleconomy, on the wrong side of the ‘digital divide’.
IPM principally depends on measurement of pest levels and then calculations to esti-mate crop damage and then a decision by the farmer on whether to control or not,and if so which method to use. In its original form, it is predicated upon the farmerhaving at least secondary education and a fairly sophisticated knowledge of pest biol-ogy so that he can apply the correct control at the moment when the pest is at its mostvulnerable or before it is at its most damaging. It is rooted in a certain ethic, where thefarmer invests in knowledge, equipment and extra labour in the expectation of itsaving him more in the long run than he expends.
The problem is that this reasoning is not readily transportable to smallholder farmerswith at most primary education, less than perfect confidence in experts and limitedresources. What is worse, many scientists and extensionists who serve these farmers,have been taught about IPM as though it is an established fact and not something thatis necessarily work-in-progress, questionable, negotiable or subject to revision.

66
Because of inadequate training, we maintain that many researchers and extensionistsneither fully understand the economic and cultural limitations of farmers, nor theshortcomings and costs of the techniques they are implementing. This severely limitstheir capacity to advance a farmer-friendly IPM strategy. We have seen cases whereextensionists have drawn up more than a dozen actions that the farmers should take tocontrol CBB. Not surprisingly in such a case, farmers end up not adopting IPM becausethey find it too difficult and costly and are unsure about its worth.
IPM, almost by definition, consists of a range of techniques. The problem is that someare more effective than others, and some are easier to understand. Each elementneeds to have coherence and be viably cost-effective, or if not, it has to be bundledwith another element so that the two can work synergistically.
6.3 How the local market affectsCBB management
A salient factor we found during the project was that most local coffee markets do notreward for coffee quality. The exception is Colombia where internal coffee marketsare well organised and have a sound mechanism to analyse and reward for high qualitycoffee and to penalise it when it is below standard. Table 26 summarises the factorsthat we believe contribute to the determination of coffee price in the countries stud-ied.
Country Weight Quality India X
Ecuador X Honduras X
Guatemala X Mexico X
Colombia
n Table 26. Main factors intervening in price definition, ü= present.
From Table 26 it is evident that the main criterion for price definition is coffee weight.The only country where coffee is always bought by both weight and quality is Colom-bia. We saw some evidence for quality evaluation in both India and Mexico but thereis no standard national system.
In the Colombian case the negative impact of CBB on quality is linearly reflected in aprice reduction. Hence the market plays a key role in promoting CBB control becausecoffee farmers are fully aware of the economic benefits of controlling it. We believethat when the local market lacks quality standards, coffee farmers are less inclined tocontrol CBB because of the lack of incentive. Table 27 is our estimation of the degreeof internal market development for the countries visited.

67
In the table, a high degree means a well structured coffee market, organised co-operatives, where quality standards are operating and coffee quality is established,there are transparent rules for buying coffee, etc. A low degree means poor marketdevelopment, quality is often not rewarded, the intervention of various intermediariesis significant, and CBB present in the coffee is normally ignored at the point of pur-chase from the farmer and consequently universally low prices pertain.
6.4 Coffee productivity anddiversification
Coffee productivity is another key aspect that is important in CBB control. From thesimulations made in the Chapter 5 we could see that when productivity is higher theCBB impact in terms of absolute economic loss is higher as well. Thus under lowproductivity conditions we suggest that there would be less favourable conditions toencourage CBB control.
We deduced that when the production system is more diversified, and hence incomealso, interest in CBB control is reduced. The possible reason is that when there arelabour constraints, people usually prefer to use it to more directly generate extraincome rather than on controlling CBB (especially if markets are not rewarding forquality).
Table 28 describes coffee productivity and our estimation of diversification for all thecountries involved in the project.
n Table 28. Estimated productivity and diversification of the production systems.
n Table 27. Internal market structure and development.

68
6.5 Rural wages
Since CBB control largely depends on cultural control and cultural control depends onlabour, this factor should play an important role when analysing how farmers can affordto intensify this control measure or not. Table 29 describes the rural wages paid whencontrolling CBB.
n Table 29. Average rural wage in countries visited (2001 prices).
From the table, it is clear that rural wages are highest in Colombia and lowest in India.This we believe might be an important factor in farmers’ approach to CBB control.
6.6 Generating hypotheses on factors favouring CBB control
From the concepts mentioned above and the possible interactions between them, wecan start to pose some hypotheses to guide us in development of CBB managementin relation to broader issues of the coffee industry in producer countries. What followsis based on our visits and examination of the available data, it is an exercise in hypoth-esis generation rather than a statement of fact. On the following graphs, lines depictour hypotheses and country names our estimation of the true position in these coun-tries.
Hypothesis 1: there is a direct relationship between the state of the internal coffeemarket and the level of CBB management. We believe that if quality were rewardedat the farm-gate, coffee farmers would have more interest in controlling CBB. Wesuggest, from our in-country studies that the current situation can be approximated byFigure 15.
Hypothesis 2: there is an inverse relationship between the degree of diversification ofthe farm and intensity of CBB management. Ellis (2000) indicates that there are sev-eral determinants for livelihood diversification such as seasonality in income, copingand risk attitudes, labour markets, etc., which are all ways of facing difficulties in-volved in agricultural production. Figure 16 shows our assessment of the status ofwithin-farm diversification for the countries studied.

69
Thus when a coffee farmer has several ways to generate income, CBB management isonly one of several priorities and he may not be able to devote the resources that thisrequires. A typical example of this is Ecuador where production systems include sev-eral crops such a short cycle crops (beans, maize, rice, etc.) and long cycle crops aswell (banana, cocoa, etc.). This contrasts with Colombia where many farmers relyentirely on coffee and purchase most or all of their food, even coffee.
In this case there are two outliers from our hypothetical linear trend. In India there ismore CBB management than the state of diversification would suggest. We put thisdown to the availability of relatively cheap labour and the efforts of the Indian CoffeeBoard, which the Indian Government has continued to fund more adequately than
n Figure 16. Hypothetical relationship (line) between diversification ofproduction systems and CBB management and an estimate of the currentsituation (names).
n Figure 15. Hypothetical relationship (line) between state of the internalmarket and CBB management and an estimate of the current situation(names).

70
many other coffee countries. The second case is Mexico where CBB management isless than we would expect from the level of dependence on coffee (at least in theSoconusco area that we visited). Here the Mexican Government has taken the oppo-site course to India and dismantled state funded extension services and reduced re-search.
Hypothesis 3: coffee productivity and level of CBB management are positively corre-lated. As we explained, the most severe economic effects due to CBB attacks can beseen where coffee productivity is high where the potential losses are also higher.
In this case (Figure 17) the most contrasting countries are again Colombia and Ecuador.
n Figure 17. Hypothetical relationship (line) between productivity and CBBmanagement and an estimate of the current situation (names).
Hypothesis 4: the intensity of CBB management is inversely related to the cost oflabour, since IPM methods require more manual labour because of dependence oncultural control.
Here, in Figure 18, we see considerable variance between theory and practice. Weconclude that wages are a less important determinant than productivity and internalmarket development.
6.7 Conclusions
From this exercise we conclude that the state of internal markets and productivity arethe most important determining factors in CBB IPM uptake, followed by the diversifi-cation of the production systems. We do stress that the above exercise is to generateideas for future testing, since these relationships are not proven and there may well beother factors at work. We invite researchers in this field to test the hypotheses and totry to disprove them.

71
n Figure 18. Hypothetical relationship (line) between rural wages and CBB management and an estimate of the current situation (names).

72
Quality of the product, quality of the environment, andquality of life for the farmer are inseparably
bundled together.
[G. Baldwin, SCAA Chronicles, July/August 2000]

73
Coffee seems to be splitting into two sectors. One is the bulk sector (i.e. a truecommodity) supplying standard blends that increasingly contain large amounts of Bra-zilian arabicas and Vietnamese robustas. In neither of these countries is CBB a majorconstraint because of climatic factors and indeed a general lack of serious pest prob-lems in these countries has probably contributed to their competitiveness. The othersector is the quality market, including specialty, Fair Trade and organic markets, wherecup quality and/or social and/or environmental quality are of paramount importance.
Our main concern is with the future of smallholder coffee farmers and from what wehave learned through our studies, we believe that the best way for their enterprises tosurvive is through production of high quality coffee, but only if they receive a fairpremium for so doing. This would give them the extra funds to invest in sustainabletechnologies such as IPM and sufficient to make an adequate living from coffee. But todo this implies a level of knowledge, both technical and entrepreneurial, that pres-ently they largely lack. Their problems with CBB are indicative of these deficiencies.
This book is very much an account of work in progress, we have tried to broaden theapproach of CBB IPM but are aware that much more needs to be done. In this finalchapter we now resume the role of the various players in this field, the problemsfacing them and some pointers for how we think these could be overcome.
7.1 Institutions
It was perhaps in the area of institutions that we found the greatest differences be-tween countries. These ranged from on the one hand Mexico, where neo-liberalinspired policies mean that the state now contributes little to coffee research andextension, to the other hand India, where government funding remains firm. Smallercountries such as Honduras and Ecuador have apparently never had very well devel-oped institutions whereas Colombia is again different; there the coffee farmers haveself-financed a very significant research and extension effort for over 60 years.
We found that the current price slump had caused difficulties to all institutions bothfinancially and in their relations with farmers, many of whom tend to blame nationalbodies for poor coffee sale prices. The crisis has led to emergency measures, forinstance in both Mexico and Colombia, governments have been subsidising the pricepaid to growers.
In general, the institutional situation gave us cause for much concern (Baker et al.2002) and in the absence of significant political intervention, it seems inevitable thatcoffee institutes will become smaller and less significant than previously.
Until now the efforts of countries afflicted by CBB have been mostly piecemeal andapparently not part of any overarching national coffee strategy. Existing mechanismsand policies have adapted the best they can to the problem but from our visits tocoffee countries, we were generally unconvinced that they have thought strategicallyabout the problem. We also feel they have been slow to react to the rapidly changing

74
face of world coffee and to formulate coherent integrated procedures to develop andmaintain a viable coffee sector. All too often coffee institutes seem to react to changerather than to instigate it. This is in no small part due to the decline in the power ofthese institutes as post-pact policies have taken effect.
We suggest that coffee institutes will increasingly be expected to help farmers complywith standards such as:
n IPM for pest control
n HACCP (Hazard Analysis and Critical Control Point) for ochratoxin management
n Compliance with ISO standards
n Organic compliance (Soil Association, Biodynamic)
n Shade coffee certification
n Starbucks Preferred Supplier Program verification
We believe that institutes as they are presently constituted and funded, will not beable to achieve competence in all these fields and that they will have to concentrateon a few of the most important aspects that confer the most benefit on the greatestnumber of farmers. Foremost amongst these aspects will be the production of qualitycoffee which, independent of any scheme, will tend to find a better price.
In order to improve this state of affairs, the first requirement should be a systematicreview of the whole coffee production process to determine critical points that affecteconomic viability for farmers. From our interactions with institutes, we have seenlittle evidence of a commitment to such a rigorous procedure.
Research: in most countries IPM research lacks a clear strategy, neither guided by aclear understanding of farmers’ needs nor underpinned by a rigorous economic analy-sis of the sector’s requirements. Too many researchers follow a special interest to theexclusion of all other factors and though many have a sincere desire to promote sus-tainable coffee growing, all too often they fail to make significant advances. In theirendeavours, poor infrastructure and lack of funds hamper their work.
Whereas many of their economic problems are beyond their immediate control, re-searchers need to develop a more open and participatory approach to understandingthe realities of modern rural life. They need to devote at least a part of their resourcesto short-term and pragmatic research aimed at solving small and solvable problemsthat can demonstrably show an improvement in the plight of the rural poor.
Extension services: to be effective, IPM strategies need a set of robust techniques,knowledge and measurements. Through all this process, extensionists should partici-pate actively in teaching the coffee farmers about how to manage the pest.

75
Transference of IPM strategies implies a specific approach because IPM is more than aset of practices to be directly employed, it is a different and unfamiliar way of reason-ing for many farmers. So extensionists must be aware of this key difference in order topromote and teach IPM effectively (including alternative methods such as participatorytechniques). Perhaps the most difficult concept to transfer is the economic injury level(EIL).
From the socio-economic characteristics of many coffee growers that we have re-corded in this book, it is difficult to find farmers using IPM tools without consideredadvice from the extension services. Unfortunately we found that in almost all thecoffee countries, due to the present economic circumstances, the extension serviceshave been seriously weakened both in terms of economic resources and number ofactive agents. So the service they provide now is quite unsatisfactory because of thelarge number of farmers per extension agent. For instance in the Guatemalan casethere are 61,000 coffee farmers attended by 66 extensionists, 925 farmers per techni-cian; in Ecuador the ratio maybe closer to 2,000 farmers per extensionist. We suggestthat to work with more than about 500 growers per technician is not cost effective.Thus to improve the adoption of IPM strategies in coffee, more and better informedextension agents are required if we want to see an improvement in technology up-take.
In future, if extensionists are to be effective, they will have to be better prepared andbetter paid to attract people who will effectively become facilitators and knowledgebrokers for a wide range of farmers’ needs. The extent to which they will be able to dothis will depend on the future remit of coffee institutes; will they continue to betechnology driven or will they develop a wider social remit?
Donors: although funds have been donated by national and international bodies tohelp solve the problems of coffee communities, their effects have been limited be-cause of their generally short duration and lack of continuity. Many meetings andreports on the coffee crisis have been prepared over the last two years and manyinteresting ideas have been aired. Little concrete has been achieved however and wefeel that there needs to be concerted action by donors, by working together, to maketheir funds count better towards bringing about sustainable change.
7.2 IPM
Labour issuesn CBB management for smallholder coffee farmers is based on cultural control and
is reasonably effective, but the current low price climate is incompatible withhigh wage costs. Hence as a long-term strategy it may be flawed and if coffee isto prosper, either labour-saving technologies or high quality premiums will berequired.
n Labour may become scarcer in some countries, thus studies are needed toproject labour requirements and relate this to birth, death and migration rates.

76
n A more complete socio-economic characterisation of small coffee farmers isneeded in most countries to adjust IPM programmes to rural realities.
Qualityn Coffee quality is not rewarded by the complex and opaque market structure in
several countries. This discourages farmers to improve CBB management andmakes life more difficult for neighbouring large estates.
n The internal coffee market in Colombia does reward for good quality. In thiscountry CBB is a quality issue, the economic losses caused justify controlmeasures and farmers understand this.
Extensionn Lack of education in the smallholder sector is a major obstacle to improving
production, coffee quality and CBB management.
n The low coffee price has led to considerable lack of motivation of small farmers.In these circumstances, transferring IPM or any other new technique is especiallydifficult.
n CBB management by small producers should predominantly be based on culturalcontrol until better methods become available. To be optimally efficient it needsto be combined with sampling to determine frequency and intensity of this con-trol. This combination would be a first approximation to IPM.
n A good entry point with smallholder farmers may be to concentrate on weightloss of the bean due to CBB. When they fully understand this and its economicconsequences they may become more interested in controlling the pest.
n Pest sampling should be re-examined, perhaps by developing in a participatoryway simpler and more adoptable methods of estimating pest levels and predicting future losses. Farmers need simple ways to estimate costs and losses; scien-tists should learn how farmers gain information about their crop; extensionistsshould help them.
7.3 The quality imperative
The current situation, with an abundance of low quality coffee including ochratoxinproblems20 has caused renewed efforts to improve quality by instigating a qualityscheme (Article 407), passed by the ICO council in February 2002, and initiated in
20 Ochratoxin is a poison formed by some fungi most notably Aspergillus ochraceuswhich attacks poorly processed coffee; at least two of the project countries have hadcoffee shipments refused due to this problem

77
October 2002. The provisions of the scheme demand that an exporting member ofthe ICO shall not export coffee that:
n for arabica coffee, has in excess of 86 defects per 300g sample
n for robusta coffee, has in excess of 150 defects per 300g
n for both coffees, has below 8% and above 12.5% moisture content
Until now the emphasis has been on destruction of poor quality stored green coffee.Here we suggest that another way to combat the problem should be to reward farm-ers for producing good coffee, so that much less poor quality ever enters the coffeechain. We believe this is a more sensible way to invest funds than paying for costlystorage, destruction of coffee after it has been processed and monitoring teams toensure this has been done.
We suggest that the coffee industry needs to examine the in-country links of thecoffee chain from a quality control viewpoint and this needs to be more than anaspiration, it needs to be a logical system based on quality management according tosystems developed in other industries, for example the system and philosophy of JEdwards Deming (Neave 1990).
The fragmentation of the coffee market and the consequent collapse of institutionsover the last few years make this task particularly difficult. But if the coffee industry isserious about improving sales through quality, it needs to invest funds to solve theproblem of wasted coffee quality. Too much potentially good coffee is being spoiltbefore it is exported because farmers lack the skills and incentive to produce the bestfrom their land. The liberalisation of world coffee markets has not improved the indus-try as a whole. If the coffee industry believes in liberalisation, it must surely alsobelieve that this liberty comes with obligations to ensure a strong and plural coffeesupply.

78

79
ANECAFÉ. 1999. Proyecto manejo integrado de la broca del café. Ecuador. AsociaciónNacional de exportadores de Café, Anecafé. 6 p.
BAKER, P.S. 1999. The Coffee Berry Borer in Colombia. Final report of the DFID-Cenicafé-CABI Bioscience IPM for coffee project. ISBN 958-96554-1-6.
BAKER, P.S. 2002. Natural enemies, natural allies. Project Completion Report of theIntegrated Management of Coffee Berry Borer Project, CFC/ICO/02 (1998-2002). Commodities Press, 111p.
BHEEMAIAH, M. M.; SREEDHARAN, K.; DHRUVAKUMAR, H. K. 1996. Coffee BerryBorer: The Dreaded Pest on Coffee. In: Indian Coffee Vol. LX (11): 3-5.
BUSTILLO P, A.; CARDENAS M., R.; VILLALBA G., D.; BENAVIDES M., P.; OROZCOH., J.; POSADA F, F. 1998. Manejo integrado de la broca del café (Hypothenemushampei Ferrari) en Colombia. Chinchiná, Centro Nacional de Investigacionesde Café, CENICAFÉ. 134 p.
CADENA G., G. 1991. Sostenibilidad de la producción cafetera, el control de plagas yenfermedades. In: Ensayos sobre economía cafetera. No 6 Año 4. FEDERACIÓNNACIONAL DE CAFETEROS DE COLOMBIA. Santafé de Bogotá, pp 19-26.
CALVO, L. 1998. El Policultivo de la Sombra en Cafetal: una alternativa viable para laConservación de la Biodiversidad. In: Cafetin , año 6, No. 6. AsociaciónNacional del Café, Anacafé, pp 15 – 18.
CAMPOS A., O.; GARCÍA, A. 1998. Aplicación del Manejo Integrado de la Broca delCafé. In: Cafetin , año 6, No. 5. 12 – 14. Asociación Nacional del Café,Anacafé.
LA CENTRAL. 2001. La crisis del café en Honduras “Los productores de café generanriqueza y administran pobreza”. Departamento de Comunicaciones yRelaciones, Central de Cooperativas Cafetaleras de Honduras. Unpublishedreport, 37 pp.
CENTRAL COFFEE RESEARCH INSTITUTE. 2001. Coffee berry borer in India. CentralCoffee Research Institute. Coffee Research Station. Karnatka, India, 112 p.
CENTRAL COFFEE RESEARCH INSTITUTE. 2000. Package of Practices for OrganicCoffee. Central Coffee Research Institute. Coffee Research Station. Karnatka,India, 43 p.
COFFEE BOARD OF INDIA. 2000. Database on Coffee. Market Intelligence Unit,Coffee Board of India. Bangalore, 48 p.
CONSEJO CAFETALERO NACIONAL. 1999. La Broca del Café ataca nuevamente.Ecuador. Consejo Cafetalero Nacional, Cofenac, 6 pp.
CONSEJO MEXICANO DEL CAFÉ. 2000. Evaluación de Resultados del ProgramaCafé, periodo 1995 – 1998. Programa Café. Secretaria de Agricultura,Ganaderia, y Desarrollo, SAGAR. Mexico.

80
CROXTON, S. 1994. Crop protection for subsistence cultivators: What are the an-swers? In Crop Prtection in the developing world. R.Black & A/ Sweetmore(eds.) pp 59-66. Farnham, England: British Crop Protection Council.
DECAZY, B. 1989. Muestreo y Umbrales para la Broca del Fruto del Cafeto. III TallerRegional de Broca, IICA – PROMECAFÉ. Antigua, Guatemala, Abril 3 – 7, pp59 – 70.
DECAZY, B. 1990. Descripción, biología, ecología y control de la broca del fruto delcafé (Hypothenemus hampei, Ferrari). In: Centro Nacional de Investigacionesde Café, Cenicafé 50 años. Conferecias Conmemorativas, Chinchiná, Cenicafé,133-139.
DUQUE O., H. 2000. Economics of coffee berry borer. In: Coffee Berry Borer: Newapproaches to integrated pest management, Starkville, May 1-5, 2000, Missis-sippi State University, 14 p. (Unpublished).
DUQUE O., H. 2001. Análisis económico de doce prácticas para mejorar el desempeñode las fincas cafeteras. Chinchiná, Colombia. Centro Nacional de Investigacionesde Café, CENICAFÉ, 57 p.
DUQUE O., H. 2002. Coffee Berry Borer (H. hampei) and Socio-economic aspects inCoffee in India. Consultancy report. CFC, CABI, CENICAFÉ. CFC/ICO 02project. Chinchiná, Colombia, 22p. (Unpublished)
DUQUE O., H.; CHAVES C., B. 2000. Estudio sobre adopción del manejo integradode la broca del café. Chinchiná, Colombia. Centro Nacional de Investigacionesde Café, CENICAFÉ, 89 p.
DUQUE O., H.; MARQUEZ Q., A.; HERNANDEZ S., M. 2002. Estudios de Caso sobreCostos de Manejo Integrado de Broca del Café en el departamento delRisaralda. Cenicafé 53(2): 106-118.
ELLIS, F. 2000. Rural Livelihoods and Diversity in Developing Countries. Oxford. Ox-ford University Press, 273 p.
FEDERACIÓN NACIONAL DE CAFETEROS DE COLOMBIA. 1994. Manejo Integradode la Broca. Boletín de Extensión No. 74. FEDERACIÓN NACIONAL DECAFETEROS DE COLOMBIA. División de Producción y Desarrollo Social,Gerencia Técnica, Santafé de Bogotá, 24 p.
FEDERACIÓN NACIONAL DE CAFETEROS DE COLOMBIA. 1995. Manejo Integradode la Broca. Boletín de Extensión No. 76. FEDERACIÓN NACIONAL DECAFETEROS DE COLOMBIA. División de Producción y Desarrollo, GerenciaTécnica.Santafé de Bogotá, 25 p.
FEDERACIÓN NACIONAL DE CAFETEROS DE COLOMBIA. 2001. Entorno MundialCafetero. Bogotá, FEDERACAFÉ, (31 slides in Powerpoint format).
FLORES, C. 2000. Variedad: Clave para la calidad del café. In: El Cafetal No. 9: 6-8.Guatemala.

81
GARCÍA, A. 1998. Diagnóstico Inicial en Parcela Pequeño Productor. Guatemala.Proyecto Manejo Integrado de la Broca. CFC/OIC/CABI/Promecafé/Anacafé,4 p (Unpublished).
GOODELL, G. 1984. Challenges to international pest management research and ex-tension in the Third World: Do we really want IPM to work? Bull. Ent. Soc.Amer. 30, 18-26.
HAARER, A.E. 1956. Modern coffee production. Leonard Hill Books Ltd. London.
HILL, B. 1990. An introduction to economics for students of agriculture. SecondEdition.Exeter, Pergamon Press, 388 p.
INTERNATIONAL COFFEE ORGANISATION. 1997. Monograph on Indian Coffee.London, International Coffee Organisation, ICO, 28 p.
INTERNATIONAL PEST MANAGEMENT INSITUTE. 2002. IPM defined and the IPMprocess. International Pest Management Institute. Currie Enterprises.
http://www.biconet.com/reference/IPMdefined.html.
JIMENEZ G., L. 1999. Small-scale coffee growers knowledge and activities related tocontrol of the coffee berry borer in Chiapas, Mexico. MSc. Thesis. El Colegiode la Frontera Sur, Tapachula, Mexico, 31 p.
KNIGHT, P. 2002. Brazil and the coffee crisis. F. O. Licht’s International Coffee Report,17 (5) 75-80.
LEKHI, R. K.; SINGH J. 1999. Agricultural economics. Kalyani Publishers, New Delhi,735 p.
Le PELLEY, R. H. 1968. Pests of coffee. London, Longmans, 618 p.
MASTRETTA, S. 2000. Los candidatos en el pais de Coloma. Nexos (Mexico), pp64 – 77.
MENON, P.; KRISHNAKUMAR, R.; SUBRAMANIAN, T. S. A 2001. Round-up fromStates. In: Frontline Vol. 18, No.2, 4 -6.
METCALF, D. 1974. La economía de la agricultura. Madrid. Alianza Editorial S. A.,155 p.
MOGUEL, P.; TOLEDO, V. M. 1996. El café en Mexico, ecología cultura indigena ysustentabilidad. In: Ciencias No 43. Mexico, Julio – Septiembre 1996.pp 40– 51.
MORSE, S.; BUHLER, W. 1997. Integrated Pest Management: Ideals and realities indeveloping countries. Boulder, Colorado. Lynne Rienner Publishers, 171 p.
MONTOYA R. E. C. 1999. Caracterización de la Infestación del café por la Broca yEfecto del Daño en la Calidad de la Bebida. Cenicafé 50 (4), 245-258.

82
MUÑOZ, R.; PAZ, H.; TREJO, A. 2000. Resultados de la Encuesta sobre Caficulturaefectuada en tres Zonas Cafetaleras de Honduras. Proyecto IICA/Promecafé-IHCAFÉ. Unpublished. Honduras, 22 p.
NORTON, G.A.; MUMFORD, J.D. 1993. Decision tools for Pest Management CABInternational, 279 p.
OCHOA, H.; CAMPOS, O.; VIDAL, B; DECAZY, B. 1989. Determinación de Pérdidasen la Cosecha por Broca del Fruto del Cafeto (Hypothenemus hampei Ferr) enFuncion de Diferentes Porcentajes de Infestación. III Taller Regional de Broca,IICA – PROMECAFÉ. Antigua, Guatemala, Abril 3 – 7, pp 81 – 86.
PALMA, M.; OSEGUERA, F.; RODRIGUEZ, H.; CHINCHILLA, J. L. 1998. DiagnosticoTecnico del Beneficiado Humedo y Sistemas de Comercializacion del Café enHonduras. Instituto Hondureno del Café, IHCAFÉ. Honduras, 14 p.
PRUDOT, E. 1986. Historia e introducción al manejo integrado de plagas. In: Cursoregional sobre el manejo integrado de plagas del cafeto, con énfasis en brocadel fruto, Hypothenemus hampei, Ferrari. San Pedro Sula, Julio 21-26, 1986.Memorias. Tegucigalpa, Instituto Hondureño del Café, pp. 471-487.
PUERTA Q., G. I. 2000. Componentes de la Calidad del Café. Chinchiná. CentroNacional de Investigaciones de Café; CENICAFÉ, 16 p.
RAMIREZ, L. F.; SILVA, G.; VALENZUELA, L. C.; VILLEGAS, A.; VILLEGAS, L. C. 2002.El Café, Capital Social y Estratégico. Informe Final de la Comisión de Ajuste dela Institucionalidad Cafetera. Bogotá., 173 p.
SALDARRIAGA C, G. 1994. Evaluación de Prácticas Culturales en el Control de Brocadel Café Hypothenemus hampei (Ferrari 1867) (COLEOPTERA: SCOLYTIDAE).Tesis de Grado. Facultad de Ciencias Agropecuarias. UNIVERSIDAD NACIONALDE COLOMBIA, Medellín, 59 p.
SALDÍAS B., C. 1996. Experiencias en el uso del hongo entomopatógeno Beauveriabassiana (Bals) para el manejo integrado de la broca del cafeto. In: MEMORIASCONGRESO XXIII, SOCIEDAD COLOMBIANA DE ENTOMOLOGÍA, Socolen.Cartagena de Indias, 263-275.
SREEDHARAN, K. 1995. Integrated Management of Coffee Berry Borer. In: IndianCoffee Vol LVIX (10): 9–10.
SETTI, H.; GOWDA, G. 2001. Final technical report of ICO-CFC project on integratedmanagement of coffee berry borer. Coffee Board of India. Mysore Office.(Unpublished). Mysore, 32 p.
TASCON, R. 1980. Métodos estadisticos para investigacion socioeconomica. InsitutoColombiano Agropecuario, ICA. Division de Estadistica y Biometria. Bogota,512 p.
TRAVIS J.K. EDWIN, G.R. 1995. Implementing IPM through new technologies and thenon-agricultural community. J. Agric. Entomol. 12, 219-227.

83
UPTON, M. 1996. The Economics of Tropical Farming Systems. Wye Studies in Ag-ricultural and Rural Development. Cambridge University Press, Cambridge, 374 p.
VILLAFUERTE S., D. 1993. El café en la frontera sur: la producción y los productoresdel Soconusco, Chiapas. Serie Nuestros Pueblos. Gobierno del Estado deChiapas, Chiapas. Mexico, 136 p.
ZADOKS, J. C. 1987. The Concepts of Thresholds: warning, action and damage thresh-olds. In: Crop Loss Assessment and Pest Management. P. S. Teng, editor. APSPress. The American Phytopathological Society, pp 268-175.
ZELAYA R., R.; VARGAS, J. C. 1989. Rentabilidad del Control Cultural de la Broca delFruto del Cafeto (Hypothenemus hampei Ferr) en Parcelas de Comprobación .III Taller Regional de Broca, IICA – PROMECAFÉ. Antigua, Guatemala, Abril 3 – 7,1989, pp 97 – 101.

84

85
Indian coffee growers
Farmers and size of holding: in India there are about 140,000 coffee farmers whilethe total area planted in this crop is about 350,000 ha; so the national average is 2.5 haof coffee per farmer. This figure is similar to that found in other countries such asColombia, Honduras or Mexico. Table 30 below describes the distribution pattern ofholdings in different states of India (Coffee Board, 2000).
n Table 30. Distribution of holdings in India, by state.
21 If Gini coefficient equals 1, there is total land concentration (one person owns allthe land); if it equals 0, everyone has an equal area.
From Table 30, 98% of farmers have less than 10 hectares and the 86% have 2 ha orless. It is important to understand size distribution since adoption of technologies canbe affected by the farm size. Duque et al. (2000) found in Colombia that the adoptionof IPM in CBB management was higher in the medium and large farmers rather thanthe smaller (less than 5 ha in coffee). If this is true for other coffee countries, thestrategy for transferring IPM should be designed to promote good adoption levelsdespite socio-economic barriers. If we take the cumulative percentage of farmers andcoffee areas we can quantify this as the Gini coefficient21 (Tascon, 1980). This indica-tor gives a measure of land concentration, which in the case of Indian coffee has avalue of 0.48, which compares to 0.57 for Colombian coffee and 0.43 for Mexico, i.e.land concentration is lower than Colombia but higher than Mexico. Land concentra-tion can be seen from different points of view e.g. land reforms etc., but also for IPMmanagement. Resources to dedicate to technology transfer are always limited and it isimportant for planning purposes to understand both the distribution of land and therelative contribution to total coffee production. Smallholders in India account for 60%of the area under coffee (Table 31), which is very significant. Hence even if largeproducers are more productive, coffee smallholders in India constitute an importantsector, not only for social reasons but from economic and environmental standpointsas well.
Size (ha) Karnataka Kerala Tamil Nadu Others Total I. Small Holdings Number of holdings in each category
0-2 27,109 71,245 11,396 10,502 120,252 2-4 6,580 2,995 1,246 6 10,827 4-10 4,160 1,676 728 - 6,564
Total 37,849 75,916 13,370 10,508 137,643 II. Large Holdings
10-20 1,020 342 156 3 1,521 20-40 445 63 49 4 561 40-60 150 27 36 - 213 60-80 87 19 15 - 121
800-100 46 7 9 2 64 Above 100 107 19 29 15 170
Total 1,855 477 294 24 2,650 Total India 39,704 76,393 13,664 10,532 140,293

86
Labour requirements and rural wages: 67% of total Indian labour works in agricul-ture. Data from the present project (Table 32) shows typical labour requirements incoffee for 3 Indian states regions Kogadu, Wayanad and Tamil Nadu (without labourfor harvesting coffee).
Area under coffee Size (ha) Area (ha) % of total
Share of Production
I. Small Holdings 0-2 129,091 42.2 2-4 29,978 9.8 4-10 40,379 13,2 Total 199,448 65.2 60%
II. Large Holdings 10-20 26,613 8.7 20-40 17,131 5.6 40-60 11,624 3.8 60-80 9,483 3.1
800-100 7,036 2.3 Above 100 34,567 11.3
Total 106,454 34.8 40% Total India 305,902 100.0 100%
n Table 31. Area and share of the production of coffee under different sizes of coffee holdings in India22
n Table 32. Standard labour requirements/ha /year.
22 Coffee Board, India 2001
These are high requirements in comparison to other countries, but even so are lessthan other Indian estimates (Coffee Board, 2000). ICO (1997) calculates that coffeeproduction in India employs about 367,000 persons, which equals about one labourerper hectare. Labour costs show differences between the producing states. Table 33indicates the labour cost in four states of India.

87
Hence a contracted temporary worker could expect an annual income of around US$250if he works all the year. In comparison to many countries labour is therefore very
n Table 33. Labour wages in different states of India, 2000 prices.
State Rs/day US$/day Karnataka 56.25 1.25 Kerala 71.74 1.59 Tamil Nadu 46.50 1.03 Andhra Pradesh 61.70 1.37
23
23 Exchange Rate US$1= Rs 45
cheap in India, and explains why labour is a smaller proportion of the total productioncost structure than other countries. IPM strategies often demand greater amounts oflabour than other methods (e.g. a calendar spray regime for instance) hence the lowcost of the labour in this country could facilitate the adoption of IPM strategy formanaging CBB.
Farmers’ income: income from coffee is very seasonal in India, with just one peak ofincome per year, which can be worrying for the farmer. In order to minimise the effectof seasonal variations, farmers may be expected to try to spread flows of labour andharvest production throughout the year. Upton (1996) points out that there are variousstrategies, such as diversification of agricultural production, to establish different on-and off-farm activities, storing food, seeds and animal fodder, etc. Seasonal incomewill have different effects depending on the period of the year when income is scarcebecause some activities have to be delayed to attend to a more important activity. Thefarmer has to manage different labour requirements and availability to optimise hisgross income. In the case of CBB management, practices that can easily be accommo-dated by the farmer will be more easily accepted by him.
In order to diversify their income, Indian coffee farmers have developed productionsystems to involve more than one crop in order to get income from different sourcesand in different periods of the year. In a project survey carried out on coffee farmers ofKarnataka it was found that 95.6% of them had pepper as an inter-crop. In many casesthe inter-crop allows generation of an important part of the total farm income. Forinstance in an interview carried out during the visit to Wayanad region we met Mr.Vijayakumar who has a small farm of about 1 ha. He told us that his income wasdepending on three sources,- coffee, pepper and areca nut. The individual participa-tion of each of them to his income was coffee, 50%; areca, 29%; pepper, 21%.
Thus other crops are important to the income composition of a normal coffee farm. Itis quite possible that sometimes this alternative income becomes a relevant source tocover costs related to CBB management, whilst at others it could become a source ofcompetition for the farmer’s resources.

88
Ecuadorian coffee growers
Main characteristics: coffee farmers number about 150,000 in Ecuador. According toa survey carried out in this project, 95% of those questioned were men and only 5%women owner-occupiers. The majority (56%) were more than 50 years old, whilst just7% were less than 30 years old. 88% of them had only primary education, 9% second-ary and only 2% tertiary education. These figures suggest that functional illiteracy maywell be high amongst Ecuadorian farmers, which is a disadvantage since it is wellknown that increasing educational levels correlate well with improvement in farmmanagement. This is especially the case for an IPM strategy where measurementshave to be taken and recorded, and a decision made after careful analysis.
On a more positive note, farmers’ experience of coffee must be considerable, since68% of them have been growing coffee for more than 10 years, with just 13% havingless than 5 years experience. And regarding family size, 60% have more than 5 mem-bers, which should mean that availability of family labour is good. Some farmers men-tioned that in recent months (in 2000) there had been a significant migration of rurallabour, especially to Spain. They suspect that if this trend continues, they will face alack of this resource in future. Despite family size, the level of contracted labour ishigh, with 41% of farms employing labour, 33% using both contracted and familylabour with just 25% having sufficient family labour to carry out all coffee-relatedactivities.
During our meetings, cattle, cocoa and banana/plantain frequently appeared as moreimportant to farmers. The extremely low prices that many of them get for their poorlyprocessed coffee probably contributes to this position. It was clear that in most casestheir income is diversified and this kind of scheme plays a very important role in theirlivelihood. More research is needed to understand how they view coffee and howthey rank it in importance as part of their livelihoods; we suspect many of them see itas a cash earner which provides the occasional bonus payment when prices rise.
Rural wages: the daily wage for a farm worker ranged between US $1 and $2 in theperiod 2000-01. The lower amount is paid for carrying out activities such as weedcontrol, applying fertiliser etc., while the latter is common during the harvest season.This labour cost is cheap compared to other countries, especially Colombia. If thisstate of affairs continues, Ecuador would have a competitive advantage in traditionalshade and organic coffees but would need to improve quality considerably to benefitfrom this trade sector.
Honduran coffee growers
Main characteristics: according to La Central (2001) there are 109,000 coffee farm-ers in Honduras. From the project survey, farmers’ average age is 43 years old. 42% are21 to 40 years old, 38% between 40 and 50 and 20% are over 50 years old. But thismeans that 80% are relatively young (50 years old or less) so this could be seen as an

89
advantage to try to implement IPM programmes. However the education level is nothigh; 73% of them have no more than primary education. For this reason Muñoz et al.(2000) consider that the technical information should be presented very simply inorder to get a better uptake.
Hence the extension strategy would have to be very carefully thought out, to achievegood comprehension, adoption and improvement of farm management. This espe-cially because an IPM strategy implies measurements of infestation levels which haveto be taken and recorded, and decisions made after careful analysis of this informa-tion. All this effort could act as a key barrier to both IPM understanding and adoption.Farmers’ experience in coffee must nevertheless be considerable, 64% of them havebeen growing coffee between 5 and 15 years and 16% more than 15 years. 55% havebetween 1 to 5 family members, 25% of them have between 6 to 10 members and20% more than 11. But despite these large families, Honduran coffee farmers con-sider that there is a labour shortage, mainly during harvesting time. During this periodmost of the labour must be transported from the villages where they live to the coffeefields early in the morning and then back in the evening, a significant extra cost.
Coffee farmers’ income is seasonal since coffee is harvested over a short period of theyear as in all Central American countries. Hence they plant crops that can give bothincome and food in other seasons. Examples of these are banana, plantain, maize,beans and sugarcane.
Rural wages: the daily wage for a farm worker during the project was about US$3 ( 45Lempiras 24), for workers carrying out activities such as weeding control, shade regula-tion, etc. However for harvesting they are usually paid piece-work by volume of cof-fee collected. For year 2000 coffee farmers were expecting to pay about US$1 pergalón (equivalent to a US gallon) and on average a coffee picker could expect to gatherbetween 5 and 8 galones/day. Hence the rural wage at harvest time would be be-tween US$5 to 8. Although the normal rural wage in farming activities is low in com-parison with other countries of the region the cost of collecting berries is almost equalto that of Colombia which is very high. Hence Honduran coffee farmers might wellhave problems in future because of the cost of labour involved in coffee picking couldreach something approaching 40 to 50% of the total production costs. It is surprising tofind this apparent paradox of both high poverty and high labour costs and we believethis requires further study.
Guatemalan coffee growers
Basic data about coffee farmers: according to official Anecafé figures, there areabout 61,600 coffee farmers in Guatemala. With a total coffee area of about 262,500ha, the national average is about 4.2 ha/farmer. This value is somewhat higher than
24 Lempira is the national currency. The exchange rate is US$1 = 15 Lempiras

90
Colombia or Honduras for instance and may be due to the greater land concentrationwith a very few farmers having very large estates; we were told that the largest coffeefarm in Latin America is situated in Guatemala.
A smallholder description: for the present project, a survey was carried out to typifysmallholder coffee farmers (García, 1998). This diagnostic was done in 1998 for 62farms in the departments of Suchitepequez, Retalhuleu and part of Quetzaltenengo,and included 31 farms from “La Chocola” community. Mean farm size was 1.1 h,average farmer age was 46 and 84% of them had only incomplete primary schooleducation. These figures suggest that functional illiteracy may well be high amongstGuatemalan coffee farmers. If confirmed this is an important disadvantage since it iswell known that increasing educational levels correlate well with improvements infarm management.
The average size of coffee farmers’ families was five. Again if confirmed nationally,this could mean that the traditional notion of abundant labour availability does notapply any more; during the visit several extensionists commented on labour scarcity incoffee regions. The survey showed that 55% of the farmers relied solely on familylabour while in the remaining 45%, the farmers contract farm labour. Since IPM strat-egies involve many activities and interventions in order to manage the pests, thisimplies extra labour needed to carry out the control measures proposed. If rural labourbecomes scarce, this would increase difficulties in controlling CBB.
Despite Anacafé’s efforts, just 22% of these smallholders were trained in coffee man-agement and this is a key barrier to promote IPM strategies. Moreover, only 38% ofthem had had access to credit, with another 38% responding that they had not re-quested it and the other 24% stating that they could not obtain credit. This situationcould be due to both lack of collateral and possibly also high interest rates. A commonoccurrence is to sell coffee cherries through intermediaries. Almost 94% of them usethis channel to sell their coffee despite the Chocola community having infrastructureto carry out the post-harvesting processing. This decision has implications for the grossincome of the farmers, which will be lower than if they process the coffee them-selves. Coffee farmers diversify their income by growing and selling bananas: almost50% of them had this extra income.
Rural Wages: the legal cost of a day’s labour is 31.50 Quetzals25, equivalent toUS$4.0. However some farmers do not pay this salary and many rural workers give upthe bonus, incentives and the payment corresponding to Sunday, in order to get a jobeasily. The day’s wage is structured as follows:
a. Wage = 21.62 Quetzalsb. bonus + incentives = 5.38 Quetzalsc. 7th day = 4.50 Quetzals
Total = 31.50 Quetzals
25 Quetzal is the Guatemalan currency, US$1 = 7.7 Quetzals

91
But the most common real wage ranges between 21 to 23 Quetzals, equivalent toUS$2.7 to 3.0.
Mexican coffee growers
Farmers and areas: there are estimated to be 282,000 coffee farmers in Mexico andthe total area planted in this crop is around 750,000 ha; so the national average wouldbe 2.6 ha of coffee per farmer. This figure is similar to that found in other countriessuch as Colombia or Honduras. Table 34 describes the coffee areas in Mexico as wellas the number of coffee producers (Consejo Mexicano del Café, 2000).
n Table 34. Coffee areas and farmers in Mexico.
n Table 35. Age groups of Mexican coffee farmers in the Soconusco region.
If we take the cumulative percentage of farmers and coffee areas we can calculate theGini coefficient (Tascon, 1980). This coefficient quantifies the degree of land concen-tration, which in this case has a value of 0.43, which is lower than many other coffeecountries. This value must be due at least in part to land reforms programmes carriedout in this country.
Socio-economic description of Soconusco’s coffee farmers: as a part of the presentproject, Jimenez (1999) carried out a study called “Small-scale coffee growers’ knowl-edge and activities related to control of the coffee berry borer in Chiapas, Mexico”,which involved a basic socio-economic description of the coffee farmers. Jiménezfound that the average age of the Soconusco’s coffee farmers was about 52 years old(range 18 to 85 years old). Table 35 presents percentages of farmers according to agecategories.

92
n Figure 19. Family contribution to labour needs for Mexican coffee.
As can be observed, 60% of farmers are over 49 years old. This average age could bea barrier to IPM adoption as found by Duque et al. (2000), for coffee farmers inColombia. On the other hand, in an appraisal of the national coffee programme car-ried out by the Mexican Coffee Council (2000) it was reported that the average familycomposition was about 10 members distributed among children, young people, adultsand elderly people. Additionally, Jimenez (1999) found that the level of formal educa-tion was very low, 75.3% of the coffee farmers either had no education or had notfinished primary school. Again, for high adoption of IPM, a good level of education isdesirable because included in the strategy are concepts such as sampling, mathemati-cal calculations etc.
Land tenure: the salient factor in the Mexican case is that 95% of farmers own theirfarms and 61.5% have been farming them for more than 10 years. Land reforms inMexico have guaranteed that most of the farmers have clear property rights on landthey cultivate, though using this as loan collateral is often not easy because of strictlaws about disposing of this land.
Labour needs & rural wages: agriculture and related sectors (forestry, fishing, etc.)currently employs about 22% of the national labour. Related to wages, it was possibleto observe at least two basic kind of payments: for Ejidos26 coffee farmers were paying$20 Mexican pesos27 per day’s labour (US$2.08/day), plus two meals. On larger farmsthe salary was about $30 per day (US$3.12).
According to the Mexican Coffee Council (2000), family members carry out coffeeactivities, covering approximately 90% of the annual farm needs. Figure 19 shows the
26 Ejido is a type of land tenure that appeared after land reform programmes were imple-mented. A large farm was divided into small plots that were allocated among small coffeefarmers; they own their lands according to Government laws.
27 Exchange rate: US$1 = $9.6 Mexican pesos (2000)

93
contribution by family member type to the total farm needs; these needs are about220 labour days per farm per year, including coffee harvest.
On average a typical coffee farm needs to contract just 10% of the total labour needsin order to carry out all of the activities needed for crop management. If a typicalfamily in the coffee sector were composed of about 10 members, according to theparticipation of different age groups, this family would have about 3.4 adults, 4.3children, 2 young persons and 0.3 elderly people. If we assume that there are 20 daysof work per month per person, family labour can supply the labour needs to carry outthe farm activities for 7 to 8 months per year. However in the harvesting period thereis a labour deficit. This point should be taken into account when analysing CBB28
management and suggesting additional labour inputs.
Farmer’s income: coffee farmers’ income is seasonal in Mexico, which is a riskysituation especially if pickers become scarcer through emigration, as some farmers’fear. In order to minimise the effect of these seasonal variations, farmers can attemptto spread flows of labour and harvest production throughout the year. Upton (1996)points out that there are various strategies, such as diversification of agricultural pro-duction, to establish different on- and off- farm activities, storing food, seeds andanimal fodder, etc. From experience in other countries, this situation also suggests thatthey would be especially risk-averse and perhaps unwilling to try new crops or varie-ties. Seasonal income means that money is scarce for labour at certain times, or thatcertain activities such as crop hygiene might be delayed because of other more urgenttasks. For instance we can take three of the production categories proposed by Moguel& Toledo (1996), subsistence, medium technology and intensive technology. Thesecategories produce 5, 13 and 24 Quintals of green coffee/ha/year. If we assume anexpected price in 2000 of about $650 Mexican pesos per quintal of parchment coffee29,we can estimate the monthly income following the harvest distribution, as appears inFigure 20.
28 CBB = Coffee Berry Borer (Hypothenemus hampei)29 Expected price this year. Roberto Esquinea, Union Ejidos Lazaro Cardenas.
Cacaohatan, September, 200030 Mexican Coffee Council, 2000
n Figure 20. Gross income distribution according to coffee productivity (S. Mexico)30 .

94
Analysing Figure 20, we see that income can vary substantially among these threetypes of production. For instance, in January the gross income per hectare is aboutUS$580 for the highest technology but it is barely above US$100 in the subsistencegroup. It is clear that at least during May, June, July and August there is no incomederived from coffee which could adversely affect any investment in crops or any otherenterprise during that period. Also, pest management may be limited due to lack ofmoney just at a phase of the crop cycle when it is most needed. The subsistencegroup seems to be very vulnerable during this period.
Pests and diseases, - farmers’ perceptions: the Mexican Coffee Council (2000)carried out a survey among coffee producers. One of the topics analysed was pest anddisease management. Table 36 describes the main control strategies used and thepercentage of farmers involved in each of them.
n Table 36. Main control strategy used against pests & diseases.
Table 36 shows that the two main strategies used against pest and diseases are culturalcontrol and no control. This circumstance could have several explanations. Firstly, cof-fee farmers might lack information about pest and disease management. Secondly, thecontrol measures proposed might not work properly so they have not adopted them,or conversely that they see no economic advantage in using them, or that they haveinsufficient resources to carry out the control measures (Norton & Mumford, 1993).More research is needed to understand what is happening here but it may be relatedto the almost total absence of extension support.
Research carried out in Chiapas by Jiménez (1999) found that coffee farmers consid-ered that the most important phytosanitary problems were coffee leaf rust (Hemileiavastatrix) for 87% of farmers and CBB (Hypothenemus hampei) for 92% of them. Thusthe CFC-ICO/02 project focused on a key sanitary problem for Mexican coffee farm-ers.
Colombian coffee growers
Socio-economic description: the following comes from the study carried out by Duqueet al., (2000) on technology adoption of IPM strategy by Colombian coffee farmers,13% of whom were women whilst 87% were men. The majority were owner farmers(66%) most of the rest were managers (29%).

95
The average farmer had 23 years farming experience (modal value 30), 87.5% of themwere more than 35 years old, with an average age of 46 (range 17 to 81). 72.8% ofthem did not complete primary school education - in Colombia is has been estimatedthat coffee farmers average only 3.6 years of formal education. This level of educationis not adequate for adopting a technology such as IPM whose essence is as muchconceptual as practical. Metcalf (1974) for instance, comments that the rate of accept-ance of an innovation depends on the educational status of the farmers.
The average size of a family was 5, with few having more than 6 members. From thiswe conclude that family labour is no longer abundant as many had supposed and thismust impact on their ability to adopt labour intensive control methods.
Income generation: most coffee farmers surveyed (76%) did not have additional off-farm activities to generate extra income generation and/or risk through income diver-sification.
Land tenure: most were owner-occupiers with clear property rights to their land. Inthis case land plays a key role as collateral, facilitating access to rural credit.
Rural wages: Colombian rural wages vary depending on the region and time of year.In S. Colombia where labour is normally abundant, rural wages tend to be lower thanin the central coffee regions where the most intensively farmed coffee in Colombia issituated.
In the case of short-term workers a normal wage in the central zone is about $13,000to $14,000 Colombian pesos per day (US$5.9 to 6.4, 2002). This wage is normallypaid for unspecialised activities such as weeding, shade regulation, pruning, fertilisa-tion, etc., including some coffee collections when carrying out cultural control for CBBmanagement. For other activities such as main harvest periods, wages tend to risebecause payment is by weight of berries collected. Under this scheme good workerscould increase significantly their income, up to US$10 per day.
Other types of labour involving specialised activities such as spraying, post-harvestprocessing and so on is normally done by permanent workers where the wages arehigher because some social security payments are included.
Thus from our surveys, it seems that Colombia pays some of the world’s highestwages for coffee. This explains why coffee growers there are always particularly sensi-tive to agricultural recommendations that involve extra labour as in the case of CBBcontrol.

96

97
This appendix reviews the economic importance of coffee in six countries, as a con-tributor to GDP, exports and as a generator of foreign exchange.
Coffee production has increased in most of the countries studied, most notably in the1970s and 80s with the advent of new varieties and production subsidies. Surprisinglythough, yields are still poor in many parts of all countries. This is because coffee is stillproduced by a large number of smallholders who have mostly not benefited from thetechnology on offer.
In all the six countries, coffee is of declining economic significance, both as a percent-age of GDP and of foreign earnings, a circumstance that is a natural consequence ofthe development of their mostly city-based industries. But if we take into account itscontinuing importance as a generator of employment, coffee’s importance remainsmostly unchanged. From this we conclude that coffee is now of more social signifi-cance than pure economics may suggest. Thus a recent report (Ramírez et al., 2002),analysing the coffee institutions of Colombia, states that the coffee sector has devel-oped into a social issue of very high importance which has a role in national stability.Indeed because of the secular decline of agriculture, coffee may now be more impor-tant than previously, for when it suffers a downturn there are few alternatives formembers of this already depressed rural sector. We believe that such societal exter-nalities must lead to hidden extra costs that are still to be calculated but which arebeyond the scope of this book. We merely note that of the six countries studied, fourhave faced significant rural-based guerrilla activities in recent years, all of which haveincluded coffee-growing zones.
IndiaThe agricultural sector contributes 25% of the country’s GDP although this participa-tion is declining. E.g. in 1947, 85% of the population depended on agriculture, whichcontributed to 70% of the Indian GDP; currently 75% of the population still depend onagriculture. The main agricultural products are rice, wheat, oilseed, cotton, jute, tea,coffee, sugarcane, potatoes, and a range of livestock. Coconut, cashew nuts, andvegetables are also important.
Agricultural exports have fluctuated between 12 and 20% of total exports, though indollar terms they remain relatively constant, suggesting a gradual transition from apredominantly agricultural production base to a broad-spectrum of industry and serv-ices. The major agricultural exports are cereals, spices, cashew, oilcake/meal, tobacco,tea, coffee, and marine products. Coffee exports have remained above US$400 mil-lion over recent years with the exception of 1999-2000 (US$315 million) and 2000-01.
Menon (2001) points out that the fall in international prices of robusta coffee as well aspepper has adversely affected the coffee farmers from Karnataka and Kerala states.Pepper is an important extra income for many coffee farmers but its productivity hasbeen low (275–300 kg/ha). Additionally the price has seen reductions from Rs 22,600/

98
qq31 in 1999 to Rs 12,000/qq in 2000. A similar situation has occurred with areca nutswhere prices fell from Rs 154/kg in September 1999 to Rs 78/kg a year later. The keypoint here is that the Indian agricultural sector is facing a difficult period that is affect-ing many crops, coffee included.
Coffee planted areas have increased markedly in India over the last half century. In1950/51 there were 92,523 hectares; in 1999/00 the total area had grown to 340,306ha. We see in Figure 21 a very significant increase in total area during the 1970s and1980s. Arabica increased by about 100,000 hectares whilst robusta rose by 146,000ha. Areas planted in arabica and robusta are now roughly equal.Coffee production in India: for the year 1950/51 it was estimated at about 18,893
n Figure 21. Area planted in Coffee. India, 1978 – 199232.
31 Rs 48 = US$1 (2001)32 Source: Coffee Board, India, 2001
0
50,000
100,000
150,000
200,000
250,000
300,000
350,000
50-51 70-71 90-91 92-93 94-95 96-97 98-99 Coffee years
Hec
tare
s
Arabica
Robusta
Total Area
metric tonnes while in 2000/01 about 295,000 metric tonnes (Coffee Board, 2000).
Coffee productivity in India: in 1950-51 it was about 255 kg of parchment/ha while in2000-01 the expected productivity was about 1,084 kg of parchment/ha. This suggeststhat crop technology has been responsible for this change in productivity. So evenwithout expansion in area, there may still be considerable scope for an increase intotal production.
Arabica and robusta are classified according to the post-harvesting method: “washed”and “non-washed” (naturals), and are classified into 25 grades based on the size of thebean and on the total number of defects or imperfections (ICO, 1997). Apart fromthis system, specialty coffee is now the fastest growing segment and India hopes to

99
export about 20,000 tonnes (something like 6.7% of total coffee exports) per annumin the next few years. Organic coffee is also of increasing interest especially for coffeegrown on tribal land, which represents about 42% of the coffee area in India. Herecoffee is managed in a less intensive traditional way, which is close to organic produc-tion guidelines (Central Coffee Research Institute, 2000). Some of the grades of specialtycoffee and value added coffee are Mysore nuggets EB, Monsooned Malabar (AA, PB,C), Monsooned Arabica AA, Rob Kapi Royale.
The states of Karnataka, Kerala and Tamil Nadu contribute 92% of Indian coffee grownbut also in small sectors of the states of Andhra Pradesh and Orissa and some of theNorth Eastern states, coffee can also be found. In Andhra Pradesh at least, its is be-coming a significant crop to tribes who formerly practised ‘slash-and-burn’ agriculture.
EcuadorAt US$100 million per year in 1999 coffee was about third in importance in agriculturalexports of Ecuador, after fruit (mainly bananas) and shellfish and fourth in importanceof all exports. Hence coffee provides a significant contribution to export earnings ofthis small and poor country. More importantly, the employment coffee traditionallyprovides makes it a crop of strategic and social importance. Both coffee and cocoasustained pronounced falls for the period 1995-1998, whilst fruit and fish remainedrelatively stable. Part of the decline may be attributed to the El Niño phenomenon in1998, but it is clear that in the case of coffee the fall predates this event. From 1994to 1999, coffee export earnings fell by a stunning 81%, though these figures may bedistorted somewhat by illegal movements of coffee to and from Colombia, dependingon the differential in internal prices between those two countries.
The 1983 national coffee census estimated that Ecuador had 460,000 ha of coffee butnow it is reckoned to be only 305,000 ha. This reduction is most likely caused byabandonment of farms and changing to other crops as the world price of coffee hasdeteriorated. In order to measure the precise area, a coffee census is currently beingcarried out by INEC (Instituto Nacional de Estadística y Censos). Of this area roughly45% (137,000 ha) is planted to robusta coffee and 55% (168,000 ha) is arabica coffee.Coffee distribution, by geographical zones, appears in the following Table 37.The north-eastern zone of the country, corresponding to the Amazonian basin, is mainly
n Table 37. Geographic zones and areas in coffee.

100
0
0.5
1.0
1.5
2.0
2.5
3.0
3.5
4.0
1963/64 1994/95 1999/00 2000/01 2001/02 Coffee
Mill
ions
ofco
ffee
bags
(46
kg)
n Figure 22. Expansion of coffee production in Honduras over the last 40 years.
robusta since both amount and distribution of rainfall throughout year are favourablefor this kind of coffee. There are estimated to be about 1,000 ha of new clonalvarieties in this region. In the other zones, with more seasonal rainfall, arabica prevails.These are the western Pacific coastal zone (Manabí province), the southern states(mainly Loja and El Oro), the central area (Esmeralda and Santo Domingo). In thesezones, all but 25,000 ha of arabica is traditionally grown (i.e. not intensive production),with no more than 2,500 coffee trees per hectare, shade trees, little or no fertilizationand old trees. According to information collected during the project, Ecuadorian coffeeproductivity ranges between 800 kg/ha of parchment coffee in the case of more inten-sively grown crops and 700 kg in the traditional ones.
HondurasThis is one of the poorest countries in the western hemisphere, with a GNP per capitaincome of US$66033. Agriculture is very important in Honduras with 70% of the popu-lation linked to this sector. The main revenues come from exportation of bananasthough coffee, cattle, sugarcane, lumber, tobacco and seafood, are significant con-tributors to the national income and foreign exchange.
Coffee production in Honduras has been expanding (Figure 22). At the beginning ofthe 1960s, total production was about 500,000 sacks (46 kg of green coffee), by 1994/1995 it was 2 million and during the year 1999/2000 the exports rose to about 3.7
33 World Bank, 1996 figures.
million sacks. For the period 1985 - 1989 coffee exports were 25.6% of total exports(Palma et al., 1997). Coffee exports were valued at US$174 million for the coffee year1993/94; these figures demonstrate the key importance of the coffee sector to the

101
national economy of Honduras. Between 1970 - 1987, coffee represented 37% ofagricultural production growth, more than twice any other crop. Bananas were for along time the primary exported product but after Hurricane Mitch, a substantial numberof plantations were damaged, which are now recovering. This caused coffee exportsto assume first place. Thus in 1998, coffee exports were US$433 million whilst forbananas for the same period the value was only US$157 million
According to Oseguera34 (2000), current productivity levels are a result of a projectsupported by USAID (Agency for International Development - US Government) 10years ago. This project focused on increasing coffee productivity based on new varie-ties, such as Catuai and augmentation of the density of trees per hectare from 1,700to 3,500. At that time IHCAFÉ lines of credit were supported by USAID, but currentlyall credit supplied to Honduran coffee is from the private sector. According to informa-tion from the Honduran Coffee Institute (IHCAFÉ), it is estimated that the total areaplanted in coffee crops is about 260,000 ha. The whole area is planted to arabica. Thecoffee areas are located from the centre to the northern and north-western partswhich have a higher rainfall than the area to the south near El Salvador. Table 38 liststhe different coffee regions in Honduras.
n Table 38. Principal coffee regions in Honduras.
34 Oseguera, F. Director of the Agricultural Division, IHCAFÉ. Personal Communica-tion, 2000
35 Member of the technical staff, IHCAFÉ, Honduras, 2000
The average national coffee area per farm it is about 2.5 hectares with an estimatednumber of 105,000 coffee farmers. According to Suazo35 (2000), 85% of the farmershave less than 5 hectares in coffee. But it is estimated that the other 15% are respon-sible for producing 45% of the country’s coffee with the remaining 85% of coffeefarmers producing the other 55%, hence suggesting a considerable concentration ofproduction in relatively few hands.
GuatemalaAs in neighbouring Honduras, agriculture is the most important sector of the Guatema-lan economy and one of its most important resources is its naturally fertile soil. Despiteimportant mineral resources such as petroleum, antimony, lead, nickel, zinc, etc.,Guatemalan agriculture still provides about 25% of GDP. The most important agricul-

102
tural products are coffee, bananas, sugar and cardamom. Other important crops arerubber, cotton and maize, the last of which is the staple food in Guatemala. Beans andwheat are other key crops followed by livestock. Over recent years coffee has oftenbeen first in importance in Guatemalan agricultural exports and makes up about 30%of the total exports, whilst representing only 13% of the agricultural area (Calvo, 1998).
Coffee production in Guatemala has been increasing despite the relatively constantarea under production (Figure 23) and currently the country has about 262,500 ha36
planted to coffee. Production has been increasing over the last 5 to 6 years. Between
n Figure 24. Coffee productivity in Guatemala, from 1985/86 - 1997/98.
36 Dr. Francisco Anzueto. Research Manager, Anacafé. Guatemala, 200037 Source: Anacafé, Guatemala
0
50,000
100,000
150,000
200,000
250,000
300,000
85/86 87/88 89/90 91/92 93/94
95/96 97/98 Coffee Year
Hec
tare
s P
lan
ted
Coffee year
0.0
5.0
10.0
15.0
20.0
25.0
85/86 87/88 89/90 91/92 93/94 95/96 97/98
Qui
ntal
s/ha
n Figure 23. Area planted in Coffee. Guatemala, 1985/86 – 1997/9837 .

103
1985 and 1992 the national coffee production remained fairly constant at 4 millionquintals of green coffee but from that time there has been an increase to above 5million quintals. The 1996/97 harvest was the highest ever, at about 6 million quintals.However the 1998/99 harvest dropped by 15% from 1997/98 harvest, due to severedrought.
The main reason for the increase is that the productivity per area has risen. Figure 24shows that for 1985/86 productivity was 17.3 qq/ha and it rose to 22.3 qq/ha by 1996/97, which is roughly double that of Mexico.
With respect to the main difficulties that coffee is facing in this country, the technicalstaff38 of Anacafé mentioned: low international coffee prices, lack of profitability, lackof credit, high financial costs, high input costs, high cost and lack of rural labour. Pestand disease problems include CBB and Mycena citricolor, a leaf fungal disease stimu-lated by humid tropical storms from the Caribbean.
Anacafé39 provides services in seven main regions where coffee is grown. Table 39shows these regions and the main cities in each of them.
The first 4 regions are in the Central-Pacific basin while V and VI are near the tropicalregions of Chiapas (in Mexico) and El Petén in Guatemala. Region VII is near theborder with Honduras.
Region
Department Main City
I Quetzaltenango Coatepeque II Suchitepequez Mazatenango III Guatemala Guatemala IV Santa Rosa Cuilaya V Huehuetenango Huehuetenango VI Alta Verapaz Cobán VII Zacapa Gualán
n Table 39. Coffee regions in Guatemala (Anacafé classification).
38 Francisco Anzueto, Armando Garcia & Arturo Villeda39 National Coffee Association of Guatemala
MexicoMexico is an industrialising nation and this is seen by the perhaps surprising fact thatonly 3.7% of exports are agricultural products and 25% of maize and 48% of wheat isimported (Mastretta, 2000). The leading agricultural exported products are coffee,cotton, sugar, fresh vegetables and fruits.

104
Currently coffee represents 1.5 % of all Mexican exports. Although this figure is lowerthan the Guatemalan and Honduran cases it is still important. For year 2000, Mexicowas the world’s fifth largest exporter of coffee. The value of coffee exports has beenvery variable, with an average of about US$530 millions.
Mexico has a population of 100 million people, 71% living in cities and towns and 29%in rural areas. Hence almost 30 million people are still linked to a largely subsistenceeconomy. The agricultural contribution to GDP has been decreasing from 16% in 1960to 5.6% in 1998. This loss in importance has generated problems, for instance in a highrate of malnutrition. In the opinion of people interviewed during our field visit, foodsecurity is threatened because Mexican staples such as maize and wheat have to beimported. Mexico, like India is an example of a country where although coffee is nota major part of the economy, it is a significant factor in the economy of some poor ruralareas.
The area planted to coffee in Mexico increased by about 80% from 1978 to 1992when it rose from 400,000 hectares to over 700,000. Despite this expansion, totalcoffee production has not risen in proportion with this increase (Figure 25).
Despite a large rise in year 1999/00, coffee production on average has been around4.9 million sacks, similar to the amount for 1989-90. This suggests that new areas aremostly traditional rather than intensive and it is possible that old areas are being aban-doned or neglected as new areas are planted.
Whatever the reasons, yield per hectare is always below 12 qq40 of green coffee perhectare. From the National Coffee Survey (1999-2000), of the total coffee area, 93.7%was in production, 1.3% was in new plantations in the pre-production stage and the5% was dedicated to roads, buildings, rural paths, etc. (Consejo Mexicano del Café,2000). Since such a huge percentage was in production and so little under renewal,this implies that the crop cycle is very long, another indicator of traditional coffeegrowing. The Mexican coffee sector employs about 3 million people (Moguel et al.,1996) i.e. about 10% of the total rural population, which indicates that Mexican coffeeis more important to the country than economic data alone might first suggest.
ColombiaCoffee exports have long been a key provider of foreign currency needed for thegrowth of other sectors of the Colombian economy. As recently as 1994, coffee ex-ports of US$1.99 billion represented almost a quarter of the country’s total exportearnings. However, since 1997, Colombia’s export earnings from coffee have fallenby almost 70%, largely due to a sharp decline in prices. By 2000, coffee exports ofUS$1.08 billion represented only 8% of total exports, while in 2001 the figure is
40 1 qq = 1 Quintal = 46 kg

105
3,000,000
4,000,000
5,000,000
6,000,000
7,000,000
88-89
90-91
92-93
94-95
96-97
98-99 Coffee years
Cof
fee
Sack
s
n Figure 25. Coffee production in Mexico, 1988-89 to 1999-0041 .
estimated at 6%. Colombia’s principal export earners in 2000 were petroleum prod-ucts (US$4.72 billion) and coal (US$1.09 billion).
Coffee growers in Colombia total 450,000 families and it is clear that many of themare living almost entirely from coffee. This fact makes coffee very important from thesocial point of view. Additionally coffee is believed to generate almost one extradirect employment per hectare per year which equals about 800,000 jobs per year. Ifwe take into account the various indirect effects, total jobs due to coffee will besignificantly higher than this figure.
Annual coffee production in Colombia has increased from 7.7 million bags in the1960s to a peak of 18.1 million bags in 1991/92. Increases in plantings and productionwere encouraged by the Federation. However, due to a combination of the effect oflow prices (both in the early 1990s and since 2000), rising costs of production and theimpact of CBB, production has since declined. In 2000/01, production was 10.5million bags, over 40% lower than in 1991/92, while the average yield was 877 kg perhectare (Figure 26). Yields have improved from the 1960s and 1970s level of around600 kg per hectare mainly as a result of the increased use of higher yielding varieties,which are more densely planted and yield around 1,200 kg per hectare, compared totraditional varieties which may typically yield around 300 kg per hectare. Replantingand crop renovation have been supported by government subsidies since 1994/95,aimed at improving yields rather than increasing planted area. Over the last ten years,the coffee-planted area has declined from over 1.1 million hectares to 0.8 millionhectares, while the area harvested has been 6-15% lower than this, depending on anumber of factors, including crop renovation programmes.
41 Source: Mexican Coffee Council, 2001

106
In 1997, the total coffee area of 869,158 hectares comprised 551,480 farms averaging1.5 hectares of coffee. Coffee is grown more intensively in the six departments of thecentral coffee belt (“eje cafetero”), which account for over 60% of the total coffeearea.
0
2
4
6
8
10
12
14
16
18
20
Mn
Bag
s
200
300
400
500
600
700
800
900
1,000
1,100
1,200
Kg/
ha
2000
/01
1960
’
1970
’s
1991
/92
1979
/80
Production Yield
s
n Figure 26. Coffee production and yields in Colombia.