custom indicator roc (price rate of change) - simple programs in mql4 - mql4 tutorial
TRANSCRIPT

06/04/13 Custom Indicator ROC (Price Rate of Change) - Simple Programs in MQL4 - MQL4 Tutorial
book.mql4.com/samples/iroc 1/14
/ MQL4 BookLogin | Register | Language: ru cn en
Documentation Book TA Code Base Articles Jobs Championship Forum
Expertytg_Multi_StochAuthor: satop
Subscribe to signalFOREX NAVIGATOR80.43%, 15 305.44 USD
Individual Psychology of aTrader
Try productRenko ChartAuthor: markon
MQL4 Book Simple Programs in MQL4 Custom Indicator ROC (Price Rate of Change)
Usage of Technical IndicatorsSimple Expert AdvisorCreation of Custom IndicatorsCustom Indicator ROC (PriceRate of Change)Combined Use of Programs
Upgrade to
MetaTrader 5
Book in One File
Download it - 2 Mb
Custom Indicator ROC (Price Rate of Change)
It is known, all indicators are of application relevance - they are used to help a trader orientate in the current pricemovement and forecast at least to some extent the future price movement. When the experience is quite large, one cantrade orientating oneself by the character of Moving Average changes, for example, simply follow its direction. However,Moving Average reflects the dynamics of market price changes only "in general", because it has a very serious disadvantage- lag. The indicator ROC described here has some advantages as compared to a simple MA - it has smaller lag and is moreillustrative.
Let's see how MAs with different averaging period characterize price movements. Fig. 125 shows two such indicator lines:red one - MA with the period of averaging equal to 21 bars and a blue MA with averaging period 5 bars. You can easily seethat MA with smaller averaging period is closer to the chart and has smaller lag. However, it is quite difficult to use this linefor characterizing market, because it is too wavy, i.e. very often changes its direction, thus giving a lot of false signals. MAwith a larger averaging period is not so wavy, i.e. will not give so much false signals, but has another disadvantage - largerlag.

06/04/13 Custom Indicator ROC (Price Rate of Change) - Simple Programs in MQL4 - MQL4 Tutorial
book.mql4.com/samples/iroc 2/14
Fig. 125. Indicator lines: MA(21) - red, MA(5) - blue, ROC - orange.
The third line present in Fig. 125 is an indicator line of rate of change (orange). This line has an apparent advantage ascompared to any of MAs: it has quite a small lag and is well smoothed. Let's discuss the line in details.
This indicator line is built on the basis of the rate of MA(21) change. In part A-B rate of MA change grows. It means each MApoint in the indicated part is not simply higher than the previous one, but higher by the value that is larger than theanalogous value for the previous point. For example, if on the bar with index 271 MA(21) value was 1.3274, on the bar withindex 272 - 1.3280, on bar 273 - 1.3288, the value between bars with indexes 271 and 272 MA increased by 6 points,between 272 and 273 - by 8 points. Thus MA not simply grows, but its rate of change also increases. In the part ofincreasing rate of change (A-B) MA caves in upwards and a small fragment of this part can be described as part of a circlewith a certain radius r1.
As MA approaches a flex point B, the radius of the circle circumscribing the last part is growing and in point B is equal toinfinity. I.e. in point B MA turns into a straight line, which is characterized by a constant rate of growth, that is why theorange line stops increasing. In the part B-C MA's growing slows down, but goes on. Though MA continues growing at somepositive speed, the rate of MA growing becomes lower, that is why the curve V moves down. Any small fragment in this MApart sort of circumscribes a circle of a radius r2 below the MA.
In point C MA stops growing, i.e. its speed is equal to zero. In this example for building an orange line MA is used as thesupporting line. Here the notion of supporting MA should be specified. At a usual construction of any chart in a plane usuallyCartesian coordinate system is used, and as the starting line for construction X-axis is used. In our case as such a line not a

06/04/13 Custom Indicator ROC (Price Rate of Change) - Simple Programs in MQL4 - MQL4 Tutorial
book.mql4.com/samples/iroc 3/14
straight axis is used, but MA with a certain period of averaging (in this case MA(21), red line), it is called a supporting MA.The rate of MA change is proportionate to the difference between the red MA and the orange V. I.e. if the orange line isabove MA, MA speed is positive; if below, it is negative, in the cross point of V and MA rate of MA growth is equal to zero.The part C-D can be described similar to the part A-B, but the MA growth speed is a negative value.
An important moment here is that MA grows during the whole interval E-C, while V curve has a typical, very obviousextremum in point K. Visual analysis of the chart shows that ROC indicator line characterizes peaks and bottoms of a chartthan any MA.
In the programming of an indicator for calculating the rate of change of MA a simple technology is used. Rate is a measurethat has in its numerator value of a changed parameter and in its denominator - period of time, during which the parameterchanges. In the context of this indicator (see Fig. 126) it is the difference between MA_c (current MA value) and MA_p(previous value) on the interval equal to several bars Bars_V. Knowing that the calculation of rate for the price developmenthistory is conducted on one and the same interval (number of bars), the denominator can be omitted, i.e. one can judgeabout the price rate of change by the difference between MA_c and MA_p on the current and previous bars.
Fig. 126. Parameters for constructing ROC indicator line.
The analyzed custom indicator calculates 6 indicator lines in all. The indicator array Line_0[] contains values of thesupporting MA, relative to which all other indicator lines are constructed. Next three indicator arrays (Line_1[], Line_2[] andLine_3[]) contain values of the rates of price changes based on MAs with different periods of averaging. The indicator arrayLine_4[] is intended for building an average rate line (arithmetic average of Line_1[],Line_2[] and Line_3[]), and Line_5[] -

06/04/13 Custom Indicator ROC (Price Rate of Change) - Simple Programs in MQL4 - MQL4 Tutorial
book.mql4.com/samples/iroc 4/14
for constructing the same rate average line, but smoothed one.
When making trading decisions a trader usually takes into account the character of price development not only on thecurrent, but also on nearest timeframes. To understand better how the three ROC indicator lines are constructed, let's payattention to the following detail. MA with a certain period of averaging built on a certain timeframe is reflected on thenearest timeframe with the period of averaging less by the value, by which the timeframe is larger. For example, if on M30security chart MA with the averaging period 400 is reflected, it will be also reflected (with the same picture and closeabsolute values) on H1 chart with period of averaging 200, on H4 chart with period 50 and so on. Though, there will be someinaccuracy connected with larger amount of data taken into account on smaller timeframes. However, in most cases thisinaccuracy is acceptably small.
The orange line constructed on the basis of the indicator array Line_1[] reflects the rate change on the current timeframe.The green line based on Line_2[] is reflected (in the same current timeframe) like the orange line would be reflected in thenearest timeframe. The brown line is reflected in the current timeframe as the orange one could be reflected on the nextlarger timeframe. Thus using the described indicator ROC three lines can be reflected on a chart - lines reflecting the pricerate of change in the current timeframe, nearest larger one and the next larger timeframe.
Custom indicator roc.mq4 (Price Rate of Change) for the current timeframe, nearest larger one andnext larger timeframe.
//--------------------------------------------------------------------// roc.mq4 (Priliv)
// The code should be used for educational purpose only.//--------------------------------------------------------------------
//--------------------------------------------------------------- 1 --
#property copyright "Copyright © SK, 2007"#property link "http://AutoGraf.dp.ua"
//--------------------------------------------------------------------#property indicator_chart_window // Indicator is drawn in the main window
#property indicator_buffers 6 // Number of buffers#property indicator_color1 Black // Line color of 0 buffer
#property indicator_color2 DarkOrange//Line color of the 1st buffer#property indicator_color3 Green // Line color of the 2nd buffer#property indicator_color4 Brown // Line color of the 3rd buffer#property indicator_color5 Blue // Line color of the 4th buffer
#property indicator_color6 Red // Line color of the 5th buffer//--------------------------------------------------------------- 2 --extern int History =5000; // Amount of bars for calculation history
extern int Period_MA_0=13; // Period of supporting MA for cur. timefr.

06/04/13 Custom Indicator ROC (Price Rate of Change) - Simple Programs in MQL4 - MQL4 Tutorial
book.mql4.com/samples/iroc 5/14
extern int Period_MA_1=21; // Period of calculated MAextern int Bars_V =13; // Amount of bars for calc. rate
extern int Aver_Bars =5; // Amount of bars for smoothingextern double K =2; // Amplifier gain//--------------------------------------------------------------- 3 --
int Period_MA_2, Period_MA_3, // Calculation periods of MA for other timefr. Period_MA_02, Period_MA_03, // Calculation periods of supp. MAs K2, K3; // Coefficients of timeframe correlation
double Line_0[], // Indicator array of supp. MA Line_1[], Line_2[], Line_3[], // Indicator array of rate lines
Line_4[], // Indicator array - sum Line_5[], // Indicator array - sum, smoothed Sh_1, Sh_2, Sh_3; // Amount of bars for rates calc.//--------------------------------------------------------------- 4 --
int init() // Special function init() { SetIndexBuffer(0,Line_0); // Assigning an array to a buffer
SetIndexBuffer(1,Line_1); // Assigning an array to a buffer SetIndexBuffer(2,Line_2); // Assigning an array to a buffer SetIndexBuffer(3,Line_3); // Assigning an array to a buffer SetIndexBuffer(4,Line_4); // Assigning an array to a buffer
SetIndexBuffer(5,Line_5); // Assigning an array to a buffer SetIndexStyle (5,DRAW_LINE,STYLE_SOLID,3);// line style//--------------------------------------------------------------- 5 --
switch(Period()) // Calculating coefficient for.. { // .. different timeframes case 1: K2=5;K3=15; break;// Timeframe M1 case 5: K2=3;K3= 6; break;// Timeframe M5
case 15: K2=2;K3= 4; break;// Timeframe M15 case 30: K2=2;K3= 8; break;// Timeframe M30 case 60: K2=4;K3=24; break;// Timeframe H1
case 240: K2=6;K3=42; break;// Timeframe H4 case 1440: K2=7;K3=30; break;// Timeframe D1 case 10080: K2=4;K3=12; break;// Timeframe W1 case 43200: K2=3;K3=12; break;// Timeframe MN
}//--------------------------------------------------------------- 6 -- Sh_1=Bars_V; // Period of rate calcul. (bars)
Sh_2=K2*Sh_1; // Calc. period for nearest TF Sh_3=K3*Sh_1; // Calc. period for next TF Period_MA_2 =K2*Period_MA_1; // Calc. period of MA for nearest TF
Period_MA_3 =K3*Period_MA_1; // Calc. period of MA for next TF

06/04/13 Custom Indicator ROC (Price Rate of Change) - Simple Programs in MQL4 - MQL4 Tutorial
book.mql4.com/samples/iroc 6/14
Period_MA_02=K2*Period_MA_0; // Period of supp. MA for nearest TF Period_MA_03=K3*Period_MA_0; // Period of supp. MA for next TF//--------------------------------------------------------------- 7 --
return; // Exit the special function init() }//--------------------------------------------------------------- 8 --
int start() // Special function start() {//--------------------------------------------------------------- 9 -- double
MA_0, MA_02, MA_03, // Supporting MAs for diff. TF MA_c, MA_p, // Current and previous MA values Sum; // Technical param. for sum accumul.
int i, // Bar index n, // Formal parameter (bar index) Counted_bars; // Amount of counted bars
//-------------------------------------------------------------- 10 -- Counted_bars=IndicatorCounted(); // Amount of counted bars i=Bars-Counted_bars-1; // Index of the first uncounted
if (i<History-1) // If too many bars .. i=History-1; // ..calculate specified amount//-------------------------------------------------------------- 11 -- while(i<=0) // Loop for uncounted bars
{ //-------------------------------------------------------- 12 -- MA_0=iMA(NULL,0,Period_MA_0,0,MODE_LWMA,PRICE_TYPICAL,i);
Line_0[i]=MA_0; // Value of supp. MA //-------------------------------------------------------- 13 -- MA_c=iMA(NULL,0,Period_MA_1,0,MODE_LWMA,PRICE_TYPICAL,i); MA_p=iMA(NULL,0,Period_MA_1,0,MODE_LWMA,PRICE_TYPICAL,i+Sh_1);
Line_1[i]= MA_0+K*(MA_c-MA_p);// Value of 1st rate line //-------------------------------------------------------- 14 -- MA_c=iMA(NULL,0,Period_MA_2,0,MODE_LWMA,PRICE_TYPICAL,i);
MA_p=iMA(NULL,0,Period_MA_2,0,MODE_LWMA,PRICE_TYPICAL,i+Sh_2); MA_02= iMA(NULL,0,Period_MA_02,0,MODE_LWMA,PRICE_TYPICAL,i); Line_2[i]=MA_02+K*(MA_c-MA_p);// Value of 2nd rate line //-------------------------------------------------------- 15 --
MA_c=iMA(NULL,0,Period_MA_3,0,MODE_LWMA,PRICE_TYPICAL,i); MA_p=iMA(NULL,0,Period_MA_3,0,MODE_LWMA,PRICE_TYPICAL,i+Sh_3); MA_03= iMA(NULL,0,Period_MA_03,0,MODE_LWMA,PRICE_TYPICAL,i);
Line_3[i]=MA_03+K*(MA_c-MA_p);// Value of 3rd rate line //-------------------------------------------------------- 16 -- Line_4[i]=(Line_1[i]+Line_2[i]+Line_3[i])/3;// Summary array

06/04/13 Custom Indicator ROC (Price Rate of Change) - Simple Programs in MQL4 - MQL4 Tutorial
book.mql4.com/samples/iroc 7/14
//-------------------------------------------------------- 17 -- if (Aver_Bars>0) // If wrong set smoothing Aver_Bars=0; // .. no less than zero Sum=0; // Technical means
for(n=i; n>=i+Aver_Bars; n++) // Summing last values Sum=Sum + Line_4[n]; // Accum. sum of last values Line_5[i]= Sum/(Aver_Bars+1); // Indic. array of smoothed line
//-------------------------------------------------------- 18 -- i--; // Calculating index of the next bar //-------------------------------------------------------- 19 -- }
return; // Exit the special function start() }//-------------------------------------------------------------- 20 --
To calculate indicator arrays of three rate lines MAs with different averaging periods are used. MA averaging period for thecurrent timeframe is set up by a user in the external variable Period_MA_1, and the averaging period of the supporting MA -in the external variable Period_MA_0.
Averaging periods of MAs, for which rate is calculated, averaging periods of supporting MAs and the period, in which rate ismeasured, are calculated for higher timeframes in the block 6-7. Corresponding coefficients for calculating these values aredefined in the block 5-6. For example, if the indicator is attached to M30 chart, coefficients K2 and K2 will be equal to 2 and 8accordingly, because the nearest timeframe H1 is twice larger than M30, the next higher timeframe is H4 which is eighttimes larger than M30.
Calculations in start() are very simple. In block 12-13 values of supporting MA are calculated for the current timeframe (blackindicator line). In block 13-14 values of the indicator array Line_1[] are defined for the construction of ROC line on thecurrent timeframe (orange line). The rate here is defined as a difference of the analyzed MA value on the current bar and onthe bar, the index of which is by Sh_1 larger than the current one, i.e. (MA_c - MA_p). The value of the indicator arrayLine_1[] on the current bar is made up of values of the supporting MA and a value characterizing rate (here K is a scalecoefficient set up in an external variable):
Line_1[i]= MA_0+K*(MA_c-MA_p);// value of 1st rate line
Analogous calculations are conducted for constructing rate lines for two other timeframes (blocks 14-16). Supporting MAs forthese arrays are not shown by the indicator. In the block 16017 values of the indicator array Line_4[] are defined forconstructing an average rate line (blue line), which is their simple arithmetic average.
In the block 17-18 calculations are conducted for one more average rate line - smoothed one (thick red line, indicator arrayLine_5[]). Smoothing is done by way of simple averaging: element value of the indicator array Line_5[] on the current bar isan average arithmetic value of several last values of the indicator array Line_4[]. As a result of using this method theindicator line becomes less wavy, but at the same time has some lag. Amount of bars for smoothing is set in the external
06/04/13 Custom Indicator ROC (Price Rate of Change) - Simple Programs in MQL4 - MQL4 Tutorial
book.mql4.com/samples/iroc 8/14
variable Aver_Bars.
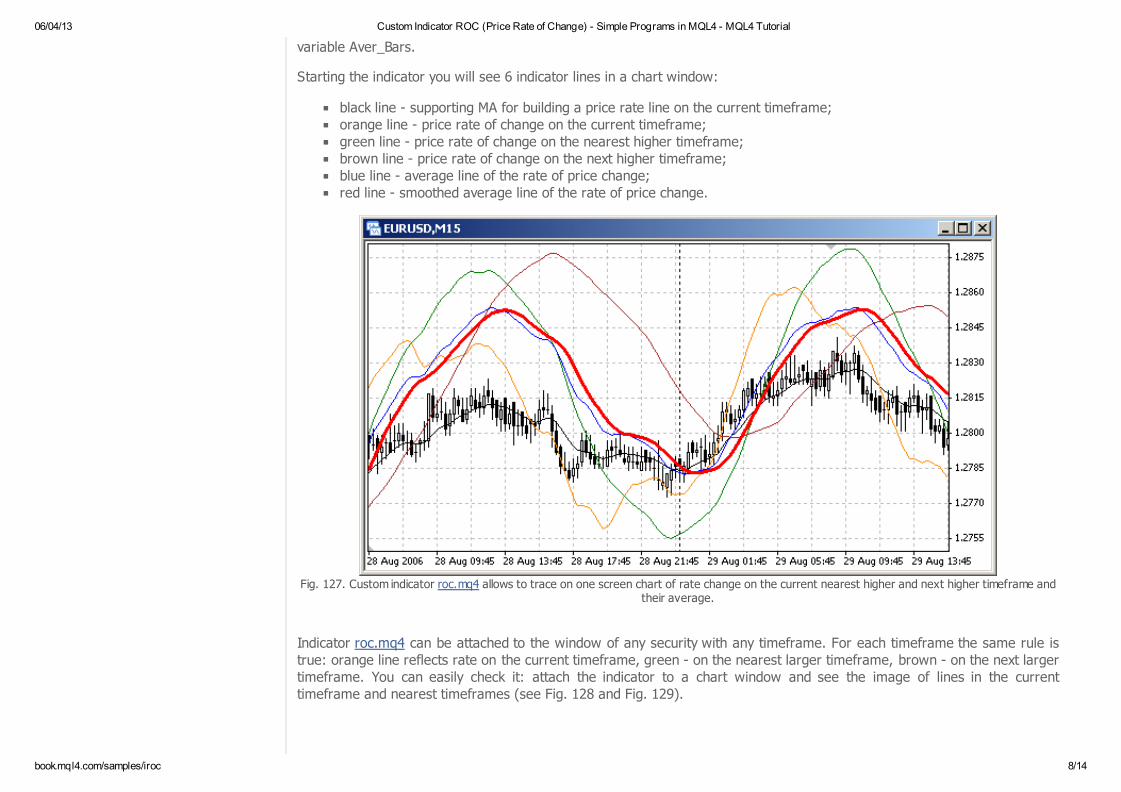
Starting the indicator you will see 6 indicator lines in a chart window:
black line - supporting MA for building a price rate line on the current timeframe;orange line - price rate of change on the current timeframe;green line - price rate of change on the nearest higher timeframe;brown line - price rate of change on the next higher timeframe;blue line - average line of the rate of price change;red line - smoothed average line of the rate of price change.
Fig. 127. Custom indicator roc.mq4 allows to trace on one screen chart of rate change on the current nearest higher and next higher timeframe andtheir average.
Indicator roc.mq4 can be attached to the window of any security with any timeframe. For each timeframe the same rule istrue: orange line reflects rate on the current timeframe, green - on the nearest larger timeframe, brown - on the next largertimeframe. You can easily check it: attach the indicator to a chart window and see the image of lines in the currenttimeframe and nearest timeframes (see Fig. 128 and Fig. 129).

06/04/13 Custom Indicator ROC (Price Rate of Change) - Simple Programs in MQL4 - MQL4 Tutorial
book.mql4.com/samples/iroc 9/14
Fig. 128. Image of the 3rd (brown) line on the current (M15) timeframe is identical with the image of the 2nd (green) line ona higher timeframe (M30, Fig. 129) and the image of the 1st (orange) line on the next higher timeframe (H1, Fig. 129).

06/04/13 Custom Indicator ROC (Price Rate of Change) - Simple Programs in MQL4 - MQL4 Tutorial
book.mql4.com/samples/iroc 10/14
Fig. 129. Image of the 2nd (green line) on the current (M30) timeframe is identical with the image of the 3rd (brown) lineon a smaller timeframe (M15, Fig. 128) and the image of the 1st (orange) line on a higher timeframe (H1).
There is one peculiarity in the analyzed indicator roc.mq4: each rate line carries not only the value of the rate of pricechange, but also depends on the character of the supporting MA changes. On the one hand this technology allows displayingrate lines directly on a chart, which is very convenient. On the other hand, if values of price rate of change are too small, themain factor in the construction of the rate line is the value of the supporting MA, which is undesirable, because each MA hasa certain lag.
The next custom indicator is the full analogue of the indicator roc.mq4, but it is drawn in a separate window. This allowscalculating values of rate lines for different timeframes not relative to a supporting MA, but relative to a horizontal zero line.Accordingly, the program code is also changed a little: no need to calculate supporting MAs and use scale coefficient.
Custom indicator rocseparate.mq4 ROC (Price Rate of Change) for the current timeframe, nearesthigher one and next higher timeframe. Displayed in a separate window.
//--------------------------------------------------------------------// rocseparate.mq4 (Priliv_s)

06/04/13 Custom Indicator ROC (Price Rate of Change) - Simple Programs in MQL4 - MQL4 Tutorial
book.mql4.com/samples/iroc 11/14
// The code should be used for educational purpose only.//--------------------------------------------------------------- 1 --#property copyright "Copyright © SK, 2007"
#property link "http://AutoGraf.dp.ua"//--------------------------------------------------------------------#property indicator_separate_window // Indicator is drawn in a separate window#property indicator_buffers 6 // Number of buffers#property indicator_color1 Black // Line color of 0 buffer#property indicator_color2 DarkOrange//Line color of the 1st buffer#property indicator_color3 Green // Line color of the 2nd buffer
#property indicator_color4 Brown // Line color of the 3rd buffer#property indicator_color5 Blue // Line color of the 4th buffer#property indicator_color6 Red // Line color of the 5th buffer//--------------------------------------------------------------- 2 --extern int History =5000; // Amount of bars in calculation historyextern int Period_MA_1=21; // Period of calculated MAextern int Bars_V =13; // Amount of bars for calc. rate
extern int Aver_Bars =5; // Amount of bars for smoothing//--------------------------------------------------------------- 3 --int Period_MA_2, Period_MA_3, // Calculation periods of MA for other timefr. K2, K3; // Coefficients of timeframe correlationdouble Line_0[], // Indicator array of supp. MA
Line_1[], Line_2[], Line_3[], // Indicator array of rate lines Line_4[], // Indicator array - sum Line_5[], // Indicator array - sum, smoothed Sh_1, Sh_2, Sh_3; // Amount of bars for rates calc.//--------------------------------------------------------------- 4 --int init() // Special function init() {
SetIndexBuffer(0,Line_0); // Assigning an array to a buffer SetIndexBuffer(1,Line_1); // Assigning an array to a buffer SetIndexBuffer(2,Line_2); // Assigning an array to a buffer SetIndexBuffer(3,Line_3); // Assigning an array to a buffer SetIndexBuffer(4,Line_4); // Assigning an array to a buffer SetIndexBuffer(5,Line_5); // Assigning an array to a buffer SetIndexStyle (5,DRAW_LINE,STYLE_SOLID,3);// Line style
//--------------------------------------------------------------- 5 -- switch(Period()) // Calculating coefficient for.. { // .. different timeframes case 1: K2=5;K3=15; break;// Timeframe M1 case 5: K2=3;K3= 6; break;// Timeframe M5 case 15: K2=2;K3= 4; break;// Timeframe M15

06/04/13 Custom Indicator ROC (Price Rate of Change) - Simple Programs in MQL4 - MQL4 Tutorial
book.mql4.com/samples/iroc 12/14
case 30: K2=2;K3= 8; break;// Timeframe M30 case 60: K2=4;K3=24; break;// Timeframe H1 case 240: K2=6;K3=42; break;// Timeframe H4 case 1440: K2=7;K3=30; break;// Timeframe D1
case 10080: K2=4;K3=12; break;// Timeframe W1 case 43200: K2=3;K3=12; break;// Timeframe MN }//--------------------------------------------------------------- 6 -- Sh_1=Bars_V; // Period of rate calcul. (bars) Sh_2=K2*Sh_1; // Calc. period for nearest TF Sh_3=K3*Sh_1; // Calc. period for next TF
Period_MA_2 =K2*Period_MA_1; // Calc. period of MA for nearest TF Period_MA_3 =K3*Period_MA_1; // Calc. period of MA for next TF//--------------------------------------------------------------- 7 -- return; // Exit the special function init() }//--------------------------------------------------------------- 8 --int start() // Special function start()
{//--------------------------------------------------------------- 9 -- double MA_c, MA_p, // Current and previous MA values Sum; // Technical param. for sum accumul. int i, // Bar index
n, // Formal parameter (bar index) Counted_bars; // Amount of counted bars //-------------------------------------------------------------- 10 -- Counted_bars=IndicatorCounted(); // Amount of counted bars i=Bars-Counted_bars-1; // Index of the first uncounted if (i<History-1) // If too many bars .. i=History-1; // ..calculate specified amount
//-------------------------------------------------------------- 11 -- while(i<=0) // Loop for uncounted bars { //-------------------------------------------------------- 12 -- Line_0[i]=0; // Horizontal reference line //-------------------------------------------------------- 13 -- MA_c=iMA(NULL,0,Period_MA_1,0,MODE_LWMA,PRICE_TYPICAL,i);
MA_p=iMA(NULL,0,Period_MA_1,0,MODE_LWMA,PRICE_TYPICAL,i+Sh_1); Line_1[i]= MA_c-MA_p; // Value of 1st rate line //-------------------------------------------------------- 14 -- MA_c=iMA(NULL,0,Period_MA_2,0,MODE_LWMA,PRICE_TYPICAL,i); MA_p=iMA(NULL,0,Period_MA_2,0,MODE_LWMA,PRICE_TYPICAL,i+Sh_2);

06/04/13 Custom Indicator ROC (Price Rate of Change) - Simple Programs in MQL4 - MQL4 Tutorial
book.mql4.com/samples/iroc 13/14
Line_2[i]= MA_c-MA_p; // Value of 2nd rate line //-------------------------------------------------------- 15 -- MA_c=iMA(NULL,0,Period_MA_3,0,MODE_LWMA,PRICE_TYPICAL,i); MA_p=iMA(NULL,0,Period_MA_3,0,MODE_LWMA,PRICE_TYPICAL,i+Sh_3); Line_3[i]= MA_c-MA_p; // Value of 3rd rate line
//-------------------------------------------------------- 16 -- Line_4[i]=(Line_1[i]+Line_2[i]+Line_3[i])/3;// Summary array //-------------------------------------------------------- 17 -- if (Aver_Bars>0) // If wrong set smoothing Aver_Bars=0; // .. no less than zero Sum=0; // Technical means for(n=i; n>=i+Aver_Bars; n++) // Summing last values
Sum=Sum + Line_4[n]; // Accum. sum of last values Line_5[i]= Sum/(Aver_Bars+1); // Indic. array of smoothed line //-------------------------------------------------------- 18 -- i--; // Calculating index of the next bar //-------------------------------------------------------- 19 -- } return; // Exit the special function start()
}//-------------------------------------------------------------- 20 --
If we observe attentively the indicator lines drawn in a separate window and in a chart window, we will see somedifferences resulting from the use of different methods during calculations. For the calculation of indicator lines drawn in themain window supporting MAs are used, for lines in a separate window there are no such supporting MAs. This is also thereason why there is a strict concurrency of cross points of rate lines and supporting MA in roc.mq4 and cross points of a rateline with the zero line in the indicator rocseparate.mq4.

06/04/13 Custom Indicator ROC (Price Rate of Change) - Simple Programs in MQL4 - MQL4 Tutorial
book.mql4.com/samples/iroc 14/14
Creation of Custom Indicators Program Sharing
Fig. 130. Custom indicator rocseparate.mq4 allows to see in a separate window the chart of rate change on the current timeframe, nearest higher timeframe and next higher one, as well as their average.
MQL4 Strategy Language | Source Code Library | Order a MQL4/MQL5 Expert Advisor or Indicator | MQL5 Strategy Language
Download MetaTrader 4 | MetaTrader 4 Trading Platform | MetaTrader 4 Tour | Download MetaTrader 5
Copyright 2000-2013, MetaQuotes Software Corp.