customer driven quality improvement through lean
TRANSCRIPT

35
Customer Driven Quality Improvement Through Lean Manufacturing Approach
DS SPICECO PRIVATE LIMITED
Study Implementation TeamDilip Kumar GayenProject LeaderAjoy Das, Abhishake Jetly, Pravin AnandQC Team Members
ABSTRACTEdward Deming’s 14 points for Management starts the concept of Country-wide action for Quality Improvement, it was on the intention on Products acceptance from Customers and Organization Sustainable Performance not to ruin in competition. This journey of Quality continues to Quality Assurance to Total Quality Management for Sustainability and people participation. For Cost Effective and to become Competitive, Process Reengineering and Lean Techniques are two most important Tools for the Plant.
Keywords: QC: Quality Control. QC: Quality Circle, TPM: Total Productive Maintenance, Quality Assurance, Pareto Analysis, Cause-Effect Analysis, CTC – Critical to Customer, CTQ – Critical to Quality, CTB – Critical to Business
Smart Factory
Today New concept in the Industry introduced i.e. Production in a Smart Factory which is required for Productivity, Quality and Customer Services. Based on Smart Technology, Techniques, People, System with QA, Developed IT Applications, Cost Effective Production System, Working Environment, Smart Controlling & Monitoring System, Better Algorithms, Application of IoT, Integrated System etc.
Customer Driven Quality is one of the step towards the smart factory for competitiveness through Efficiency and Quality. It is based on Process and Quality: Look Deep into Process and even deeper into the Process and sub process & outsourced processes with CTC, CTQ
Introduction
The Catch brand came into existence in 1987 with the launch of Catch Sprinklers, which offered table-top Salt and Pepper dispensers with a rotary top. The success of Catch Sprinklers in the Indian markets encouraged Catch Spices to launch more variants in the following years. By 2001, Catch expanded its product range and entered kitchen spices maintaining the highest quality standards. Today Catch Spices offers, Sprinklers, Pure Spices, Whole Spices, Blended Spices and more. The organization is quality driven whether to talk about product, people or practices.
Customer Driven Quality Improvement Through Lean Manufacturing Approach

36
In DS Spiceco Private Limited each employee is considered as a valuable asset and keeps on looking for opportunities by contributing to the employee motivation, training and development considering future business objectives. The Internal QC teams have been identified and developed for continual improvement in the systems, products and processes.
Previous DL Shah Projects
DS Catch Plant, DS Spiceco Private Limited was awarded the prestigious QCI organized DL Shah Award for the last two consecutive years under the “SILVER” and “GOLD” category respectively for their contribution to improvement of product quality, reduction of wastages and energy conservation.
Yearly Theme for the Journey of Quality for the Plant ImprovementYear 2015 Year 2016 Year 2017Quality Improvement in The Line Carton by using 7QC Tools
Overall Reduction of the Wastages in the Plant through Improvement in Quality and Productivity in the Plant
Improve Quality which is Important to Customer: Customer Driven Quality Improvement in the Plant through Lean Manufacturing Approach
The Internal DS Plant QC Teams are continuing the Practice of Improvement in Quality in new Areas. In the year 2017 our vow for Improvement was based on Customer’s Feedback and connect Shop Floor Improvement related to the Customers’ Satisfaction. It could be called Customer driven Quality.
Diagnosis of the Problems
A system is already in place and in practice to handle customer feedbacks (including complaints). Customer complaints are received at the HO by central coordinator and are forwarded to the concerned depending on the category of the problem or issue. Problems are analysed for finding the root of the problems and corrective actions taken to eliminate or reduce the impact of the problems. Every corrective action taken is further verified for the effectiveness and then only status is closed.
The diagnosis was done for the identified priority areas, as follows:
Customer Feedback – Modes of Communication
DS Spiceco Private Limited

37
Process Of Attaining Customer Complaint
Analysis of Customers Feedback
Table No. : 01
Total No. 1: Complaints received on: 46 Nos.S. No. Types Complaint Identified Problems on
ComplaintsCount % Receiving
Mode1 Quality Complaint Leakage 5 10 E mail2 Packing Complains Weight variation 9 18 E mail3 Dispatch Transportation loss 3 6 E mail4 Sales – On Time
DeliveryCustomer Development (New areas)
18 37 E mail
5 Others Shortage/ Misplaced of Packed Materials
11 22 E mail
Table No.: 02
S. No.
Types Complaint
Identified Problems on Complaints
Problem Related to the Section / Department
Action Plan / Technical Tools Used
Remark
1 Quality Complaint
Leakage Packing Defects Reduction/ 7QC Tools
External + Internal
2 Packing Weight variation
Packing Defects Reduction/ 7QC Tools
External + Internal
3 Dispatch Transportation Loss
Dispatch Reduction in Transportation Loss/ R-C Analysis
QC on Transporters Group
4 Sales – On Time Delivery
On Time Delivery to the Customer
Sales COPS/ OTIF New Initiatives
5 Others Shortage/ Misplaced of Packed Materials
Storage Better Storage / Ageing Problem
Implementation of Ageing Control System
Customer Driven Quality Improvement Through Lean Manufacturing Approach

38
Project Selection
The Team selected the Projects as per the Customers Complains received on the above mentioned areas developed after analysis:
Table No.: 03
S. No. Department Selected Projects1 Packing &
GrindingPacking Section: Reduction of Packing Material Wastage (Line Carton)Grinding Section: Reduction of floor wastage
2 Dispatch On Time Delivery: Improvement in On Time Delivery efficiency.
3 Sales Fill Rate: Implementation of Centralized Order Processing System for increasing of Fill RateFinished Material Ageing: Reduction in ageing in Depots
4 Maintenance Environment: Reduction in Energy ConsumptionReduction in B/D: Autonomous Maintenance
Project Implementation Techniques
Identification of Defects – Flow Chart
DS Spiceco Private Limited

39
Project Implementation
Packing & Grinding
Problem Description
Packing material gets wasted during the process of packing in L/C machines. The problem categories were identified as,
l Overweight and under weight
l Leakage
l Opening (improper adhesive pasting) of carton lids
l Misprint in line cartons
The details of wastages are given the below table:
Table No.: 04 – Year-wise Defects Reduction in Line Carton
Year 2013-14 2014-15 2015-16 2016-17Defects (Av.) 4.7 2.22 1.9 1.7
Table No.: 05
Machine Old Xprt New Xprt 100 gm New Xprt 50 gm AvgWastage Jan 2017% 1.67 1.72 2.1 1.83Wastage March 2017 % 1.6 1.6 1.8 1.67
Chart No.: 01
Problem Category Wise Wastage Details
Table No.: 06
Customer Driven Quality Improvement Through Lean Manufacturing Approach

40
Category Wise Percentage Contribution to Total Defects in Jan ’17 & March ’17
Data Analysis
Fishbone Diagram for Opening Problem in Line Carton
Man Machine
Method
Material
ManagementEndowment
Opening Problem on Line Carton
Attitude Skill Vacuum PressureGuide Alignment
Vacuum CupStorage Condition
Packing MaterialM/C Setting
Operator
RH & Temp.SOP/WI
Fishbone Diagram for Misprint in Line Carton
Attitude Skill
Operator
Printer Setting
Conveyor belt
Proper Feeding of Ink
Communication
Alignment Cleaning
Ink Quality
INk
SOP/WIDust
Misprint in Line Carton
Man Machine Material
MethodManagementEndowment
Fishbone Diagram for Weight Variation
Weight Variation in Line Carton
Man Machine
Method
Material
ManagementEndowment
SOP/WI
Attitude
Attitude
Hopper
M Level
Feeder
Funnel Design
Augur Setting
Bulk Density
Raw Material
Communication
Storage ConditionSkill
Skill
Operator
RH & Temp.
DS Spiceco Private Limited

41
Fishbone Diagram for Leakage Problem
Leakage in Line Carton
Man Machine
Method
Material
ManagementEndowment
AttitudeSkill
Operator
RH & Temp.
Temp. Setting
Alloy Composition
Raw Material
PM Specification
Packing Material
Communication
Material Selling PointAlignment
Pressure Sealer
DustSOP/WI
Actions Taken for Weight Variation Problem in Line CartonTable No.: 07
Problem Probable Causes Corrective Action Taken
Weight Variation in L/C
Environment Temperature & RH
RH meter was installed in all raw material storage and • in-process areas.Monitoring frequency was defined and records • maintained.
Operator Skill & knowledge
Training needs were identified for all concerned • operators Training was provided to the concerned.• Effectiveness was monitored for the given trainings •
Material Feeding A level inside the hopper was identified, and was to be • maintained.Training was provided to feeder regarding importance • of that fact.
M/c setting A work instruction was documented considering all • required setting parameter and other details.Training was provided to all concerned operators on • the above work instructions.
Storage condition A work instruction was documented for storage of • materials.Training was provided to all concerned on the same.• Effectiveness was monitored.•
Actions Taken for Leakage Problem in Line CartonTable No.: 08
Problem Causes Corrective Action Taken
Leakage in L/C
Operator Skill & knowledge
Training needs were identified for all concerned • operatorsTraining was provided to the concerned.• Effectiveness was monitored for the given trainings•
Packing Material Specification
Packing material specification was verified for the • details like GSM etc.
M/c setting A work instruction was documented considering all • required setting parameter and other details.Training was provided to all concerned operators on the • above work instructions.
Material handling and Storage condition
A work instruction was documented for storage of • materials.Training was provided to all concerned on the same.• Effectiveness was monitored.•
Sealer condition Specification of sealer (alloy)• Cleaning of sealer•
Customer Driven Quality Improvement Through Lean Manufacturing Approach

42
Actions Taken for Flap Opening Problem in Line CartonTable No. : 09
Problem Causes Corrective Action Taken
Flap Opening In L/C
Operator Skill & knowledge
Training Needs Were Identified For All Concerned • Operators Training Was Provided To The Concerned.• Effectiveness Was Monitored For The Given Trainings•
M/C Setting A Work Instruction Was Documented Considering All • Required Setting Parameter And Other Details.Training Was Provided To All Concerned Operators On • The Above Work Instructions.
Actions Taken for Misprint Problem in Line CartonTable No. : 10
Problem Causes Corrective Action Taken
Miss print in L/C
Operator Skill & knowledge
Training needs were identified for all concerned operators • Training was provided to the concerned.• Effectiveness was monitored for the given trainings•
M/c setting A work instruction was documented considering all • required setting parameter and other details.Training was provided to all concerned operators on the • above work instructions.
Covey or Belt condition
Cleaning method and frequency• Alignment of conveyor belt•
Grinding Section
Problem Description
The team identified grinding area where in-process wastage of material could be controlled. There was no monitoring of floor wastage earlier. So, the team decided to take one week data based on the daily wastage on the floor during handling of the in-process material. Please refer to the below table:
Table No.: 11
Action Plan
The following steps were taken to control on the wastage of in-process material during handling.
l A format was developed to monitor the daily floor wastage of material
DS Spiceco Private Limited

43
l It was decided to collect the floor wastage on end of every shiftl Work instructions were documented for handling of materiall Trainings was provided on the work instructions
Table No.:12
Dispatch
Problem Description: Delay in Delivery
Delay in consignment to the customer’s results in lack of confidence amongst the customer and loss of sale accordingly. With the intent to increase the confidence of the customer’s objective the delivery performance of the consignments was set for its increase. In the financial year 2015-16 the target was taken as 95% and was achieved. As a continual improvement management decided the objective for the financial year 2016-17 as 97% for delivery efficiency.
Consignment Delivery EfficiencyTable No.: 13
Month
2015-16 2016-17
No of Consignment Dispatched
On Time Delivery
Late Delivery
Delivery Efficiency %
No of Consignment Dispatched
On Time Delivery
Late Delivery
Delivery Efficiency %
April 376 364 12 97% 249 236 13 95%
May 470 461 9 98% 395 375 20 95%
June 438 421 17 96% 434 413 21 95%
July 395 377 18 95% 404 382 22 95%
August 526 496 30 94% 453 427 26 94%
September 427 410 17 96% 479 458 21 96%
October 508 472 36 93% 429 423 6 99%
November 443 420 23 95% 479 455 24 95%
December 527 496 31 94% 558 521 37 93%
January 473 449 24 95% 515 498 17 97%
February 506 489 17 97% 470 454 16 97%
March 559 533 26 95% 598 588 10 98%
Total 5648 5388 260 95% 5463 5230 233 96%
Customer Driven Quality Improvement Through Lean Manufacturing Approach
44
Issues Identified
l No standard transit time was defined for locations.
l Networking problem with the transporters for in-transit tracking of consignment
l No penalties were levied for late delivery of the consignments to the transporters
Action Plan
l Standard Transit Time defined for each location
l Day to day follow-ups and in-transit tracking of consignments
l Late delivery penalty clause was included in the agreement
Sales – Low Fill Rate (Modern Trade)
Problem Description
There was no centralized processing system or coordination for order and delivery management. Because of which delivery of the consignments could not be matched as per the orders raised. So, there had been loss of sale considering the low fill rate by the Modern Trade Sales. To overcome this problem a Centralized Order Processing System (COPS) was developed to handle and synchronize the coordination amongst the supplier and the receiver and also to have control on material indenting system.
Objectives of the Cops Set are as follows:
l Centralize Order Processing System For Betterment Of Order Management
l Minimize Lead Time of PO Delivery
l Reduce Stock Out/Loss of Sale
l Maximize Fill Rate of Modern Trade Pos
l Minimize FG Stock Ageing
l Centralize Information Related to PO/Order Status Like Billing / Dispatch / Delivery / Acknowledgement and Customer Demand Trend
Action Plan
l Centralized Order Punching System
l Understanding the right SKU requirement through indent planning module
l Indent processing after analysing the sales trend
l Ensuring on time delivery
l Timely coordination with depot and sales team to achieve maximum billing
l Evaluating and working on reasons for short supply
DS Spiceco Private Limited

45
Scenario
Table No.: 14
Past Present
* PO punching at respective Depots.* PO’s were punched as per the stock
availability at the respective depots.* Lack of information flow from the depot to
the top level management.
* PO punching centralised to the SCM department.
* No amendments were made in the punching of the PO received from the chain.
* Increase in transparency at all levels of management.
Centralized Order Punching System
l PO received from the buyer by Sales person
l Sales person sends the PO to Centralized SCM (Modern Trade)
l SCM person coordinates with the Depots considering the available stock at the depot and the sales trend.
l SCM person further communicates with the Production department if stock is not available at the FG Store.PO RECEIVED
FROMCENTRALIZED PO PROCESSING AT
ORDER DELIVERY FROM RESPECTIVE
DEPOTS
SUPPLY CHAIN DEPARTMENT
PAN INDIA DEPOTS
Understanding of the Right SKU Requirement Through Indent Planning Module
l Indent is planned after review and analysis of the planning module
l The module clearly identifies the actual trend of requirement (SKU wise)
l Depot wise sales trends are identified and reviewed.
Customer Driven Quality Improvement Through Lean Manufacturing Approach

46
Table No.: 15
Indent processing after analysing the monthly sales trend (Depot wise) – An Example
Ensuring On Time Delivery
l Tentative delivery time is identified (Depot wise/Location wise) – mentioned in every PO
l Direct coordination with buyer
l Agreement with the party (as per the timeline defined). Annual review of performance/revision
l Delivery of material from FG Store as per the schedule
l Tracking of vehicle till it reaches the destination
l Confirmation from buyer once received the material
Timely coordination with depot and sales team to achieve maximum billing
l Frequent coordination with sales team to understand the requirement.
l Frequent and timely coordination with depots to complete the order.
l Regular coordination with production team for fulfilling the order (if any SKU is under stock)
Evaluating and working on reasons for short supply
l Depot – Stock analysis at depot (Ageing/Quantity/SKU wise)
l Sales – Coordination with sales for order quantity, any changes, etc
l Production – Production plan analysis/coordination for any changes required to complete the orders.
DS Spiceco Private Limited

47
l FG Store – Stock analysis at regular intervals considering orders in hand and tentative orders.
Inventory Days working
Table No.: 16
Com
pany
Cod
e
Depo
t
Zone
Dist
ance
from
No
ida
to D
epot
(K
.M)
Avr l
ead
time
in
supp
ly (d
ays)
Std
dev
in le
ad
time
Safe
ty s
tock
day
s
Std
ROP
Avr.
Lead
tim
e fo
r or
der e
xecu
tion
Sugg
este
d R
OP
Cons
ider
ed R
OP
(Day
s)
Reor
der D
ays
Tota
l sto
ck h
oldi
ng
days
19 Delhi North 20 1 0 7 8 3 11 10 0 101M Hyderabad South 1550 8 1 7 15 3 18 20 10 301R Agartala East 2550 13 1.5 7 20 3 23 25 20 451W Zirakpur North 260 2 0 7 9 3 12 10 10 2021 Lucknow North 470 3 0.5 7 10 3 13 15 10 2522 Ahmedabad West 950 5 1 7 12 3 15 15 10 2523 Bangalore South 2130 11 1.5 7 18 3 21 20 20 4024 Bhiwandi West 1400 7 1 7 14 3 17 15 10 2525 Patna East 1050 6 1 7 13 3 16 15 10 2526 Coimbtore South 2500 10 1.5 7 17 3 20 20 10 3027 Bhub. East 1650 9 1 7 16 3 19 20 10 3028 Indore North 950 5 1 7 12 3 15 15 10 25
Table No.: 17SALES TREND
Depo
t Cod
e
Depo
t
Item
Cod
e
Desc
riptio
n
Case
Siz
e
Oct
Nov
Dec
Jan
Feb
Mar
01 M
ar 2
017
to ti
ll da
te S
ale
Stoc
k as
on
date
Tran
sit s
tock
MT
Stoc
k as
on
18.0
4.17
(Loo
se)
19 Delhi FS1013100G Catch Salt - White - Sprinkler - 100g
100 660 1420 1560 1420 1060 1532 160 911 0 911
19 Delhi FS1013200G Catch Salt - White - Sprinkler - 200g
72 2664 5184 4276 3032 2808 2808 1152 463 0 463
19 Delhi FS1023200G Catch Salt - Black - Sprinkler - 200g
72 6012 8640 7062 6004 5112 7920 1800 2041 0 2041
19 Delhi FS1053100G Catch - Sendha Namak - Sprinkler - 100g
100 625 700 950 1050 800 1969 100 460 0 460
19 Delhi FS1105100G Catch Saunf Powder - Line Carton - 100g
80 240 460 240 360 280 320 80 140 0 140
19 Delhi FS1113050G Catch Pepper - Black - Sprinkler - 50g
100 2614 1900 2000 3030 2500 2700 0 939 0 939
19 Delhi FS1F73300G Black Pepper 100g Wh Salt White 200g (Sprink)free
36 1812 1048 128 0 0 0 0 0 0 0
19 Delhi FS1113100G Catch Pepper - Black - Sprinkler - 100g
72 144 447 1058 1212 1584 2160 360 1174 0 1174
Customer Driven Quality Improvement Through Lean Manufacturing Approach

48
Catering Reasons For Short Supply
Table No.: 18
Reason Feb 2014-March 2015
April 2015- March 2016
April 2016-March 2017
Improvement
No. of IncidentsAppointment not confirmed 2 3 0 100.00%Low Value PO 63 0 0 100.00%New PO generated 8 0 0 100.00%Packaging Problem 10 1 0 100.00%Bar Code issue 0 8 2 75.00%Other issue 35 5 10 71.43%MRP/ VAT/ Margin change 782 410 325 58.44%Stock Not Available 4790 3658 3493 27.08%Old Stock 724 547 535 26.10%Payment issue 40 32 42 -5.00%Total 6454 4664 4407 31.72%
Table No.: 19
Fill Rate (2013-14 to 2016-17)
Mt Sales (April 2013 to March 2017)
DS Spiceco Private Limited

49
Future Course of Action
l Reduction in reasons for short supply both at primary and secondary levels.
l Better flow of information at all levels of management.l Increasing the brand presence at all levels by satisfying the customers in the
right way.
Finished Good
Problem Description: Ageing of Finished Goods
The initiative was taken to overcome the loss of material due to ageing problem in various depots. It was observed that there was huge loss due to market return goods.
Action Plan
To counteract the problem the finished goods life cycle was categorized in the following types,
* Remaining shelf life with 1-2 months
* Remaining shelf life with 3-4 months
* Remaining shelf life with 5-6 months
* Remaining shelf life with 7-9 months
* Remaining shelf life with 10-12 months
* With shelf life more than 1 year
On the basis of the above categorization the shelf life of the finished goods was analyzed product-wise/ depot-wise.
Table: 20
Result summary of Improvement after implementation of action plan
Month 1-2 months (Lacs)
3-4 months (Lacs)
5-6 months (Lacs)
7-9 months (Lacs)
10-12 months (Lacs)
More than 1 year (Lacs)
Jan '17 900 251 108 33 78 4Feb '17 773 268 79 52 33 12Mar '17 455 252 60 50 17 14
Maintenance: Autonomous Maintenance
Problem Description
Considering the frequent breakdowns on the machine and wastage of packing material due to machine problem, the FFS (Multi-Track) machine was selected as a pilot project. Existing Av. M/c B/d 80 Hrs. in the Months in the Year 2017 and in March 2017 it reduced by 40% of the Total B/d Hrs t Av. 47 Hrs.
Customer Driven Quality Improvement Through Lean Manufacturing Approach

50
Purpose
To involve people with responsibilities on routine maintenance, such as cleaning, lubricating, and inspection etc. in the hands of operators and initial corrective and preventive Maintenance.
Planned Implementation under Autonomous maintenance are as follows:
* Training to the Operators and their Knowledge updating
* Gives operators greater “ownership” of their equipment.
* Increases operators’ knowledge of their equipment.
* Ensures equipment is well-cleaned and lubricated.
* Identification of critical issues before these become failures.
* Makes the maintenance personnel free to take up higher-level tasks.
Table: 21 - ACTION PLAN
GANTT CHART: AUTONOMOUS MAINTENANCE@ MULTI-TRACK MACHINE
Steps ActivityMar '17 Apr '17 May '17 Jun '17
1W 2W 3W 4W 1W 2W 3W 4W 1W 2W 3W 4W 1W 2W
Step-1Equipment Selection and Team formation
Step-2 know Your Machine
Step-3 Initial Cleaning & Inspection
Step-4Eliminate Contamination & Inaccessible Areas
Step-5Establish Cleaning and Inspection Standards
Step-6 Finalize Standard & Train
Step-7 Sustain
Table: 22 - DETAILED ACTIVITY CHART
Steps ACTIVITIESStep-1 Equipment Selection and Team formation
Identify base for selection of particular equipment; Define selection criteria for the teamIdentify the team members (cross functional)
Step-2 know the machine/Equipment
• Machine parts, their functions, failures, remedies (reference of machine manual may be taken)(machine component sheet)
Step-3 Initial Cleaning (thorough cleaning)
• Cleaning of surrounding area; unnecessary item; place for everything and everything in place
• Cleaning of machine (dust, dirt, grime, oil, grease and other contaminants)• Expose the hidden defects inside the machine/equipment• Open up all guards, covers, compartments to expose the actual condition of the
machine
DS Spiceco Private Limited
51
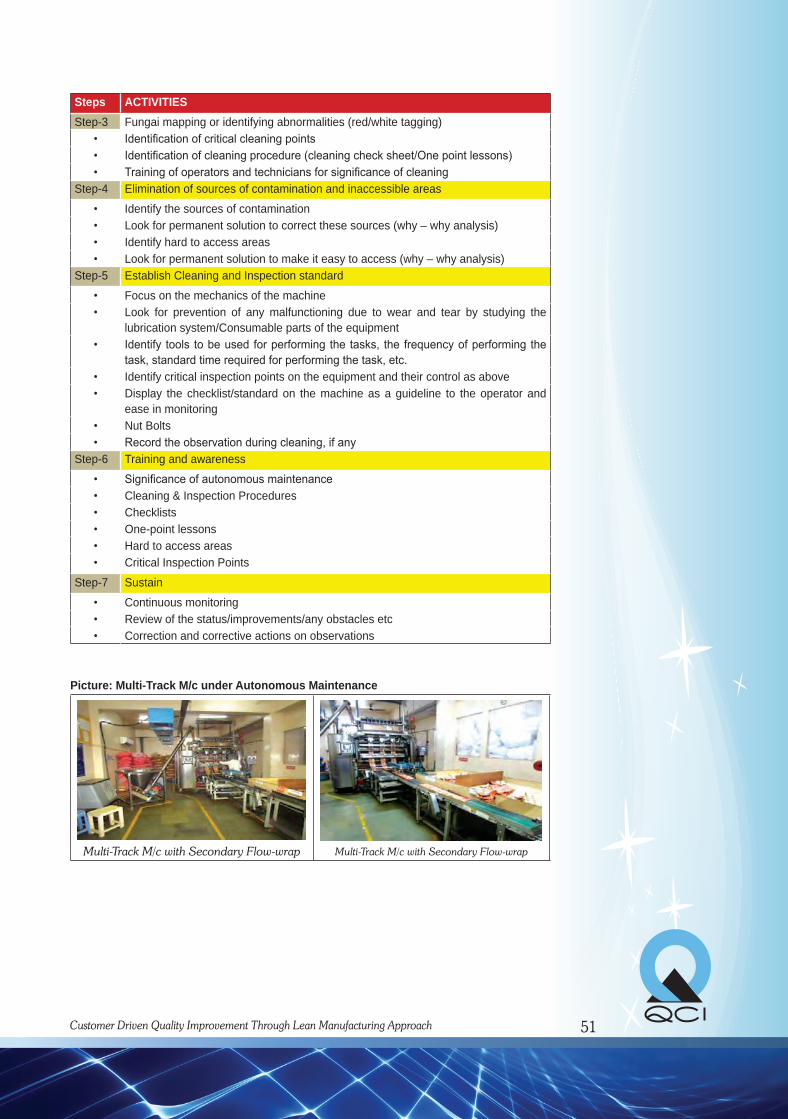
Steps ACTIVITIESStep-3 Fungai mapping or identifying abnormalities (red/white tagging)
• Identification of critical cleaning points• Identification of cleaning procedure (cleaning check sheet/One point lessons)• Training of operators and technicians for significance of cleaning
Step-4 Elimination of sources of contamination and inaccessible areas
• Identify the sources of contamination • Look for permanent solution to correct these sources (why – why analysis)• Identify hard to access areas • Look for permanent solution to make it easy to access (why – why analysis)
Step-5 Establish Cleaning and Inspection standard
• Focus on the mechanics of the machine• Look for prevention of any malfunctioning due to wear and tear by studying the
lubrication system/Consumable parts of the equipment• Identify tools to be used for performing the tasks, the frequency of performing the
task, standard time required for performing the task, etc.• Identify critical inspection points on the equipment and their control as above• Display the checklist/standard on the machine as a guideline to the operator and
ease in monitoring• Nut Bolts• Record the observation during cleaning, if any
Step-6 Training and awareness
• Significance of autonomous maintenance• Cleaning & Inspection Procedures• Checklists• One-point lessons• Hard to access areas• Critical Inspection Points
Step-7 Sustain
• Continuous monitoring• Review of the status/improvements/any obstacles etc• Correction and corrective actions on observations
Picture: Multi-Track M/c under Autonomous Maintenance
Multi-Track M/c with Secondary Flow-wrap Multi-Track M/c with Secondary Flow-wrap
Customer Driven Quality Improvement Through Lean Manufacturing Approach
52
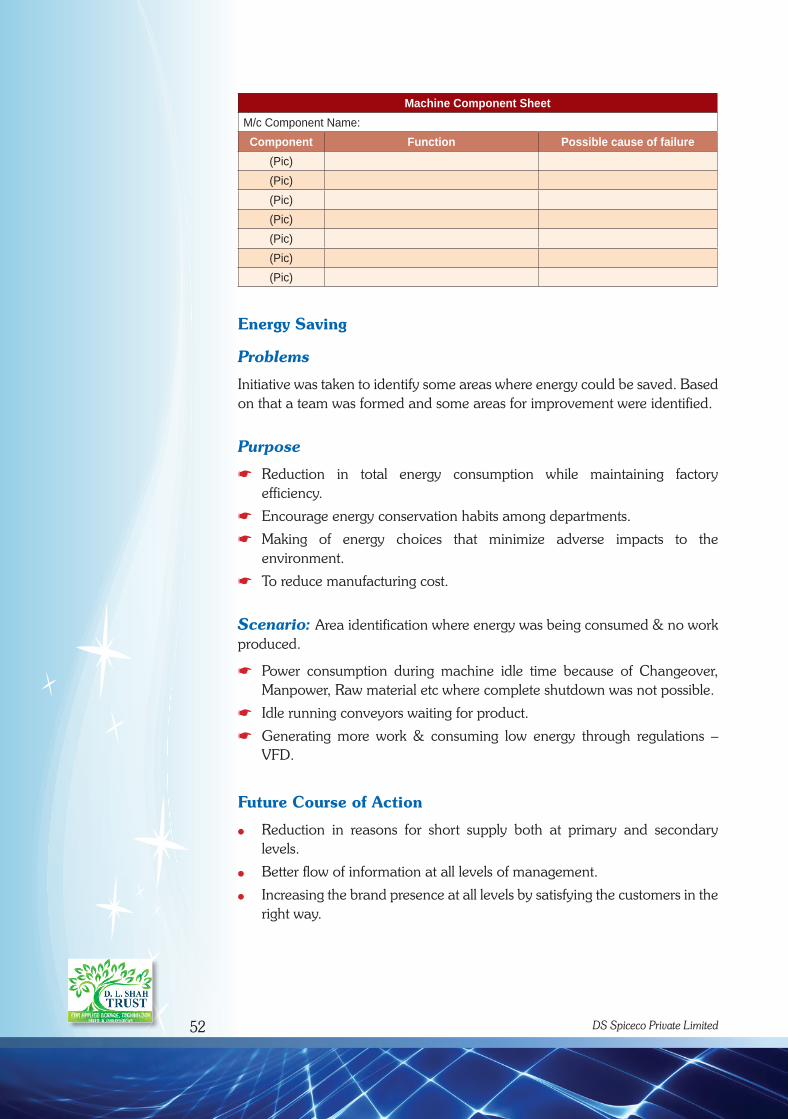
Machine Component SheetM/c Component Name:Component Function Possible cause of failure
(Pic)(Pic)(Pic)(Pic)(Pic)(Pic)(Pic)
Energy Saving
Problems
Initiative was taken to identify some areas where energy could be saved. Based on that a team was formed and some areas for improvement were identified.
Purpose
* Reduction in total energy consumption while maintaining factory efficiency.
* Encourage energy conservation habits among departments.
* Making of energy choices that minimize adverse impacts to the environment.
* To reduce manufacturing cost.
Scenario: Area identification where energy was being consumed & no work produced.
* Power consumption during machine idle time because of Changeover, Manpower, Raw material etc where complete shutdown was not possible.
* Idle running conveyors waiting for product.
* Generating more work & consuming low energy through regulations – VFD.
Future Course of Action
l Reduction in reasons for short supply both at primary and secondary levels.
l Better flow of information at all levels of management.
l Increasing the brand presence at all levels by satisfying the customers in the right way.
DS Spiceco Private Limited

53
Energy Conservation
Objectives
* Reduction in total energy consumption while maintaining factory efficiency.
* Encourage energy conservation among departments
* Making of energy choices that minimize adverse impacts to the environment.
* To reduce manufacturing cost.
Scenario
* Area identification where energy was consumed & no work produced.
* Power consumption during machine idle time because of Changeover, Manpower, Raw material etc where complete shutdown was not possible.
* Idle running conveyors waiting for product.
* Generating more work & consuming low energy through regulations – VFD.
Action Plan
* Shutting down heaters supply during idle time (Changeovers, Shift Change, Lunch & Tea Time, Breakdowns)
* Shutting down conveyor motor while waiting for product from downstream machine.
* Reduce power consumption in Grinders on fluctuating loads.
Unit/ Packet Variation in Line Carton 1 – Jan 17
3 Standard as per machine rated load – 0.00263 Unit/Packet
3 Average of the month – 0.003 Unit/Packet
3 Lowest recorded – 0.00283
3 Highest recorded – 0.0035
Customer Driven Quality Improvement Through Lean Manufacturing Approach
54
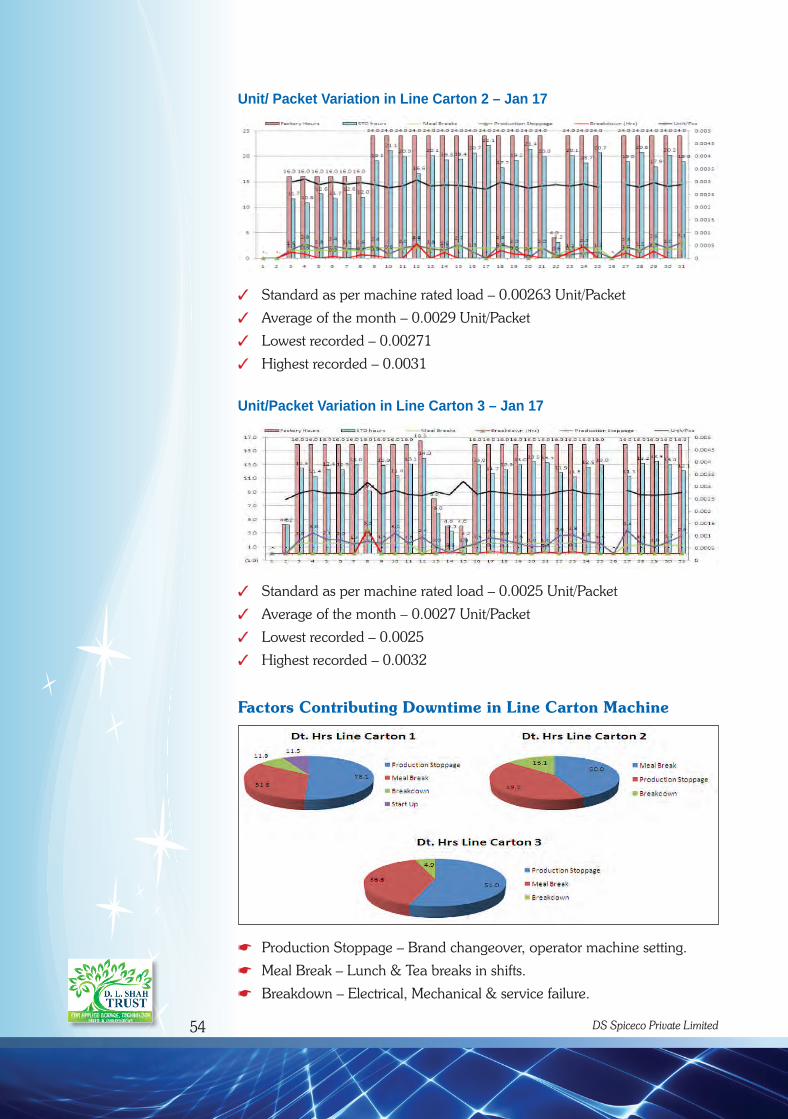
Unit/ Packet Variation in Line Carton 2 – Jan 17
3 Standard as per machine rated load – 0.00263 Unit/Packet
3 Average of the month – 0.0029 Unit/Packet
3 Lowest recorded – 0.00271
3 Highest recorded – 0.0031
Unit/Packet Variation in Line Carton 3 – Jan 17
3 Standard as per machine rated load – 0.0025 Unit/Packet
3 Average of the month – 0.0027 Unit/Packet
3 Lowest recorded – 0.0025
3 Highest recorded – 0.0032
Factors Contributing Downtime in Line Carton Machine
* Production Stoppage – Brand changeover, operator machine setting.
* Meal Break – Lunch & Tea breaks in shifts.
* Breakdown – Electrical, Mechanical & service failure.
DS Spiceco Private Limited

55
Correlation & Action Plan
Production Stoppage, Breakdown & Meal breaks has one common correlation leading to variation in KWH/Packet and is that during the downtime sealing heaters & vacuum generators are continuously consuming power.
* Vacuum pump can be shut down via manual selector switch but dependent of human factor.
* Sealing heaters – can’t be switched off as heat should be at required set point when required to produce.
* Heaters can be switched OFF & ON during changeovers but dependent of human factor.
Action Plan
Installation of timers on Vacuum pump & Heaters.
Vacuum Pump Logic
Heater Logic
Unit/ Packet Variation in Line Carton 1 – Mar 17
3 Standard as per machine rated load – 0.00263 Unit/Packet
3 Average of the month – 0.00269 Unit/Packet
3 Lowest recorded – 0.00267
3 Highest recorded – 0.00272
Customer Driven Quality Improvement Through Lean Manufacturing Approach
56
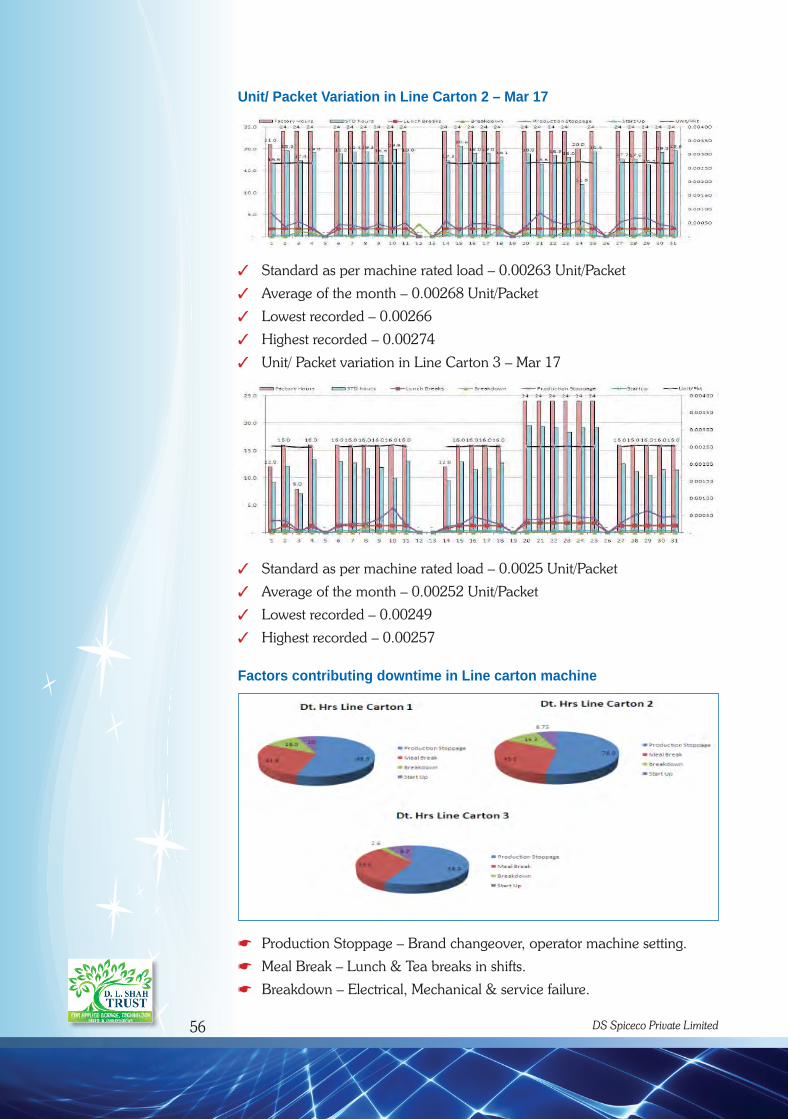
Unit/ Packet Variation in Line Carton 2 – Mar 17
3 Standard as per machine rated load – 0.00263 Unit/Packet
3 Average of the month – 0.00268 Unit/Packet
3 Lowest recorded – 0.00266
3 Highest recorded – 0.00274
3 Unit/ Packet variation in Line Carton 3 – Mar 17
3 Standard as per machine rated load – 0.0025 Unit/Packet
3 Average of the month – 0.00252 Unit/Packet
3 Lowest recorded – 0.00249
3 Highest recorded – 0.00257
Factors contributing downtime in Line carton machine
* Production Stoppage – Brand changeover, operator machine setting.
* Meal Break – Lunch & Tea breaks in shifts.
* Breakdown – Electrical, Mechanical & service failure.
DS Spiceco Private Limited

57
Table: 23 - Comparison Jan 17 & March 17 Downtime & Unit Wise
Way Forward
1. Implementation of same concept on other packaging machines & shrink tunnel machine.
2. Total no of packaging machine in the unit = 24
3. Total No of Shrink tunnel = 5
4. Total heating wattage of above machines = 62.45 KW
5. Lunch & Tea breaks in three shifts = 1.75 Hrs
6. Minimum changeover = 1 hr per machine per day.
7. Total unit saved per day = 86 KWH, Per month = 86X25 = 2150,
8. Per Annum = 2150*12 = 25800.
9. Total saving per annum = Rs 258000.
Sustainability
1. Work Instruction for monitoring and maintenance of RH meter.
2. Work Instruction for operation of line carton machine.
3. Work Instruction for storage and handling of packing materials.
4. Work Instruction for Printing machine.
5. Work Instruction for hopper feeding.
6. SOP for Energy Conservation.
7. SOP for Autonomous Maintenance.
Customer Driven Quality Improvement Through Lean Manufacturing Approach

58
Kaizen in the Plant
Project Outcome: Financial Benefit
Benefits to the Organization from Cops
l Rise in sales by 122.92% from 2013-14 till date.l Reduction in Damage and Expiry to 0.44%l Increase in the product reach by making it available to the customer across
the nation.
Benefits to the Organization due to Increase of Fill Ratel Rise in sales by 122.92% from 2013-14 till date.l Reduction in damage and expiry material to 0.44%l Increase in the product reach by making it available to the customer across
the nation.
Financial Benefits Energy Saving of 1200 Units in one month in Lined Carton machine.LC1 – 588 UnitsLC2 – 534 UnitsLC3 – 78 UnitsCost per KWH = Rs 10Total amount saved = 12000/monthTotal amount saved annually (average 1000 units/month) = 1000X10 X12 = Rs. 1,20,000/-
Financial Benefits for Defects Reduction There are enormous financial benefits occurred due to saving of all the above benefits in all above projects.
DS Spiceco Private Limited