customer expectations in mall restaurants… expectations in m… · 43 an important point that...
TRANSCRIPT
International Journal of Business and Society, Vol. 14 No. 1, 2013, 41 - 60
CUSTOMER EXPECTATIONS IN MALL RESTAURANTS: A CASE STUDY
Murat Ismet Haseki♣
Cag University
ABSTRACT
Shopping malls (SM) have become places meeting entertainment needs of the contemporary urban people as well as their shopping needs. In this direction, these organized enterprises have incorporated recreative elements such as cinema, play, exhibit, chat, music, food-beverage and etc. that will ensure consumers having a nice time. At this point, inner-SM restaurants also came to the forefront as sub-units, which support consumer masses to be able to stay long-time and comfortable within the SM. With this study, helping to detect some expectations of inner-SM restaurant consumers was intended for inner-SM restaurants to be able to attract the most suitable and greater number of consumer masses. As an initial attempt to understand the situation in Turkey, a field survey was carried out in M1 Merkez Adana Shopping Center, a leading shopping mall in a high-income area of Adana city. 690 surveys, of which 680 are usable, were reached via “face-to-face survey” method. The obtained results point to the presence of salient relations among consumer expectations of SM restaurants according to demographic variables and educational levels of consumers.
Keywords: Retailing; Shopping Mall; Restaurant, Customer Expectations, and Adana.
1. INTRODUCTION
Shopping centers (or shopping malls) are regarded as contemporary, dynamic and lively centers of life aiming to satisfy all kinds of needs of the 21st century consumer (Alkibay, Tuncer and Hosgor, 2007: 1). Because, the act of shopping is frequently a social activity for both utilitarian and recreational purposes (Lim and Beatty, 2011). One important component in shopping mall is the restaurant, which is the focus of this research. Academic researchers pay attention to the restaurants in shopping mall but, only a few has touched upon the recreational function of inner-SM restaurants. Among them, only two studies were encountered, which laid an emphasis on the consumer attraction attribute of inner-SM restaurants to SM. Borgers, Brouwer, Kunen, Jessurun and Janssen (2010) consider the tenant mix as one of the most important factors determining the success of shopping malls. Besides department stores, restaurants/food outlets pulls notable customer to shopping mall. Kaltcheva, Patino and Chebat (2011) touch upon those inner-SM restaurants with certain styles are effective regarding attracting visitors
♣ Corresponding Author: Murat Ismet Haseki, Department of Management, Faculty of Economics and Administrative Sciences, Cag University, 33800, Mersin, Turkey. Tel: +90.324.6514800, Email: [email protected]
42
and making them experience different experiences. With this study, helping to detect some expectations of inner-SM restaurant consumers was intended for inner-SM restaurants to be able to attract the most suitable and greater number of consumer masses.
The remainder of this paper is organized as follows: section 2 outlines the literature review on shopping malls and customer behaviour in inner-SM restaurants. Section 3 highlights the research design, section 4 discusses the findings, and finally section 5 concludes.
2. REVIEW OF LITERATURE
Shopping centers are defined by various authors in different forms in the literature (e.g. Beddington, 1982: 8; Pride and Ferrel, 1983: 275; Levy and Weitz, 2004: 218). Based on various definitions made, Alkibay, Tuncer and Hosgor (2007: 2) define shopping mall in the following way: Shopping centers are complexes, in which stores with more than one departments and retailer units, cafeteria, restaurant, entertainment center, cinema, exhibit hall, bank, pharmacy and similar enterprises of all sizes are also located within a planned architectural structural unity, whose selling space might range from 5000 m2 to 30.000 m2 and which are generally established in countryside and managed from a single center.
Examining the shopping-related literature, it was seen that shopping motivations can generally differ in three types: (1) functional motivations, (2) social motivations and (3) experiential or hedonic motivations. In the present day, shopping is also considered as a form of recreation that provides pleasure and relaxation (Geuens, Vantomme and Brengman, 2004, p.616). Therefore, shopping centers are aiming to be better and bigger in order to cover the breadth in merchandise variety and range. The race for bigger centers results in an environment with additional new shopping facilities (Omar, 2007: 30). As a result of proliferation of shopping malls, increasing competition and diversification of consumer expectations, the functional motivation-related aspect of shopping has slowly started to give up its importance to the control of social and experiential motivations in the present day. As a result, shopping malls as well as many sectors and businesses have shifted from feature and benefit-oriented traditional marketing approach to innovative approaches producing experiences for their customers (Schmitt, 1999: 53).
Mall operators are competing for traffic (Chebat, Sirgy and Grzeskowiak, 2010) and against anti-mall sentiments. They have turned shopping centers (mall) into halls for special events, exhibitions, exercising, shows, and amusement parks. In many instances, the shopping mall is a social and recreation meeting place attracting youngsters and seniors (Michon and Chebat, 2004; Balsari, 2005: 2; Close, Finney, Lacey and Sneath, 2006: 425). For this reason, shopping malls are spaces, which have assumed the role of being places where people meet with each other, come across to each other and plan to have a nice time in the present day (Alkibay, Tuncer and Hosgor, 2007, 108). In other words, shopping centers are accepted as “meeting places” (Sit, Merrilees and Birch, 2003: 85). In the present day, shopping centers have become an essential part of social and economic life particularly in big cities in Turkey as well as in the whole world (Tabak, Ozgen and Aykol, 2006: 100). This transformation pointing at the shift from traditional retailing to new-generation retailing also refer to a shift from traditional marketing to new-generation experiential marketing focusing on product engineering and utility (Schmitt, 1999).
Customer Expectations in Mall Restaurants: A Case Study
43
An important point that needs to be dwelt upon regarding shopping malls is that consumers are in search of places where they can rest and satisfy their needs to eat and drink in parallel to the increase of time spent in shopping mall (Alkibay, Tuncer and Hosgor, 2007: 108). These rest and food-beverage places enable SMs to be able to appeal to more than one senses (hearing, seeing, touching, smelling, tasting) in their interaction with consumers; increase people’s ability to internalize, remember and implement the experience that they had in that SM environment (Heitzler, Asbury and Kusner, 2008:188). With these functions, these units help people to prefer the SM in question, come to that SM more and stay there longer compared to the others. In this context, investor and executives of shopping malls offer food-beverage units, cafes and restaurants, which will attract, keep and ensure consumers to spend more inside and outside of their malls. As both resting and eating ensure consumers to stay longer in shopping mall, it will also enable to increase revenues of shopping mall. Besides, the quality and quantity of SM restaurants affect the image of shopping mall as well.
It is among the observations made that as SMs offer further food and beverage possibilities, attractiveness of SMs also increases. For instance, thanks to a restaurant where a family with children can go, SM is able to attract these masses and ensure them to extra spend in retailing. Due to their increasing importance, the area of use shares of food-beverage enterprises within SMs of Southeastern Asia countries have gone up from 15% to 20% in ordinary SMs and to 25% in major SMs (Omar, 2007: 31). It can be said that developments in shopping malls in Turkey are also in this line.
Thanks to influences making the world a ‘‘global village’’, the malls are also now a part of the urban scene in many countries, including Turkey. Beginning from the mid-1980s, Turkish society has witnessed a rapid transformation in many aspects, due to economic restructuring. Increases in the average income, and organized financial support of consumption through bank credits, have added to the consumption potential of Turkish citizens (Erkip, 2005: 89). The result has been the emergence and strengthening of domestic and international corporate power within the industry. The recent drift towards the increased participation of large businesses in retailing implies a consequent trend towards increasing retail concentration (Tokatli and Boyaci, 1998: 345). Turkish people find the well-maintained comfort of the mall space convenient for daily life, particularly in crowded urban areas. Malls provide them with the modernity that has been lacking throughout the period of the Turkish Republic, despite the ideological importance of western style modernity for the urban elite (Erkip, 2003). As a result, SMs have become centers not only for shopping but also where modern life is experienced/consumed as sightseeing, eating, drinking, and entertaining and so on. To the extent that extra-retailing consumptions (e.g. food and beverage) have become a serious source of revenue for SMs in Turkish SMs.
Based on explanations above, the need for bringing inner-SM restaurants to a more effective position can be mentioned in terms of SMs to be able to increase their revenues and strengthen their image by hosting consumers longer and in a quality way. It is now known that shopping malls utilize stores (restaurants) with food-beverage function to increase traffic towards high-profile stores within their structure and to be able to manage better. These restaurants increase the circulation of SMs’ other revenue-generating units with some sort of spillover effect (Suh
Murat Ismet Haseki

44
and West, 2010: 570). To maximize the potential revenue contributions of mall restaurants, it is vital to explore the expectations of their consumers. However, little is known about the consumer expectations in mall restaurants.
It is stated in the marketing literature that expectations are a crucial determinant of consumer behaviors (Anderson, 1973; Parasuraman, Zeithaml and Berry, 1985; Oliver and Winer, 1987; Parasuraman, Berry, and Zeithaml, 1991; Boulding et al., 1993; Sheth and Mittal, 1996; Mitra and Golder, 2006; Mitra and Fay, 2010). Understanding customer needs and expectations is very important to a service-oriented organization as it protects against dissatisfied customers or, even worse, those who take their business elsewhere without voicing their complaint. After customer needs and expectations are identified, customer satisfaction must be monitored and the findings used to generate improvements. Proactively conducting customer satisfaction surveys also generates a positive impression on customers about the organization’s interest in them (HKACSE, 2001: 6). Business have two possible avenues to managing customer expectations: (i) accommodating (fulfilling) the expectations, and (ii) altering (i.e. shaping) them. Of course, when either approach fails, a third option exists, namely to abandon the customer (Sheth and Mittal, 1996: 137).
Considering the paucity of empirical evidence in this area of research, this study explored the consumer expectations in mall restaurants. More specifically, the current study examined the relationship between some properties of mall restaurants and some expectations of consumers from mall restaurants. In this direction, the research questions triggering the study can be expressed as follows:1. What are the general characteristics of customers coming to inner-SM restaurants?2. What are the expectations of target audience of inner-SM restaurants?3. What sort of relationship exists between expectations and educational level of customers coming to inner-SM restaurants?
The customer feature that is employed in question three has been “education” variable due to the fact that its determining factor is high. To find answer to this research question 25 hypothesis have been developed between 25 expectation criteria and level of education. These are as follows:
Hypothesis 1. There is significant difference between customers’ level of education and “menu variety” expectation.
Hypothesis 2. There is significant difference between customers’ level of education and “product quality” expectation.
Hypothesis 3. There is significant difference between customers’ level of education and “shop decoration” expectation.
Hypothesis 4. There is significant difference between customers’ level of education and “comfort” expectation.
Customer Expectations in Mall Restaurants: A Case Study
45
Hypothesis 5. There is significant difference between customers’ level of education and “shop’s having own sitting place/ saloon” expectation.
Hypothesis 6. There is significant difference between customers’ level of education and “music broadcasting” expectation.
Hypothesis 7. There is significant difference between customers’ level of education and “right level of prices” expectation.
Hypothesis 8. There is significant difference between customers’ level of education and “exhibition of food and beverages” expectation.
Hypothesis 9. There is significant difference between customers’ level of education and “hygiene” expectation.
Hypothesis 10. There is significant difference between customers’ level of education and “ease of reach and parking facilities” expectation.
Hypothesis 11. There is significant difference between customers’ level of education and “brand recognition” expectation.
Hypothesis 12. There is significant difference between customers’ level of education and “crowd in shops” expectation.
Hypothesis 13. There is significant difference between customers’ level of education and “peace in shops” expectation.
Hypothesis 14. There is significant difference between customers’ level of education and “coming of youngsters to the shops” expectation.
Hypothesis 15. There is significant difference between customers’ level of education and “coming of families to the shops” expectation.
Hypothesis 16. There is significant difference between customers’ level of education and “having entertaining factors in the shops” expectation.
Hypothesis 17. There is significant difference between customers’ level of education and “having filling food meals” expectation.
Hypothesis 18. There is significant difference between customers’ level of education and “attraction of food and beverages” expectation.
Hypothesis 19. There is significant difference between customers’ level of education and “availability of product tasting and trying” expectation.
Murat Ismet Haseki
46
Hypothesis 20. There is significant difference between customers’ level of education and “having gifts and samples” expectation.
Hypothesis 21. There is significant difference between customers’ level of education and “fast service of food and beverages” expectation.
Hypothesis 22. There is significant difference between customers’ level of education and “having services to the tables” expectation.
Hypothesis 23. There is significant difference between customers’ level of education and “having product promotions” expectation.
Hypothesis 24. There is significant difference between customers’ level of education and “care for food’s nutritional values” expectation.
Hypothesis 25. There is significant difference between customers’ level of education and “shops’ having quality certification” expectation.
By seeking answer to the research questions above, it was aimed to help the objectives of providing to define consumers, who use mall restaurants, from different aspects and for SMs to be able to further get close to their goals of existence in terms of consumers. A leading mall in Adana, M1 Merkez, was picked as field of research to contribute to meet this need.
3. RESEARCH DESIGN
The objective of this research is to help detect some expectations of target consumer audiences by looking at some characteristics of consumers coming to inner-SM restaurants towards ensuring inner-SM restaurants to be able to increase their profits by attracting the most suitable and greater number of consumer masses and consumers to spend longer time in SM. In line with the research objective, first of all, the literature on SMs and restaurants operating within the structure of SMs was reviewed. Then, the research population was described as “individuals between 16-60 years old using mall restaurants”.
The research was planned to be carried out in M1 Merkez Adana SM as a pilot study. Thus, consumers using M1 Merkez Adana SM restaurants constitute the population scope of the research. No ready information could be reached regarding the number of consumers, who use restaurants operating in M1Merkez Adana SM. On the other hand, according to the daily average entry information taken from the SM business management, it was understood that about 90.000 people with very different ages visit the SM per week without looking at whether they have used the SM restaurants. Due to the fact that population standard deviation or variances are not known, the minimum sample size was calculated as 385 people for a population of 90.000 people by basing on the value of 0.25, which is the highest value that [Π(1-Π)] can take, in calculating sample size.
Survey was used in the study as the data collection instrument. Survey was developed in light of an “in-depth interview” study conducted with open-ended questions in the field of practice
Customer Expectations in Mall Restaurants: A Case Study

47
of the present research and studies in the literature regarding inner-SM restaurants. The final draft of survey was subjected to pre-test in the same field. Survey became ready for application by adjustments carried out by looking at the pre-test results. In sum, questions towards putting forward some demographic attributes of the sample such as gender, marital status, income status, educational level, age and having children and towards ranking an inner-SM restaurant, which is considered to receive service from, according to various criteria, appeared in survey. The data collecting operation was carried out by surveyors. Surveyor candidates were selected among post-graduate business students. The selected surveyors were given training at basic level on the subjects that need to be paid attention in the field study.
Due to the fact that being able to collect the data rapidly and with low cost (Yukselen, 2009: 49) was intended and the current study was considered as a pilot research, “convenience sampling” method, which is one of the non-random sampling methods, was preferred as sampling method. Also, in light of detection made by Yildirim and Simsek (2005: 120) regarding non-random sampling method as “Albeit sampling error cannot be detected in non-random sampling, a well-formed non-random sampling suitable for purpose might present valid and reliable outcomes compared to random sampling. But of course, being able to perform a non-random valid and reliable sampling considerably depends on skill, capability and experience of the researcher”, effort was shown to generate sampling well and suitable for purpose to be able to reach valid and reliable outcomes as much as possible in the current study.
“Face-to-face survey” method was employed for collecting the research data. The research lasted for one month in a way to cover every day of the week as the SM occupancy rate varies in days of the week. The data collecting operation was meticulously performed by surveyors under supervision of researcher. As a result of this field study conducted within March, 2009, 690 surveys, of which 680 was suitable for analysis, were obtained.
In the analysis section of study, first of all, putting forward some outcomes via statistics and cross tabulations such as frequency, average, standard deviation was resorted Afterwards, being a demographic variable, the education which was chosen because of its impact on customers’ behaviors towards shopping malls has been analyzed with customers’ mall expectations through some hypotheses. In the testing of hypotheses Kruskal-Wallis H test has been used. Kruskal –Wallis H test is a method used to compare measurements of more than two groups with non-parametric data sets. It has been observed that the analysis performed is also useful for exemplifying the advanced level analyses in this field. With analyses, computer statistical package softwares were utilized.
Some demographic characteristics of sample individuals covered such as gender, marital status, income status, educational level, age and having children as well as ranking an inner-SM restaurant, which is considered to receive service from, according to 25 different criteria of expectation were included in the study. A 5-point Likert type scale was used in ranking the said criteria. Ranking was carried out in the form of “5=Considerably important”, “4=Quite important”, “3=Moderately important”, “2=A little important”, “1=Not important at all”. Some results were reached by statistics, cross tabulations such as frequency, average, standard deviation and ranking of an inner-SM restaurant according to 25 different criteria of expectation and a Kruskal-Wallis H test was conducted depending on the criterion of educational level as part of study.
Murat Ismet Haseki

48
4. DISCUSSION OF FINDINGS
It would be appropriate to present the study results in two groups. The first group of results is descriptive statistics towards putting forward information regarding demographic characteristics of sample. The second group of results is Kruskal-Wallis H test results regarding the correlation between “educational level” variable and some expectations of consumers from mall restaurants.
4.1. Descriptive statistics
In the descriptive statistics section, the general situation of demographic variables of sample such as gender, marital status, having children, income status and age was put forward (see Table 1). Additionally, detailed information on subjects such as “consumers’ reasons for preferring inner-SM restaurants”, “consumers’ frequency of using inner-SM restaurants”, “time spent by consumers in inner-SM restaurants”, “consumers’ tendency to use different restaurants” and “sample individual’s reason for preferring the current restaurant” was also obtained (see Table 2 – Table 6).
Table 1: Demographic Characteristics of the Participants Involved in the Study (n=680)
Gender %Female 40.9Male 59.1Total 100 Marital Status %Married 35.3Single 59.7Other 5.0Total 100 Having Children %With Children 21.2Without Children 78.8Total 100 Educational Level %Elementary Education 26.9University 62.8Post-Graduate 10.3Total 100
Customer Expectations in Mall Restaurants: A Case Study

49
According to Table 1, it is understood that 40.9% of sample individuals, who participated in the study, was female and 59.1% was male. The female-male ratio being 2/3 approximately is seen as a salient finding. In other words, male sample individuals are about one and a half times female sample individuals. Looking at in terms of marital status, it is seen that 35.3% of sample is married, 59.7% is single and 5% in total consists of divorced, widowed or separately living people. From here, it is understood that majority, who uses the food-beverage section of SM, is single. It is seen that in parallel to the married-single ratio shown by marital status profile, 21.2% of sample consists of individuals with children and 78.8% consists of individuals without children. Of sample individuals, 26.9% received education in elementary education level (elementary school+secondary school+high school), 62.8% received education in university level (vocational high school+undergraduate) and 10.3% received education in post-graduate level (master’s+doctorate).
Income status of sample individuals included in the study was investigated in seven categories. Accordingly, it is understood that income of 25.1% of sample is 750 TLs and below, income of 26.2% is between 751-1500 TLs, income of 25.9% is between 1501-2250 TLs, income of 7.1% is between 2251-3000 TLs, income of 5.6% is between 3001-3750 TLs, income of 3.1% is between 3751-4500 TLs and income of 7% is 4501 TLs and above. In general, it stands out that income of approximately 4/5 (77.2%) of consumers preferring SM restaurants is below 2250 TLs.
Similarly, it is understood that 14.4% of the ones, who participated in the study, consists of individuals 20 years old and under, 60.4% consists of individuals between 21-30 years old, 16.9% consists of individuals between 31-40 years old, 6.9% consists of individuals between 41-50 years old and 1.3% consists of individuals 51 years old and above.
Table 1: Demographic Characteristics of the Participants Involved in the Study (n=680) (cont)
Income Status %750 TLs and below 25.1Between 751-1500 TLs 26.2Between 1501-2250 TLs 25.9Between 2251-3000 TLs 7.1Between 3001-3750 TLs 5.6Between 3751-4500 TLs 3.14501 TLs and above 7.0Total 100 Age %20 years old and below 14.4Between 21-30 years old 60.4Between 31-40 years old 16.9Between 41-50 years old 6.951 years old and above 1.3Total 100
Murat Ismet Haseki

50
Table 2 put forwards the reasons of consumers, who prefer inner-SM restaurants, for preferring these restaurants. While sample individuals were answering this question, they preferred more than one. For this reason, the sum of eight reasons of preference is greater than 100%. According to Table 2, “eating-drinking” activity/objective comes first by a wide margin among sample individuals’ reasons for preferring inner-SM restaurants. The highest percentage following this belongs to “post-shopping resting” activity/objective. “Products being healthy”, “meeting with friends” and “killing some time” are other objectives with close percentages to each other that are influential in preference of inner-SM restaurants. Apart from these, having “brand familiarity”, “preferences of children” and “cheapness of prices” are also influential objectives.
Looking at sample individuals’ frequency of using inner-SM restaurants, it is understood that a great majority (40.1%) visit these restaurants once a month. Approximately ¼ of sample (24.3%) comes to these restaurants “once in two weeks”. Consumer mass, who regularly visit inner-SM restaurants, is approximately around 1/5 (18.4%) of all sample.
Table 2: Dominant Reason of Preference for Restaurants in SM
Order n=680 %
1 Eating-drinking 42.8 2 Post-shopping resting 26.9 3 Products being healthy 12.9 4 Meeting with friends 12.2 5 Killing some time 11.8 6 Brand familiarity 9.7 7 Pleasing my child 8.4 8 Prices being cheap 2.8
Table 3: Frequency of Using Restaurants in SM
n=680 %
I am using restaurants in here for the first time 3.1I rarely use restaurants in here (once in three months) 14.1I sometimes use restaurants in here (once a month) 40.1I frequently use restaurants in here (once in two weeks) 24.3I regularly use restaurants in here (once a week) 18.4Total 100
Customer Expectations in Mall Restaurants: A Case Study
51
Table 4: Time Spent in Restaurants in SM
n=680 %
Up to 15 minutes 1.8 Up to 30 minutes 20.3 Up to 1 hour 35.2 Up to 2 hours 25.3 3 hours and more 17.4 Total 100
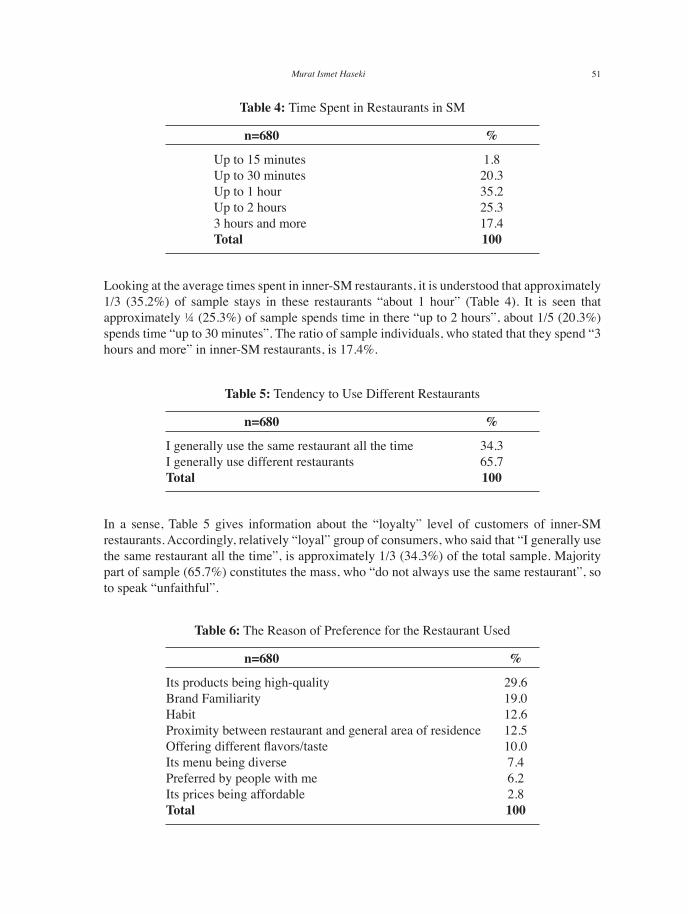
Looking at the average times spent in inner-SM restaurants, it is understood that approximately 1/3 (35.2%) of sample stays in these restaurants “about 1 hour” (Table 4). It is seen that approximately ¼ (25.3%) of sample spends time in there “up to 2 hours”, about 1/5 (20.3%) spends time “up to 30 minutes”. The ratio of sample individuals, who stated that they spend “3 hours and more” in inner-SM restaurants, is 17.4%.
Table 5: Tendency to Use Different Restaurants
n=680 %
I generally use the same restaurant all the time 34.3I generally use different restaurants 65.7Total 100
Table 6: The Reason of Preference for the Restaurant Used
n=680 %
Its products being high-quality 29.6Brand Familiarity 19.0Habit 12.6Proximity between restaurant and general area of residence 12.5Offering different flavors/taste 10.0Its menu being diverse 7.4Preferred by people with me 6.2Its prices being affordable 2.8Total 100
In a sense, Table 5 gives information about the “loyalty” level of customers of inner-SM restaurants. Accordingly, relatively “loyal” group of consumers, who said that “I generally use the same restaurant all the time”, is approximately 1/3 (34.3%) of the total sample. Majority part of sample (65.7%) constitutes the mass, who “do not always use the same restaurant”, so to speak “unfaithful”.
Murat Ismet Haseki
52
Sample individuals’ reasons for preferring the current restaurant, by which they are offered service, are given along with their ratios in Table 6. Accordingly, the most important reason (29.6%) why sample individuals prefer the current restaurant, by which they are offered service, is that “its products are high-quality”. The following second important reason (19.0%) of preference appeared as “brand familiarity”. Other following important reasons for preference are sorted as “habit” (12.6%), “proximity between restaurant and general area of residence” (12.5%) and “offering different flavors/taste” (10.0%).
It is possible to conduct advanced-level analyses towards target audiences, who are desired to be attracted to SM or preferred, in parallel to medium and long-term strategy of the SM management. For instance, performing studies towards further encouraging women, individuals with children, the married, the ones with high level of age, the ones with high income level and etc. can be considered. Similarly, some attributes of inner-SM restaurants can be subject to detailed investigation on the basis of one or several demographic characteristics preferred and in this way, inner-SM restaurants can be further developed in respect of their attributes (criteria) investigated. In the current study, to exemplify this situation, food-beverage businesses operating in M1 Merkez Adana SM were analyzed by twenty-five (25) expectation criteria on the basis of educational level of sample.
It was seen that male sample individuals are majority within the sample addressed in the study. Male sample individuals are one and a half times more than female sample individuals. If this situation is not compatible with the desired profile of consumers coming to inner-SM restaurants, a study must be conducted towards being able to attract desired consumers. As a matter of fact, inner-SM restaurants are one of the first places, where families with children also prefer to entertain and please their children in addition to shopping, in the present day. Making regions, where SM restaurants are present, suitable for mass majority might produce the result for the SM management to draw away from its objective and its real target audience in the long run.
Looking at in terms of marital status, it is seen that inner-SM restaurants are mostly preferred by unmarried masses. By looking at the analysis results, the following can be easily said that the sum of the single, divorced, widowed and separately living ones is almost twice than the married sample. From here, it can be easily inferred that food-beverage section of SMs are preferred by others rather than the married. Assessing results pointed by this variable as well as results regarding the gender variable as suitable for purpose is important. If the targeted audience is unmarried individuals, suitable physical and marketing, advertising, publicity and promotional adjustments should be made in inner-SM restaurant spaces.
It was seen that about 4/5 of the sample consists of individuals without children in a way that would support the marital status profile. Approximately ¼ of the ones included in the study is elementary school educated and about 3/4 is university and post-graduate educated. From here, it can be said that the ones preferring SM restaurants are mostly individuals with higher educational level.
In general, it draws attention that income of 4/5 of consumers, who prefer SM restaurants, is below 2250 TLs. It is seen that the segment of consumers preferring SM restaurants with high
Customer Expectations in Mall Restaurants: A Case Study

53
income level constitute only ¼ of the sample. Looking at the case of age of the ones, who participated in the study, it is understood that about ¾ of consumers preferring SM restaurants constitutes of individuals, who are 30 years old and under. Individuals, who are 41 years old and above, within the sample constitute a quite small mass (8.2%).
The general view of consumers, who prefer inner-SM restaurants, in respect of their demographic characteristics can be summarized as more teenagers, more male, singles, the childless ones and individuals with medium and low income levels and higher education level.
Eating-drinking activity/objective comes first by a wide margin among sample individuals’ reasons for preferring inner-SM restaurants. The highest percentage following this belongs to “post-shopping resting” activity/objective. This result solidifies the idea that inner-SM restaurants are one of the fundamental service units in terms of SMs. From here, it is understood that there should be restaurants with suitable characteristics, sufficient number and capacity in a SM.
Looking at the sample individuals’ frequency of using inner-SM restaurants, it is understood that a considerable part (40.1%) visit these restaurants “once in a month”. About ¼ (24.3%) of the sample comes to these restaurants “once in two weeks”. Consumer mass, who regularly visits inner-SM restaurants, is about 1/5 (18.4%) of all sample. It is understood from this information that 82.8% of sample receives service from inner-SM restaurants once a month at the latest. In the future studies, the relationship between frequency of use and time of stay in restaurant can also be examined.
About 1/5 of the sample (20.3%) spend time “up to 30 minutes” in inner-SM restaurants. This period is as short as “catching breath” or “waiting for someone”. On the other hand, it is understood that about 1/3 of the sample (34.3%) stay in these restaurants about one hour.
This period is seen equivalent to period of eating. Again, it is understood that more than about 2/5 (42.8%) of the sample stays in inner-SM restaurants longer than 2 hours. This long period can be characterized towards the aims of socialization, chat and killing some time.
Relatively “loyal” group of consumers saying that “I generally use the same restaurant all the time” is about 1/3 of the total sample (34.3%). Major part of the sample (65.7%) constitutes the ones who “do not always use the same restaurant”, so to speak “unfaithful” mass. It can be said that inner-SM restaurant consumer mass addressed here generally consist of individuals seeking change.
The most important reason (29.6%) for sample individuals to prefer the current restaurant they are served is “the products being high quality”. The following second most important reason (19.0%) of preference has emerged as “brand familiarity”. If to be paid attention, the concepts of “quality” and “brand” involve meanings that are used interchangeably by consumers and that characterize each other. It comes to mind that almost half (48.6%) of the sample included in the study with this aspect exhibit restaurant selecting behavior with quality perception and concern for prestige.
Murat Ismet Haseki
54
4.2. Kruskal-Wallis H Test Results
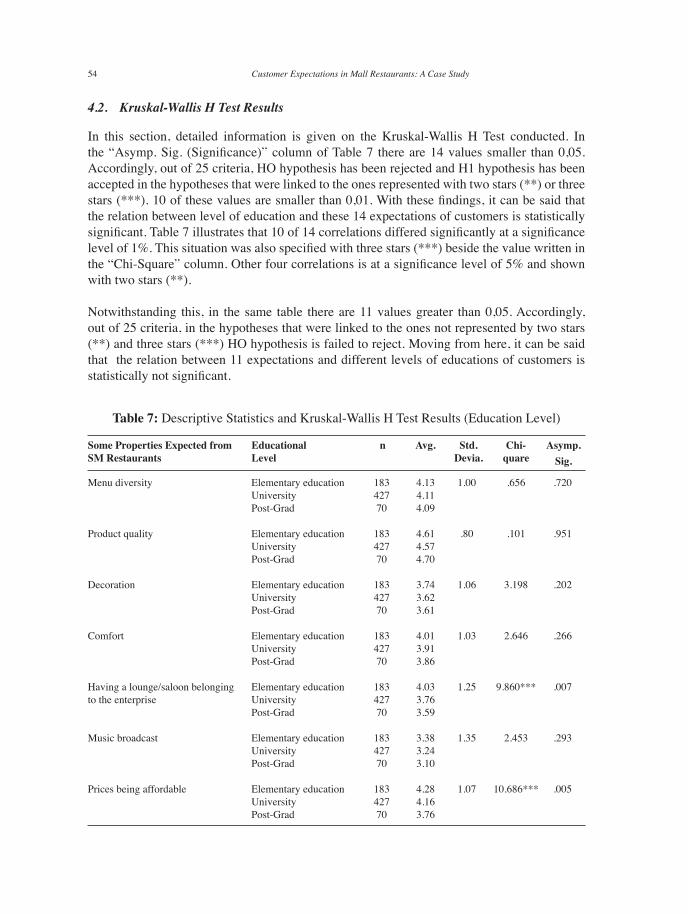
In this section, detailed information is given on the Kruskal-Wallis H Test conducted. In the “Asymp. Sig. (Significance)” column of Table 7 there are 14 values smaller than 0,05. Accordingly, out of 25 criteria, HO hypothesis has been rejected and H1 hypothesis has been accepted in the hypotheses that were linked to the ones represented with two stars (**) or three stars (***). 10 of these values are smaller than 0,01. With these findings, it can be said that the relation between level of education and these 14 expectations of customers is statistically significant. Table 7 illustrates that 10 of 14 correlations differed significantly at a significance level of 1%. This situation was also specified with three stars (***) beside the value written in the “Chi-Square” column. Other four correlations is at a significance level of 5% and shown with two stars (**).
Notwithstanding this, in the same table there are 11 values greater than 0,05. Accordingly, out of 25 criteria, in the hypotheses that were linked to the ones not represented by two stars (**) and three stars (***) HO hypothesis is failed to reject. Moving from here, it can be said that the relation between 11 expectations and different levels of educations of customers is statistically not significant.
Table 7: Descriptive Statistics and Kruskal-Wallis H Test Results (Education Level)
Menu diversity Elementary education 183 4.13 1.00 .656 .720 University 427 4.11 Post-Grad 70 4.09
Product quality Elementary education 183 4.61 .80 .101 .951 University 427 4.57 Post-Grad 70 4.70
Decoration Elementary education 183 3.74 1.06 3.198 .202 University 427 3.62 Post-Grad 70 3.61
Comfort Elementary education 183 4.01 1.03 2.646 .266 University 427 3.91 Post-Grad 70 3.86
Having a lounge/saloon belonging Elementary education 183 4.03 1.25 9.860*** .007to the enterprise University 427 3.76 Post-Grad 70 3.59
Music broadcast Elementary education 183 3.38 1.35 2.453 .293 University 427 3.24 Post-Grad 70 3.10
Prices being affordable Elementary education 183 4.28 1.07 10.686*** .005 University 427 4.16 Post-Grad 70 3.76
Asymp.Sig.
Chi-quare
Std.Devia.
Avg.nEducational Level
Some Properties Expected from SM Restaurants
Customer Expectations in Mall Restaurants: A Case Study

55
Table 7: Descriptive Statistics and Kruskal-Wallis H Test Results (Education Level) (cont)
Asymp.Sig.
Chi-quare
Std.Devia.
Avg.nEducational Level
Some Properties Expected from SM Restaurants
Exhibiting order of food-beverages Elementary education 183 4.10 1.04 8.063** .018 University 427 3.97 Post-Grad 70 3.70
Hygiene Elementary education 183 4.65 .74 1.056 .590 University 427 4.72 Post-Grad 70 4.80
Easy transportation and having car Elementary education 183 4.28 1.13 1.880 .391park facilities University 427 4.09 Post-Grad 70 4.14
Having brand familiarity Elementary education 183 4.17 1.12 8.814** .012 University 427 3.90 Post-Grad 70 3.76
Being crowded Elementary education 183 3.05 1.36 16.274*** .000 University 427 2.58 Post-Grad 70 2.51
Being calm Elementary education 183 3.40 1.35 .388 .824 University 427 3.34 Post-Grad 70 3.29
Teenagers coming Elementary education 183 3.23 1.42 14.850*** .001 University 427 2.85 Post-Grad 70 2.53
Families coming Elementary education 183 3.43 1.37 18.604*** .000 University 427 2.98 Post-Grad 70 2.76
Having entertaining elements Elementary education 183 3.18 1.49 23.827*** .000 University 427 2.55 Post-Grad 70 2.53
Portions being satisfactory Elementary education 183 4.08 1.10 8.288** .016 University 427 3.89 Post-Grad 70 3.70
Food-beverages appealing Elementary education 183 4.27 1.02 20.981*** .000to the eye University 427 4.02 Post-Grad 70 3.70
Having possibility for product Elementary education 183 3.92 1.35 23.679*** .000tasting-trying University 427 3.42 Post-Grad 70 3.27
Giving gifts and giveaways Elementary education 183 3.41 1.49 11.354*** .003 University 427 3.05 Post-Grad 70 2.79
Murat Ismet Haseki

56
According to the result of Kruskal-Wallis H Test, there is a significant relationship at a significance level of 1% between “educational level” and the sample attributes/criteria of “having a lounge/saloon belonging to the enterprise”, “prices being affordable”, “being crowded”, “teenagers coming”, “families coming”, “having entertaining elements”, “food-beverages appealing to the eye”, “having the opportunity for product tasting-trying”, “giving gifts and giveaways” and “paying attention to nutritional values”; there is a significant relationship at a significance level of 5% between “educational level” and the sample attributes/criteria of “the exhibiting order of food-beverages”, “having brand familiarity”, “portions being satisfactory” and lastly “having product promotions”.
It can be said by looking at Table 7 that as educational level increases; price sensitivity, the need for entering into crowd, the need for arrival of families, the need for entertaining elements, the need felt for appealing of food and beverages to the eye, the need for offering opportunity to try or taste products, demand for gifts and giveaways and attention paid to nutritional values, the need for lounge/saloon belonging to the enterprise, sensitivity shown to the exhibiting order of food and beverages, expectation regarding portions being satisfactory and the need towards making product promotions decrease, on the other hand, the value attributed to the brand increases.
Table 7: Descriptive Statistics and Kruskal-Wallis H Test Results (Education Level) (cont)
Asymp.Sig.
Chi-quare
Std.Devia.
Avg.nEducational Level
Some Properties Expected from SM Restaurants
Its service being fast Elementary education 183 4.37 1.03 1.465 .481 University 427 4.21 Post-Grad 70 4.20
Having service to the table Elementary education 183 3.51 1.43 2.020 .364 University 427 3.33 Post-Grad 70 3.29
Having product promotions Elementary education 183 3.78 1.37 6.566** .038 University 427 3.59 Post-Grad 70 3.36
Paying attention to nutritional values Elementary education 183 4.43 1.06 14.971*** .001 University 427 4.22 Post-Grad 70 3.81
Having quality certificates Elementary education 183 4.45 .92 1.453 .484 University 427 4.40 Post-Grad 70 4.40
Notes: “***” denotes 1% significant level (p<0.01)of confidence and “**” denotes 1% significant (p<0.05) level of confidence.
Customer Expectations in Mall Restaurants: A Case Study

57
5. CONCLUDING REMARKS
The objective of this research was to help detect some behaviors of target consumer audiences by looking at some characteristics of consumers coming to inner-SM restaurants towards ensuring inner-SM restaurants to be able to increase their profits by attracting the most suitable and greater number of consumer masses and consumers to spend longer time in SM. In line with this objective, M1 Merkez Adana SM was selected as the implementation area. Individuals between 16-60 years old using inner-SM restaurants were defined as the population. 680 observations suitable for analysis, which are higher than the number of sample estimated as 385, were reached to increase validity and reliability of research.
The current study is a pilot study aimed at putting forward demographic characteristics and some behaviors of consumers coming to mall restaurants. According to Kruskal-Wallis H test results employed in the study, in 14 out of 25 hypotheses constructed HO test has been rejected and it has been observed that between education level of customers and customers’ expectations from in-mall restaurants there is a significant difference. Likewise, according to this analysis 11 out of 25 hypotheses HO hypothesis is failed to reject and it has been seen that there is no significant difference between level of customers and customers’ expectations from in-mall restaurants. The study was carried out in M1 Merkez Adana Shopping Center. This can assist performing a similar study in other shopping centers. Nevertheless, the study results cannot be generalized to a wider scale. With this aspect, it has a geographic constraint. The study is a cross-sectional study conducted at the beginning of 2009. In case of conducting the same study in different periods, different results might be obtained. Using a non-random sampling method in the study is also another constraint of the study. Even though the stages of survey development, sampling and data collection were treated considerably sensitively, it seems possible to reach different results in case of conducting study by using one of random sampling methods. Based on the requirement for narrowing the topic in the study, it was not possible to be able to analyze all of the data obtained in detail in this study. In the subsequent studies to be performed in this field, it seems possible to perform analyzes in different ways by also benefiting this study’s outcomes and reaching richer results.
From managerial (operations, management and policy development) point of view this study has been conducted to research on customers’ expectations from restaurants. The study is particularly on customers’ expectations from in-mall restaurants. However, the results can be assessed as valuable guide for other restaurant businesses. The study results have been giving important information about age, family, income, education level, visit frequency, spending interval etc. for restaurant operators and managers. The study also provides insights about such customer expectations in the restaurants as menu, quality, decoration, comfort, music, hygiene, brand recognition, target audience, entertainment, promotions etc. and their grades. In the advanced analysis where education level was the determining variable, the change of customer expectations from in- mall restaurants with respect to their level of education has been clearly captured. According to these results, by looking at education level of target audience in-mall restaurants owners / managers will be able to do market segmentation and determination of target audience.
Murat Ismet Haseki

58
REFERENCES
Alkibay, S., Tuncer, D., & Hosgor, S. (2007). Shopping Centers and Management. Adana, Turkey: Siyasal Bookstore.
Anderson, R. E. (1973). Customer dissatisfaction: The effect of disconfirmed expectancy on perceived product performance. Journal of Marketing Research, 10, 38-44.
Balsari, Z. (2005). Dynamic Spaces of Everyday Life Shopping Malls. TSKB Yayınları. Retrieved August 10, 2010, from http://www.tskb.com.tr/TSKBgayrimenkul/english/market/TSKB_SHOPPING_MALLS.pdf
Beddington, N. (1982). Design for Shopping Centers. Butterworth Scientific.
Borgers, A., Brouwer, M., Kunen, T., Jessurun, J., & Janssen, I. (2010). A virtual reality tool to measure shoppers’ tenant mix preferences. Computers, Environment and Urban Systems, 34, 377-388.
Boulding, W., Karla, A., Staelin, R., & Zeithaml, V. A. (1993). A Dynamic Process Model of Service Quality: From Expectations to Behavioral Intentions. Journal of Marketing Research, 30, 7-27.
Chebat, J. C., Sirgy, M. J. & Grzeskowiak, S. (2010). How can shopping mall management best capture mall image? Journal of Business Research, 63, 735–740.
Close, A. G., Finney, R. Z., Lacey, R. Z., & Sneath, J. Z. (2006). Engaging the customer through event marketing: Linking attendees with the sponsor, community, and brand. Journal of Advertising Research, December, 420-433.
Erkip, F. (2003). The shopping mall as an emergent public space in Turkey. Environment and Planning A, 35, 1073-1093.
Erkip, F. (2005). The rise of the shopping mall in Turkey: the use and appeal of a mall in Ankara. Cities, 22(2), 89-108.
Geuens, M., Vantomme, D., & Brengman, M. (2004). Developing a typology of airport shoppers. Tourism Management, 25, 615-622.
Heitzler, C. D., Asbury, L. D., & Kusner, S. L. (2008). Bringing “play” to life: The use of experiential marketing in the VERB™ campaign. American Journal of Preventive Medicine, 34(6), 188-193.
Hong Kong Association for Customer Service Excellence (HKACSE) (2001). A Practical Guide to Delivering Excellent Customer Service, Project Report.
Customer Expectations in Mall Restaurants: A Case Study

59
Kaltcheva, V. D., Patino, A., & Chebat, J. C. (2011). Impact of retail environment extraordinariness on customer self-concept. Journal of Business Research, 64, 551-557.
Levy, M., & Weitz, B. A. (2004). Retailing Management. (5th Edition). Boston: Mc Graw Hill/Irwin.
Lim, J., & Beatty, S. E. (2011). Factors affecting couples’ decisions to jointly shop. Journal of Business Research, 64(7), 774-781.
Michon, R., & Chebat, J. C. (2004). Cross-cultural mall shopping values and habitats: A comparison between English -and French- speaking Canadians. Journal of Business Research, 57, 883-892.
Mitra, D., & Fay, S. (2010). Managing service expectations in online markets: A signaling theory of e-tailer pricing and empirical tests. Journal of Retailing, 86(2), 184-199.
Mitra, D., & Golder, P. N. (2006). How does objective quality affect perceived quality? Short-term effects, long-term effects, and asymmetries. Marketing Science, 25(3), 230-247.
Oliver, R. L., & Winer, R. S. (1987). A framework for the formation and structure of customer expectations: Review and propositions. Journal of Economic Psychology, 8(4), 469-499.
Omar, U. S. U. (2007). Shopping center trends in South East Asia: Bigger and better is the order of the day. Research Review, 14(3), 30-33.
Parasuraman, A., Berry, L. L., & Zeithaml, V. A. (1991). Understanding customer expectations of service. Sloan Management Review, Spring, 39-48.
Parasuraman, A., Zeithaml, V. A., & Berry, L. (1985). A conceptual model of service quality and implications for future research. Journal of Marketing, 64(Spring), 12-40.
Pride, W. M., & Ferrel, O. C. (1983). Marketing Basic Concepts and Decisions. Boston: Houghton Mifflin Company.
Schmitt, B. (1999). Experiential Marketing. Journal of Marketing Management, 15, 53-67.
Sheth, J. N. & Mittal, B. (1996). A framework for managing customer expectations. Journal of Market Focused Management, 1, 137-158.
Sit, J., Merrilees, B., & Birch, D. (2003). Entertainment-seeking shopping center patrons: the missing segments. International Journal of Retail & Distribution Management, 31(2), 83-92.
Murat Ismet Haseki
60
Suh, E., & West, J. J. (2010). Estimating the impact of entertainment on the restaurant revenues of a Las Vegas hotel casino: An exploratory study. International Journal of Hospitality Management, 29, 570-575.
Tabak, B. I., Ozgen, O. & Akyol, B. (2006). High school girls’ shopping mall experiences, perceptions and expectations: A qualitative study. Journal of Ege Academic View, 6(1), 100-113 (in Turkish).
Tokatli, N., & Boyaci, Y. (1998). The changing retail industry and retail landscapes: The case of post-1980 Turkey. Cities, 15(5), 345-359.
Yildirim, A., & Simsek, H. (2005). Qualitative research methods in social sciences (5th Edition), Ankara: Seckin Publications (in Turkish).
Yukselen, C. (2009). Marketing Research (4th Edition). Ankara: Detay Publications (in Turkish).
Customer Expectations in Mall Restaurants: A Case Study