customer loyalty and lifetime value: an empirical
TRANSCRIPT
Cleveland State University Cleveland State University
EngagedScholarship@CSU EngagedScholarship@CSU
Marketing Browse Business Faculty Books and Publications by Topic
Spring 2010
Customer Loyalty and Lifetime Value: An Empirical Investigation Customer Loyalty and Lifetime Value: An Empirical Investigation
of Consumer Packaged Goods of Consumer Packaged Goods
Jason Q. Zhang Loyola University, Maryland, [email protected]
Ashutosh Dixit Cleveland State University, [email protected]
Roberto Friedmann University of Georgia, [email protected]
Follow this and additional works at: https://engagedscholarship.csuohio.edu/busmarkt_facpub
Part of the Behavioral Economics Commons, and the Marketing Commons
How does access to this work benefit you? Let us know! How does access to this work benefit you? Let us know!
Publisher's Statement (c) 2010 M. E. Sharpe (www.mesharpe.com)
Original Citation Original Citation Zhang, J. Q., Dixit, A. A., & Friedmann, R. R. (2010). Customer Loyalty and Lifetime Value: An Empirical Investigation of Consumer Packaged Goods. Journal Of Marketing Theory And Practice, 18(2), 127-140.
Repository Citation Zhang, Jason Q.; Dixit, Ashutosh; and Friedmann, Roberto, "Customer Loyalty and Lifetime Value: An Empirical Investigation of Consumer Packaged Goods" (2010). Marketing. 53. https://engagedscholarship.csuohio.edu/busmarkt_facpub/53
This Article is brought to you for free and open access by the Browse Business Faculty Books and Publications by Topic at EngagedScholarship@CSU. It has been accepted for inclusion in Marketing by an authorized administrator of EngagedScholarship@CSU. For more information, please contact [email protected].

CUSTOMER LOYALTY AND LIFETIME VALUE: AN EMPIRICAL INVESTIGATION OF CONSUMER PACKAGED GOODS
Jason Q. Zhang, University of Georgia
Ashutosh Dixit, Georgia Institute of Technology Roberto Friedmann, University of Kansas
This article was originally published in: Zhang, Jason Q., Ashutosh Dixit and Roberto Friedmann (2010). Customer Loyalty and Lifetime Value: An Empirical Investigation of Consumer Packaged Goods. Journal of Marketing Theory Practice, 18(2), 127-139. Post-print standardized by MSL Academic Endeavors, the imprint of the Michael Schwartz Library at Cleveland State University, 2013

In marketing, the notion that winning customer loyalty is critical for a firm’s long-term profitability appears to be widely accepted (Agustin and Singh 2005; Fornell et al. 1996). This received view is supported by the empirical evi-dence that small changes in customer loyalty and retention can yield substantial changes in profitability (Reichheld and Teal 1996; Reichheld, Markey, and Hopton 2000). For example, Reichheld and Teal (1996) attribute the increased profits from loyal customers to the price premiums paid, greater amounts of product/service consumed, and added profits from referrals. In spite of the wide acceptance of the importance of customer loyalty, recent research, however, finds rather contradictory results. For example, Reinartz and Kumar (2000; 2002; 2003) demonstrate that customer loy-alty may have no positive effect on customer profitability. Similarly, Gupta and Lehmann (2005) point out that many firms spend enormous amounts of money to foster customer loyalty with little tangible results. Thus, researchers have called for more in-depth analysis to “expose the myths of customer loyalty” (Keiningham et al. 2005, p. 15) and to relate investment in loyalty-building efforts directly to profitability metrics (Peppers and Rogers 2004).
In today’s competitive environment, marketers face increasing pressure to make marketing activities more accountable (Rust et al. 2004). Recent research on cus-
tomer lifetime value (CLV) offers a useful framework that explicitly relates marketing actions to financial metrics. The CLV framework measures how changes in customer behavior (e.g., increased purchase, retention) could influ-ence customers’ future profits, or their profitability to the firm. The CLVs of all the current and potential customers form a firm’s customer equity (e.g., Rust, Lemon, and Zeithaml 2004; Villanueva, Yoo, and Hanssens 2008), which has been found to be a good proxy measure of the firm’s equity-market valuation (Gupta, Lehmann, and Stuart 2004). Thus, the CLV framework helps bridge marketing and finance metrics.
In light of the ambivalent findings on the effects of customer loyalty and the recent development of the CLV framework, the main objective of our study is to empiri-cally examine the relationship between customer loyalty and lifetime value. Specifically, we seek to answer a simple but relevant question: Is customer loyalty a good predictor of customer profitability? Linking customer loyalty to CLV aims to examine the financial implications of customer loy-alty in a different light and to promote the accountability of marketing management.
We develop an analytical framework in order to answer our research question. With household purchase data of consumer packaged goods, we find that customer loyalty and CLV are indeed positively correlated. More specifically, customer loyalty drives (1) customer revenue (i.e., the rev-enue that a customer brings to the firm during a defined period) and (2) customer retention (i.e., the probability that a customer continues buying in the next period of time), both of which, in turn, lead to increased CLV.
Jason Q. Zhang (Ph.D., University of Georgia), Assistant Professor of Marketing, Sellinger School of Business & Management, Loyola University Maryland, Baltimore, MD, [email protected].
Ashutosh Dixit (Ph.D., Georgia Institute of Technology), Associate Professor of Marketing, College of Business Administration, Cleve-land State University, Cleveland, OH, [email protected].
Roberto Friedmann (Ph.D., University of Kansas), Associate Professor of Marketing, Terry College of Business, University of Georgia, Athens, GA, [email protected].
The authors thank Rich Fox, Tom Leigh, and George Zinkhan for their comments on earlier drafts of this paper.
CustomeR LoyALty AnD LiFetime VALue: An empiRiCAL inVestigAtion oF ConsumeR pACkAgeD gooDs
Jason Q. Zhang, Ashutosh Dixit, and Roberto Friedmann
It is traditionally accepted that customer loyalty is critical for a firm’s profitability. Recent research, however, questions the effects of customer loyalty on profitability. In light of this controversy, we exam-ine the financial effects of customer loyalty using the framework of customer lifetime value (CLV). Our analysis reveals that in the area of consumer packaged goods, customer loyalty is positively associated with customer revenue and customer retention, both of which drive CLV. Thus, customer loyalty is indeed a predictor of long-term customer profitability to a firm. For marketers, customer loyalty continues to be a legitimate end goal to pursue in marketing management.
128
These findings are important to marketing managers. Our analysis reveals that, in the area of consumer pack-aged goods, customer loyalty, as a widely used marketing productivity metric, is a justifiable goal to pursue in the marketplace. Marketers in this area should be confident about their investment in building customer loyalty. As the next step toward more accountable marketing management, the proposed CLV framework allows marketing managers to quantify the financial returns of loyalty programs, which is essential to firm bottom line.
Our study represents a meaningful addition to the litera-ture. It has been noted by Jain and Singh that “empirical evidence is particularly scarce in the CLV domain” (2002, p. 36). Our empirical analysis adds to the growing litera-ture of CLV. Also, prior research that examines customer profitability often stays at the aggregate/business level (e.g., Anderson, Fornell, and Lehmann 1994; Anderson, Fornell, and Rust 1997; Bernhardt, Donthu, and Kennett 2000). Using the framework of CLV, we are able to examine the financial effects of customer loyalty at the customer level. This micro-level analysis provides better insights with to-day’s customer-centric approach, which views customers as assets and retained customers as sustained competi-tive advantages (Thomas 2001). Furthermore, within our analytical framework, we discuss alternative models to calibrate CLV. The results on model comparison advance our knowledge of selecting models that are appropriate to research contexts.
ConCeptuAL bACkgRounD
Customer Loyalty
Although there is no universally accepted definition of customer loyalty (Dick and Basu 1994; Oliver 1999), prior research often expresses loyalty as an attitudinal or behav-ioral commitment to the brand. The attitudinal approach argues that true loyalty exists when there exist favorable beliefs toward the brand (e.g., Agustin and Singh 2005; Carrillat, Jaramillo, and Mulki 2009; Jacoby and Kyner 1978; Johnson, Herrmann, and Huber 2006). For example, Oliver defines loyalty as “a deeply held commitment to rebuy or repatronize a preferred product/service” (1997, p. 392). The attitudinal approach is conceptually rich, but it is rather dif-ficult for researchers to collect large-scale attitudinal data. Consequently, in empirical research, attitudinal loyalty is not as widely used as behavioral loyalty (Uncles, Dowling, and Hammond 2003).
The behavioral approach views loyalty as expressed behavior, and usually defines loyalty as a customer’s pro-
pensity to buy a brand with reference to the pattern of past purchases (e.g., Russell and Kamakura 1994; Sivakumar 1994; Tellis 1988). Within consumer packaged goods, be-havioral loyalty is well understood and is often pursued by marketing managers. Research has suggested that, for low-risk, frequently purchased products, customer loyalty may be the joint outcome of habit and attitude (Chaudhuri 1999). The process is usually explained as follows. Con-sumers first choose a brand that may offer a satisfactory experience. If satisfied, they may keep buying the brand. Repeat satisfaction from the brand, in turn, leads to weak attitudinal commitment. Customers’ repeat purchases are not necessarily because of strong attitudinal commitment, but because it is not worth time evaluating alternatives (Ehrenberg, Barnard, and Scriven 1997; Ehrenberg, Uncles, and Goodhardt 2004). Such inertia or habitual buying is an important component of consumer behavior in the area of consumer packaged goods (O’Shaughnessy 1987).
In this study, we define customer loyalty as a customer’s likelihood to choose a particular brand with reference to his or her past purchases. This behavioral definition of loyalty captures the outcomes of both attitudinal commitment and habitual buying. Many prior studies that involve panel data use similar definitions (e.g., Fader and Hardie 1996; Swaminathan, Fox, and Reddy 2001). Also, we use the term customer loyalty as opposed to brand loyalty to emphasize that loyalty is a characteristic of customers, rather than characteristics inherent in brands. Later in the paper, we split customers in our data into loyal versus less loyal groups in order to demonstrate their differences. In this context, the term loyal customers refers to customers who are more loyal than the population median or mean.
Customer Lifetime Value
Customer lifetime value is generally defined as the pres-ent value of future profits of a customer over his or her life of the relationship with a firm/brand (e.g., Gupta, Lehmann, and Stuart 2004; Jain and Singh 2002; Reinartz and Kumar 2000; Rust, Lemon, and Zeithaml 2004). As a marketing productivity metric, CLV has been gaining significance for several reasons. First, researchers have noted that many traditional marketing metrics, such as brand awareness/attitude and market share, are not suf-ficient to evaluate returns on marketing investment (Rust et al. 2004; Srivastava, Shervani, and Fahey 1998). But CLV makes it possible to explicitly link long-term financial returns to marketing actions. Second, recent research has shown that customers are not equally profitable (Reinartz and Kumar 2000; 2003). It is meaningful for managers to
CUSTOMER LOYALTY AND LIFETIME VALUE
129
understand customer value at the individual level and to allocate resources accordingly.
The idea of CLV is derived from the net present value (NPV) analysis—the NPV of a financial asset is the sum of discounted future cash flows that are generated from the asset. Similarly, CLV is the NPV of a customer’s future profits. One common approach is to assume that we know the duration of a customer’s lifetime, and then calculate a discounted cash flow for that time period (Berger and Nasr 1998; Blattberg and Deighton 1996; Jain and Singh 2002). Formally, CLV can be expressed as
CLV =+( )=
∑m
it
tt
n
10.
(1)
where mt is the gross margin for a customer in a defined
time period t (e.g., a year), i is the discount rate to account for money’s time value, and n is the number of time peri-ods during which the customer is active. This formulation assumes that a customer will remain active in the business relationship with certainty. In reality, however, a customer always has a probability to leave the business. Therefore, research has suggested adding customer retention rate (i.e., the probability that a customer remains in the business) into CLV calculation (e.g., Dwyer 1997; Gupta and Lehmann 2005; Lewis 2004; Pfeifer and Carraway 2000). Formally, with retention rate r, CLV can be expressed as
CLV =+( )=
∑m r
it t
tt
n
10.
(2)
The above formulation requires margin and retention estimates for each time period, which is data intensive. Thus, research has suggested using constant margins and retention rates to simplify the calculation (e.g., Blattberg, Getz, and Thomas 2001; Reinartz and Kumar 2000). Specifi-cally, Gupta and Lehmann (2003; 2005) have shown that if margins (m) and retention rates (r) remain constant over time and the time horizon is assumed to be infinite, for-mulation (2) can be greatly simplified to formulation (3), as shown below. They argue that instead of arbitrarily specifying how long a customer will stay with a firm/brand, the retention rate automatically accounts for the reduced likelihood that a customer remains in the business relation-ship. For example, if the retention rate is 80 percent, after 20 years, the likelihood that a customer stays active is only (0.8)20 = 0.01. Therefore, using an infinite time horizon is a reasonable representation of the reality, but greatly re-duces the complexity of CLV calculation. This simplified formulation has been widely adopted by academicians and practitioners (Ofek 2002):
CLV =+ −( )mr
i r1.
(3)
In our empirical analysis, we primarily use formula-tion (3) to calibrate CLV, but also present results from other formulations of CLV. The overarching goals of our empirical analysis are (1) to develop an analytical framework in order to calibrate CLV, (2) to examine the effects of customer loy-alty on CLV using data of consumer packaged goods, and (3) to discuss alternative models that are most appropriate for specific research contexts.
empiRiCAL AnALysis
The key components in calculating CLV are customer-level gross margins (m) and retention rates (r). Prior research either builds separate models for different components of CLV (e.g., Fader, Hardie, and Lee 2005; Reinartz and Kumar 2000) or sometimes combines various components in one model (e.g., Reinartz, Thomas, and Kumar 2005; Thomas 2001). In the present study, we use separate models to es-timate gross margins and retention rates. In the following sections, we first describe our data and then describe our models in detail.
Data
The data used for this study are panel data containing household purchase histories of one category of consumer packaged goods (personal care products). The data are provided by A.C. Nielsen Inc. The specific category name and brand names, however, are coded and concealed by the company. Our data set covers all the brands within the product category and contains all the same-category transac-tions made by panel households during a two-year period. Three categories of variables are available: purchase char-acteristics (e.g., purchase date), marketing activities (e.g., brand ads), and household demographics (e.g., household size). We choose to focus on brand H, the largest brand in market share, to conduct our analysis. The choice of the largest brand offers us a large sample size. It is important to note that our data are only available at the household level. In this paper, we view a household as a customer, and thus use “customers” and “households” interchangeably.
Before engaging in model development, we first qualify households in the data. Households join and leave the re-search panel freely. To guarantee the consistency of panel participation, households that do not make any purchases in the product category during the first and last three months of the time period are excluded. This decision is made based
CUSTOMER LOYALTY AND LIFETIME VALUE

130
on the fact that the median interpurchase time in the sample is 1.6 month. Therefore, it is appropriate to assume a house-hold was not consistently “active” in the research panel (i.e., either joined the panel late or left the panel early) if the household did not make any purchases in the category during these two three-month periods. Our qualification of a “static” panel is consistent with prior research using data in the similar format (e.g., Swaminathan, Fox, and Reddy 2001). The resulting data set include 2,220 households and over 20,000 category purchases. The descriptive information of the data set is reported in Table 1.
gross margin
In order to calibrate CLV, we first describe how we estimate customer gross margin (m in the CLV formulations). In ac-counting terms, gross margin is defined as revenue minus the cost of goods sold (i.e., material, labor, and factory overhead). In the context of CLV, customer gross margin is usually estimated by multiplying the amount of money a customer brings to the firm/brand (i.e., customer revenue) with the gross margin rate (e.g., Reinartz and Kumar 2000). For example, if the gross margin rate is 20 percent for a brand, for every dollar in revenue, the gross margin is $0.20 to the brand. Formally, customer gross margin is calculated in formula (4). When a consumer uses coupons to receive discounts, the coupon value influences profit. We account for coupon usage later in estimating purchase value, but in our sample, the effect of coupon usage is rather small (about 1 percent of paid prices).
Customer Gross Margin = Customer Revenue × Gross Margin Rate.
(4)
Without the information of brand H’s gross margin rate, we substitute this rate with the industry gross margin rate in our analysis. Marketers with better access to accounting information can easily replace our estimate with a more accurate one. But the analytical framework we develop
to calibrate CLV would remain the same. According to the financial reports from Compustat, the ten largest compa-nies in the consumer packaged goods industry (by revenue) enjoyed an average gross margin rate of 39.3 percent over the past five years. We use this rate to approximate the gross margin rate of brand H.
In order to estimate customer revenue to brand H in formula (4), we estimate (1) how many times a customer would purchase brand H in a specified time period (i.e., the number of brand purchases) and (2) how much money the customer would spend in each purchase occasion (i.e., the purchase value). We then multiply (1) the number of brand purchases by (2) the purchase value in order to derive the customer revenue to brand H. It is important to note that the purchase value is not brand H’s price. In consumer packaged goods, price may vary greatly by package size. In addition, a consumer may choose to buy several packages of the same product in one purchase occasion. The purchase value is the total dollar amount that a customer spends on brand H in a purchase occasion (e.g., one grocery trip) regardless of the package size or the number of packages. Formally, customer revenue is calculated as
Customer Revenue = Number of Brand Purchases × Purchase Value.
(5)
Several prior studies propose similar multistaged ap-proaches to calculate customer revenue (i.e., number of transactions × transaction value), but specific models developed vary by research contexts (e.g., Colombo and Jiang 1999; Fader, Hardie, and Lee 2005; Gupta, Lehmann, and Stuart 2004; Reinartz and Kumar 2000; Schmittlein and Peterson 1994). In the present study, we use a negative binomial regression (NBR) model to capture the number of brand purchases and the monetary value model by Schmittlein and Peterson (1994) to capture the purchase value. These models are presented next.
the number of brand purchases
A critical component to calibrate CLV is to estimate the number of brand purchases in a given time period. Many prior studies in noncontractual contexts (i.e., consumer buying without the binding of contracts) use Poisson distribution to capture consumer purchases. For example, studies use Poisson distribution to model buying behavior of consumer packaged goods (e.g., Morrison 1969; Morrison and Schmittlein 1981), catalog merchandise (e.g., Reinartz and Kumar 2003), and music CDs (e.g., Fader, Hardie, and Lee 2005). Poisson distribution is appropriate in this context because the occurrences of consumer purchase are discrete
Table 1Data Description
Product Category Personal careTotal Number of Purchases 21,722Number of Qualified Households 2,220Median Interpurchase Time (weeks) 6.5Median number of purchases 16Mean number of purchases 19Standard Deviation of Number of Purchases 12Brand H Market Share (percent) 25
CUSTOMER LOYALTY AND LIFETIME VALUE

131
and tend to come at a random pace. For contractual pur-chases (e.g., cable television service) that occur at regular time intervals, the Poisson assumption is inappropriate (Bell et al. 2002; Mulhern 1999).
In this study, we assume that household i made X brand H purchases during a one-year period. X is further assumed to follow a Poisson distribution with a mean purchase rate of l
i , which varies across households to account for household
heterogeneity. The purchase rate (li ) can be determined by
a set of explanatory variables in an NBR model (introduced by Cameron and Trivedi 1998). Formally, we propose that the number of brand H purchases in the specified time period is determined by marketing activities (e.g., ads), customer loyalty, and customer characteristics (e.g., household size). Mathematically, this relationship is expressed as
λ β β ββ β
i i i
i
Price Share of Ads
Share of Displays
= + +(+ +
exp 0 1 2
3 44
5
6
Loyalty
Household Size
Household Income
i
i
i i
+
+ ) ( )β
β εexp ..
(6)
Brand H’s Price (Price). Brand H’s price is calculated by dividing the total dollar amount that a household spent on brand H during the specified period of time by the total units of brand H that the household bought. This measure is the unit price of brand H for each household. The unit price is calculated because H could be purchased in differ-ent package sizes.
Brand H’s Share of Advertisements in the Category (Share of Ads). A.C. Nielsen field employees audit stores on a regular basis to collect information on in-store marketing programs. These auditors record the presence of all feature ads in a product category through handheld scanners. In order to calculate the share of brand H ads, we divide the number of brand H ads by the total number of category ads that a household was exposed to during the specified time period. This measure is, in effect, the share of marketing voices/efforts, and captures the competitive effects of marketing programs.
Brand H’s Share of Displays in the Category (Share of Dis-plays). This measure is defined similarly as the previous variable. It is calculated by the number of brand H displays by the total number of category displays that a household was exposed to.
Customer Loyalty (Loyalty). The loyalty of a household is calculated by dividing the number of brand H purchases by the total number of category purchases made by a household. This variable is a share-of-category measure and captures a household’s likelihood to choose brand H in a category purchase occasion. In model (6), we include the
lag year loyalty. That is, Loyalty is based on a household’s purchase history in the previous year.
Household Size (Household Size) and Household Income (Household Income). These two variables account for the number of members and the total income (in thousands) of a household.
ei is the error term. exp(e
i ) is assumed to follow a gamma
distribution in NBR specification (Cameron and Trivedi 1998).
The results of the NBR model are summarized in Table 2. According to this table, we find that, all else being equal, price increases would drive down the number of brand purchases, whereas raising the share of marketing ac-tivities (e.g., feature ads or aisle displays) would increase the number of brand purchases. These results reflect the fundamental nature of category competition within con-sumer packaged goods. We also find that brand purchases are positively related to household size and income. After controlling the effects of these variables, customer loyalty is a strong predictor of the number of brand purchases. It is important to note that the goal of this modeling exercise is not to test the positive relationship between customer loyalty and the number of brand purchases. Given the definition of customer loyalty, such a relationship is rather intuitive. Instead, model (6) aims to quantify the effect of customer loyalty on brand purchases. This model helps predict the number of brand H purchases in the future. Estimating the number of brand purchases is only the
Table 2NBR Model Estimates
Dependent Variable: The Number of Brand Purchases
ModelIndependent Variables Estimate p-Value
Intercept 0.46 < 0.001 (0.05)Price –0.13 < 0.001 (0.02)Share of Ads 0.28 < 0.001 (0.04)Share of Displays 0.30 < 0.001 (0.05)Loyalty 2.35 < 0.001 (0.05)Household Size 0.09 < 0.001 (0.01)Household Income 0.16 0.001 (0.01)
Note: The standard errors of estimates are reported in parentheses.
CUSTOMER LOYALTY AND LIFETIME VALUE
132
intermediate step to calibrate CLV. In the next section, we present our model to capture purchase value, as described in formula (5).
purchase Value
We adopt the model introduced by Schmittlein and Peterson (1994) in order to estimate the purchase value (i.e., the dol-lar value of a brand purchase occasion). Assume that house-hold i made X purchases within the specified time period. Let Z
i denote the value of the ith purchase (i = 1, ..., X) after
coupons (if any). q denotes the mean purchase value for household i. Our objective is to find the expected value of q for a household given this household’s past purchase his-tory (i.e., Expected [q|Z1, ..., ZX
]). Schmittlein and Peterson (1994) show that when X = 1, the best estimator of q is the conditional expectation given by formula (7). When X > 1, the conditional expectation is given by formula (8):
Expected Z Z Expectedθ ρ ρ θ1 1 1 11 = + −( ) [ ]
(7)
Expected Z ZX
XZ
X
XA
A W
W
A W
θσ
σ σ
σσ σ
1
2
2 2
2
2 2
,..., =+
++
[ ]Expected θ ,
(8)
where r1 is reliability coefficient and is defined as r1 = s
A2/(s
A2 + s
W2). s
W2 is the variance of Z
i , and s
A2 is the
variance of q across households. Expected[q] is the mean purchase value across households, Z | = (1/X)SX
i=1Zi . See
Schmittlein (1989) and Schmittlein and Peterson (1994) for more technical details.
The key rationale of this model is that the average value of past purchases (Z|) is not always a reliable estimate for future purchase value (q). A more reliable estimate is the weighted average of a household’s average purchase value (Z|) and the mean purchase value across households (Expected[q]), as suggested by formula (8). When a household has limited purchase history, the method by Schmittlein and Peterson (1994) is particularly meaningful because it is more likely to produce a stable estimate for purchase value.
After purchase value is estimated, we multiply the number of brand purchases by purchase value to calculate customer revenue, as described in formula (5). Then, we multiply customer revenue by the gross margin rate (39.3 percent) in order to derive customer gross margin (i.e., m in CLV formulations), as described in formula (4). Finally, in order to calibrate CLV, we need to estimate the retention rate (r) to account for customer defection. We describe the retention model next.
Retention Rate
Customer retention (r) is the probability of a customer being active in a business relationship. In a contractual setting (e.g., cable service subscription), customers notify the firm when they leave the business. In a noncontractual setting (e.g., buying consumer packaged goods), however, marketers need to infer whether a customer is still active. In practice, companies could identify an active customer using simple rules. For example, in reporting the number of active users, eBay defines active users as those who bought, bid, or listed items within the past 12 months. In academic literature, many probability models are developed to esti-mate the retention rate. For example, Gonul, Kim, and Shi (2000), Lewis (2004), and Venkatesan and Kumar (2004) use hazard models to predict the probability of customer defection. Neslin et al. (2006) summarize over 40 models developed during a model-building competition to un-derstand customer defection. Most of these models use the logit approach in that customer retention is a binary outcome (i.e., will a customer remain active in the next time period?).
In our study, we first define “inactive” households and then estimate retention rates using a binary logit model. Our data cover the time horizon of two years. If a household made at least one brand H purchase in the first year but did not make any brand H purchases in the second year, we consider this household inactive in the second year. The retention dummy variable for this household turns to “0.” Using a logistical regression, we model household retention rate (i.e., the likelihood of a household staying active in the second year) as the outcome of customer loyalty in the first year. Formally, our retention model is expressed as
ln ,P active
P activeLoyalty
( )− ( )
= +
1 0 1α α
(9)
where P(active) denotes the probability that a consumer remains active in the second year; Loyalty is the customer loyalty in the first year, and is defined earlier in the NBR model; α0 denotes the intercept; and α1 is the parameter to be estimated.
The results of model (9) are summarized in Table 3. Ac-cording to these results, loyalty has a substantial positive effect on a household’s retention rate. As loyalty increases, the likelihood that a household remains active in the next time period also increases. The mean retention rate in our data is 80.45 percent, indicating that, on average, a house-hold has an 80.45 percent probability to be active in the next year. We also find a small positive intercept in the model. This estimate can be understood as the inertia of a
CUSTOMER LOYALTY AND LIFETIME VALUE

133
household (e.g., O’Shaughnessy 1987). That is, once a house-hold starts buying brand H, the household has a probability to continue buying the brand regardless of loyalty status. With estimated retention rate for each household, we then calibrate CLV. The results of CLV are discussed next.
Results of Analysis
In the sections above, we estimate customer-level gross margins (m) and retention rates (r). More specifically, we derive customer gross margin through customer revenue. Customer revenue is further estimated by a customer’s number of purchases times purchase value. With these estimates, CLV can be calculated. But the value of CLV depends on the length of time horizon. Intuitively, the longer period of time that is projected into the future, the greater the lifetime value.
Prior research has suggested that marketing managers could arbitrarily determine the length of time period based on the horizon of their business planning (e.g., how long can a firm afford to wait?) or the competitive nature of their industry (e.g., how long are customers likely to stay with a firm?) (Hughes 2000). Gupta and Lehmann (2003; 2005) suggest an alternative approach with an infinite time horizon. They argue that the retention rate accounts for the diminishing likelihood that a customer stays with a firm. We present the values of CLV for various time periods as well as for an infinite time horizon. The focus of our analysis, however, is the relationship between customer loyalty and CLV, which should exhibit consistent patterns across vari-ous time horizons.
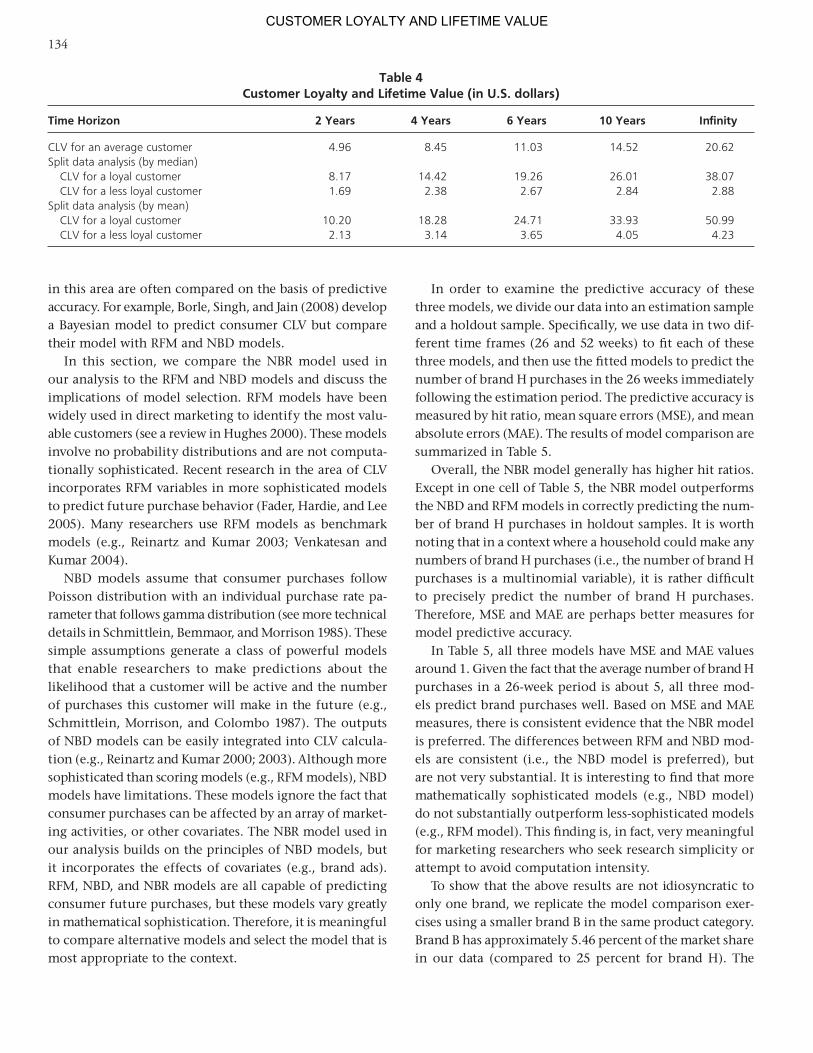
According to Tables 2 and 3, customer loyalty is posi-tively associated with both customer gross margin (through revenue) and retention rate, both of which drive CLV. Con-sequently, the lifetime values of loyal customers are much greater than those of less loyal customers. In order to show the differences between loyal and less loyal customers, we conduct a split sample analysis, in which a customer whose loyalty is greater (or lesser) than the median of the population is labeled as a loyal (or less loyal) customer. In this analysis, the CLV is $38.07 for a loyal customer with an infinite time horizon and is $2.88 for a less loyal customer. The difference is over 10 times. The increased CLV for a loyal customer is the joint result of increased yearly gross margin ($5.03 versus $1.65) and increased yearly reten-tion rate (92 percent versus 68 percent). These results are consistent across various time horizons used in our analysis (e.g., CLV = $8.17 versus $1.67 using a two-year horizon). In addition, these results are consistent if the population mean is used to split customers into the loyal versus less
loyal group (CLV = $50.99 versus $4.23 using an infinite time horizon). The above results are reported in Table 4.
These findings have significant implications. In market-ing literature, there has been an ongoing debate on the effects of customer loyalty on profitability. For example, Reichheld and Sasser (1990) find that a 5 percent increase in customer retention could bring substantially increased firm profitability (from 25 percent to 85 percent across industries). Based on these findings, Reichheld and Teal (1996) argue that customer retention is the most crucial component that influences customer profitability. Reinartz and Kumar (2000; 2002), however, question the above con-clusion. Their studies find that retention does not matter much; instead, “it is the revenue that drives the lifetime of value of a customer” (Reinartz and Kumar 2000, p. 32). Our findings suggest that, in consumer packaged goods, both customer retention and revenue matter. Our analyses reveal that increased customer loyalty drives both customer revenue and retention, which, in turn, lead to increased CLV. Therefore, customer loyalty may continue to be a legitimate end goal to pursue in marketing management, and customer loyalty should remain as an important metric of marketing productivity.
Alternative models and model Comparison
In the CLV literature, numerous models have been used to estimate customer revenue. Most of these models can be broadly classified into (1) scoring models, (2) probability models, and (3) econometric models. Scoring models create simple scores based on consumers’ purchase characteristics (e.g., the recency, frequency, and monetary value model, or RFM model). Probability models view consumer behavior as the expression of an underlying stochastic process that is determined by individual characteristics (e.g., the negative binomial distribution model, or NBD model). Econometric models attempt to explain consumer behavior as a function of a set of covariates (e.g., the NBR model). Different models
Table 3Model Estimates of Retention Model
ModelIndependent Variables Estimate p-Value
Intercept 0.17 0.05 (0.09)Loyalty 6.38 < 0.001 (0.51)
Note: The standard errors of estimates are reported in parentheses.
CUSTOMER LOYALTY AND LIFETIME VALUE
134
in this area are often compared on the basis of predictive accuracy. For example, Borle, Singh, and Jain (2008) develop a Bayesian model to predict consumer CLV but compare their model with RFM and NBD models.
In this section, we compare the NBR model used in our analysis to the RFM and NBD models and discuss the implications of model selection. RFM models have been widely used in direct marketing to identify the most valu-able customers (see a review in Hughes 2000). These models involve no probability distributions and are not computa-tionally sophisticated. Recent research in the area of CLV incorporates RFM variables in more sophisticated models to predict future purchase behavior (Fader, Hardie, and Lee 2005). Many researchers use RFM models as benchmark models (e.g., Reinartz and Kumar 2003; Venkatesan and Kumar 2004).
NBD models assume that consumer purchases follow Poisson distribution with an individual purchase rate pa-rameter that follows gamma distribution (see more technical details in Schmittlein, Bemmaor, and Morrison 1985). These simple assumptions generate a class of powerful models that enable researchers to make predictions about the likelihood that a customer will be active and the number of purchases this customer will make in the future (e.g., Schmittlein, Morrison, and Colombo 1987). The outputs of NBD models can be easily integrated into CLV calcula-tion (e.g., Reinartz and Kumar 2000; 2003). Although more sophisticated than scoring models (e.g., RFM models), NBD models have limitations. These models ignore the fact that consumer purchases can be affected by an array of market-ing activities, or other covariates. The NBR model used in our analysis builds on the principles of NBD models, but it incorporates the effects of covariates (e.g., brand ads). RFM, NBD, and NBR models are all capable of predicting consumer future purchases, but these models vary greatly in mathematical sophistication. Therefore, it is meaningful to compare alternative models and select the model that is most appropriate to the context.
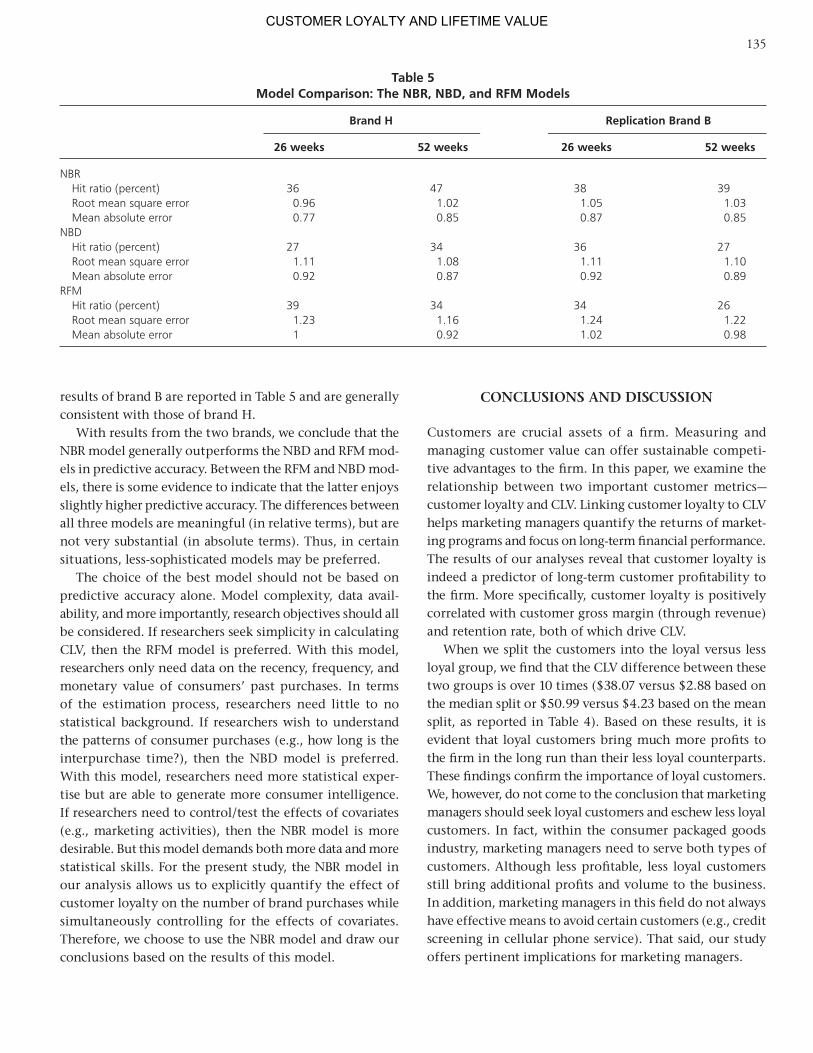
In order to examine the predictive accuracy of these three models, we divide our data into an estimation sample and a holdout sample. Specifically, we use data in two dif-ferent time frames (26 and 52 weeks) to fit each of these three models, and then use the fitted models to predict the number of brand H purchases in the 26 weeks immediately following the estimation period. The predictive accuracy is measured by hit ratio, mean square errors (MSE), and mean absolute errors (MAE). The results of model comparison are summarized in Table 5.
Overall, the NBR model generally has higher hit ratios. Except in one cell of Table 5, the NBR model outperforms the NBD and RFM models in correctly predicting the num-ber of brand H purchases in holdout samples. It is worth noting that in a context where a household could make any numbers of brand H purchases (i.e., the number of brand H purchases is a multinomial variable), it is rather difficult to precisely predict the number of brand H purchases. Therefore, MSE and MAE are perhaps better measures for model predictive accuracy.
In Table 5, all three models have MSE and MAE values around 1. Given the fact that the average number of brand H purchases in a 26-week period is about 5, all three mod-els predict brand purchases well. Based on MSE and MAE measures, there is consistent evidence that the NBR model is preferred. The differences between RFM and NBD mod-els are consistent (i.e., the NBD model is preferred), but are not very substantial. It is interesting to find that more mathematically sophisticated models (e.g., NBD model) do not substantially outperform less-sophisticated models (e.g., RFM model). This finding is, in fact, very meaningful for marketing researchers who seek research simplicity or attempt to avoid computation intensity.
To show that the above results are not idiosyncratic to only one brand, we replicate the model comparison exer-cises using a smaller brand B in the same product category. Brand B has approximately 5.46 percent of the market share in our data (compared to 25 percent for brand H). The
Table 4Customer Loyalty and Lifetime Value (in U.S. dollars)
Time Horizon 2 Years 4 Years 6 Years 10 Years Infinity
CLV for an average customer 4.96 8.45 11.03 14.52 20.62Split data analysis (by median) CLV for a loyal customer 8.17 14.42 19.26 26.01 38.07 CLV for a less loyal customer 1.69 2.38 2.67 2.84 2.88Split data analysis (by mean) CLV for a loyal customer 10.20 18.28 24.71 33.93 50.99 CLV for a less loyal customer 2.13 3.14 3.65 4.05 4.23
CUSTOMER LOYALTY AND LIFETIME VALUE
135
results of brand B are reported in Table 5 and are generally consistent with those of brand H.
With results from the two brands, we conclude that the NBR model generally outperforms the NBD and RFM mod-els in predictive accuracy. Between the RFM and NBD mod-els, there is some evidence to indicate that the latter enjoys slightly higher predictive accuracy. The differences between all three models are meaningful (in relative terms), but are not very substantial (in absolute terms). Thus, in certain situations, less-sophisticated models may be preferred.
The choice of the best model should not be based on predictive accuracy alone. Model complexity, data avail-ability, and more importantly, research objectives should all be considered. If researchers seek simplicity in calculating CLV, then the RFM model is preferred. With this model, researchers only need data on the recency, frequency, and monetary value of consumers’ past purchases. In terms of the estimation process, researchers need little to no statistical background. If researchers wish to understand the patterns of consumer purchases (e.g., how long is the interpurchase time?), then the NBD model is preferred. With this model, researchers need more statistical exper-tise but are able to generate more consumer intelligence. If researchers need to control/test the effects of covariates (e.g., marketing activities), then the NBR model is more desirable. But this model demands both more data and more statistical skills. For the present study, the NBR model in our analysis allows us to explicitly quantify the effect of customer loyalty on the number of brand purchases while simultaneously controlling for the effects of covariates. Therefore, we choose to use the NBR model and draw our conclusions based on the results of this model.
ConCLusions AnD DisCussion
Customers are crucial assets of a firm. Measuring and managing customer value can offer sustainable competi-tive advantages to the firm. In this paper, we examine the relationship between two important customer metrics—customer loyalty and CLV. Linking customer loyalty to CLV helps marketing managers quantify the returns of market-ing programs and focus on long-term financial performance. The results of our analyses reveal that customer loyalty is indeed a predictor of long-term customer profitability to the firm. More specifically, customer loyalty is positively correlated with customer gross margin (through revenue) and retention rate, both of which drive CLV.
When we split the customers into the loyal versus less loyal group, we find that the CLV difference between these two groups is over 10 times ($38.07 versus $2.88 based on the median split or $50.99 versus $4.23 based on the mean split, as reported in Table 4). Based on these results, it is evident that loyal customers bring much more profits to the firm in the long run than their less loyal counterparts. These findings confirm the importance of loyal customers. We, however, do not come to the conclusion that marketing managers should seek loyal customers and eschew less loyal customers. In fact, within the consumer packaged goods industry, marketing managers need to serve both types of customers. Although less profitable, less loyal customers still bring additional profits and volume to the business. In addition, marketing managers in this field do not always have effective means to avoid certain customers (e.g., credit screening in cellular phone service). That said, our study offers pertinent implications for marketing managers.
Table 5Model Comparison: The NBR, NBD, and RFM Models
Brand H Replication Brand B
26 weeks 52 weeks 26 weeks 52 weeks
NBR Hit ratio (percent) 36 47 38 39 Root mean square error 0.96 1.02 1.05 1.03 Mean absolute error 0.77 0.85 0.87 0.85NBD Hit ratio (percent) 27 34 36 27 Root mean square error 1.11 1.08 1.11 1.10 Mean absolute error 0.92 0.87 0.92 0.89RFM Hit ratio (percent) 39 34 34 26 Root mean square error 1.23 1.16 1.24 1.22 Mean absolute error 1 0.92 1.02 0.98
CUSTOMER LOYALTY AND LIFETIME VALUE
136
mAnAgeRiAL impLiCAtions
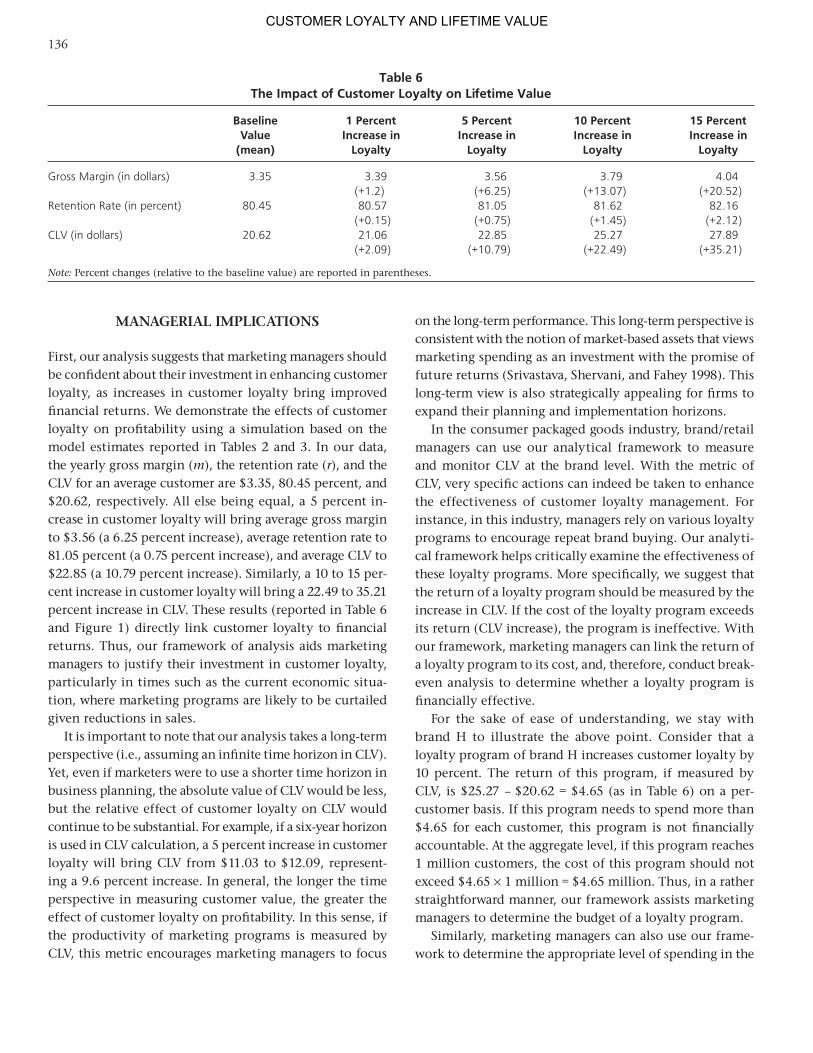
First, our analysis suggests that marketing managers should be confident about their investment in enhancing customer loyalty, as increases in customer loyalty bring improved financial returns. We demonstrate the effects of customer loyalty on profitability using a simulation based on the model estimates reported in Tables 2 and 3. In our data, the yearly gross margin (m), the retention rate (r), and the CLV for an average customer are $3.35, 80.45 percent, and $20.62, respectively. All else being equal, a 5 percent in-crease in customer loyalty will bring average gross margin to $3.56 (a 6.25 percent increase), average retention rate to 81.05 percent (a 0.75 percent increase), and average CLV to $22.85 (a 10.79 percent increase). Similarly, a 10 to 15 per-cent increase in customer loyalty will bring a 22.49 to 35.21 percent increase in CLV. These results (reported in Table 6 and Figure 1) directly link customer loyalty to financial returns. Thus, our framework of analysis aids marketing managers to justify their investment in customer loyalty, particularly in times such as the current economic situa-tion, where marketing programs are likely to be curtailed given reductions in sales.
It is important to note that our analysis takes a long-term perspective (i.e., assuming an infinite time horizon in CLV). Yet, even if marketers were to use a shorter time horizon in business planning, the absolute value of CLV would be less, but the relative effect of customer loyalty on CLV would continue to be substantial. For example, if a six-year horizon is used in CLV calculation, a 5 percent increase in customer loyalty will bring CLV from $11.03 to $12.09, represent-ing a 9.6 percent increase. In general, the longer the time perspective in measuring customer value, the greater the effect of customer loyalty on profitability. In this sense, if the productivity of marketing programs is measured by CLV, this metric encourages marketing managers to focus
on the long-term performance. This long-term perspective is consistent with the notion of market-based assets that views marketing spending as an investment with the promise of future returns (Srivastava, Shervani, and Fahey 1998). This long-term view is also strategically appealing for firms to expand their planning and implementation horizons.
In the consumer packaged goods industry, brand/retail managers can use our analytical framework to measure and monitor CLV at the brand level. With the metric of CLV, very specific actions can indeed be taken to enhance the effectiveness of customer loyalty management. For instance, in this industry, managers rely on various loyalty programs to encourage repeat brand buying. Our analyti-cal framework helps critically examine the effectiveness of these loyalty programs. More specifically, we suggest that the return of a loyalty program should be measured by the increase in CLV. If the cost of the loyalty program exceeds its return (CLV increase), the program is ineffective. With our framework, marketing managers can link the return of a loyalty program to its cost, and, therefore, conduct break-even analysis to determine whether a loyalty program is financially effective.
For the sake of ease of understanding, we stay with brand H to illustrate the above point. Consider that a loyalty program of brand H increases customer loyalty by 10 percent. The return of this program, if measured by CLV, is $25.27 – $20.62 = $4.65 (as in Table 6) on a per-customer basis. If this program needs to spend more than $4.65 for each customer, this program is not financially accountable. At the aggregate level, if this program reaches 1 million customers, the cost of this program should not exceed $4.65 × 1 million = $4.65 million. Thus, in a rather straightforward manner, our framework assists marketing managers to determine the budget of a loyalty program.
Similarly, marketing managers can also use our frame-work to determine the appropriate level of spending in the
Table 6The Impact of Customer Loyalty on Lifetime Value
Baseline 1 Percent 5 Percent 10 Percent 15 Percent Value Increase in Increase in Increase in Increase in (mean) Loyalty Loyalty Loyalty Loyalty
Gross Margin (in dollars) 3.35 3.39 3.56 3.79 4.04 (+1.2) (+6.25) (+13.07) (+20.52)Retention Rate (in percent) 80.45 80.57 81.05 81.62 82.16 (+0.15) (+0.75) (+1.45) (+2.12)CLV (in dollars) 20.62 21.06 22.85 25.27 27.89 (+2.09) (+10.79) (+22.49) (+35.21)
Note: Percent changes (relative to the baseline value) are reported in parentheses.
CUSTOMER LOYALTY AND LIFETIME VALUE

137
situation of new customer acquisition. Consider the many marketing programs designed to attract new customers. In order to be financially accountable, the cost of such a program (on a per-customer basis) should not exceed the lifetime value of an average customer. Brand/retail managers with access to consumer panel data can follow our frame-work to calculate the average CLV for a particular product/brand. Armed with the insight of CLV, managers can then fine-tune how much money they should spend to acquire a new customer.
Our CLV framework can also be applied to understand the values of lost customers. In the consumer packaged goods industry, product failures (e.g., food contamination) occur widely (see, for example, the list of recalled consumer products at www.recalls.gov). Hogan, Lemon, and Libai (2003) suggest that the costs of product failures include both direct costs (e.g., loss of customers) and indirect costs (e.g., tarnished brand image). When a customer is lost to other brands, the financial loss is not just a few dollars. The value of a lost customer, if measured over his or her lifetime, can be substantial. Therefore, recovering the goodwill and even-tual restoration of buying behavior of the “lost” customer is critical. Our CLV framework assists marketing managers to determine the values of lost customers. Within the context of customer recovery strategies, the CLV of a lost customer can be used as a benchmark, against which expenditures to recover customer goodwill can be optimized.
LimitAtions AnD FutuRe ReseARCh
In this paper, we do not address what leads to customer loyalty or why consumers keep buying a particular brand. Prior studies have examined various determinants of cus-
tomer loyalty, such as customer satisfaction (e.g., Carrillat, Jaramillo, and Mulki 2009), trust (e.g., Agustin and Singh 2005), brand value (e.g., Johnson, Herrmann, and Huber 2006), brand community (e.g., McAlexander, Kim, and Roberts 2003), and purchase situations (e.g., Belk 1975). We only focus on the relationship of two customer metrics—customer loyalty and CLV.
At the aggregate level, the sum of CLVs of all the current and future customers forms a firm’s customer equity. Us-ing aggregate data and diffusion models, researchers have studied the effects of service quality (Rust, Lemon, and Zeithaml 2004), customer retention (Gupta, Lehmann, and Stuart 2004), and customer dissatisfaction (Hogan, Lemon, and Libai 2003) on customer equity. Compared to CLV, customer equity is a macro-level metric that can be applied directly to understand equity market reactions to marketing actions. It is possible to use our analytical framework as the basis to calculate customer equity. In order to do so, researchers need product diffusion data to estimate the acquisition of future customers. The expansion of our work to include customer equity is an opportunity for future research.
In this study, we estimate the gross margin rate at the business level. It is perhaps more desirable to have the individual-level estimate. Yet accounting systems are orga-nized around functions (e.g., manufacturing), and account-ing information is not usually available on a per-customer basis. In addition, certain marketing costs are difficult to allocate at the customer level. For example, should adver-tising expenses be allocated across current customers, or current and potential customers, or the entire population of ads’ viewers regardless of buying status? There has been research in the business-to-business area to advance
Figure 1 the impact of Customer Loyalty on Lifetime Value
CUSTOMER LOYALTY AND LIFETIME VALUE

138
cost-allocation based on customer activities (e.g., Bowman and Narayandas 2004), but more work needs to be done particularly for business-to-consumer markets.
There are also a few technical issues that may limit our findings. We measure customer loyalty at the household level. If members in a household have different brand preferences, this measure may be contaminated. Our data, however, do not provide information at the level of indi-vidual buyers. In addition, in calculating purchase value, we only account for coupon uses. Nonmonetary deals (e.g., buy one get one free) are not considered due to data unavail-ability. Last, our findings relate to one product category. We suggest that data from multiple categories of consumer packaged goods should be used to verify and add to our findings, which should be of interest for future research. In addition to expanding the types of products examined, adding alternative methods or utilizing different definitions to compare and contrast against our results could also con-tribute to a better understanding of all possible nuances of the relationship between customer loyalty and CLV.
ReFeRenCes
Agustin, Clara, and Jagdip Singh (2005), “Curvilinear Effects of Consumer Loyalty Determinants in Relational Exchanges,” Journal of Marketing Research, 42 (1), 96–108.
Anderson, Eugene W., Claes Fornell, and Ronald R. Lehmann (1994), “Customer Satisfaction, Market Share, and Profit-ability: Findings from Sweden,” Journal of Marketing, 58 (July), 53–66.
———, ———, and Roland T. Rust (1997), “Customer Satisfaction, Productivity, and Profitability: Difference Between Goods and Services,” Marketing Science, 16 (2), 129–145.
Belk, Russell W. (1975), “Situational Variables and Consumer Be-havior,” Journal of Consumer Research, 2 (3), 157–164.
Bell, David, John Deighton, Werner J. Reinartz, Roland T. Rust, and Gordon Swartz (2002), “Seven Barriers to Customer Equity Management,” Journal of Service Research, 5 (1), 77–86.
Berger, Paul D., and Nada I. Nasr (1998), “Customer Lifetime Value: Marketing Models and Applications,” Journal of Interactive Marketing, 12 (1), 17–30.
Bernhardt, Kenneth L., Naveen Donthu, and Pamela A. Kennett (2000), “A Longitudinal Analysis of Satisfaction and Profit-ability,” Journal of Business Research, 47 (2), 161–171.
Blattberg, Robert C., and John Deighton (1996), “Manage Market-ing by the Customer Equity Test,” Harvard Business Review, 74 (4), 136–144.
———, Gary Getz, and Jacquelyn Thomas (2001), Customer Equity, Boston: Harvard Business School Press.
Borle, Sharad, Siddharth S. Singh, and Dipak C. Jain (2008), “Cus-tomer Lifetime Value Measurement,” Management Science, 54 (1), 100–115.
Bowman, Douglas, and Das Narayandas (2004), “Linking Customer Management Effort to Customer Profitability in Business Markets,” Journal of Marketing Research, 41 (4), 433–447.
Cameron, A. Colin, and Pravin K. Trivedi (1998), Regression Analysis of Count Data, Cambridge: Cambridge University Press.
Carrillat, François A., Fernando Jaramillo, and Jay Prakash Mulki (2009), “Examining the Impact of Service Quality: A Meta-Analysis of Empirical Evidence,” Journal of Marketing Theory and Practice, 17 (2), 95–110.
Chaudhuri, Arjun (1999), “Does Brand Loyalty Mediate Brand Equity Outcomes?” Journal of Marketing Theory and Practice, 7 (2), 136–146.
Colombo, Richard, and Weina Jiang (1999), “A Stochastic RFM Model,” Journal of Interactive Marketing, 13 (3), 2–12.
Dick, Alan S., and Kunal Basu (1994), “Customer Loyalty: Toward an Integrated Conceptual Framework,” Journal of the Academy of Marketing Science, 22 (2), 99–113.
Dwyer, F. Robert (1997), “Customer Lifetime Valuation to Support Marketing Decision Making,” Journal of Interactive Market-ing, 11 (4), 6–13.
Ehrenberg, Andrew S.C., Neil Barnard, and John Scriven (1997), “Differentiation or Salience,” Journal of Advertising Research, 37 (6), 7–14.
———, Mark D. Uncles, and Gerald J. Goodhardt (2004), “Under-standing Brand Performance Measures: Using Dirichlet Bench-marks,” Journal of Business Research, 57 (12), 1307–1325.
Fader, Peter S., and Bruce G.S. Hardie (1996), “Modeling Consumer Choice Among SKUs,” Journal of Marketing Research, 33 (4), 442–452.
———, ———, and Ka Lok Lee (2005), “RFM and CLV: Using ISO-Value Curves for Customer Base Analysis,” Journal of Marketing Research, 42 (4), 415–430.
Fornell, Claes, Michael D. Johnson, Eugene W. Anderson, Jaesung Cha, and Bryant B. Everitt (1996), “The American Customer Satisfaction Index: Nature, Purpose, and Findings,” Journal of Marketing, 60 (4), 7–18.
Gonul, Fusun F., Byung-Do Kim, and Mengze Shi (2000), “Mail-ing Smarter to Catalog Customers,” Journal of Interactive Marketing, 14 (2), 2–16.
Gupta, Sunil, and Donald R. Lehmann (2003), “Customers as As-sets,” Journal of Interactive Marketing, 17 (1), 9–24.
———, and ——— (2005), Managing Customers as Investments: The Strategic Value of Customers in the Long Run, Upper Saddle River, NJ: Wharton School Publishing.
———, ———, and Jennifer Ames Stuart (2004), “Valuing Customers,” Journal of Marketing Research, 41 (1), 7–18.
Hogan, John E., Katherine N. Lemon, and Barak Libai (2003), “What Is the True Value of a Lost Customer?” Journal of Service Research, 5 (3), 196–208.
Hughes, Arthur M. (2000), Strategic Database Marketing, 2d ed., New York: McGraw-Hill.
Jacoby, Jacob, and David B. Kyner (1978), Brand Loyalty: Measure-ment and Management, New York: John Wiley & Sons.
Jain, Dipak, and Siddhartha S. Singh (2002), “Customer Lifetime Value Research in Marketing: A Review and Future Direc-tions,” Journal of Interactive Marketing, 16 (2), 34–46.
Johnson, Michael D., Andreas Herrmann, and Frank Huber (2006), “The Evolution of Loyalty Intentions,” Journal of Marketing, 70 (2), 122–132.
Keiningham, Timothy L., Terry G. Vavra, Lerzan Aksoy, and Henri Wallard (2005), Loyalty Myths: Hyped Strategies That Will Put You Out of Business and Proven Tactics That Really Work, Hoboken, NJ: John Wiley & Sons.
CUSTOMER LOYALTY AND LIFETIME VALUE
139
Lewis, Michael (2004), “The Influence of Loyalty Programs and Short-Term Promotions on Customer Retention,” Journal of Marketing Research, 41 (3), 281–292.
McAlexander, James H., Stephen K. Kim, and Scott D. Roberts (2003), “Loyalty: The Influences of Satisfaction and Brand Community Integration,” Journal of Marketing Theory and Practice, 11 (4), 1–11.
Morrison, Donald G. (1969), “Conditional Trend Analysis: A Model That Allows for Nonusers,” Journal of Marketing Research, 6 (August), 342–346.
———, and David C. Schmittlein (1981), “Predicting Future Random Events Based on Past Performance,” Management Science, 27 (9), 1006–1023.
Mulhern, Francis J. (1999), “Customer Profitability Analysis: Mea-surement, Concentration, and Research Directions,” Journal of Interactive Marketing, 13 (1), 25–40.
Neslin, Scott A., Sunil Gupta, Wagner Kamakura, Junxiang Lu, and Charlotte H. Mason (2006), “Defection Detection: Measuring and Understanding the Predictive Accuracy of Customer Churn Models,” Journal of Marketing Research, 43 (2), 204–211.
Ofek, Elie (2002), Customer Profitability and Lifetime Value, Boston: Harvard Business School Publishing.
Oliver, Richard L. (1997), Satisfaction: A Behavioral Perspective on the Consumer, New York: Irwin/McGraw-Hill.
——— (1999), “Whence Consumer Loyalty?” Journal of Marketing, 63 (4), 33–44.
O’Shaughnessy, John (1987), Why People Buy, New York: Oxford University Press.
Peppers, Don, and Martha Rogers (2004), Managing Customer Relationships: A Strategic Framework, Hoboken, NJ: John Wiley & Sons.
Pfeifer, Phillip E., and Robert L. Carraway (2000), “Modeling Cus-tomer Relationships as Markov Chains,” Journal of Interactive Marketing, 14 (2), 43–55.
Reichheld, Fredrick F., and W. Earl Sasser (1990), “Zero Defections: Quality Comes to Services,” Harvard Business Review, 68 (September–October), 105–111.
———, and Thomas Teal (1996), The Loyalty Effect, Boston: Harvard Business School Press.
———, Robert G. Markey, and Christopher Hopton (2000), “The Loyalty Effect—The Relationship Between Loyalty and Prof-its,” European Business Journal, 12 (3), 134–140.
Reinartz, Werner J., and V. Kumar (2000), “On the Profitability of Long-Life Customers in a Noncontractual Setting: An Empirical Investigation and Implications for Marketing,” Journal of Marketing, 64 (October), 17–35.
———, and ——— (2002), “Mismanagement of Customer Loyalty,” Harvard Business Review, 80 (July), 86–94.
———, and ——— (2003), “The Impact of Customer Relationship Characteristics on Profitable Lifetime Duration,” Journal of Marketing, 67 (January), 77–99.
———, Jacquelyn S. Thomas, and V. Kumar (2005), “Balancing Ac-quisition and Retention Resources to Maximize Customer Profitability,” Journal of Marketing, 69 (1), 63–79.
Russell, Gary J., and Wagner Kamakura (1994), “Understanding Brand Competition Using Micro and Macro Scanner Data,” Journal of Marketing Research, 31 (May), 289–303.
Rust, Roland T., Katherine N. Lemon, and Valarie A. Zeithaml (2004), “Return on Marketing: Using Customer Equity to Focus Marketing Strategy,” Journal of Marketing, 68 (1), 109–127.
———, Tim Ambler, Gregory S. Carpenter, V. Kumar, and Rajendra K. Srivastava (2004), “Measuring Marketing Productivity: Current Knowledge and Future Directions,” Journal of Mar-keting, 68 (4), 76–89.
Schmittlein, David C. (1989), “Surprising Inferences from Unsur-prising Observations: Do Conditional Expectations Really Re-gress to the Mean?” American Statistician, 43 (3), 176–183.
———, and Robert A. Peterson (1994), “Customer Base Analysis: An Industrial Purchase Process Application,” Marketing Science, 13 (1), 41–67.
———, Albert C. Bemmaor, and Donald G. Morrison (1985), “Why Does the NBD Model Work? Robustness in Representing Product Purchases, Brand Purchases and Imperfectly Re-corded Purchases,” Marketing Science, 4 (3), 255–266.
———, Donald G. Morrison, and Richard Colombo (1987), “Count-ing Your Customers: Who Are They and What Will They Do Next?” Management Science, 33 (1), 1–24.
Sivakumar, K. (1994), “The Role of Quality-Tier Loyalty on Con-sumer Price Sensitivity for Frequently Purchased Products,” Journal of Marketing Theory and Practice, 3 (4), 84–97.
Srivastava, Rajendra K., Tasadduq A. Shervani, and Liam Fahey (1998), “Market-Based Assets and Shareholder Value: A Frame-work for Analysis,” Journal of Marketing, 52 (1), 2–19.
Swaminathan, Vanitha, Richard J. Fox, and Srinivas K. Reddy (2001), “The Impact of Brand Extension Introduction on Choice,” Journal of Marketing, 65 (October), 1–15.
Tellis, Gerard J. (1988), “Advertising Exposure, Loyalty, and Brand Purchase: A Two-Stage Model of Choice,” Journal of Marketing Research, 25 (May), 134–144.
Thomas, Jacquelyn S. (2001), “A Methodology for Linking Cus-tomer Acquisition to Customer Retention,” Journal of Market-ing Research, 38 (2), 262–268.
Uncles, Mark D., Grahame R. Dowling, and Kathy Hammond (2003), “Customer Loyalty and Customer Loyalty Programs,” Journal of Consumer Marketing, 20 (4–5), 294–316.
Venkatesan, Rajkumar, and V. Kumar (2004), “A Customer Lifetime Value Framework for Customer Selection and Resource Al-location Strategy,” Journal of Marketing, 68 (4), 106–125.
Villanueva, Julian, Shijin Yoo, and Dominique M. Hanssens (2008), “The Impact of Marketing-Induced Versus Word-of-Mouth Customer Acquisition on Customer Equity Growth,” Journal of Marketing Research, 45 (1), 48–59.
CUSTOMER LOYALTY AND LIFETIME VALUE