customer relationship management in lesotho utility companies
TRANSCRIPT

Customer Relationship Management in
Lesotho Utility Companies
by
Matseliso Mamathe Makhaola
A field study submitted to the UFS Business School in the Faculty of Economic and Management Sciences in partial fulfilment of the
requirements for the degree of
Magister In
Business Administration At the
University of the Free State
Supervisor: Dr. Johan Van Zyl
16th NOVEMBER 2015
Bloemfontein

ii
ABSTRACT
The objective of this study is to investigate how CRM could be managed and
implemented in view of improving WASCO and LEC service delivery. The research is
conducted against a backdrop of service delivery and quality continuing to be a
significant challenge for Lesotho utility companies, resulting in frustrated customers, and
non-profitability despite the fact that they are operating in a monopolistic arena. The
poor service quality and delivery is highly pertinent – particularly for monopolistic
companies like WASCO and LEC that offers essential services of water and electricity –
as they not only put at risk the lives of the society as a whole, but also hampers the
economic growth and development of Lesotho.
An empirical research study was conducted using a quantitative approach and a non-
probability, convenience sampling technique. The sample size of 250 was drawn from a
target population that represented both companies’ different categories of customers,
stakeholders, and employees. The research instrument used was a self-administered
questionnaire. The findings of the study indicate that both WASCO and LEC’s service
quality and delivery are not of acceptable standard.
The main reasons identified by this research for unacceptable service delivery and
quality by WASCO, in order of significance are, Unappealing appearance of WASCO’s
facilities, Lack of commitment and customer-centricity demonstrated by frontline staff,
Non-availability of a customer charter that is known by customers, WASCO’s bad
service reputation, Untimely communiqué with respect to service failures,
Unguaranteed service works, Unconvincing responses provided by the frontline staff,
Non-availability of customers’ applicable information at the disposal of the frontline staff
as and when needed at the different service stations, Unacceptable service costs, Non-
adherence to service-level standards/agreements, and Rudeness demonstrated by
frontline staff while dealing with customers.
On the other hand, the main reasons identified by this research study for unacceptable
service delivery and quality by LEC, in order of significance are, Non-availability of a
customer charter that is known by customers, Non-adherence to service-level

iii
standards/agreements, Non-availability of dedicated relationship managers to interact
with high-consuming customers like industries, High service costs, Unguaranteed
service works, Service delivery standards that are not known by all the customers,
Unconvincing responses provided by the frontline staff, LEC’s bad service reputation,
Untimely communiqué with respect to service failures, and Failure to contact customers
in the event that LEC fails to offer service on the promised time.
Key words: CRM, customers, CRM strategy, service quality, service delivery, customer
complaints management, service recovery, service quality gaps, customer satisfaction,
and customer loyalty.

iv
ACKNOWLEDGEMENTS
I wish to praise my Lord who is my Strength, my Light and my Saviour for having given
me the courage to persevere thus far and for having provided me with the strength to
see this mammoth responsibility from the beginning up to the end. I also desire to
acknowledge and express my sincere gratitude to the following people for all the
assistance they provided me with in the course of my journey to complete this field
study:
My supervisor, Dr Johan Van Zyl, for all the guidance, patience and support.
My beloved daughters, Mathe and Ntsebo, for the inspiration that they are.
My employer, for all the support and understanding.
Friends and colleagues who have stood by me throughout this long journey.

v
DECLARATION
I declare that the field study hereby submitted for the Masters in Business
Administration at the School of Management, University of the Free State, is my own
independent work and that I have not previously submitted this work for a qualification
at/in another university/faculty.
Signed:
Matseliso Mamathe Makhaola - 2012088882

vi
Table of Contents ABSTRACT .................................................................................................................................... ii
ACKNOWLEDGEMENTS ........................................................................................................... iv
DECLARATION ............................................................................................................................ v
Table of Contents ........................................................................................................................... vi
List of figures .................................................................................................................................. x
List of Tables ................................................................................................................................ xii
CHAPTER 1: OVERVIEW OF THE STUDY ............................................................................... 1
1.1 Background to the Research ..................................................................................................... 1
1.2 The Problem Statement ............................................................................................................. 4
1.3 Objectives .................................................................................................................................. 5
1.3.1 Primary Objective .............................................................................................................. 5
1.3.2 Secondary Objectives ......................................................................................................... 5
1.4 Research Methodology ............................................................................................................. 5
1.4.1 Literature Review ............................................................................................................... 5
1.4.2 Investigational/Empirical Study......................................................................................... 6
1.4.2.1 Study Design ............................................................................................................... 6
1.4.2.2 Target Population ........................................................................................................ 6
1.4.2.3 Sampling ..................................................................................................................... 6
1.4.2.4 Target Sample ............................................................................................................. 7
1.4.2.5 Data Collection Technique ......................................................................................... 7
1.4.2.6 Measurement Type ...................................................................................................... 7
1.4.3 Ethical Considerations ....................................................................................................... 7
1.5 Demarcating the Field Study ..................................................................................................... 8
1.5.1 Chapter outlay .................................................................................................................... 8
1.6 Conclusion ................................................................................................................................ 9
CHAPTER 2: LITERATURE REVIEW ..................................................................................... 10
2.1 Introduction ......................................................................................................................... 10
2.2 Customer Relationship Marketing ...................................................................................... 10
2.2.1 Importance of CRM ......................................................................................................... 11
2.3 CRM Strategy ..................................................................................................................... 13
2.3.1 Strategy development................................................................................................... 14

vii
2.3.2 Value creation (Delivering value to the customer) ...................................................... 15
2.3.3 Multichannel Communication integration ................................................................... 17
2.3.4 Performance assessment .............................................................................................. 18
2.3.5 Information management or technology initiatives ..................................................... 19
2.4 CRM as a Technological tool ............................................................................................. 19
2.5 CRM Philosophy ................................................................................................................. 20
2.5.1 Employee engagement ................................................................................................. 20
2.6 Customer Service Quality ................................................................................................... 21
2.6.1 Customer Service Quality Perception .......................................................................... 21
2.6.2 Dimensions of service quality ...................................................................................... 22
2.6.3 Service quality challenges/problems ............................................................................ 23
2.6.4 Strategies for customer service quality improvement .................................................. 26
2.6.5 Complaint Handling and recovery procedures ............................................................ 28
2.7 Customer Satisfaction ......................................................................................................... 31
2.7.1 Deflection Zone ........................................................................................................... 32
2.7.2 Indifference Zone ......................................................................................................... 32
2.7.3 Affection Zone ............................................................................................................. 32
2.8 Customer Loyalty................................................................................................................ 32
2.8.1 Loyalty foundation building ........................................................................................ 34
2.8.2 Loyalty bonds Creation ................................................................................................ 34
2.8.3 Churn Drivers reduction .............................................................................................. 35
2.9 Customer lifetime value ...................................................................................................... 36
2.10 Customer Retention .......................................................................................................... 37
2.11 Conclusion ........................................................................................................................ 37
CHAPTER 3: RESEARCH METHODOLOGY ......................................................................... 39
3.1 Introduction ............................................................................................................................. 39
3.2 Research Design...................................................................................................................... 39
3.3 Sampling Strategy ................................................................................................................... 40
3.3.1 Target Population and Sample frame ............................................................................... 40
3.3.2 Sample Design ................................................................................................................. 41
3.3.3 Target Sample size ........................................................................................................... 42
3.4 Data Collection Technique ..................................................................................................... 42

viii
3.5 Measurement Type.................................................................................................................. 43
3.6 Statistical Analysis .................................................................................................................. 43
3.6.1 Coding data ...................................................................................................................... 43
3.6.2 Getting a feel for the data................................................................................................. 44
3.6.3 Data display and analysis ................................................................................................. 44
3.7 Ethical Considerations ............................................................................................................ 44
3.8 Demarcating the Field Study .................................................................................................. 45
3.9 Conclusion .............................................................................................................................. 45
CHAPTER 4: RESEARCH FINDINGS AND ANALYSIS ....................................................... 46
4.1 Introduction ............................................................................................................................. 46
4.2 Characteristics of both utility companies’ customers ............................................................. 46
4.3 Customers’ perception of service delivery quality ................................................................. 48
4.3.1 WASCO’ service delivery and quality ............................................................................ 49
4.3.2 WASCO’s complaints management ................................................................................ 52
4.3.3 LEC’s service delivery and quality .................................................................................. 54
4.3.4 LEC’s complaints management ....................................................................................... 56
4.4 Executive Management and frontline staff commitment on CRM ......................................... 59
4.4.1 WASCO’s CRM Strategy ................................................................................................ 59
4.4.2 LEC’s CRM Strategy ....................................................................................................... 61
4.5 Customer Satisfaction and Loyalty ......................................................................................... 63
4.5.1 Customer Satisfaction ...................................................................................................... 63
4.5.1.1 Main Reasons for Customers’ Dissatisfaction .......................................................... 64
4.5.2 Customer Loyalty............................................................................................................. 66
4.5.2.2 Main Reasons for Customers being Disloyal............................................................ 66
4.6 Main findings and aspects ....................................................................................................... 68
4.7 Conclusion .............................................................................................................................. 69
CHAPTER 5: CONCLUSIONS AND RECOMMENDATIONS ................................................ 70
5.1 Introduction ............................................................................................................................. 70
5.2 Hypothetical findings .............................................................................................................. 70
5.3 Research Conclusions ............................................................................................................. 71
5.3.1 Service delivery and quality............................................................................................. 71

ix
5.3.2 Complaints Management ................................................................................................. 75
5.3.3 Executive Management and frontline staff commitment to CRM ................................... 75
5.3.4 Customer Satisfaction and Loyalty .................................................................................. 76
5.4 Recommendations ................................................................................................................... 76
5.5 Significance of the Study ........................................................................................................ 78
5.6 Limitations of the Study.......................................................................................................... 78
5.7 Conclusion .............................................................................................................................. 78
References ..................................................................................................................................... 80
Appendix A: Questionnaire .......................................................................................................... 84

x
List of figures
Figure 2.1: An Integrated Framework for CRM Strategy
Figure 2.2: Five Capitals Value Creation Model from intangibles
Figure 2.3: Customer Service Quality Gaps Model
Figure 2.4: Complaint handling and service recovery process
Figure 2.5: The Customer Satisfaction – Loyalty Relationship
Figure 2.6: Customer loyalty wheel
Figure 4.1: Lesotho utility companies’ customers/respondents
Figure 4.2: WASCO’s service delivery and quality standards
Figure 4.3: WASCO’s customers’ perception regarding queries and complaints
management
Figure 4.4: LEC’s service delivery and quality standards
Figure 4.5: LEC’s customers’ perception regarding queries and complaints
management
Figure 4.6: WASCO’s customers’ view on the company’s CRM strategy
Figure 4.7: Main reasons that make customers believe that WASCO does not pursue
a CRM strategy
Figure 4.8: LEC’s customers’ view on the company’s CRM strategy
Figure 4.9: Main reasons that make customers believe that LEC does not pursue a
CRM strategy
Figure 4.10: Customers’ satisfaction with WASCO and LEC’s service quality
Figure 4.11: Main reasons for customers’ dissatisfaction with WASCO

xi
Figure 4.12: Main reasons for customers’ dissatisfaction with LEC
Figure 4.13: Customers’ views on their loyalty to WASCO and LEC
Figure 4.14: Main reasons for customers not to be loyal to WASCO
Figure 4.15: Main reasons for customers not to be loyal to LEC

xii
List of Tables
Table 2.1: Recommended strategies for closing service quality gaps
Table 4.1: Frequency distribution of Lesotho utility companies’
customers/respondents
Table 4.2: Reasons for WASCO’s unacceptable service quality and delivery
Table 4.3: Main reasons for not being satisfied with WASCO’s complaints
management
Table 4.4: Reasons for LEC’s unacceptable service quality and delivery
Table 4.5: Main reasons for not being satisfied with LEC’s complaints management

xiii

1
CHAPTER 1: OVERVIEW OF THE STUDY
1.1 Background to the Research
In order for any company to build and maintain competitive advantages, there must be
well-built capability in understanding which customers grant the most excellent lasting
prospects for profitable relationships. Customer Relationship Management (CRM) could
therefore be deployed in addressing issues related to level customer orientation,
product quality, customer satisfaction, and customer retention (Ma and Dubé 2011:
p.84). Successful CRM programmes enable companies to attain competence that would
be impossible in an atmosphere that does not embrace precise, well-timed, and
continual response machinery crucial to predict the expectations, wishes, and demands
of the customer (Nitzan and Libai 2011: p.25).
While the Water and Sewerage Company (WASCO) and Lesotho Electricity Company
(LEC) do have customer care departments, it is eminent that management of the
relationships of these customers still remains a biggest challenge. This could be
confirmed by the fact that their customers are always complaining in the media. This
results in bad publicity for these companies and hence low customer satisfaction.
However, the thorniest aspect about their dissatisfaction is that both companies are
100% monopolies, thus putting customers in a dilemma of being stuck with them
regardless of whether they are satisfied with their services or not (Baye 2010: p.278).
Though these companies are enjoying the benefit of doing business under the
monopolistic arena, they are still not operating at the acceptable profit margins due to
the inefficiencies that are brought about by lack of good CRM.
As an incorporated, general conception, CRM is therefore considered as a framework
that could be exploited for the purpose of boosting a firm’s profitability and therefore it is
imperative that the Lesotho utility companies put more focus on improving on
relationship management regarding their customers. The success of CRM in companies
rest on three pillars - which are the organisation`s employees, technology, as well as its
organizational arrangement. The firm should have customer-centric employees who
2
value the needs of the customers. The companies should realize the negative effect that
is brought about by employees that do not have the right attitudes and behaviours to
serve the customers. Attitudinal factors can have an overall counterproductive effect on
consumer satisfaction (Kumar, Praveen, and Alexander 2015: p.10).
In order to enable dedicated and engaged employees to assist the customers smoothly,
the company should also invest in the CRM software system that allows the business
processes to be as effective and efficient as possible. The system should have the
capability to incorporate the technology, the human resources perspective and the
central aspects of the organizational structure as well. It is crucial that top management
plays a leading role in the development and implementation of the system. The
employees should be trained and capacitated with the relevant skills so that they could
appreciate the system, and most importantly the business processes that involve the
system should be anchored into the structure of the organization. It is only when all
these mentioned aspects are incorporated into the system the endeavour of developing
CRM could be beneficial to the firm (Raab, Ajami, Gargeya, and Goddard 2013: p.7).
For a successful CRM implementation, the starting point is to gather all the data related
to your customers. It is fundamental that the organization`s customers together with
their common needs and expectations are known. Excellent knowledge of customers`
needs results in the possibility of a long-term, sustained increase of the level of their
satisfaction, and of strengthening the customer’s loyalty, or rather their willingness to
commit to the company. This has direct consequences for the costs and profits of the
firm. Rising cost awareness increasingly requires that companies plan their marketing
activities with great precision in order to engage the target group, without wasteful
spending to achieve a good cost-to-benefit ratio. In the end, the concept of CRM, like all
other company activities, has the economic goal of raising profit. CRM characterizes a
management philosophy that is a complete orientation of the company toward existing
and potential customer relationships. The customer is at the centre of all company
considerations. The goal is the management of durable and profitable customer
relationships (Lovelock and Wirtz 2011: p.230).

3
The main utility companies in Lesotho are state owned, namely Lesotho Electricity
Company (LEC), which is mandated to supply power/electricity to the whole country,
while on the other hand the Water and Sewerage Company (WASCO) is mandated to
supply clean water and wastewater management services to all the urban areas of
Lesotho. The government of Lesotho established the office of the Regulator namely
Lesotho Water and Electricity Authority (LEWA) for the sole purpose of regulating the
business of these two companies so as to improve efficiency on service delivery.
For both WASCO and LEC to overcome the test of being under the watchful eye of the
Regulator, the subject of CRM is fundamental, considering the fact that most of the
service standards stipulated by the Regulator are cantered on meeting the demands of
both current and prospective customers satisfactorily. They are expected to comply with
these standards, failing which they could face serious punitive charges, or could even
get their licenses revoked. It is therefore quite imperative that both LEC and WASCO
have a sound CRM system that would enable them to comply with the Regulator`s
service standards stipulations.
This study, therefore, tries to explore how CRM could be best developed and
implemented at WASCO and LEC respectively. This exercise will be achieved through
an empirical study and literature review of the existing CRM practices or strategies
available and appropriate for both WASCO and LEC, the challenges they are faced with
and the approaches that can be adopted in addressing these challenges.

4
1.2 The Problem Statement
Customer relationship management of most companies globally continues to be a
daunting challenge, and Lesotho utility companies are no exception in this regard
(Hinson 2012: p.173). Even though literature has shown that CRM leads to enhanced
performance and profitability, in practice companies struggle to adapt suitable models to
their business contexts (Pedron and Saccol 2009: p.35). The problem is typically that
the executive management or leaders of organization fail to develop and implement
appropriate CRM strategies that would result in improved service delivery, customer
satisfaction and customer loyalty.
This study will, therefore, strive to establish how best CRM could be improved and
implemented in two Lesotho utility companies for the sole purpose of enhancing service
delivery. The complaints management system will also be looked into, with the aim of
identifying how CRM could be utilized in improving on the response time to complaints.
Over and above complaints management, the proficiency of the CRM strategy that
could enable both companies in maintaining good long-term customer relationships will
also be explored. Finally, the utilization of CRM for the purpose of customer satisfaction
and loyalty enhancement will also be investigated.

5
1.3 Objectives
1.3.1 Primary Objective
The primary objective of the field study is to investigate how CRM could be managed
and implemented in view of improving WASCO and LEC service delivery.
1.3.2 Secondary Objectives
1. To identify the main reasons WASCO and LEC customers complain.
2. To investigate strategies that could be implemented for the purpose of enhancing
customer satisfaction
3. To establish customer loyalty and perceived relationships through improved
customer-care service.
4. To pursue a CRM strategy that would enable both companies in maintaining
long-term customer relationships and also in understanding customers’ needs
better.
1.4 Research Methodology
The objectives of this study will be achieved through the employment of a literature
review and investigational (empirical) study. More emphasis will be put on the
challenges that both WASCO and LEC are faced with in optimizing their CRM, which if
addressed, would then lead to effective and efficient service delivery.
1.4.1 Literature Review
The literature review rests on two pillars, namely the research questions and the
primary and secondary objectives of this field study. The review will also provide the
background to what is intended to be achieved by conducting this study, while the most
relevant notions concerning this study are also directed by published research papers,
journals, and books on CRM.

6
1.4.2 Investigational/Empirical Study
1.4.2.1 Study Design
The research design that was employed for this study is descriptive, and the approach
quantitative. Sekaran and Bougie (2013: p.288) state that descriptive studies could be
employed in assisting the researcher in understanding the characteristics of a group in a
given situation and may also enable the researcher to think analytically about factors in
a given situation. This kind of research method is also claimed to be efficient and cost-
effective (Sekaran and Bougie 2013: p.334) and this would be useful considering the
fact that the study was undertaken under limited budget and time.
1.4.2.2 Target Population
WASCO and LEC have on average 300 thousand customers which represent the size
of the population with respect to this study. The target population for this study was the
sizeable representative of utility companies` customers, stakeholders, and employees -
including the following:
Industrial customers: These are different types of factories, breweries, etc.
Commercial customers: These are customers like supermarkets, shopping malls,
car washes, beauty salons, restaurants and banks.
Institutional customers: These are customers like schools and tertiary institutions,
hospitals and clinics, offices/ office buildings.
Domestic customers: These are households that are serviced by both
companies.
The Lesotho Water and Electricity Authority: This is the regulator of both
companies.
Customer care staff of both Companies.
Employees of both Companies; and
WASCO and LEC Top management.
1.4.2.3 Sampling
A non-probability, convenience sampling technique was employed. Sekaran and Bougie
(2013: p.252) explain that this technique is employed where the data or information
could be collected from the sample that is easily accessible to provide such. This

7
technique was employed due to the reason that the total number of the target
population could be very large as both companies are servicing the whole country of
Lesotho. Moreover, this technique guarantees that respondents are willingly providing
the requested data/information and as a result it was expected that it would enhance the
response rates.
1.4.2.4 Target Sample
The targeted sample size was 250 individuals that would be representing the different
categories of the target population highlighted above. At least 30 respondents were
expected to emanate from the following categories: Industrial, commercial, institutional,
domestic customers, and employees of both companies, while the other categories will
be represented by the sample size between 5 and 10. Sekaran and Bougie (2013:
p.269) emphasize that where the sample is divided into different categories, it is quite
imperative that a minimum size for each division is not below 30.
1.4.2.5 Data Collection Technique
The data were gathered from primary and secondary sources. Primary data were
obtained through structured questionnaires that were issued to the target sample
representing the identified target population highlighted above. The questionnaire was
administered by the researcher. On the other hand, the secondary data were gathered
from books, journals, and other forms of publicized periodicals. The primary data were
analysed in view of answering the research questions of this study.
1.4.2.6 Measurement Type
Since respondents were asked to indicate their level of agreement with a given
statement, a rating scale was therefore used as the method of measurement. The Likert
scale was employed in facilitating the measurement process for the reason that it is the
method that aids in ascribing quantitative value to qualitative data, so that it could be
amenable to statistical analysis.
1.4.3 Ethical Considerations
The Researcher kept the following ethical considerations in mind while conducting this
study:
8
Confidentiality with respect to the information gathered from the respondents
shall be upheld.
Respondents will not be coerced to take part in the research.
Respondents will be made to understand the main objective of the study before
they could participate.
Respondents shall remain anonymous.
Misrepresentation of data or information that will be gathered from the
respondents will be avoided at all costs.
1.5 Demarcating the Field Study
This study aims at exploring alternative strategies that could be employed by both
WASCO and LEC in improving on their CRM. The management, employees, and
different categories of customers for both companies will be the target population for
this research. It is highly expected that the research will guide strategy intend of both
companies aimed at improving the CRM.
This study will be undertaken within a ten months period, which is the recommended
period for the MBA field study at the University of the Free State. The field of study is
Business Management.
1.5.1 Chapter outlay Chapter 1
Research Proposal
Chapter 2
Literature review (Secondary data collection) on Customer Relationship Management.
Chapter 3
Research Methodology and conducting research.
Chapter 4
9
Interpretation of the findings on how CRM is perceived in both companies.
Chapter 5
Conclusions drawn based on the findings of the investigations that was conducted with
the aim of achieving both the primary and secondary objectives. Finally,
recommendations that would direct both LEC and WASCO`s Executive Management in
developing and implementing appropriate CRM system and strategies that would
improve their service delivery will be made.
1.6 Conclusion
This study endeavoured to establish how customer relationship management (CRM)
could be best implemented in view of improving WASCO and LEC service delivery.
Furthermore, the extent at which both companies collect, store and manipulate
customer data in order to develop and implement more effective CRM strategies will be
investigated as well as the role played by utilization of CRM in increasing customer
satisfaction. The main reasons for customer complaints will also be identified, and role
played by CRM in addressing these complaints will be established.
Finally, recommendations will be made to guide the Companies` Executive
Management in developing and implementing appropriate CRM system and strategies
that would improve their service delivery and hence assist in profit maximization.

10
CHAPTER 2: LITERATURE REVIEW
2.1 Introduction This chapter of the field study reports on the available research literature on the
different subjects related to Customer Relationship Management (CRM). The main
characteristics of customer relationship marketing are identified and decisively
examined in order to establish their role in building the customer trust. Moreover, the
investigations are aimed at presenting how CRM could aid in improved service delivery.
This chapter also explores all the related literature applicable for this study with respect
to the reasons for customers’ complaints, enhancement of customer satisfaction,
customer loyalty, and establishment of appropriate CRM software that could ease CRM
process implementation.
2.2 Customer Relationship Marketing
Customer Relationship Management (CRM), also called Customer Relationship
Marketing, denotes the entire course of action by which business dealings with
customers are built and retained. CRM is regarded as the strongest and the most
proficient mechanism in sustaining and building relationships with customers (Raab,
Ajami, Gargeya, and Goddard 2010). According to Pedron and Saccol (2009) CRM is
more than just a simple pure business, but it is also considered as a very fruitful
approach that ideates strong personal bonding within people. Pedron et al (2009)
further articulate that the establishment of this form of bonding drives the company to
higher levels of achievement.
On the other hand, Nitzan and Libai (2011) show that once such bonding has been
developed, it becomes easy for a company to see the real desires of customers and
also assist in serving them in a much appreciable and excellent manner. Hinson (2012)
indicates that in recent years, more and more organisations are developing and
implementing customer-focused policies, strategies and technology for enhancement of
CRM. It has, therefore, been established without a doubt that it is highly essential that
companies engage in comprehensive and integrated customer knowledge in order to
create close cooperative and partnering relationships with their customers. In a nutshell,

11
CRM is regarded as an enabler for customer satisfaction, customer loyalty, customer
lifetime value and customer retention (Wieseke, Alavi and Habel 2014:p.24), while in
turn, all these mentioned aspects also create CRM. Most importantly, CRM is regarded
as a fundamental strategy in service quality improvement and profitability (Lovelock and
Wirtz 2011: p. 361).
2.2.1 Importance of CRM
According to Mithas, Krishnan, and Fornell (2005: p. 206), gone are the days when
companies would depend on the existing customers as well as attracting new and more
customers into the loop so as to ascertain that the business flourish. Morgan and Rego
(2006) show that this practice is a predicament in today’s commercial world as
customers are more informed with respect to their rights as far as quality of goods and
services offered by the firms are concerned. Moreover, the business world is now more
competitive than ever before - hence the importance of ensuring that the company has
the competitive advantages that would enable them to stand tall over others, and as a
result receive a better share of the market - which would ultimately lead to improved
profitability.
The development and adoption of a CRM system is therefore regarded as fundamental
in assisting companies in coping with the competitive and challenging markets of recent
days (Morgan and Rego 2006: p. 432). http://managementstudyguide.com (2015) has
identified the following aspects which they regard as of paramount importance to a
company if it adopts CRM:
1. A CRM system entails a chronological outlook and examination of all the
existing or new customers. This assists the company in reduced searching
and correlating customers and to forecast customer wants successfully,
thus improving the service quality and business profitability.
2. CRM advocates for the details of each and every customer of the
company, in order to ease the tracking of customers. These details could
also be used in establishing whether customers are or could be more
profitable to the company so that efforts could be made to bond and retain

12
them with and for the company. Those not profitable could also be
identified through the use of CRM, and reasons for them not being
profitable could be established, and strategies to convert them into being
more profitable developed and put into action.
3. In a CRM system, the categorization of customers is done based on
different aspects that include physical location, and the type of business
they do, and on the basis of that categorization, they are allocated to
different Relationship Managers. This assists the company in putting more
focus on the individual customer needs and expectation, thus enhancing
service quality and customer satisfaction.
4. CRM reduces process time and enhance productivity due to the fact that
the system enables all the customers` details and information to be
accessed promptly at a click of a button. When customers are dealt with
efficiently and their requests are addressed timely, their satisfaction with
the services offered by the firm tends to increase. This increases the
chance of getting more business - which ultimately enhances turnover and
profit. If the customers are satisfied, it is highly probable that they will be
loyal to the company and will also remain in business with them for a long
time resulting in increased customer base and ultimately enhanced net
growth of business.
The most important aspect of CRM is that it becomes very cost-effective in the long run
due to the fact that the system employs paperless technology, which requires reduced
need of paper and human resources - which results in reduced manual work that is
associated with the traditional ways of dealing with customers. The technologies used in
implementing a CRM system are also very cheap and smooth as compared to the
traditional way of business (http://managementstudyguide.com/importance-of-crm.htm
2015). For marketing practitioners, CRM symbolizes a business approach to developing
full-knowledge about customer desires and preferences and to developing and
implementing CRM strategies that give customers confidence to persistently improve
their business relationship with the company (Lovelock and Wirtz 2011: p. 362).

13
Moreover, it is shown that the approach to implementation of CRM can be strategic,
technological, or philosophical (Pedron and Sacool 2009: p. 38).
2.3 CRM Strategy
Strategic CRM puts more focus on the allocation of resources aimed at building and
maintaining relationships with the customers that seem to have a profitable lifetime
value to the company. The strategy centres on the beneficial and proper administration
of customer relationships (Lovelock and Wirtz 2011: p.362). Lovelock and Wirtz (2011)
also state that there are five fundamental business processes that form the integrated
CRM strategy framework, namely Strategy development, Value creation, Multichannel
integration, Performance assessment, and Information Management or Technology
Initiatives.
From the company’s point of view, a CRM strategy framework enables the company to
better comprehend, segment, and rank its customer base; better target promotions and
cross selling; and even implement warning/alert system that indicate if a customer is in
danger of defecting. On the other hand, Lovelock and Wirtz (2011) suggest that from
the customer’s standpoint, a well-implemented CRM system can offer an integrated
customer interface that delivers customization and personalization. This basically
means that at each transaction, the relevant account details, knowledge of customer
preferences and past transactions, or history of a service problem are at the fingertips of
the person serving the customer.
Pedron et al (2009: p.40), on the other hand, reiterates that an ideal CRM strategy
framework should therefore entail the following processes that put more focus on the
beneficial improvement and management of customer relationships. These processes
could be depicted diagrammatically as shown in figure 2.1 below.

14
Figure 2.1: An Integrated Framework for CRM Strategy
Source: Adapted from: Adrian Payne and Paine Frow, “A Strategic Framework for
Customer Relationship Management,” Journal of Marketing 69 (October 2005): 167-
176.
2.3.1 Strategy development
Payne and Frow (2005: p.173) emphasize that a company’s top management’s main
responsibility is to develop a business strategy that would enable the company to
articulate its vision and mission. They further articulate that there should be strategy
alignment between the main business strategy and the CRM strategy. Hinson (2012)
also share the same sentiments by indicating that for a CRM strategy to be successful,
it should be informed by the main business strategy. The CRM strategy should also take
account of how the target market is going to be divided, how the customer base could
be ranked or tiered and how loyalty bonds and churn management could be best
established, thus delivering improved value to the customers (Morgan 2006: p.430).

15
2.3.2 Value creation (Delivering value to the customer)
Value creation is regarded to be the current “in thing” that companies are utilizing to
explain their new strategic direction (Hinson 2012: p. 152). According to Banyte, Tarute
and Taujanskyte (2014: p.572) the emphasis on value and use of expressions that
reveal value has turned out to be the familiar marketing communication message in
most advertising media. With so much emphasis on value creation, it would therefore
be reasonable that companies have a better understanding of what value creation is
and what also produces more value. Jooste, Strydom, Berndt, and du Plessis (2012:
p.382) define value creation as the process of converting the company and customer
strategies into the preferred value intentions.
Mithias et al (2005) indicate that value creation is realized through the improvement of
intangibles. They further argue that it is the duty of the management of companies to
build and protect intangible value as such initiative could lead the company into tangible
value. Companies need to identify their competencies and devise means of applying
these competencies to their advantage so as to create value. These competencies
normally portray the company’s identity and image and as such they define what the
company is good at doing, and ultimately what it is. According to Lovelock and Wirtz
(2011), companies should therefore consider the following aspects that are illustrated in
figure 2.2 below when striving to create value or deliver value to their customers.

16
Figure 2.2: Five Capitals Value Creation Model from intangibles
Source: Adapted from http://www.smarter-companies.com/
The above model illustrates that value could be created by advocating for continuous
improvement in the following aspects of service quality:
1. Strategic Capital: This depicts the purpose of value creation. The sole
purpose of the strategy is to create and distribute the value that
businesses and the customers will consume. Strategic capital is created
by serving the interest of stakeholders through the value created.
2. Structural Capital: This is of utmost importance in enhancing value
creation as without this structural support, value creation could be
infeasible. The most valuable ideas are leveraged through operational
support, design, and scalability. Having the right structural capacity in
place enables the value created to be distributed to all interested
stakeholders.
3. Human Capital: Having the right people thinking about the right things for
the right reasons is the first step in value creation. Trust is at the fore in

17
influencing human capital. Value creation is therefore considered as both
a philosophy and a process that creates value for consumption.
4. Relational Capital: When a Company creates and distributes value, it
creates relational capital. Relationship capital is built through the
awareness and experience of the value created. Awareness and
experience are created through engagement.
5. Natural Capital represents any stock or flow of energy and materials that
produce goods and services. Natural is the basis of the all the activities
that are directed towards value creation because if the natural raw
materials were not available then there would be no reason to be in
business.
On the other hand, Mithias et al (2005) states that the value that is endured by the
customers includes all the paybacks associated with the priority ranked services
allegiance incentives, and customization and personalization. Lovelock and Wirtz (2011)
also indicate that the value produced for the Company has to, amongst other issues of
importance, entail decrease in customer acquisition and cost of retaining such
customers, and improved shared benefits. Such benefits that are endured by the
customers could be communicated to the current and prospective customers of the firm
through multichannel of communication.
2.3.3 Multichannel Communication integration
Marketing communications, in one form or another, are fundamental to a firm`s success
(Kotler and Keller 2012: p.219). A number of communication methods are used by
companies in conveying their messages to their valued customers. These methods
include radio, television, newspapers and e-mails/e-commerce. Ma and Dubé (2011: p.
90) therefore emphasizes that it is imperative that companies should seek to establish a
combined customer interface that delivers customization and personalization. Hinson
(2012) on the other hand, indicates that integrated marketing communications (IMC)

18
advancement conveys improved communication synergies and supports the exclusion
of deceitful marketing communications efforts.
The IMC concept entails a number of tools of marketing communications, such as sales
promotions, personal selling, advertising, sponsorship, event marketing, online
marketing, public relations, social media marketing, and direct and database marketing
(Hinson 2012: p.75). Although IMC is considered to be time-consuming and tiresome, if
implemented religiously it could yield a number of benefits that include the following;
1. It assists companies in establishing competitive advantage.
2. It assists in profit maximization,
3. It assist customers in making informed decisions, thus strengthening the
customer relationship, and lastly,
4. IMC assists firms in improving on their performance and service quality
(Bhuvaneshwari and Sowmya 2013: p.10).
2.3.4 Performance assessment
Kotler and Keller (2012: p.225) emphasize that the process of performance evaluation
should attend to three fundamental areas of CRM strategy:
1. The CRM strategy should be seen to generate value for all the key
stakeholders that include customers, company owners, and all members
of staff of the organization.
2. The issue of attainment of the set marketing objectives with respect to the
set target on acquiring new customers, customer satisfaction and retention
should be highlighted in the CRM strategy. The service performance set
target in relation to call centre service standards should also be put at the
fore of the same strategy.
3. Lastly, the CRM strategy should provide for ways of measuring whether
the whole process of CRM is performing as expected.
Abdullateef, Mokhtar, and Yusoff (2011: p.3) highlight that CRM strategy is considered
to be well inclusive with respect to performance assessment, if the customers and

19
company realize positive value creation, and over and above that, if the information
management system is functioning adequately and it is also being effectively and
efficiently incorporated across all the customer-service stations.
2.3.5 Information management or technology initiatives
Lovelock and Wirtz (2011) state that service delivery depends on the company`s
capacity to gather customer information, incorporate it with other applicable information,
and ensure that these applicable information is at the disposal of the frontline staff at the
different customer-service stations at all times. On the other hand, Wieseke et al (2014)
show that the information management process covers the customer data warehouse,
IT systems, analytical tools - which include data mining software, and more specific
application packages such as campaign management analysis, credit assessment,
customer profiling, churn alert systems, and even customer fraud detection and
customer contact, including sales force automation and call-centre management
applications, and back office applications which support internal customer-related
processes including logistics, procurement, and financial processing.
This can result in a huge service improvement and increased customer value. However,
this could be achieved if the firm has invested in very sound CRM technological system
that is user friendly to all its users.
2.4 CRM as a Technological tool
The use of technology advancement to facilitate speedy business transactions has
become a norm in today’s business world. When CRM is used as a technological tool, it
improves business processes and smooths communication between all the sections
that have a stake in a customer’s transaction (Bhuvaneshwari and Sowmya 2013: p.13).
Bhuvaneshwari and Sowmya (2013) further show that the constant utilization of a CRM
software system has a positive effect on CRM performance. They suggest that when
the system is more inclusive in terms of the information that could be generated by it,
and it is also highly utilized, it could yield better performance across all the stages of the
customer lifecycle. This avers the fact that CRM technology plays a very fundamental
role in customer relationship performance or quality.

20
Equally, Abdullateef, Mokhtar, and Yusoff (2011: p.4) argue that if CRM is competently
administered, it could assist the firm in dealing with the customers` inquires and
complaints more promptly with correct and well-timed information that would help in
decreasing customer-care staff role stress, and consequently increasing staff job
engagement that forms part of CRM philosophy, improved service quality, and customer
loyalty.
2.5 CRM Philosophy CRM philosophy advocates the building of long-term relationships with customers and
maintenance of such relations, which in the end would enhance customer loyalty
(Pedron et al 2009: p.38). The successful implementation of CRM could only be
achieved if the company have highly engaged and committed customer-centric
employees who understand their roles very well. CRM can be fruitless when a limited
number of employees are committed to the initiative; thus, employee engagement and
change management are essential issues in CRM implementation (Payne and Frow
2005: p.167). Pedron et al (2009) also state that this philosophy is expected to direct the
firm`s functional strategies.
2.5.1 Employee engagement
It is stated that about 30 years ago, the customer was merely regarded as a subject to
be obtained and cashed in on all his funds. The employee was not regarded as an
asset, but rather an expense. And management's concept of employee engagement
was "follow the rules or get fired". No one spoke about employees as talent and
customers as advocates and brand ambassadors (Jooste et al 2012: p.381). However,
when time evolved, and the business world became more turbulent and competitive, the
importance of both the customer and the employee were then realized. It became more
apparent that the customer experience with the organization was based on two pillars,
namely business processes and frontline employees` attitudes (Arussy 2012: p.1).
Arussy (2012) further argues that companies more often than not are interested in
injecting more capital in technological instruments that enhance response time,
organized customer database, and innovative products, yet very few take cognizance of

21
the fact that employee attitudes play a fundamental role in this regard. Without reliable
frontline staff that is highly motivated and willing to serve customers, no technological
instruments would be good enough to satisfy the customers and thus straining the
pillars of CRM (Driggs and Porter 2013: p.5).
On the other hand, Hinson (2012) indicates that for companies to endure a successful
implementation of CRM, they should ensure that their employees that are in contact
with the customers on a daily basis are well trained and engaged. Benjamin, Yuan and
Lin (2012: p.8) reiterate that engaged employees exhibit superior drive, commitment,
and fascination in their work, and that should show evidence of enhanced service
performance because they are paying attention on their responsibilities and tasks.
Highly engaged employees are more likely to truly demonstrate helpful sentiments when
dealing with customers (Sanchez-Franco and Rondan-Catalun 2010: p.18).
Lovelock and Wirtz (2011) emphasize that it is important that companies introduce
models that constantly measure employee engagement, and whether employees are
making a positive difference with each interaction. Companies also require a strategy
that at the same time looks into assessing current employee engagement drivers and
customer engagement drivers and aligning them with the CRM strategy and the main
business strategy (Wieseke, Alavi, and Habel 2014: p.8). It is therefore highly
imperative that companies invest not only in the enhancement of business processes to
deliver services to customers, but also in the engagement of their employees in that
process as employees play a vital role in the enhancement of service quality and could
also determine the company’s success or failure with every customer interaction.
2.6 Customer Service Quality
2.6.1 Customer Service Quality Perception
Customer service quality could be viewed and defined in different perspectives
depending on the type of business (Ma and Dube 2011: p. 85). According to Zeithaml et
al (2009), service quality could be categorized into four perspectives which are
transcendent, manufacturing-based, user-based, and value-based.

22
2.6.2 Dimensions of service quality
Zeithaml et al (2009) are quoted by Lovelock and Wirtz (2011) as having undertaken a
detailed field study on service quality and concluded that there are five broad
dimensions that are used by customers in assessing service quality. These dimensions
are tangibles, reliability, responsiveness, assurance, and empathy.
1. Tangibles: This dimension addresses factors related to appearance of
facilities, equipment, frontline staff, and communication methods/style.
According to Arussy (2012) customers’ evaluation basis on service quality
starts with the attractiveness of the service provider’s facilities, e.g. dress
code of frontline staff, office/reception environment, and communication
methods used to convey critical information to the customers.
2. Reliability: This dimension deals with the capability of the firm in carrying
out the guaranteed service unfailingly and correctly. For instance, the
customer would appreciate to be conducted if the firm is not able to
provide the service on the promised date. Customers also appreciate if the
communiqué from the firm is timely and free of errors.
3. Responsiveness: This includes willingness and ability of the firm`s
frontline staff in assisting the customers and also in offering timely service.
Tripathi (2014) shows that when a company’s services are reliable,
customer satisfaction and loyalty increases. He further states that
customers are always keen to see their problems being resolved promptly,
and they also get satisfied if the frontline staff seems to be willing and able
to give convincing responses to their questions related to the service
offerings.
4. Assurance: This dimension of service quality deals with four
characteristics of service quality, namely credibility, security, competence,
and courtesy. The customers ask the following questions when evaluating
the service provider’s assurance:
o Does the service provider possess an acceptable reputation?

23
o Does the service provider guarantee its job?
o Can I be confident that the service costs cover all the expected aspects of
such service?
o Can the frontline staff of the service provider process my transaction
without mistakes?
o Does the frontline staff seem to be knowledgeable?
o Is the frontline staff polite, friendly, and respectful?
5. Empathy: This dimension assess the firm’s capability in addressing the
customers’ demands related to access, communication, and
understanding and knowing the customer`s needs. Hinson (2012) notes
that customers appreciate firms that have managers that are
approachable and easy to access if needs be. He further shows that
customers also get impressed if the firm listens and keeps them informed
through easily accessible communication media and in language that they
could easily understand. According to Kotler and Keller (2012) it is
imperative that service providers strive to know and understand their
customers so that the customers could be categorized accordingly. They
further state that if service providers know their customers, it becomes
easier for them to address all the problems related to the service quality
as they would be able to tailor resolutions based on the needs of specific
segment of customers.
2.6.3 Service quality challenges/problems
Zeithaml et al (2009) is quoted by Lovelock and Wirtz (2011) as having acknowledged
six probable loopholes that could be encountered within the service firms, and that may
result in a disparity between the expected service quality by the customer and what
customers believe to have been delivered. These six gaps are illustrated as adapted
from Zeithaml et al (2009) in figure 2.3 below. Banyte et al (2014) show that the six gap
model fits into the company’s CRM strategy framework model by addressing the aspect
of performance assessment process. When devising strategies that could be employed
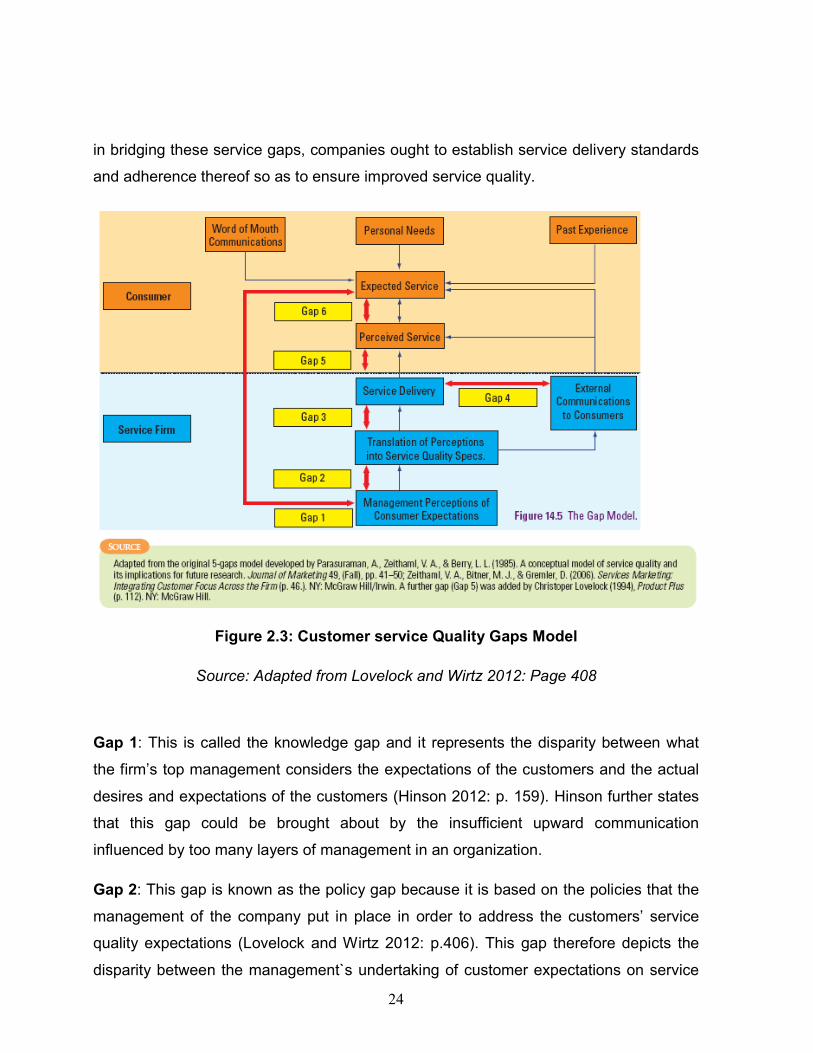
24
in bridging these service gaps, companies ought to establish service delivery standards
and adherence thereof so as to ensure improved service quality.
Figure 2.3: Customer service Quality Gaps Model
Source: Adapted from Lovelock and Wirtz 2012: Page 408
Gap 1: This is called the knowledge gap and it represents the disparity between what
the firm’s top management considers the expectations of the customers and the actual
desires and expectations of the customers (Hinson 2012: p. 159). Hinson further states
that this gap could be brought about by the insufficient upward communication
influenced by too many layers of management in an organization.
Gap 2: This gap is known as the policy gap because it is based on the policies that the
management of the company put in place in order to address the customers’ service
quality expectations (Lovelock and Wirtz 2012: p.406). This gap therefore depicts the
disparity between the management`s undertaking of customer expectations on service

25
quality standards and what is the actual desires and expectations of the customers. This
is regarded as the sign of poor commitment to service quality by some organisations
and also insufficient activity standardizations. Tripathi (2014) recommends that
performance standards should be established to eliminate this gap.
Gap 3: This is also called the delivery gap and it depicts the disparity between service
specifications and service delivery. According to Kotler and Keller (2012) this occurs
due to poor supervisory controls and lack of teamwork, vagueness and inconsistency of
roles, poor CRM software or employee job fit. An employee may not possess the
requisite knowledge or skills required to suit the specified principles. Moreover, there
might be the unavailability of a service plan to indicate undoubtedly distinct functions of
who performs what, when and how; and even what to do when some predictable
setbacks occur.
Gap 4: This is called the communication gap and it represent the disparity between
what the firm communicates to its customers and what it actually delivers to the
customers. Hinson (2012) indicates that firms have a tendency to over promise through
the messages they convey in their advertisements and under deliver when it comes to
the actual service delivery.
Gap 5: This is known as the perception gap and it deals with the disparity between what
is actually delivered to the customers and what the customers observe to have received
from the firm. Since customers’ judgments of the service quality are more often than not
subject to past experiences, word of mouth references and the extent of individual
requirements, gaps are derived from the underperformance of the service firm in
contrast with the expectations of the customer. A customer might get the wrong
impression about the service quality and, in this case, have a negative opinion of that
service (Lovelock and Wirtz 2011: p.408).
Gap 6: The service quality gap is the disparity between what customers look forward to
get and their judgment with respect to the quality of service that in reality is delivered.
Gap 6 is the accumulated outcome of all the preceding gaps. It will be closed when gap
1 to 5 have been addressed.

26
2.6.4 Strategies for customer service quality improvement
The service quality gaps in the midst of service delivery, in one way or another are
detrimental to the relationships with customers and therefore need to be addressed in a
very strategic manner if the service provider aspires to improve on its service quality
thus increasing customer satisfaction (Ma and Dube 2011: p. 90). Payne and Frow
(2005) emphasize that enhancement of service quality requires identification of the root
causes of each service gap, followed by the development of appropriate strategies
aimed at closing these gaps. Table 2.1 below depicts an abridged series of broad
recommendations for closing the above explained six service quality gaps.
Table 2.1: Recommended strategies for closing service quality gaps
Service Quality Gap Proposed Strategy for closing the gap
The Knowledge Gap (Gap 1)
Management need to be trained on the
expectations of the customers, and in
order to achieve this, the management
should implement the following strategies:
o Customer surveys should be undertaken
regularly and they should employ research
methods like questionnaires and
interviews. The questions should be
structured in such a manner that they
would address the most critical aspects of
the type of service delivered by the firm.
o The service firm should put into operation
an efficient customer feedback system that
would amongst other areas of importance
in the service quality, include customer
satisfaction research, analysis of launched
complaints, and customer sections.
o Ease and promote contact between
management and frontline staff.
o Enhance contact between management

27
and customers.
The Policy Gap (Gap 2)
Management should develop appropriate
service business processes and standard
operating procedures, and they should
address the following issues of service
quality:
o Get the customer services right.
o Design customer service processes that
are customer centric.
o Establish ranked service products that suit
different customers’ expectations.
o Place, communicate, and strengthen
quantifiable customer oriented service
standards for all the elements of the job.
The Delivery Gap (Gap 3)
Management should ascertain that the
performance matches the set standards
and that the customers appreciate the
level of quality that is delivered by the firm.
This could only be achieved if
management;
o Could strive to keep the customer service
staff highly motivated and therefore able to
achieve the set service standards.
o Train employees on the technical and soft
skills and soft skills needed to perform their
assigned tasks effectively, including
interpersonal skills, especially for dealing
with customers under stressful conditions.
o Install the right technology, equipment,
support processes and capacity.
o Manage customers for service quality.
o Educate the customers so that they could

28
perform their role and responsibilities in
service delivery effectively.
The Communications Gap (Gap 4)
Management should address the issue of
internal communications gap by striving to
ascertain that the promises made through
communications channels like
advertisements are realistic and rightly
appreciated by customers. This could be
achieved by implementing the following
strategies:
o Train managers responsible for sales and
marketing communications about
operational capabilities.
o Ensure that communications content sets
realistic customer expectations.
o Be specific with promises and manage
customers` understanding of
communication content.
The Perception Gap (Gap 5)
Tangibilize and communicate the service
quality delivered.
o Make service quality tangible and
communicate the service quality delivered.
The Service Quality Gap (Gap 6)
Gap 6 is the accumulated outcome of all
the preceding gaps. It will be closed when
gaps 1 to 5 have been addressed.
Source: Adapted from Lovelock and Wirtz 2012: Page 410

29
2.6.5 Complaint Handling and recovery procedures
Hinson (2012) defines customer complaint as an expression of discontent about the
quality of service or action by a firm, affecting an individual or group of customers.
Customers will always complain if the service firm does not strive to bridge the service
quality gaps discussed in the above section. Some of the reasons that cause customer
complaints include failure to inform customers of service interruptions, delays in delivery
of promised services, rudeness when responding to customer queries,
discourteousness, and incompetency of the service staff.
Complaints are considered as a very helpful mechanism for getting customers’ views
regarding services provided by the service provider (Mithas, Krishnan and Fornell 2005:
p.202). Complaints are also appreciated due to the fact that they enable the service
company to realise its weak spots in service delivery and recognize areas for
developments, and also assist companies in displaying high level of customer care in
resolving issues. Therefore, in handling the complaints, managers should endeavour to
address the following questions:
What causes customers to complain?
What proportion of unhappy customers complain?
Why don’t unhappy customers complain?
Who is most likely to complain? and
Where do customers complain?
Following addressing these questions, management should put in place a service
recovery system that should deal with the unsatisfactory experiences with the aim of
restoring the good image of the firm. Tax and Brown are quoted by Lovelock and Wirtz
(2011) as having established that eighty five percent of the variation in customer
satisfaction regarding service recovery was based on three dimensions of fairness as
illustrated in the figure 2.4 below.

30
Figure 2.4: Complaint handling and service recovery process
Source: Adapted from Lovelock and Wirtz 2011 Page 375
Procedural justice: This deals with the set firm’s policies and procedures that
each and every customer have to go through in the process of seeking service
fairness. In this whole process, the expectation of the customer is that the firm
will assume the responsibility which is fundamental for commencement of a fair
procedure, followed by the suitable and responsive recovery system.
Interactional justice: This addresses the conduct and responses of the
employees of the service provider towards the customer. It is essential that the
employees provide the customers with convincing explanations for service
failures and should also appear to be proactive in resolving the service problems.
Outcome justice: This concerns compensation a customer receives as a result
of the losses and inconveniences incurred because of a service failure.
Tripathi (2014) emphasize that it is the duty of the firm`s management to have a full
understanding of the complaining behaviour of the customers so that they could be able
to devise appropriate strategies that would eliminate such complaints thus increasing
customer satisfaction.

31
2.7 Customer Satisfaction
Lovelock and Wirtz (2011) state that the strong source for loyalty is anchored in
customer satisfaction. Customer satisfaction has major repercussions for the money-
making performance of companies (Mithas, Krishnan and Fornell 2005: p.202). Mithas
et al (2005) again suggests that it has been established that customer satisfaction could
negatively affect customer complaints, while on the other hand usage behaviour and
customer loyalty could be positively affected. Customer satisfaction could also decrease
expenses associated with guarantees, complaints, malfunctioning supplies, and service
expenses (Hinson 2012: p.152).
When customers are satisfied with products or services that are offered by the firm, they
become good ambassadors in that they spread a positive word of mouth about that
particular firm. According to Pedron et al (2009) dissatisfied customers, in comparison,
pushes customers away and that is a fundamental aspect in switching conduct. Fornell
(2005) is quoted by Lovelock and Wirtz (2011) as having pointed out that the escalation
of customer satisfaction could also result in escalation in share prices. Zeithaml et al
(2009) illustrate that there is a direct relationship between customer satisfaction and
customer loyalty. They go further to show that this relationship could be separated into
three main sectors as shown in figure 2.5 below.
Figure 2.5: The Customer Satisfaction – Loyalty Relationship
Source: Adapted from Lovelock and Wirtz 2011 Page 351

32
2.7.1 Deflection Zone
At this zone, the customer satisfaction level is low, and it is at this stage where it would
be found that customers would prefer to switch unless the switching costs would appear
to be elevated, or there seems to be no suitable substitutes that they could switch to.
According to Tripathi (2014), dissatisfied customers could turn into terrorists in that they
could spread a lot of negative criticism and word of mouth about the service provider.
2.7.2 Indifference Zone
At this zone, the customer`s satisfaction and dissatisfaction levels are somehow
balanced. The customer at this zone is partly satisfied by other offerings of the firm,
while on the other hand he is also not satisfied in one way or another.
2.7.3 Affection Zone
This is an ideal zone that firms should strive to operate in if they aspire to remain
competitive and to realize satisfactory returns on their investments. Customers at this
zone are highly satisfied with the firm’s offerings - so much so that their attitudinal
loyalty is also positively elevated. The end result of customers at this zone is that they
do not consider switching and they also spread the positive word of mouth to the public
about the firm`s offerings. Hinson (2012) refers to such customers as “Apostles” due to
the fact that they preach a positive word of mouth about the firm. High satisfaction leads
to higher customer loyalty and improved future company`s performance (Tripathi 2014:
p.124).
2.8 Customer Loyalty
The high value brought by loyal and repeat business is highly appreciated by today’s
global business (Wieseke, Alavi, and Habel 2014: p.17). Wieseke et al (2014) further
state that “the longer a company keeps a customer, the more money it stands to make”.
In recent years, the subject of customer loyalty is dealt with frequently due to the fact
that it has been realized that customer loyalty has a positive impact on the firm’s bottom
line (Morgan and Rego 2006: p.427). Guadagni and Little (2008: p.41) show that
customer loyalty also results in customers who are less sensitive to price due to the

33
loyalty that they have developed towards the company, which results in higher price
levels for products and services.
Customer loyalty could be achieved through the engagement of the marketing
philosophy known as customer loyalty wheel (Lovelock and Wirtz 2011: p.345). Figure
2.6 below demonstrates how customer loyalty could be achieved and maintained by
implementing three service marketing declarations and these are:
Build a foundation for loyalty,
Create loyalty bonds, and
Reduce Churn Drivers.
Figure 2.6: Customer loyalty wheel
Source: Adapted from Lovelock and Wirtz 2011 p.345

34
2.8.1 Loyalty foundation building
According to Raab et al (2010) market segmentation and positioning play a crucial role
in creating everlasting customer relationships and loyalty. Morgan and Rego (2006) add
to this by stating that the best foundation of loyalty management is the identification and
targeting of the correct customers. Organisations therefore ought to be discriminatory
about the parts of the market they intend to attract if they aspire to build and maintain
successful customer relationships (Tripathi 2014:p.127).
It is also crucial for marketing managers of organizations to ensure that the targeted
customers are synchronized with the company’s capabilities. They are also required to
take into consideration the fact that their service employees would need to deal with
expectations from specific types of customer, and as such their personalities and
technical proficiency would be vital. The effect of cautiously aiming at customers by
synchronizing the firm’s capabilities and power with the requirements of the customer,
needs to be an excellent service offerings in the eyes of those customers who value
what is put forward by the firm (Lovelock and Wirtz 2011: p.346). Firms therefore ought
to put in place strategies aimed at extending loyalty bonds with the customers.
2.8.2 Loyalty bonds Creation
Firms need to put strategies in place that could assist them in bonding with their loyal
customers (Moore, Ratneshwar, and Moore 2012:254). According to Lovelock and Wirtz
(2011), there are three bond strategies that could be employed by firms in an endeavour
to maintain the loyalty of their customers:
Relationship strengthening,
Development of loyalty rewards, and
Establishment of supplementary bonds.
2.8.2.1 Relationship strengthening
Customer relationships could be strengthened through service bundling and cross-
selling strategies (Guadagni and Little 2008: p.34). Bundling is defined as the
combination of two or more products/services with a reward benefit for the customer
35
that decides to receive that combined product/service set. The rewards associated with
bundling enhance customer trust and loyalty (Tripathi 2014: p.120).
2.8.2.2 Development of loyalty rewards
Service providers could develop loyalty programmes that are aimed at retaining loyal
customers, thus increasing the share of wallet. The program could entail financial or
non- financial rewards (Morgan and Rego 2006: p.426). Financial rewards are customer
enticements that have monetary value attached to them; while on the other hand, non-
financial rewards do not have monetary value attached to them. Examples of non-
financial rewards could include giving loyal customers a priority in queuing for any kind
of service with the service firm, a special treatment as a way of thanking them, and also
special recognition and appreciation.
2.8.2.3 Establishment of supplementary bonds
Hinson (2012) states that reward-based loyalty programmes are copied easily by other
service providers and as such do not offer a sustainable competitive advantage. He
goes on to show that in comparison, supplementary bonds have a propensity to provide
an extra, continued competitive advantage, and include social bonds, customization
bonds, and structural bonds.
Social bonds exist when the customer and the service provider’s frontline staff know
each other well and there is mutual trust between both parties. On the other hand,
customization bonds are established when the service firm thrives in offering
customized service to its loyal customers. These positive benefits of customer loyalty
are commonly associated with customer satisfaction, customer retention, positive word
of mouth and repeat business, all of which prospectively result in improved revenue and
profitability/customer lifetime value.
2.8.3 Churn Drivers reduction
According to the study conducted by Yoon C. Cho (2012), people make a decision to
switch from one service provider to another due to several reasons that include
dissatisfactory service encounters, unfair pricing, poor response to service failure, and

36
inconvenience with respect to location, time, or delays. It is, therefore, very important
that firms conduct churn diagnostics on regular bases so that the customer churn
behaviour could be realized well in time and be dealt with accordingly.
The churn drivers could be dealt with positively by implementing the following
strategies:
By implementing effective complaint handling and service recovery procedures,
and
By escalating switching costs.
When customers’ complaints are handled efficiently and there are also clear procedures
put in place for service recovery, customers tend to be satisfied and loyal to the service
firm. Again, customers tend to make informed decisions regarding switching from one
service provider to another, and therefore if the switching costs are high, it is highly
likely that they will prefer to remain with the current service provider provided they
receive quality service. Customer loyalty leads to improved customer lifetime value.
2.9 Customer lifetime value
In relationship marketing, the customer is regarded as king and if treated accordingly,
they tend to be loyal and remain longer with the service firm - thus increasing the firm`s
profitability (Banyte, Tarute and Taujanskyte 2014: p.574). Once loyalty has been
affirmed, the purchases and payments increase. This results in the reduction in
operating costs due to the fact that loyal customers are normally experienced customers
and therefore require less costs and associated attention from the service provider and
they also have less operating mistakes that would require assistance from the service
provider.
Zeithaml et al (2009) indicate that service firms should strive to build customer loyalty
as the lifetime value of such customers include referrals and positive word of mouth,
which saves firms from investing on promotions and advertising. He goes on to show
that long-term customers are mostly willing to pay price premiums, especially during
peak periods, because they are satisfied with the services rendered to them and they
also have trust in the service firm`s endeavours in service provision.

37
On the other hand, Hinson (2012) states that the profit impact of a customer differs
depending on the phase of service in the product or service life cycle. For instance, bad
referrals and negative word of mouth would have a higher impact in the early stages of
the service or product life cycle. It is, therefore, fundamental for a service provider to
determine costs and revenues for customers from different market segments within the
target market at different positions in their customer lifecycles in order to establish
accurate future profitability prediction.
2.10 Customer Retention
The aggressive competitive arena in which businesses are operating in recent times
has made firms realize the importance of retaining their customers. Customer retention
is considered a fundamental aspect of customer lifetime value, which is positive power
of increase in investor worth (Jooste et al 2012: p.483). Jooste et al (2012) further
argue that since wooing a new customer is a costly process, which could approximately
amount to five times as much as retaining the existing customer, it would then make
well-considered business sense to develop and implement superior customer retention
strategies.
Customer retention is mainly driven by three factors: customer loyalty, calculative
commitment, and affective commitment. In relationship marketing terminology,
commitment is defined as an aspiration to maintain a relationship (Nitzan and Libai
2011: p. 30). Calculative commitment is the colder, or more rational, economic based
dependence on product benefits due to a lack of choice or switching costs. Affective
commitment is a hotter, or more emotional, factor that develops through the degree of
reciprocity or personal involvement that a customer has with a company, which results
in a higher level of trust and commitment which is the core objective of CRM.
2.11 Conclusion
CRM could be used by service firms in improving their return on investment. This is the
result of the importance of good relations between the customers and the firm due to
the fact that such relationships facilitate customer satisfaction and loyalty, which
ultimately result in customer lifetime, trust, commitment, and the firm’s profitability as

38
well. It is evident from the literature on the subject of CRM that service firms have to go
extra mile in establishing excellent relationships with their customers if they aspire to
remain competitive and profitable.
In this chapter, the exposition covered how CRM could be best implemented in view of
improving service delivery. The importance of CRM strategy alignment with the
organizational strategy was also looked into. Moreover, the different roles played by the
employees and technological tools in the implementation of CRM were explored. The
improvement of service quality aimed at enhancing customer satisfaction, customer
loyalty and customer lifetime value were also explored. Furthermore, the main reasons
for customer complaints were identified, and the role played by CRM in dealing with
these complaints established. Finally, the importance of customer retention was also
discussed. The next chapter explicates the research methodology employed to
undertake this field study.

39
CHAPTER 3: RESEARCH METHODOLOGY
3.1 Introduction
The purpose of this chapter is to elaborate on the research methodology that was
employed in undertaking this field study. The subsections in this chapter are comprised
of the research design, the sampling strategy, statistical analysis, the data collection
technique, the research ethical considerations, and the demarcation of the field study.
The research methodology outline as espoused for this research enabled the
researcher to utilize the information gathered from the literature review in a survey for
the purpose of investigating the main drivers of CRM implementation and optimization
with the view to service delivery/quality improvement. It was thereafter established how
these drivers could be engaged in improving service quality in two Lesotho utility
companies, namely Water and Sewerage Company (WASCO) and Lesotho Electricity
Company (LEC).
3.2 Research Design
The research design provides a researcher with an outline for the gathering,
measurement, and assessment of the necessary facts and data geared towards
achieving the set primary and secondary objectives of the field study. The preferred
research design in this particular research was indicative of a series of domino effects
concerning the aspects of the research method precedential for a specific field study.
Such aspects comprise the field study rationale, the background to the research, the
field study strategy, the degree of researcher involvement, the time-related aspects and
the magnitude at which the gathered data were evaluated and interpreted (Sekaran and
Bougie 2013: p. 95).
According to Sekaran and Bougie (2013: p. 95), there are three research intentions
within the framework of research design and those are descriptive, exploratory and
causal studies. The research design that was employed for this study was descriptive
and the approach was quantitative. Descriptive studies are normally intended to gather

40
data that define the characteristics of people, procedures or conditions (Sauders, Lewis,
and Thornhill 2012: p.171). Sekaran and Bougie (2013: p.97) further advise that
descriptive studies could be employed in assisting the researcher to understand the
characteristics of a group in a given situation and they may also enable the researcher
to think analytically about factors in a given situation.
This kind of research method is also claimed to be efficient and cost-effective (Sekaran
and Bougie 2013: p.97) and this was found to be useful due to the fact that the research
was to be completed within a limited timeframe and minimal budget. The quantitative
approach that was employed in undertaking this study is defined as the method that
gives more focus on collecting statistical data and generalizing it across specified
categories of people so as to clarify a specific observable fact (Muijs 2010: p. 334).
Saunders et al (2012: p. 162) indicate that the overarching objective of a quantitative
approach is to categorize factors, count them, and create statistical models in an effort
to explicate what was observed.
3.3 Sampling Strategy
3.3.1 Target Population and Sample frame
The sample frame is defined as the representation of all the subjects in the population
from which the sample is drawn (Babbie 2010: p.170). WASCO and LEC have on
average 300 thousand customers which represent the size of the population with
respect to this study. The target population for this study was the sizeable
representative of utility companies’ customers, stakeholders, and employees - which
included the following:
Industrial customers: These included different types of factories (wet and dry
industries), and breweries.
Commercial customers: These included customers like supermarkets, shopping
malls, car washes, beauty salons, restaurants, and banks.
Institutional customers: These included customers like schools and tertiary
institutions, hospitals and clinics, and offices/ office buildings.

41
Domestic customers: These included households that are serviced by both
companies.
The Lesotho Water and Electricity Authority (LEWA): This is the regulator of both
companies.
Customer care staff of both companies
Employees of both companies, and
WASCO and LEC Top management.
According to Segaran and Bourgie (2013: p. 269), where the sample is divided into
different categories, it is quite imperative that a minimum size for each division is not
below 30. Based on this fact, the number of questionnaires that were dispatched to the
Industrial, commercial, institutional, domestic customers, and employees of both
companies were 40, and at least 30 respondents were received from each category.
The other categories - which include WASCO and LEC top management, LEWA and
the customer care staff of both companies - were represented by the sample size
between 5 and 10.
3.3.2 Sample Design
A non-probability, convenience sampling technique was employed. Sekaran and Bougie
(2013: p.252) state that in non-probability sampling design, the factors in the selected
sample do not possess any probability attached to their being selected as sample
elements, while on the other hand, the convenience sampling technique is employed
where the data or information could be collected from the sample that is easily
accessible to provide such. This technique was employed due to the fact that the total
number of the target population could be very large as both companies are servicing the
whole country of Lesotho. Moreover, this technique guarantees that respondents were
willingly providing the requested data/information and as a result the expectation was
that it would enhance the response rates.

42
3.3.3 Target Sample size
The targeted sample size was 250 individuals that were representing the different
categories of the target sample population highlighted above.
3.4 Data Collection Technique
According to Zikmund, Babin, Carr, and Griffin (2010), a quantitative study design
comprises primary data collection and examination that entail statistical measurement
and evaluation in attending to both the primary and secondary objectives of the field
study. Consequently, Sekaran and Bougie (2013) show that data collection techniques
that could be employed in undertaking field studies include questionnaires, structured
and unstructured interviews, unobtrusive methods, and physical measurement.
For the purpose of this particular field study, the data were therefore gathered from
primary and secondary sources. Primary data were obtained through structured
questionnaires that were issued out to the target sample representing the identified
target population highlighted above.
The questionnaire was administered by the researcher in that all of them were delivered
to the different categories of the target sample by the researcher herself. The
researcher held meetings with the target sample and explained the purpose and
objectives of the study prior to giving out questionnaires. In these meetings, the dates
for the collection of the filled questionnaires were also agreed upon, and the researcher
collected them by herself. On the other hand, the secondary data were gathered from
the books, journals, and other forms of publicized periodicals. The primary data were
analysed in view of addressing the objectives of this study.
The questionnaire development was based on the identified problem statement, the
literature review, the primary objective of the field study as well as the secondary
objectives. The questionnaire was divided into three sections and each section was
meant to address specific questions related to specific research questions. The sections
were structured as follows:

43
Section 1: Dealt with the consumers’ perception of WASCO and LEC service
delivery, quality and existing complaint management system efficiency. The
section was divided into two subsections. Each of the subsections was talking to
the consumers’ perceptions of each organization in isolation of each other.
Section 2: Dealt with Executive management and frontline staff commitment to
CRM as well as the existing CRM system.
Section 3: Dealt with the level of customer satisfaction and loyalty in both
organizations.
3.5 Measurement Type
The rating scale was used as the method of measurement, and the Likert scale was
employed in facilitating the measurement process. Sekaran and Bougie (2013: p. 211)
define a scale as a means by which people’s perceptions are differentiated from one
another on the variables of interest to the specific study. The Likert scale is thus
intended to observe how weakly or strongly respondents agree or disagree with
statements on a five-point scale.
3.6 Statistical Analysis
3.6.1 Coding data
After the questionnaires were received by the researcher, the responses emanating
from those questionnaires were coded and categorized accordingly. Data coding entails
giving a number to the respondents’ answers so they can be entered into a database
((Sekaran and Bougie 2013: p.276). Sekaran and Bougie (2013: p. 276) go further to
explain that this method, in comparison to flipping through each questionnaire for each
item, is considered to eliminate confusion, particularly in studies where there is a high
number of respondents. After the data were entered into a database, some editing was
performed in order to address the illogical, inconsistency, and omissions done by the
respondents.

44
3.6.2 Getting a feel for the data
The initial feel for the data under analysis was then acquired through generating the
visual summary. The mode, median, mean, standard deviation and variance were
generated so as to establish how the respondents had reacted to the statements in the
questionnaire.
3.6.3 Data display and analysis
The frequencies and the measure of central tendency were obtained for the purpose of
measuring the dependent and independent variables. Histograms, pie charts, and bar
charts were used to display the frequencies and also to assist in making the data to be
easily understood. On the other hand, the mean, and the factor value were used as the
measures of central tendency. A Pearson correlation matrix was also used for the
purpose of obtaining the direction, strength, and impact of the identified variables with
the objective of defining the observed relationships amongst them.
3.7 Ethical Considerations
Ethics in a field study presents acceptable principles or anticipated public standards of
conduct while conducting research (Sekaran and Bougie 2013: p.13). They further
indicate that ethical comportment should always pervade every step of the field study
process. The Researcher therefore adhered to the following ethical considerations while
conducting this study:
Confidentiality with respect to the Information gathered from the respondents was
upheld.
Respondents were not coerced to take part in the research.
Respondents were made to understand the main objective of the study before
they participated.
Respondents remained anonymous.
Misrepresentation of data or information that was gathered from the respondents
was avoided in all costs.

45
3.8 Demarcating the Field Study
This study aims at exploring alternative strategies that could be employed by both
WASCO and LEC in improving on their CRM. The management, employees, and
different categories of customers for both companies constituted the target population
for this research. It is highly expected that the research could guide strategy intend of
both companies aimed at improving the CRM. This study was undertaken within a ten
months period, which was the recommended period for the MBA field study at the
University of the Free State. The field of study is Business Management.
3.9 Conclusion
The purpose of this chapter was to elaborate on the research methodology that was
employed to collect, manipulate, and analyse the necessary data to meet the primary
and secondary objectives of this research. The subsections that were covered under the
methodology included the research design, the sampling strategy, statistical analysis,
the data collection technique, the research ethical considerations and the field study
demarcation. The motivation and discussions surrounding the chosen research design
were also set forth in this chapter. The next chapter of the research will therefore
elaborate on the analysis, interpretations and discussions of the gathered data.

46
CHAPTER 4: RESEARCH FINDINGS AND ANALYSIS
4.1 Introduction
The research design defined in the previous chapter is employed in this chapter. The
data gathered from all the categories of the respondents by means of the self-
administered questionnaires is presented, evaluated, and construed utilizing the
methods described in the research design. A total of two hundred and fifty
questionnaires were disseminated to the eleven different categories of the sample
population. One hundred and ninety three questionnaires were filled and returned thus
representing seventy seven (77) per cent response rate. This is represented in a tabular
form in table 4.1 below.
This chapter contains presentation of biographical data of both utility companies’
customers and data on customers’ perception of service delivery quality in companies,
executive management and frontline staff of both companies commitment on CRM, and
Customer Satisfaction and Loyalty of both companies’ customers.
4.2 Characteristics of both utility companies’ customers
The field study results on the information relating to the individuality of the customers of
the Lesotho utility companies are presented in this section. This is prepared by means
of a frequency distribution table and a pie chart presented below.

47
Table 4.1: Frequency distribution of Lesotho utility companies’
customers/respondents
Type of Utility companies’
customers
Frequency of
Respondents
% Respondents
Industrial customers
26 13
Commercial Customers 22 11
Institutional Customers 15 8
Domestic customers 30 16
WASCO Employees 40 21
LEC Employees 30 16
LEWA Employees 6 3
WASCO Frontline Staff 10 5
LEC Frontline Staff 7 4
WASCO Top Management 4 2
LEC Top Management 3 2
Total 193 100%
Figure 4.1: Lesotho utility companies’ customers/respondents
13%
11%
8%
16%21%
16%
3%5%
4% 2% 2%
% Respondents
Industrial customers
Commercial Customers
Institutional Customers
Domestic customers
WASCO Employees
LEC Employees
LEWA Employees
WASCO Frontline Staff
LEC Frontline Staff
WASCO Top Management

48
The most dominant respondents came from WASCO employees, which accounts for
21%, followed by LEC employees with 16%. The domestic customers are the third most
dominant respondents thus accounting for 15%, followed at the fourth by industrial
customers at 13%, while commercial customers, institutional customers, and WASCO
frontline staff account for 11%, 8%, and 5% respectively. LEC frontline staff, LEC Top
management, WASCO Top management, and LEWA employees account for 4%, 3%,
2% and 2% respectively.
4.3 Customers’ perception of service delivery quality
This section elaborates on how the customers of both WASCO and LEC perceive the
quality of service they receive from these companies. Data on the handling of customer
queries and complaints in both companies are also presented. The results are
presented in a form of one-way frequencies, cross tabulations, and factor values. The
presentation of the findings below is directed by the objectives of this field study as
explained in the research proposal, with the primary objective being to investigate how
CRM could be managed and implemented in view of improving WASCO and LEC
service delivery.
The bulk of the questions in the questionnaire used the Likert scale to differentiate the
perceptions of both WASCO and LEC customers on the variables of interest to this field
study. The Likert scale therefore assisted in rating how customers or respondents agree
or disagree with statements ranging from 1 for strongly disagree to 5 for strongly agree.
The average value or mean of the responses received was calculated by adding all the
responses and then dividing by the number of respondents. The mean values ranged
from 1.00 to 5.00 with 3.00 being the middle value.
A mean value below 3.00 signifies that on average respondents disagree, while a mean
that is near 5.00 signifies that on average respondents are highly optimistic concerning
the matter at hand. In view of the fact that this field study is dealing with categorical
variables, the average value (mean) for every question is subsequently transformed into
factor values (FV), or an average score. Therefore, a mean of 3.00 is considered to be

49
equal to a factor value of 0.5 or fifty percent (50%). A factor value larger than fifty
percent indicates that most of the respondents agree with the statement, whereas the
small factor value indicates that the minority of respondents agree with the statement.
Therefore this means that the reason with the lowest factor value is the one that is the
main reason and the one with the highest factor value is the least reason. The mean
and factor values are presented in the tabular form in the proceeding sub-sections of
this chapter.
4.3.1 WASCO’ service delivery and quality
Figure 4.2: WASCO’s service delivery and quality standards
The histogram above shows that 100% of the respondents of WASCO customers feel
that the quality of service delivery offered by WASCO is not of an acceptable standard.
The reasons that have been cited by the respondents as major obstacles for WASCO to
deliver acceptable service quality are presented in their chronological order in a
frequency distribution Table 4.1 below. The order of these reasons was informed by the
use of factor values.
0%
10%
20%
30%
40%
50%
60%
70%
80%
90%
100%
YesNo
0
100
% Respondents of WASCO customers
% Respondents

50
Table 4.2: Reasons for WASCO’s unacceptable service quality and delivery
Reasons for WASCO`s
unacceptable service quality and
delivery
Number of
Respondents
Rank Mean Factor
Value
Appearance of WASCO’s facilities is
appealing
193 1 1.342 0.085
Frontline staff are committed and
customer centric
193 2 1.373 0.093
WASCO has customer charter and
customers know about it
193 3 1.420 0.105
WASCO has an acceptable reputation
193 4 1.435 0.109
Customer care offices/Reception are
welcoming
193 5 1.497 0.124
Communiqué with respect to service
failures is timely
193 6 1.580 0.145
WASCO guarantees its service works
193 7 1.705 0.176
Frontline staff provide convincing
responses
193 8 1.710 0.177
Customers applicable information is at
the disposal of the frontline staff at the
different customer stations at all times
193 9 1.777 0.194
Service costs cover all the expected
aspects of service
193 10 1.803 0.201
Customers are informed in an easily
accessible communication media and in
language that they could easily
understand.
193 11 1.839 0.210
WASCO adheres to service standards (if
available)
193 12 1.902 0.225
Frontline staff are friendly, polite 193 13 1.917 0.229

51
and respectful
Customers are contacted if WASCO fails
to offer service on the promised time
193 14 1.933 0.233
WASCO offers a guaranteed service
unfailingly and correctly
193 15 2.000 0.250
The service standards are known by all
the customers
193 16 2.067 0.267
WASCO have service delivery standards
193 17 2.098 0.275
Customers are categorized according to
their level of consumption.
193 18 2.109 0.277
High-consuming customers have
dedicated Managers that deal with their
accounts.
193 19 2.228 0.307
The frontline staff dress code is
appealing
193 20 2.290 0.323
Frontline staff process transactions
without mistakes
193 21 2.275 0.319
All the factor values (FV) are less than 0.5 which means that the majority of the
respondents disagree with the given statements which are the measure of acceptable
service quality delivery. This is the clear indication that respondents are not satisfied
with the service quality offered by WASCO. The reason "Appearance of WASCO’s
facilities are appealing" has a FV of 0.085 which is the lowest. This means that the
majority of the respondents disagree with the statement indicating that WASCO's
facilities are appealing - thus indicating that this is one of the main reasons for the
respondents to consider WASCO’s service quality offerings unacceptable.
This is in line with the CRM literature results of Arussy (2012), whose study indicated
that customers’ evaluation of service on service quality starts with the attractiveness of
the service provider’s facilities, e.g. dressing coat of frontline staff, office/reception
environment, and communication methods used to convey critical information to the

52
customers. Other main reasons that were cited by the respondents include: Frontline
staff non-commitment and their lack of customer centricity, Non-availability of customer
charter known to customers, Bad reputation, and Untimely communiqué with respect to
service failures.
4.3.2 WASCO’s complaints management
The histogram illustrating how customers perceive WASCO’s complaints management
is presented in figure 4.3 below. The results reveal that 100% of the respondents are
not happy with the way WASCO handles customer queries and complaints.
Figure 4.3: WASCO’s customers ‘perception regarding queries and complaints
management
Table 4.3 below presents reasons provided by respondents that make them not to be
satisfied with the way their complaints are handled and managed at WASCO. It is
deduced from the table that the main reason for their dissatisfaction is the impoliteness
that is demonstrated by the frontline staff while attending to their queries. The lowest
factor value of 0.269 for this statement alludes to that. This is in line with
Hinson’s (2012) findings that some of the reasons that cause customers complaints
0
20
40
60
80
100
Yes No
0
100
% Respondents of WASCO customers
% Respondents

53
include, amongst others, rudeness when responding to customer queries,
discourteousness, and incompetency of the service staff.
Secondly, the factor value of 0.272 for the statement that suggest that WASCO delivers
promised service on time indicated that the majority of respondents disagree - thus
indicating that they are not satisfied with the manner that WASCO handles their queries
and complaints. Other reasons for their dissatisfaction that appeared on the forefront
include failure by frontline staff in providing customers with convincing explanations for
service failures as well as lack of compensation offered by the company in the event
that customers had encountered losses due to service failures. These reasons account
for 0.312 and 0.321 factor values respectively. This clearly indicates that the majority of
respondents disagree with these suggested statements.
Table 4.3: Main reasons for not being satisfied with WASCO’s complaints
management
Main reasons for not being satisfied
with WASCO’s complaints
management
Number of
Respondents
Rank Mean Factor
Value
Frontline staff respond to queries politely
and respectfully
193 1 2.078 0.269
WASCO delivers promised service on time 193 2 2.088 0.272
Frontline staff provide customers with
convincing explanations for service failures
193 3 2.246 0.312
WASCO offer compensation as a result of
the losses due to service failure
193 4 2.285 0.321
Frontline staff are competent 193 5 2.313 0.328
WASCO informs customers of service
interruptions
193 6 2.326 0.332
WASCO has clear policies and procedures
that each and every customer has to go
through in the process of seeking service
193 7 2.358 0.339

54
fairness.
WASCO offer compensation as a result of
inconveniences incurred due to service
failure.
193 8 2.451 0.363
Frontline staff are proactive in resolving
service problems
193 9 2.601 0.400
4.3.3 LEC’s service delivery and quality
The pie chart below (figure 4.4) shows that almost 100% of the respondents feel that
the quality of service delivery offered by LEC is not of an acceptable standard.
Figure 4.4: LEC’s service delivery and quality standards
Table 4.4 below clearly illustrates these results, and the reasons for the respondents’
viewpoints are listed in a chronological manner. The order of these reasons was
informed by use of factor values. The main reasons that were cited for unacceptable
service quality and delivery include Non-availability of a customer charter that is known
by the customers, Non-adherence to service standards,High service costs, Lack of
1% 99%99%Yes
No

55
guarantees on the service works, and Poor communication in the event of service
failures.
On the other hand, respondents show positive responses regarding the frontline staff
commitment when dealing with customers, their appearance/dress code, and their
politeness and respectfulness to the customers. Respondents also showed that LEC
Reception offices are welcoming - which indicates better service quality in this regard.
The factor values of 0.563, 0.601, 0.623, and 0.670 respectively for these suggested
statements allude to the fact that the majority of respondents agree with these
statements.
Table 4.4: Reasons for LEC’s unacceptable service quality and delivery
Reasons for LEC`s unacceptable
service quality and delivery
N Rank Mean Factor
Value
LEC has customer charter and customers
know about it
193 1 1.33 0.083
LEC adheres to service standards (if
available)
193 2 1.50 0.124
High-consuming customers have dedicated
Managers that deal with their accounts.
193 3 1.57 0.142
Service costs cover all the expected aspects
of service
193 4 1.58 0.145
LEC guarantees its service works 193 5 1.59 0.146
The service standards are known by all the
customers
193 6 1.59 0.146
Frontline staff process transactions without
mistakes
193 7 1.60 0.149
LEC have service delivery standards 193 8 1.66 0.166
Frontline staff provide convincing responses 193 9 1.74 0.185
LEC has an acceptable reputation 193 10 1.75 0.188
Communiqué with respect to service failures
is timely
193 11 1.92 2.08
LEC offers a guaranteed service unfailingly 193 12 2.00 0.25

56
and correctly
Customers are contacted if LEC fails to offer
service on the promised time
193 13 2.08 0.270
Customers are informed in an easily
accessible communication media and in
language that they could easily understand.
193 14 2.17 0.293
Customers applicable information is at the
disposal of the frontline staff at the different
customer stations at all times
193 15 2.25 0.312
Frontline staff are committed and customer-
centric
193 16 2.59 0.396
Customers are categorized according to their
level of consumption.
193 17 2.66 0.416
Customer care offices/Reception are
welcoming
193 18 3.25 0.563
Appearance of LEC `s facilities is appealing 193 19 3.40 0.601
The frontline staff dress code is appealing 193 20 3.49 0.623
Frontline staff are friendly, polite and
respectful
193 21 3.68 0.670
4.3.4 LEC’s complaints management
Figure 4.5 below presents how customers perceive LEC’s complaints management. The
results reveal that 100% of the respondents are not satisfied with the way LEC handles
customer queries and complaints.

57
Figure 4.5: LEC’s customers ‘perception regarding queries and complaints
management
Table 4.5: Main reasons for not being satisfied with LEC’s complaints
management
Main reasons for not being satisfied
with LEC’s complaints management
Number of
Respondents
Rank Mean Factor
Value
LEC offers compensation as a result of
the losses due to service failure
193 1 1.27 0.069
LEC delivers promised service on time 193 2 1.77 0.193
LEC offers compensation as a result of
inconveniences incurred due to service
failure.
193 3 2.00 0.25
LEC has clear policies and procedures
that each and every customer has to go
through in the process of seeking
service fairness.
193 4 2.00 0.25
0
10
20
30
40
50
60
70
80
90
100
Yes No
0
100 % Respondents

58
Frontline staff are competent 193 5 2.03 0.258
Frontline staff respond to queries
politely and respectfully
193 6 3.45 0.613
Frontline staff are proactive in resolving
service problems
193 7 3.82 0.705
Frontline staff provide customers with
convincing explanations for service
failures
193 8 4.00 0.75
LEC informs customers of service
interruptions
193 9 4.12 0.780
The lowest factor value of 0.069 shows that the majority of respondents disagree with
the statement that LEC offers compensation as a result of the losses due to service
failure. The other reasons that respondents cited as the main ones which influence
them to conclude that LEC still have a long way to go in managing customer complaints
in a satisfactory manner include LEC’s failure to deliver promised service on time, LEC’s
failure to offer compensation as a result of inconveniences incurred due to service
failure, LEC’s failure to put in place clear policies and procedures that each and every
customer has to go through in the process of seeking service fairness, and the
incompetency of frontline staff. The factor values of these reasons are: 0.193, 0.25, 0.25
and 0.258. However, the factor values of 0.613, 0.705, 0.75, and 0.780 for the following
suggested statements: Frontline staff respond to queries politely and respectfully,
Frontline staff are proactive in resolving service problems, Frontline staff provide
customers with convincing explanations for service failures, and LEC informs customers
of service interruptions respectively, reveals that the majority of respondents agree with
these statements - thus indicating a better complaints management in this regard.

59
4.4 Executive Management and frontline staff commitment on CRM
This section presents data on the commitment of the Executive management and
frontline staff of both companies on CRM as well as the existing CRM system (if any).
The results are presented in the same format as in the preceding section and so
include one-way frequencies, cross tabulations, charts, and factor values. The
presentations of the findings in this section are also guided by the objectives of this field
study. The Likert scale is again used for the purpose of establishing the viewpoint of
both companies’ customers regarding the executive management and frontline staff
commitment to CRM.
4.4.1 WASCO’s CRM Strategy
The pie chart below (Figure 4.6) shows that 100% of the respondents strongly believe
that WASCO does not have the credentials of a company that pursues a CRM strategy.
Figure 4.6: WASCO’s customers’ view on the company’s CRM strategy
100%
0%
No
Yes

60
Figure 4.7: Main reasons that make customers believe that WASCO does not
pursue a CRM strategy
The above bar chart (Figure 4.7) illustrates that 100% of respondents disagreed with
thirteen out of fourteen statements/reasons which were meant to display if WASCO
really pursues a CRM strategy. This clearly indicates that they do not agree or believe
that WASCO pursues a CRM strategy. As many as 79.8% of respondents disagree that
WASCO’s corporate structure gives importance to customers’ needs, while on the other
hand 20.2% of respondents show that they are neutral (cannot agree or disagree) about
this issue.
0
10
20
30
40
50
60
70
80
90
100
54.4
28.535.2
54.9
73.1
25.4
17.1
91.2
45.6
100
25.4
6.2 6.2
17.1
45.6
71.564.8
45.1
26.9
74.6
82.9
8.8
54.4
74.6
93.8 93.8
62.7
Strongly Disagree
Disagree
Neutral
Agree
Strongly Agree

61
4.4.2 LEC’s CRM Strategy
Figure 4.8 below shows that 99% of the respondents strongly believe that LEC does not
have the credentials of a company that pursues a CRM strategy, while on the other
hand 1% of the respondents believe that the company does pursue a CRM strategy.
Figure 4.8: LEC’s customers’ view on the company’s CRM strategy
1%
99%
Yes
No

62
Figure 4.9: Main reasons that make customers believe that LEC does not pursue a
CRM strategy
Figure 4.9 above shows that 92.3% of the respondents disagree that service
interruptions are well communicated by LEC, while on the other hand 92.2% believe
that frontline staff of LEC is not well trained. The third reason that is cited by 90.1% of
the respondents is that customers’ applicable information is not normally easily found or
at the disposal of the frontline staff at the different service stations at all times. Fourthly,
89.6% of respondents show that frontline staff performance is not measured and
rewarded on the basis of meeting customer needs and on successfully serving the
customer, while 87.6% respondents do not agree that LEC’s corporate strategy gives
importance to customer needs. On average, over 60% of respondents do not agree with
all the statements - which are clear indications that LEC is lacking in terms of pursuance
of a CRM strategy.
0
10
20
30
40
50
60
70
80
90
100
40.4
25.4
39.939.9 40.4
49.7
20.7
35.2
7.8
69.9
27.5
49.7
22.8
45.1
42
56.5
39.9
49.7 51.8
25.4
69.4
54.4
84.5
15
57.5
30.1
39.9 42.5
17.6 18.1 20.2
7.8 7.8
24.9
9.8 10.47.8
1515
20.2
37.3
12.4
Strongly Disagree
Disagree
Neutral
Agree
Strongly Agree

63
4.5 Customer Satisfaction and Loyalty
This section presents data on the customer satisfaction and loyalty of both companies’
customers. The results are presented in the same format as in the preceding sections
and so include one-way frequencies, cross tabulations, charts, and factor values. The
presentations of the findings in this section are again guided by the objectives of this
field study as in the preceding sections of this chapter. The Likert scale is again used for
the purpose of establishing the satisfaction and loyalty of both companies’ customers
regarding the services offered to them by both LEC and WASCO.
4.5.1 Customer Satisfaction
Figure 4.10 below presents the customers’ service quality satisfaction of both utility
companies. The results reveal that 100% of the respondents are not satisfied with both
LEC and WASCO’s service quality.
Figure 4.10: Customers’ satisfaction with WASCO and LEC’s service quality
0
10
20
30
40
50
60
70
80
90
100
Yes No
0
100
0
100
WASCO
LEC

64
4.5.1.1 Main Reasons for Customers’ Dissatisfaction
Figure 4.11 below illustrate the explanations that are provided by the respondents as
the key reasons for their dissatisfaction with WASCO service quality. The bad reputation
of the company, the quality of water produced, and service quality offered by the
company were shown as the main reasons that lead to customers’ dissatisfaction.
Altogether 98.9% felt that the company’s customers’ are spreading negative word of
mouth about the company, while 94.8% of the respondents felt that the quality of water
produced by WASCO is not acceptable. As many as 93.8% indicated that the services
offered by the company are not of an acceptable standard.
This is in line with Pedron et al (2009) who indicated that dissatisfied customers push
other customers away, which is a fundamental aspect in switching conduct. This is
confirmed in this study by the fact that 89.6% of the respondents indicated that they
could consider switching if it was possible to do so.
Figure 4.11: Main reasons for customers’ dissatisfaction with WASCO
58
19.7
52.3
25.4
11.4 15
66.3
35.8 38.926.9
64.2
83.4
34.2 32.6
6.2
41.5
20.710.4
5.2
50.8
10
10
20
30
40
50
60
70
80
90
100
WASCOoffer
qualityservice
The serviceprices are
fair
Serviceprices areaffordable
You couldnot
considerswitchingeven if it
waspossible
WASCOproducts
are of goodquality
WASCO'core valuesaddressescustomers'
needs
WASCOcustomers
spreadpositiveword ofmouth
about thecompany
Strongly Disagree
Disagree
Neutral
Agree
Strongly Agree

65
On the other hand, figure 4.12 below illustrates the reasons that cause LEC customers
not to be satisfied with the company. The high service prices, poor quality of service,
unfairness of service prices, and the bad reputation of the company were shown as the
main reasons that lead to customers’ dissatisfaction. All the respondents showed that
LEC service prices are not affordable and 99.9% indicated that the prices are unfair,
while 98.8% of respondents indicated unhappiness about the quality of service offered
by the company.
Furthermore, 95.9% of respondents showed that LEC’s customers are spreading
negative word of mouth about the company. As indicated in the above section of the
report, it is in line with Pedron et al (2009) who indicate that dissatisfied customers push
other customers away - which is fundamental aspect in switching conduct, as was
mentioned above. This is again confirmed as in WASCO’s case by the fact that 100% of
the respondents indicated that they could consider switching if it was possible to do so.
Figure 4.12: Main reasons for customers’ dissatisfaction with LEC
0102030405060708090
100
21.1
3.613
28.5
1.6 1.6
16.6
77.7
93.387
71.5
57
44
79.3
2 3.1 0 0
41.5
54.4
4.1
Strongly Disagree
Disagree
Neutral
Agree
Strongly Agree

66
4.5.2 Customer Loyalty
Figure 4.13 below presents how the respondents perceive the customers’ loyalty of both
companies’ customers. The results reveal that 100% of the respondents are not loyal to
either company by choice. They are stuck with these companies due to fact that they
are monopolies.
Figure 4.13: Customers’ views on their loyalty to WASCO and LEC
4.5.2.2 Main Reasons for Customers being Disloyal
Figure 4.14 below demonstrate how respondents rate WASCO’s customers’ loyalty.
Major reasons that are cited by respondents as the ones that result in WASCO’s
customers not being loyal include non-effectiveness of complaints management, non -
availability of loyalty rewards and social bonds, and failure by the company to segment
customers according to their needs. All the respondents showed that the lack of loyalty
of WASCO customers is attributable to the fact that their complaints are not managed
effectively; they are not offered loyalty rewards and social bonds: and they are also not
segmented according to their needs.
0
20
40
60
80
100
Yes No
0
100
0
100
WASCO
LEC

67
Figure 4.14: Main reasons for customers not to be loyal to WASCO
Figure 4.15 below illustrates the reasons for LEC customers not to be loyal to the
company. The quality of service delivered to customers, non-availability of loyalty
rewards and social bonds as well as the non-availability of a clear service- recovery
procedure were shown as the main reasons that lead to customers not being loyal, thus
representing the views of 100% of the respondents.
Moreover, sensitivity of customers to prices was cited by 89% of respondents as
another contributing factor to the customers’ non-loyalty to LEC. This is in line with the
study conducted by Guadagni and Little (2008), which indicated that customer loyalty
also results in customers who are less sensitive to price due to the loyalty that they
have developed towards the company - which results in higher price levels for products
and services. Nonetheless, 40% of the respondents showed that the customers’
complaints are dealt with effectively - which shows that LEC is applying a considerable
effort in this area as compared to WASCO.
0 0 0
46.137.8
89.1
2.1
31.1
20.7
100
79.3
53.962.2
10.9
63.7
43.5
0 0
20.7
0 0 0
34.225.4
58
0 0 0 0 0 0 0
21.2
0 0 0 0 0 0 00
20
40
60
80
100
Strongly Disagree
Disagree
Neutral
Agree
Strongly Agree

68
Figure 4.15: Main reasons for customers not to be loyal to LEC
4.6 Main findings and aspects
In summary, the results clearly indicate that both utility companies’ service delivery and
quality do not attest to acceptable standards. What is also clearly blaring in the results is
the fact that customers’ complaints and queries are not handled with the effectiveness
and urgency these deserve, and the lack of customer-relationship management
systems and strategies in both organizations. The results are confirmed by the fact that
100% of the respondents answered “No” to all the questions that were meant to probe
their opinions regarding these issues, which are fundamental in customer relationship
management.
Furthermore, the results show that the customer satisfaction of both companies is very
low; thus resulting in very low customer loyalty. The results further reveal that the
customers of both companies are not stuck with them by choice, but are forced by
circumstances as both companies enjoy monopoly in their sector of business. Finally,
given that all the respondents gave negative responses to all the questions that were
010
2030405060708090
100
0 0
51.3
31.6
55.4
44.152.3
58.5
0
67.5
48.7
68.4
44.6
10.9
47.741.5
90 0 0 0 0 0 0
74
32.5
0 0 0
40
0 0
15
0 0 0 0 0 0 0
Strongly Disagree
Disagree
Neutral
Agree
Strongly Agree
69
meant to probe their opinions regarding fundamental issues in relationship
management, the associations between different variables could not be established or
calculated.
4.7 Conclusion
The purpose of this chapter was to elaborate on the research findings, analysis and
interpretation conducted on the basis of the data that were collected from the
respondents with the aid of the structured questionnaires that were distributed. The
subsections that were covered under the findings and analysis included the
characteristics of both utility companies’ customers, both companies’ customers’
perception of service delivery quality, their executive management and frontline staff
commitment to CRM, and lastly the customers’ satisfaction and loyalty. The next and
last chapter of this field study will therefore elaborate on the conclusions drawn from the
findings and analysis done in this chapter. The final chapter shall also provide
recommendations on how the service quality and delivery could be improved in both
WASCO and LEC.

70
CHAPTER 5: CONCLUSIONS AND RECOMMENDATIONS
5.1 Introduction
The primary objective of this field study was to investigate how CRM could be managed
and implemented in view of improving WASCO and LEC service delivery. A
comprehensive literature review was undertaken for the purpose of understanding the
main reasons that cause WASCO and LEC customers to complain. The literature
review was also aimed at establishing a better approach that both companies could
adopt in pursuit of a CRM strategy that would enable them in maintaining long-term
customer relationships and also in understanding their needs better. Over and above
this, the review was undertaken for the purpose of investigating strategies that could be
implemented for the purpose of enhancing customer satisfaction, and to establish
customer loyalty and perceived relationships through improved customer care service.
Subsequently, a research survey was conducted for the purpose of gathering primary
data on the issues affecting quality of service delivery offered by WASCO and LEC. The
conclusions of this field study are presented in this chapter, and are thus guided by the
primary and secondary objectives as well as the analysis and findings. The
recommendations, significance and limitations of the study are also included in this
chapter. Finally, commendations for additional research are put forth.
5.2 Hypothetical findings
The study findings reveal that both WASCO and LEC’s service quality and delivery are
not of an acceptable standard. The findings further reveal that both companies do not
have a well-structured complaints management system or a service-recovery system in
case of service failure. Furthermore, these companies do not pursue a CRM strategy
that is aligned with the corporate strategy, and as a result the customers’ satisfaction
and loyalty are very low. However, these customers are not switching from these
companies due to the fact that they both operate under a monopolistic arena. The
customers are therefore stuck with these companies despite their poor service delivery
and quality.

71
5.3 Research Conclusions
5.3.1 Service delivery and quality
As highlighted in the beginning of this chapter, the primary objective of this field study
was to investigate how CRM could be managed and implemented in view of improving
WASCO and LEC service delivery. This objective has been attained with the help of
undertaking a comprehensive collection and analysis of primary data and findings. The
findings indicate that both WASCO and LEC’s service quality and delivery are not of the
acceptable standards. The significance of each of the reasons that make customers to
conclude that these companies’ service delivery and quality are below standard, may
differ from company to company as these companies’ strategies also differ. Therefore,
the ten main reasons for unacceptable service delivery and quality by WASCO, in order
of significance (refer to table 4.2), are the following:
1. Unappealing appearance of WASCO’s facilities
According to the study on service quality conducted by Zeithaml et al (2009), factors
related to appearance of facilities are used by customers in assessing service quality of
the company. This fact is further confirmed by Arussy (2012) who states that customers’
evaluation based on service quality starts with the attractiveness of the service
provider`s facilities, e.g. dress code of frontline staff, office/reception environment, and
communication methods used to convey critical information to the customers. WASCO’s
customers therefore alluded to this fact by indicating that they consider the service
delivery and quality of the unacceptable standards due to the fact that the appearance
of WASCO’s facilities is not appealing.
2. Lack of commitment and customer-centricity demonstrated by frontline
staff
The frontline staff of WASCO does not deal with the customers’ queries and complaints
effectively and efficiently. This demonstrates their lack of understanding in the
importance of taking good care of customers, which also indicate that the company
does not have a clear and well-known CRM strategy.

72
3. Non availability of customer charter that is known by customers
WASCO does not have a framework for how they intend to deal with their customers in
terms of excellence, payment, response time, and overall service standards.
4. WASCO’s bad service reputation
One service dimension that the customers use in assessing the company’s service
quality and delivery is the assurance it provides its customers. There are four
characteristics that deal with this dimension and they are credibility, security,
competence, and courtesy. For the company to do well in this service quality dimension
it needs an acceptable reputation and this is not the case with WASCO.
5. Untimely communiqué with respect to service failures
WASCO does not seem to have the set policies and procedures that each and every
customer has to go through in the process of seeking service recovery. Again, the
company does not have a responsive service-recovery system.
6. Unguaranteed service works
WASCO’s service works are not guaranteed in that the company is unable to provide
the requested services; for instance, like a provision of a water connection at the
promised time. Again, the company also fails to contact customers in the event that they
would be unable to provide the service on the promised date.
7. Unconvincing responses provided by the frontline staff
WASCOs’ frontline staff provides the customers with unconvincing explanations for
service failures and they are also not proactive in resolving the service problems.
8. Non-availability of customers’ applicable information at the disposal of the
frontline staff as and when needed at the different service stations
Lovelock and Wirtz (2011) state that service delivery and - quality depend on the
company’s capacity to gather customer information, incorporate it with other applicable
information, and ensure that the applicable information is at the disposal of the frontline

73
staff at the different customer service stations at all times. This is not the case with
WASCO.
9. Unacceptable service costs
The customers are not confident that some of the service costs cover all the expected
aspects of such service. They feel that the costs are quite high considering the poor
service quality offered by WASCO.
10. Non adherence to service level standards/agreements
The company has service delivery standards set by the regulator (LEWA); however
adherence thereof so as to ensure improved service quality is poor.
On the other hand, the following ten main reasons in order of their significance (refer to
table 4.4) were cited by customers as the major ones that make them perceive LEC’s
service quality and delivery as unacceptable:
1. Non-availability of a customer charter that is known by customers
2. Non-adherence to service level standards/agreements.
3. Non-availability of dedicated relationship managers that deal with high-
consuming customers like industries.
4. High service costs.
5. Unguaranteed service works.
6. Service delivery standards that are not known by all the customers.
7. Unconvincing responses that are provided by frontline staff when attending to
customers’ queries.
8. LEC’s bad service reputation.
9. Untimely communiqué with respect to service failures.
10. Failure to contact customers in the event that LEC fails to offer service on the
promised time.
It must be noted that all the reasons written in italic are expounded in the above section
of this chapter which deals with WASCO. However, it must also be noted that

74
reasons.3, 6, and 10 do not appear in that above section and therefore are expounded
as follows:
1. Non-availability of dedicated relationship managers that deal with high-
consuming customers like industries
In a CRM system, the categorization of customers is done based on different aspects
that include physical location, and the type of business they do, and on the basis of that
categorization, they are allocated to different Relationship Managers. This assists the
company in putting more focus on the individual customer needs and expectations, thus
enhancing service quality and customer satisfaction. The majority of customers have
indicated that this is not the case with LEC, thus rendering the company’s service
delivery quality not acceptable.
2. Service delivery standards that are not known by all the customers
LEC have the service delivery standards that have been set by the regulator (LEWA)
and they have the duty of ensuring that these standards are known by all the
customers. The fact that the majority of the customers indicated that they are not aware
of these service delivery standards demonstrates unacceptable service delivery quality
on LEC’s part.
3. Failure to contact customers in the event that LEC fails to offer service on
the promised time
One of the service-quality dimensions is reliability of the service provided by the
company and one of its measures is the manner in which the customers’ service
requests are dealt with in the event that the firm is not able to provide the service on the
promised date. The majority of the customers indicated that LEC fails to contact them
on such occasions - which demonstrate unreliable service delivery, thus amounting to
unacceptable service quality.
Notwithstanding the above reasons that demonstrate dissatisfaction of the customers
with respect to LEC’s service delivery quality in general, on average customers

75
indicated satisfaction regarding the following factors which are also regarded as
important measures of service delivery quality: The welcoming nature of the customer
care offices and reception, the acceptable appearance of LEC’s facilities, the
acceptable appearance of frontline staff’s dressing code, and friendliness, politeness
and respectfulness demonstrated by the frontline staff.
5.3.2 Complaints Management
One of the secondary objectives of this field study included identification of the main
reasons that contributes to both WASCO and LEC customers’ complaints. The research
findings also indicate that the customers of both companies are not happy with the way
their complaints and queries are handled. Some of reasons cited by WASCO customers
as the main ones that cause them to complain were chronologically presented in table
4.3.
On the other hand, the main reasons that were pointed out as the ones that are
contributing to LEC’s customers’ complaints were again chronologically presented in
table 4.5.
Despite the fact that customers indicated some reasons for their complaints, on average
LEC customers demonstrated some satisfaction to a certain degree with respect to the
way the frontline staff respond to their queries, service problems, and information
regarding service interruptions.
5.3.3 Executive Management and frontline staff commitment to CRM
The second secondary objective of this field study was to assist both companies in
pursuing a CRM strategy that would enable them to maintain long-term customer
relationships and also in understanding their needs better. Based on the findings and
analysis, as expounded in figure 4.7 and 4.9 respectively, it could be concluded that
WASCO and LEC do not pursue a CRM strategy that could enable them in maintaining
long term customer relationships and also in understanding their needs better.

76
5.3.4 Customer Satisfaction and Loyalty
The third secondary objective was related to the strategies that could be implemented
for the purpose of enhancing customer satisfaction. The analysis and findings as
expounded by figure 4.10 respectively indicated that it can be concluded that the
customer satisfaction of both WASCO and LEC customers is very low. The findings as
illustrated by figure 4.13 also revealed that the customers of both companies are not
loyal to them by choice. They are stuck with these companies due to the fact that they
are monopolies.
5.4 Recommendations
This section puts forth recommendations that can assist WASCO and LEC in effectively
managing and implementing their CRM in view of improving quality of service delivery.
The strategies that could be utilized by both companies to bridge the service quality
gaps are presented below:
Both WASCO and LEC Top management should adopt and develop a CRM
strategy framework. They should ensure that there is proper alignment between
the main business strategy and the CRM strategy framework. The framework
should also include the aspect of value delivery to customers, multichannel
communication integration, and performance assessment of the whole
framework. The CRM strategy should also take into account how the target
market will be divided, how the customer base could be ranked or tiered and how
loyalty bonds and churn management could be best established, thus delivering
improved value to the customers (Morgan 2006: p. 430). The six-gap model is
recommended as it will assist in assessing the effectiveness of the CRM
strategy.
For the purpose of improving the service quality and delivery of both companies,
the customer service quality gap model should be adopted. The following
strategies are recommended for closing the service quality gaps identified in both
organizations:

77
- Management need to be trained on the expectations of the customers, and in
order to achieve this, the management should implement the following policies:
o Customer surveys should be undertaken regularly and they should employ
research methods like questionnaires and interviews. The questions
should be structured in such a manner that they would address the most
critical aspects of the type of service delivered by the individual company.
- Both companies should put into operation an efficient customer feedback system
that would among other areas of importance in the service quality, include
customer satisfaction research, analysis of launched complaints, and customer
sections.
- Ease and promote contact between management and frontline staff.
- Enhance contact between management and customers.
- Management should develop appropriate service business processes and
standard operating procedures for dealing with customers.
Management should ascertain that the performance matches the set standards
and that the customers appreciate the level of quality that is delivered by the firm.
Management should also strive to keep the customer service staff highly
motivated and highly engaged and therefore able to achieve the set service
standards. Training of the employees on the technical and soft skills needed to
perform their assigned tasks effectively should be undertaken regularly and they
should include interpersonal skills - especially for dealing with customers under
stressful conditions.
- Install the appropriate technology, equipment, support processes and capacity.
- Manage customers for service quality.
Educate the customers so that they could perform their role and responsibilities
in service delivery effectively. This could be achieved by developing and
delivering customer education programmes on different radio stations, television,
and newspapers.
Management should address the issue of internal communications gap by
striving to ascertain that the promises made through communications channels

78
like advertisements are realistic and rightly appreciated by customers. This could
be achieved by implementing the following strategies:
- Train managers responsible for public relations and customer care
communications about operational capabilities.
- Ensure that communications content sets realistic customer expectations.
- Be specific with promises and manage customers` understanding of
communication content.
WASCO and LEC should put in place proper complaint-handling and service-
recovery processes. This will lead to enhanced customer satisfaction and loyalty.
5.5 Significance of the Study
The field study has exposed the inefficiencies of the monopolistic service companies.
The fact that both companies are not operating in a competitive environment seem to
give them a scapegoat of not paying attention to the quality of service that they offer to
their customers. The value of the findings of this study is that they may well be used by
both LEC and WASCO management to inform policy and strategic planning with
regards to service delivery quality implementation and improvement.
5.6 Limitations of the Study
The sample size of the study was not large enough for the findings to be generalized
due to the fact that both WASCO and LEC serve all the urban and peri-urban areas of
Lesotho, thus constituting about four hundred thousand people of the country - whereas
the study population was only 250 people, which is quite a limited representation.
5.7 Conclusion
Chapter 5 exposes the final views and recommendations of this field study. The primary
data results as exposed in the previous chapter formed the basis for the conclusions
made - which expose the main reasons for both WASCO and LEC customers to
perceive these companies’ service delivery and quality as of not acceptable standards.
Conclusions are also drawn on the complaints and queries management, executive

79
management and frontline staff dedication to good customer relationship management,
and the main reasons these customers have very low customer satisfaction and loyalty.
Lastly, the importance of this field study and the restrictions of it have also been dealt
with in this chapter.

80
References
Abdullateef, AO., Sany Sanuri Mohd Mokhtar, SSM., Yusoff, RZ. (2011). The Strategic
Impact of Technology Based CRM on Call Centers’ Performance. Journal of Internet
Banking and Commerce. vol. 16, no.1.
Aneeza, I. (2014). International Journal of Information, Business & Management. Vol. 6
Issue 2, p41-52. 12p.
Arussy, L. (2012). Technology isn`t everything. CRM Magazine. Vol. 16 Issue 2, p8-8.
Babbie, E.R., (2010). The Practice of Social Research. (12th Edn): Belmont, CA,
Wadsworth Cengage Learning.
Banyte, J.;Tarute, A.; Taujanskyte, I. (2014). Customer Engagement into Value
Creation: Determining Factors and Relations with Loyalty. Inzinerine Ekonomika-
Engineering Economics, 25(5), pp.568–577
Baye, MR. (2010), Managerial Economics (7th Edn): New York, McGraw Hill.
Benjamin, J.C, Yuan, M., Lin, B.H. (2012). Transforming Employee Engagement into
Long-Term Customer Relationships: Evidence From Information Technology
Salespeople In Taiwan. Social Behavior And Personality, 2012, 40(9), 1549-1554
Society for Personality Research.
Bhuvaneshwari, G.,Sowmya, KR. (2013). Perception of service providers on use of
technology on CRM. International Journal of Information, Business and Management,
Vol. 5, No.2.
Cho, YC. (2012). The Effects of Customer Dissatisfaction on Switching Behaviour in the
Service Sector. Journal of Business & Economic Research. vol. 10, no.10. pp.579-592
Driggs, W., Porter, B. (2013). Building a Consistent Customer Experience: Focusing on
employee engagement and culture will go a long way. CRM Magazine. Oct 2013, Vol.
17 Issue 10, p6-6.

81
Ezendu, E. (2015). CRM Strategy [Online]. Available from http://www.smarter-
companies.com/ pdf. [Accessed: 13th April 2015].
Guadagni, PM., Little, JDC. (2008). A logic Model of Brand Choice Calibrated on
Scanner Data. Marketing Science. Vol. 27. pp 29 – 48.
Hinson, RE. (2012). Service Marketing Excellence (1st Edn): Accra, Sedco Publishing
Jooste, CJ.; Strydom, JW.; Berndt, A.; du Plessis, PJ.(2012). Applied Strategic
Marketing,(4th Edn.), Cape Town, Pearson
Kotler, P. and Keller, K L. (2012). A Framework for Marketing Management. (5th
Edn). Essex. Pearson Education Limited
Kumar, RR.; Praveen S. Alexander R. (2015) "A narrative review and meta-analysis of
service interaction quality: new research directions and implications", Journal of
Services Marketing, Vol. 29 Iss: 1, pp.3 - 14
Lovelock, C. & Wirtz, J. (2011). Services Marketing: People, Technology,
Strategy (7th Edn). Essex, Pearson.
Ma, Z.; Dubé, L. (2011) Process and Outcome Interdependency in Frontline Service
Encounters. Journal of Marketing. May 2011, Vol. 75 pp. 83–98.
Management Study Guide (2015). Importance of CRM [Online]. Available from
http://managementstudyguide.com/importance-of-crm.htm pdf. [Accessed: 13th April
2015].
Mithas, S., Krishnan, MS.,& Fornell, C. (2005). Why Do Customer Relationship
Management Applications Affect Customer Satisfaction? Journal of Marketing. Vol. 69.
pp201 – 209
Morgan, NA., Rego, LL. (2006). The Value of Different Satisfaction and Loyalty Metrics
in Predicting Business Performance. Marketing Science, pp 426-439.

82
Moore, ML., Ratneshwar, S., Moore, RS. (2012). Understanding Loyalty Bonds and
Their Impact on Relationship Strength. A Service Firm Perspective. Journal of Services
Marketing, 26 (4), 253-264.
Muijs, D., (2010). Doing Quantitative Research in Education with SPSS. (2nd Edn):
London, SAGE Publications.
Nitzan, I.; Libai, B. (2011): Social Effects on Customer Retention. Journal of Marketing
Nov 2011, Vol.75, pp24–38
Payne, A. & Frow, P. (2005). A strategic Framework for Customer Relationship
Management. Journal of Marketing. Vol. 69: pp167-176.
Pedron, CD. & Sacool, AZ. (2009). What lies Behind the Concept of Customer
Relationship Management? Discussing the Essence of CRM through Phenominal
Approach. Technical Paper. Brazilian Administration Review. 30(1): pp34-49.
Raab, G., Ajami, RA., Gargeya, VB., Goddard, GJ. (2013). Customer Relationship
Management A Global Perspective. Wachovia Corporation, USA
Sanchez – Franco, M., Rondan – Catalun, FJ. (2010). Connection between customer
emotions and relationship quality in online music services. Journal of Marketing. Oct
2009, Vol. 29 Issue 6, pp633-651.
Saunders, M., Lewis, P., Thornhill, A. (2012). Research Methods for Business Students
(6th Edn): Essex, Pearson
Sekaran, U., Bougie, R. (2013). Research Methods for Business: A Skill-Building
Approach (6th Edn): West Sussex, John Wiley & Sons Ltd.
Tripathi, M.N. (2014). Customer Satisfaction and Engagement- Customer Retention
strategies for brand manager. Vilakshan, XIMB Journal of Management, Vol. 11 (1),
March 2014.

83
Wieseke, J., Alavi, S., Habel, J. (2014). Willing to Pay More, Eager to Pay Less: The
Role of Customer Loyalty in Price Negotiations. Journal of Marketing. Nov 2014, Vol. 78
Issue 6, pp17-37.
Zeithaml, V.A., Bitner, MJ., Gremier, DD. (2009). Services Marketing: Integrated
Customer Focus Across the Firm (5th Edn): USA, Mcgraw Hill.
Zikmund, W.G., Babin, J.B., Carr, C. & Griffin, M. (2010). Business research Methods.
Melbourne, South-Western Cengage Learning.

84
Appendix A: Questionnaire
QUESTIONAIRE
ON
Customer Relationship Management in Lesotho Utility
Companies Water and Sewerage Company
(WASCO) and Lesotho Electricity Company (LEC)

85
SECTION A: the following questions relate to the customers ` perception of
WASCO and LEC service delivery quality, and complaints management
system.
Unless indicated otherwise, please indicate the extent to which you agree with each of the answers for the questions that follow by circling the appropriate level.
1= Strongly Disagree, 2 = Disagree, 3 = Neutral, 4 = Agree, 5 = Strongly Agree
Q1. Is WASCO`S Service quality and delivery of the acceptable standard?
1. Yes 2. No
If you answered ‘No’ to question 1, please answer question 2.
Q2. What are the main reasons that make you consider WASCO`s Service quality and
delivery not acceptable?
1. WASCO offers a guaranteed service unfailingly and correctly 1 2 3 4 5
2. WASCO guarantees its service works 1 2 3 4 5
3. WASCO have service delivery standards 1 2 3 4 5
4. The service standards are known by all the customers 1 2 3 4 5
5. WASCO adheres to service standards (if available) 1 2 3 4 5
6. Service costs cover all the expected aspects of service 1 2 3 4 5
7. Communiqué with respect to service failures is timely 1 2 3 4 5
8. Customers are contacted if WASCO fails to offer 1 2 3 4 5
service on the promised time
9. WASCO has customer charter and customers know about it 1 2 3 4 5
10. Customers are informed in an easily accessible 1 2 3 4 5
communication media and in language that they could easily understand.
11. Customers are categorized according to their level 1 2 3 4 5
of consumption.
12. High consuming Customers have dedicated Managers 1 2 3 4 5
that deal with their accounts.
13. The frontline staff dress code is appealing 1 2 3 4 5
14. Frontline staff are friendly, polite and respectful 1 2 3 4 5

86
15. Frontline staff are committed and customer centric 1 2 3 4 5
16. Frontline staff provides convincing responses 1 2 3 4 5
17. Frontline staff process transactions without mistakes 1 2 3 4 5
18. Customers applicable information is at the disposal 1 2 3 4 5
of the frontline staff at the different customer stations at all times
19. Customer care offices/Reception are welcoming 1 2 3 4 5
20. Appearance of WASCO `s facilities is appealing 1 2 3 4 5
21. WASCO possess an acceptable reputation 1 2 3 4 5
Q3. If you answered ‘Yes’ to question 1, please provide reasons why you think WASCO`s
service quality and delivery is of acceptable standards
............................................................................................................................................................
............................................................................................................................................................
............................................................................................................................................................
............................................................................................................................................................
Q4. Are you satisfied with the way WASCO addresses customers` queries and complaints?
1. Yes 2. No
If you answered ‘NO’ to question 4, please answer question 5
Q5. What were the main reasons that make you unsatisfied with the way your queries and complaints are dealt with as the customer?
1. WASCO delivers promised service on time 1 2 3 4 5
2. WASCO informs customers of service interruptions 1 2 3 4 5
3. WASCO offer compensation as a result of the losses 1 2 3 4 5
due to service failure
4. WASCO offer compensation as a result of inconveniences 1 2 3 4 5
incurred due to service failure
5. WASCO has clear policies and procedures that each and 1 2 3 4 5

87
every customer have to go through in the process of seeking service fairness.
6. Frontline staff are competent 1 2 3 4 5
7. Frontline staff respond to queries politely and respectfully 1 2 3 4 5
8. Frontline staff provides customers with convincing 1 2 3 4 5
explanations for service failures.
9. Frontline staff are proactive in resolving service problems 1 2 3 4 5
Q6. If you answered ‘Yes’ to question 4, please provide reasons that make you satisfied with the way your queries and complaints are dealt with as the customer? ............................................................................................................................................................
............................................................................................................................................................
............................................................................................................................................................
............................................................................................................................................................
Q7. Is LEC`S Service quality and delivery of the acceptable standard?
1. Yes 2. No
If you answered ‘No’ to question 7, please answer question 8.
Q8. What are the main reasons that make you consider LEC`s Service quality and delivery
not acceptable?
1. LEC offers a guaranteed service unfailingly and correctly 1 2 3 4 5
2. LEC guarantees its service works 1 2 3 4 5
3. LEC have service delivery standards 1 2 3 4 5
4. The service standards are known by all the customers 1 2 3 4 5
5. LEC adheres to service standards (if available) 1 2 3 4 5
6. Service costs cover all the expected aspects of service 1 2 3 4 5
7. Communiqué with respect to service failures is timely 1 2 3 4 5
8. Customers are contacted if LEC fails to offer 1 2 3 4 5
service on the promised time
9. LEC has customer charter and customers know about it 1 2 3 4 5
10. Customers are informed in an easily accessible 1 2 3 4 5

88
communication media and in language that they could easily understand.
11. Customers are categorized according to their level 1 2 3 4 5
of consumption.
12. High consuming Customers have dedicated Managers 1 2 3 4 5
that deal with their accounts.
13. The frontline staff dress code is appealing 1 2 3 4 5
14. Frontline staff are friendly, polite and respectful 1 2 3 4 5
15. Frontline staff are committed and customer centric 1 2 3 4 5
16. Frontline staff provides convincing responses 1 2 3 4 5
17. Frontline staff process transactions without mistakes 1 2 3 4 5
18. Customers applicable information is at the disposal 1 2 3 4 5
of the frontline staff at the different customer stations at all times
19. Customer care offices/Reception are welcoming 1 2 3 4 5
20. Appearance of LEC `s facilities is appealing 1 2 3 4 5
21. LEC possess an acceptable reputation 1 2 3 4 5
Q9. If you answered ‘Yes’ to question 7, please provide reasons why you think LEC`s
service quality and delivery is of acceptable standards
............................................................................................................................................................
............................................................................................................................................................
............................................................................................................................................................
............................................................................................................................................................
Q10. Are you satisfied with the way LEC addresses customers` queries and complaints?
1. Yes 2. No
If you answered ‘NO’ to question 10, please answer question 11
Q11. What were the main reasons that make you unsatisfied with the way your queries and complaints are dealt with as the customer?
1. LEC delivers promised service on time 1 2 3 4 5
2. LEC informs customers of service interruptions 1 2 3 4 5

89
3. LEC offer compensation as a result of the losses 1 2 3 4 5
due to service failure
4. LEC offer compensation as a result of inconveniences 1 2 3 4 5
incurred due to service failure
5. LEC has clear policies and procedures that each and 1 2 3 4 5
every customer have to go through in the process of seeking service fairness.
6. Frontline staff are competent 1 2 3 4 5
7. Frontline staff respond to queries politely and respectfully 1 2 3 4 5
8. Frontline staff provides customers with convincing 1 2 3 4 5
explanations for service failures.
9. Frontline staff are proactive in resolving service problems 1 2 3 4 5
Q12. If you answered ‘Yes’ to question 10, please provide reasons that make you satisfied with the way your queries and complaints are dealt with as the customer? ............................................................................................................................................................
............................................................................................................................................................
............................................................................................................................................................
............................................................................................................................................................
SECTION B: The following questions relate to the Executive Management
and frontline staff commitment on CRM as well as the existing CRM system
(if any)
Unless indicated otherwise, please indicate the extent to which you agree with each of the answers for the questions that follow by circling the appropriate level.
1= Strongly Disagree, 2 = Disagree, 3 = Neutral, 4 = Agree, 5 = Strongly Agree
Q13. In your opinion, does WASCO pursue a CRM strategy?
1. Yes 2. No
If you answered ‘No’ to question 13, please answer question 14

90
Q14. What are the main reasons that make you believe that WASCO does not pursue CRM
Strategy?
1. Customers are categorized 1 2 3 4 5
2. Specific Relationship manager is assigned
for specific category of customers 1 2 3 4 5
3. Customers are well-informed about services offered by WASCO 1 2 3 4 5
4. Customer requests are addressed timely 1 2 3 4 5
5. WASCO has well-trained Frontline staff 1 2 3 4 5
6. Frontline staff understand the importance of customer relationship 1 2 3 4 5
7. Customers’ applicable information is at the disposal of frontline 1 2 3 4 5
staff at the different customer stations at all times.
8. Frontline staff performance is measured and rewarded based on 1 2 3 4 5
meeting customer needs and on successfully serving the customers
9. Service interruptions are well communicated 1 2 3 4 5
10. WASCO has centralized call-centre management 1 2 3 4 5
11. WASCO has a CRM policy in place 1 2 3 4 5
12. WASCO has a CRM software system 1 2 3 4 5
13. The software system is competently managed 1 2 3 4 5
14. WASCO`s corporate strategy gives importance to customers ‘needs 1 2 3 4 5
Q15. If you answered ‘Yes’ to question 13, why do you think WASCO does pursue CRM strategy?
............................................................................................................................................................
............................................................................................................................................................
............................................................................................................................................................
............................................................................................................................................................

91
Q16. In your opinion, does LEC pursue a CRM strategy?
1. Yes 2. No
If you answered ‘No’ to question 16, please answer question 17.
Q17. What are the main reasons that make you believe that LEC does not pursue CRM
Strategy?
1. Customers are categorized 1 2 3 4 5
2. Specific Relationship manager is assigned
for specific category of customers 1 2 3 4 5
3. Customers are well-informed about services offered by WASCO 1 2 3 4 5
4. Customer requests are addressed timely 1 2 3 4 5
5. LEC has well-trained Frontline staff 1 2 3 4 5
6. Frontline staff understand the importance of customer relationship 1 2 3 4 5
7. Customers’ applicable information is at the disposal of frontline 1 2 3 4 5
staff at the different customer stations at all times.
8. Frontline staff performance is measured and rewarded based on 1 2 3 4 5
meeting customer needs and on successfully serving customers
9. Service interruptions are well communicated 1 2 3 4 5
10. LEC has a centralized call-centre management 1 2 3 4 5
11. LEC has a CRM policy in place 1 2 3 4 5
12. LEC has a CRM software system 1 2 3 4 5
13. The software system is competently managed 1 2 3 4 5
14. LEC`s corporate strategy gives importance to customers’ needs 1 2 3 4 5
Q18. If you answered ‘Yes’ to question 16, why do you think LEC does pursue CRM strategy?
............................................................................................................................................................
............................................................................................................................................................
............................................................................................................................................................
............................................................................................................................................................

92
SECTION C: The following questions relate to the customer satisfaction and
customer loyalty in both LEC and WASCO.
Unless indicated otherwise, please indicate the extent to which you agree with each of the answers for the questions that follow by circling the appropriate level.
1= Strongly Disagree, 2 = Disagree, 3 = Neutral, 4 = Agree, 5 = Strongly Agree
Q19. Are you satisfied with WASCO service quality?
1. Yes 2. No
If you answered ‘No’ to question 19, please answer question 20.
Q20. What are the main reasons for your dissatisfaction?
1. WASCO offers quality service 1 2 3 4 5
2. The service prices are fair 1 2 3 4 5
3. Service prices affordable 1 2 3 4 5
4. You would not consider switching even if it was possible 1 2 3 4 5
5. WASCO product (Water) is of good quality 1 2 3 4 5
6. WASCO`s core values addresses customers’ needs 1 2 3 4 5
7. WASCO customers spread positive word of mouth 1 2 3 4 5
about the Company`s offerings
Q21. If you answered ‘Yes’ to question 19 why are you satisfied with WASCO service quality
............................................................................................................................................................
............................................................................................................................................................
............................................................................................................................................................
............................................................................................................................................................
Q22. Do you consider yourself a loyal customer to WASCO by choice?
1. Yes 2. No

93
If you answered ‘No’ to question 22, please answer question 23
Q23. What are the main reasons for you not to be loyal? 1. Customers sensitive to service prices 1 2 3 4 5
2. Customers segmented according to their needs 1 2 3 4 5
3. Customers managed through effective tiering/ranking 1 2 3 4 5
of service and needs
4. Customers granted loyalty rewards 1 2 3 4 5
5. Customers provided with social bonds* 1 2 3 4 5
6. Customer complaints are dealt with effectively 1 2 3 4 5
7. Clear service recovery procedure in place 1 2 3 4 5
8. Quality service delivered to customers 1 2 3 4 5
* Social bonds exist when the customer and the service provider`s frontline staff know each other well
and there is mutual trust between both parties
Q24. If you answered ‘Yes’ to question 22 why are you a loyal customer to WASCO by choice?
............................................................................................................................................................
............................................................................................................................................................
............................................................................................................................................................
............................................................................................................................................................
Q25. Are you satisfied with LEC service quality?
1. Yes 2. No
If you answered ‘No’ to question 25, please answer question 26.
Q26. What are the main reasons for your dissatisfaction?
1. LEC offers quality service 1 2 3 4 5
2. The service prices are fair 1 2 3 4 5
3. Service prices are affordable 1 2 3 4 5
4. You would not consider switching even if it was possible 1 2 3 4 5

94
5. LEC product (Electricity) is of good quality 1 2 3 4 5
6. LEC`s core values addresses customers’ needs 1 2 3 4 5
7. LEC customers spread positive word of mouth 1 2 3 4 5
about the Company`s offerings
Q27. If you answered ‘Yes’ to question 25 why are you satisfied with LEC`s service quality
............................................................................................................................................................
............................................................................................................................................................
............................................................................................................................................................
............................................................................................................................................................
Q28. Do you consider yourself a loyal customer to LEC by choice?
2. Yes 2. No
If you answered ‘No’ to question 28, please answer question 29
Q29. What are the main reasons for you not to be loyal?
1. Customers sensitive to service prices 1 2 3 4 5
2. Customers segmented according to their needs 1 2 3 4 5
3. Customers managed through effective tiering/ranking 1 2 3 4 5
of service and needs
4. Customers granted loyalty rewards 1 2 3 4 5
5. Customers provided with social bonds* 1 2 3 4 5
6. Customer complaints are dealt with effectively 1 2 3 4 5
7. Clear service recovery procedure in place 1 2 3 4 5
8. Quality service delivered to customers 1 2 3 4 5
* Social bonds exist when the customer and the service provider`s frontline staff know each other well
and there is mutual trust between both parties

95
Q30. If you answered ‘Yes’ to question 28 why are you a loyal customer to LEC by choice?
............................................................................................................................................
............................................................................................................................................
............................................................................................................................................
............................................................................................................................................
..............................................................................................................................
..............................................................................................................................
THANK YOU!