customer’s perception of service quality in the commercial
TRANSCRIPT

1
Customer’s perception of service quality in the commercial
banking sector of Nigeria:
A case study of Skye Bank PLC. Nigeria
Dissertation submitted in part fulfilment of the requirements for the degree
of Masters in Business Administration (International)
Student Name: Okoroafor Chukwuemezuo .C.
Student Number: 1212133
Supervisor: Dr. Catherine Rossiter (PhD).

2
April, 2010
DECLARATION
I declare that all the work in this dissertation is entirely my own unless the words have been
placed in inverted commas (“ „‟) and referenced with the original source. A full reference
section is included with this dissertation.
No part of the work has previously been submitted for assessment, in any form, either at
Dublin Business School or any other Institute.
Signed:……………………………………………
Date:………………….

3
ACKNOWLEDGEMENT
I give thanks to Almighty God, for giving me the strength to carry out this research. I will
like to express my profound gratitude to my supervisor, Dr. Catherine Rossiter (PhD), for her
insightful professional guidance, valuable suggestions, patience, and attention.
My sincere gratitude also goes to my Parents Mr. and Mrs. S.B. Okoroafor, My sisters, in-law
Mr. Ini Ikang for the time and effort he put in for the production of this thesis.
Furthermore, I wish to thank my fiancée Ms. Yoma Akpobome for all her support throughout
my year of study.

4
TABLE OF CONTENTS
Declaration I
Acknowledgements III
Table of Contents IV
Abstract 1
CHAPTER 1: INTRODUCTION
1.1: Background of the Study 3
1.2: The evolution of the Nigerian Banking Industry 3
1.3: Overview of Skye Bank Plc. 4
1.4: Research Objectives 6
1.5: Research Question 6
1.6: Research Hypothesis 7
1.7: Recipient for the Research 7
1.8: Scope and limitations of the Research 7
1.9: Organisation of the Dissertation 8
1.9.1: Chapter 1: Introduction 8
1.9.2: Chapter 2: Literature Review 8
1.9.3: Chapter 3: Research Methodology 8
1.9.4: Chapter 4: Data Analysis and Findings 8
1.9.5: Chapter 5: Conclusion and Recommendation 8

5
1.9.6: Chapter 6: Self Reflection 9
1.10: Major Contribution of the study 9
CHAPTER 2: LITERATURE REVIEW
2.1: Introduction 11
2.2: What are Services? 11
2.3: Service Quality 12
2.3.1: The need for and Impact of Service Quality in Banks 12
2.3.2: Perceived Service Quality in Banks 16
2.4: Customer Perception of Service Quality 17
2.4.1: Factors influencing customer perception of Service Quality 18
2.5: Determinants of Service Quality 19
2.6: SERVQUAL Model 21
2.6.1: Application of the SERVQUAL model in the retail Banking Industry 24
2.8: Customer Satisfaction 25
2.9: Customer Loyalty 27
2.10: Customer Expectation 28
2.11: Conclusion 29
CHAPTER 3: RESEARCH METHODOLOGY AND METHODS
3.1: Introduction 31
3.2: Distinguishing Between Research Method and Methodology 31
3.3: Research Philosophy 32
3.3.1: Positivism 33
6
3.3.2: Realism 34
3.3.3: Interpretivism 34
3.4: Research Approach 35
3.5: Research Choice 36
3.6: Research Strategy 37
3.6.1: Purpose for Survey Strategy 38
3.6.2: Advantages of Survey 38
3.6.3: Disadvantages of Survey 39
3.7: Time Horizon 39
3.8: Research Design 40
3.9: Credibility of the Research Findings 40
3.10: Data Collection 41
3.10.1: Secondary Data Collection 41
3.10.2: Primary Data Collection 42
3.10.3: Questionnaires 42
3.10.4: Production of Internet Questionnaires 42
3.10.5: Rationale for Internet Questionnaires 43
3.10.6: Questionnaire design process 43
3.10.7: Pilot test for the Questionnaire 44
3.11: Population and Sampling 44
3.11.1: Population 44
3.11.2: Research Population defined 44

7
3.11.3: Sampling 45
3.11.4: Sampling Technique 46
3.12: Research Ethics 47
3.13: Conclusion 47
CHAPTER 4: DATA ANALYSIS AND FINDINGS
4.0: Data Analysis and Findings 49
4.1: Quantitative data analysis and finding-Questionnaire 49
4.2: Gender 50
4.3: Age and demographics 50
4.4: Education 51
4.5: Please specify how long you have patronised the bank 53
4.6: Objective 1: To identify the factors influencing customers perception of service in
banks 54
4.7: Objective 2: To evaluate how well the bank satisfies its customers 62
4.8: Objective 3: To access the perception of retail bank customers towards bank service
quality 68
4.9: Hypothesis 1: There is a relationship between service quality and customer
satisfaction in banks 75
4.10: Hypothesis 2: Customer satisfaction has a positive significant impact on customer
loyalty 76
4.11: Conclusion 77

8
CHAPTER 5: CONCLUSIONS AND RECOMMENDATIONS
5.1: Conclusion and Recommendation 79
5.2: Objective 1: To identify the factors influencing customers perception of service in
banks 79
5.3: Objective 2: To evaluate how well the bank satisfies its customers 80
5.4: Objective 3: To access the perception of retail bank customers towards bank service
quality 80
5.5: Hypothesis 1: There is a relationship between service quality and customer
satisfaction in banks 81
5.6: Hypothesis 2: Customer satisfaction has a positive significant impact on customer
loyalty 82
5.7: Recommendation 82
5.8: Main Limitations of the study 84
CHAPTER 6: SELF REFLECTION ON OWN LEARNING AND PERFORMANCE
6.0: Self reflection 86
6.1: Introduction 86
6.2: Learning Style 86
6.2.1: Concrete experience (Kolb)-Activists (Honey and Mumford) 87
6.2.2: Reflective Observation (Kolb)-Reflectors (Honey and Mumford) 87
6.2.3: Abstract (Kolb)-Theorists (Honey and Mumford) 88
6.2.4: Active experimentation (Kolb)-Pragmatics (Honey and Mumford) 88

9
6.3: Masters Experience 88
6.4: Learning Outcomes 89
6.4.1: Research Skills 89
6.4.2: Data Analysis 89
6.4.3: Decision Making Skills 90
6.4.4: Team working Skills 91
6.4.5: Time management Skills 91
6.5: Going Forward 92
BIBLIOGRAPHY 94
APPENDICES
Appendix 1- Questionnaire Request 110
Appendix 2- Customer Perception Questionnaire 111
LIST OF TABLES AND FIGURES
2.1: Service Quality Gap Model
2.1: The determinants of Service Quality
3.1: The Research Process Onion
3.2: Deductive Process
4.1: Gender
4.2: Age
4.3: Education
4.4: Please specify how long you have patronised the bank?

10
4.5: Do you feel the bank provides accurate records of all transactions that have taken
place?
4.6: Do you feel the bank gives a well written guarantee of transaction that has taken
place?
4.7: In your opinion do you think you were informed by the bank about all the product
and services they have available at the bank at the time of opening the account?
4.8: Do you feel the bank provides secure services, for instance “well lit ATM’s for night
time banking or in a safe environment”?
4.9: Do you feel the bank has convenient hours of operation (24 hours a day, seven days
a week)?
4.10: Are you satisfied with the manner with which the staffs approach prospective
customers?
4.11: Are you satisfied with the way the bank deals with your complaints?
4.12: Do you feel the bank processes your transactions efficiently (so you do not need to
wait for long)?
4.13: Please specify any of the bank service(s) applicable to you.
4.14: On a scale of 1 to 5, where 1 stands for very poor and 5 for excellent, what is the
level of your satisfaction with the chosen service(s)?
4.15: Do you contact the bank on telephone or through the Internet when you have any
queries?
4.16: Do you get connected to the service without a waiting time?
4.17: Do you think the bank provides additional options for some customers (customers
with non-English speaking backgrounds/for sight or hearing impaired/elderly?
4.18: Has the bank ever contacted you about your needs or expectations?
4.19: Have you ever stopped using the bank because of poor service?
6.1: Kolb’s Learning Style

11
ABSTRACT
The research study is an investigation into customer perceptions of service quality in the
commercial banking sector of Nigeria: A case study of Skye Bank Plc. The overall goal of
the study is to identify the level to which customers perceive service quality currently
practised in Nigerian banking industry.
Both secondary and primary research methods were employed. About 120 Questionnaires
were administered to customers of Skye Bank Plc. Nigeria. About 101 respondents mainly
customers cooperated for this study. Analyses are presented in charts using Survey Monkey
software.
The data collected through the questionnaire showed that the majority of the customers have
positive perception towards bank services and are immensely satisfied with the quality of
service except that the bank does not provide special services for the disabled and the elderly.
The sample size was limited to only a state in Nigeria and may not be entirely representative.
The study provides a meaningful insight into the efficacy of customer‟s perception of service
quality in the Nigerian banking industry and a useful platform for future studies of service
quality in financial services industry in developing countries.

12
CHAPTER 1: INTRODUCTION

13
CHAPTER ONE
Introduction
1.1 Background to the study
prior to the adoption of service quality in Nigerian banks, the Nigerian banking sector has
been known to be characterised by many issues that have adversely affected the manner to
which customers perceive service quality. This was due to frequent changes in economic
policies made by the Nigerian government during the mid 1980‟s. A known fact was the
introduction of the structural adjustment programme (SAP) in 1986 which led to a floodgate
of banking licenses within the financial services industry.
Between the period of 1985 and 1993 merchant and commercial (licensed) banks operating in
Nigeria increased from 41 to 120 (Central Bank of Nigeria, 1995). By 2004, there were 89
banks operating in Nigeria with many banks having capital base of less than US$ 10 million,
and about 3300 branches compared to 8 banks in South Korea with 4500 branches or one
bank in South Africa with larger assets than all the 89 banks in Nigeria (Soludo .C., Central
Bank of Nigeria 2004).
In order to revive the Nigerian banking industry, the Central Bank of Nigeria (CBN) on July
6th
2004 enacted a decree for banks in Nigeria to increase their share holder capital from the
initial N2 billion to N25 billion with a deadline of December 31,2005. By the end of
December 2005, 25 banks emerged from the 89 banks either through mergers and
acquisitions or by means of organic growth.
Nevertheless, the study seeks to determine customer perception of service quality in the retail
banking sector of Nigeria. To achieve the purpose of this study, one bank: Skye Bank Plc.
that was involved in a merger during the bank consolidation of 2004 and 2005; will be used
as a case study.
1.2 THE EVOLUTION OF THE NIGERIAN BANKING INDUSTRY

14
The first bank in Nigeria was established in 1892, the bank was known as the African
Banking Corporation. The bank was under the control of the British Colonial masters and by
the 1930s, several wholly or partially home-grown banks were established, but the majority
of these banks collapsed subsequently. Banking legislations were nonexistent until 1952, at
which point Nigeria had three foreign banks (the Bank of British West Africa presently
known as First Bank PLC, Barclays Bank now known as Union Bank, and the British and
French Bank presently known as United Bank of Africa) and two indigenous banks (the
African Continental Bank and National Bank of Nigeria). The Central Bank of Nigeria was
established by the CBN act of 1958 and by July 1, 1959 commenced operation and was
authorised to regulate the Nigerian banking industry.
In the 1970s, the Nigerian government initiated direct controls in the banking system, through
the means of ownership, as well as through credit controls and interest rate. As part of an
“indigenisation wave” that had the goal of securing domestic majority ownership of
strategically significant sectors, a number of foreign-owned banks were nationalised, since no
indigenous purchaser could be found (Beck, et al; 2005).
Following the introduction of the Structural Adjustment Programme (SAP) in 1986, the
Nigerian government embarked on a broad programme of financial liberalisation. Interest
rates and entry requirement (in terms of granting bank licenses) were liberalised, and credit
allocation quotas were loosened. The outcome was the dramatic expansion in the amount of
banks operating in Nigeria. However, some of these banks attracted a significant share of
banking industry and have brought benefits for customers in terms of greater contribution and
improved services. Lewis and Stein, (2002) stressed that the number of banks tripled from 40
to nearly 120 in the late 1980s to 90s, employment in the financial services sector doubled
and the contribution of the financial system to GDP almost tripled.
The boom in the financial services sector was accompanied by financial disintermediation.
Deposits in financial institutions and credit to the private sectors, both relative to GDP,
decreased over the period 1986 to 1992. The increasing number of banks and human capital
in the financial industry was thus channelled into arbitrage and rent-seeking activity rather
than financial intermediation (Beck, et al; 2005).
By the 90s, the Nigerian banking industry went from boom to burst; this was as a result of the
increase in non-performing loans (NPL) and insider lending. Especially the merchant banking

15
sector where most of the foreign exchange speculators were concentrated- and the
government owned banks showed increasing signs of distress. The central bank in 1991
introduced new prudential guidelines and also imposed a suspension on new licenses.
Towards the end of the 90s, a number of the banks were liquidated either voluntarily or as
result of actions of failed bank tribunal established in 1994 by the military government to
prosecute cases of misconduct and fraud in the banking industry (Beck, et al; 2005).
However, the Nigerian banking industry has been transformed by the Central Bank of
Nigeria‟s (CBN) July 16th
2004 introduction of the recapitalisation program. Through this
process the numbers of banks were reduced from 89 to 25 by 2005 ending. Presently, the
number of banks has now reduced to 24 following Standard Bank‟s takeover of IBTC. The
banking licenses of 14 banks were revoked. Nevertheless, the objective of the policy thrust
was to build and foster a competitive and healthy financial system to support development
and to avoid systematic distress in the Nigerian banking sector (NPC, 2004; Soludo, 2006).
The reform was to address: shallow dept of the Nigerian capital market, over-dependence of
banking institutions on public sector and foreign exchange trading as sources of funding;
somewhat erroneous returns made by banks to the monetary authorities, and noticeable lack
of harmony between fiscal and monetary policies (NPC, 2004).
1.3 OVERVIEW OF SKYE BANK PLC
Skye Bank PLC has evolved into one of the top financial institutions in Nigeria, after its very
seamless consolidation exercise in January 2006. It is a medium size bank comprising the
merged Prudent Bank, EIB International Bank, Reliance Bank, Cooperative Bank and Bond
Bank. Building on the legacy of two of its largest constituent banks, Skye Bank has become
an active mid-sized operator, with full service operations (Afrinvest, 2009).
The bank operates as a group that provides facets of financial products and services powered
by a purpose built technological framework that supports the service delivery process to
customers.
With a historical ownership and business relationship with the Lagos State Government, the
bank remains an active player in the sub-national public sector space, particularly regarding
revenue collection and public sector financing business (Afrinvest, 2009).

16
The bank is publicly quoted with over 300,000 shareholders that have shareholding structure
that puts no more than 5% in the control of any one individual or company. To date the group
operates out of over 250 branches and transaction centres across Nigeria serviced by over
6000 professional bankers and business experts within N1 Trillion ($7 Billion) balance sheet
size (www.skyebankng.com). In addition, Skye Bank also operates in the traditional
corporate and commercial banking space including exposure to telecommunications, oil and
gas, power, manufacturing, transportation and infrastructure financing business. As part of its
full-service ambitions, the group operates mid-sized subsidiary companies focused on
insurance, capital markets, mortgage origination and trustees/asset management.
In respect of the groups‟ growth and expansion strategy, Skye bank began the process of
exploring commercial and business opportunities in other African countries. The group
concentrated mainly on West African countries. The following are the countries currently
covered under the expansion project Sierra Leone, The Gambia, Liberia, Sao Tome and
Principe, Angola, Congo (DRC), Guinea and Equatorial Guinea. The primary focus is to
develop competencies in countries with similar business culture as Nigeria.
1.4 RESEARCH OBJECTIVE
Saunders, et al., (2007) emphasised that a research may begin with a general focus research
question that generates more detailed research questions, or the general focus research
question as a base from which research objectives could be written. The research objectives
of this study are:
To identify the factors influencing customer perception of service quality in the
Nigerian retail Banks.
To evaluate how well the bank satisfies its customers
To assess the perception of the retail bank customers towards bank service quality.
1.5 RESEARCH QUESTION:
It is of great importance of defining clear research questions at the beginning of the research
process. The importance of this cannot be overemphasised. The key criteria of successful
research will be whether you have a set of clear conclusions drawn from the data collected
(Saunders et al., 2007). However the research question of this study is:

17
How do retail bank customers perceive service quality in Skye Bank PLC.?
1.6 RESEARCH HYPOTHESES:
A hypothesis can be defined as the testable proposition about the relationship between two or
more events or concepts Saunders et al; (2007). Therefore the research hypotheses for this
research are:
There is a relationship between service quality to customer satisfaction
customer satisfaction has a positive significant impact on customer loyalty
1.7 RECIPIENT FOR THE RESEARCH
The principal recipient of this dissertation entitled: “Customer Perception of Service Quality
in the Commercial Banking Sector of Nigeria”: A case study of Skye Bank Plc.
Dublin Business School.
Business Research Methods Module Tutor.
The Liverpool John Moore University.
Skye Bank Plc Nigeria.
However, the research would be of immense importance to all stakeholders in the retail
banking sector.
1.8 SCOPE AND LIMITATIONS OF THE RESEARCH
The research project aims to study customer‟s perception of service quality in the Nigerian
retail banking sector: Skye Bank Plc was adopted as a case study. The scope is to determine
whether customers are satisfied with the level of service quality that is been provided by the
bank.
The research would involve surveying customers of Skye Bank PLC. Furthermore, an
analysis of existing literature and data available on the topic of service quality will be
undertaken. This would involve Journals, books, and internet articles that relate to this topic.

18
Limitations
There are few limitations in relation to the study. These limitations are outlined below-
Firstly, is that the research was focused only on Skye Bank PLC Nigeria as a
representative of the banking industry.
The study was delayed as approval had to be acquired from the management, which
led to cutting of the planned sample size as a result of time constraint.
1.9 ORGANISATION OF THE DISSERTATION
The dissertation is divided into six chapters and they are listed below.
1.9.1 Chapter 1: Introduction
This chapter presents a brief background of the intended research topic, and it also defines the
research objective and question. In this chapter, the hypotheses are highlighted, as well as the
research scope and limitations, and contribution of the research.
1.9.2 Chapter 2: Literature Review
This chapter starts with an introduction on the general research and further discussions on
the topics that relate to the topic of the research. It also outlines the views of key theorists in
services marketing and it will also discuss the limitations related to their works.
1.9.3 Chapter 3: Research Methodology
This chapter outlines the details and explanation of the term research methodology, critical
review of the methodology and the underlying principle for selecting it will be outlined in
this chapter. The research philosophy for the dissertation would be discussed in this chapter,
as well as the population selection and sampling process for the primary research.
1.9.4 Chapter 4: Data analysis and finding
This chapter presents the data analysis and the findings from the primary research conducted
during the study.
1.9.5 Chapter 5: Conclusion and Recommendation

19
The chapter highlights and gives a summary of the main findings in relation to the original
aim of the study, and also gives the appropriate recommendations based on the results
obtained.
1.9.6 Chapter 6: Self Reflections
This chapter gives an analysis of self reflection on learning. This section would also present
an evaluation of the researcher‟s skills and development throughout the researcher masters
degree programme.
1.10 Major contribution of the study
Relevant contributions are made in the different sections of the research work. The literature
review emphasises on the factors influencing customer perception of service quality in the
banking industry irrespective of the geographical location. Also, the research, establishes the
relationship between service quality, customer satisfaction and customer expectation as well
as providing tools for the Nigerian banking industry to improve on service quality.

20
CHAPTER 2: LITERATURE REVIEW

21
CHAPTER 2
LITERATURE REVIEW
2.1 Introduction
In this chapter, revision of the relevant literature is undertaken to provide an overview of the
secondary data referred for the development of this research project. The chapter is divided
into various sections. The first section starts on with the outlook pertaining to the meaning of
services, service quality as well as the need for and impact of service quality in banks and the
determinants of service quality and conceptual models in relation to the term service quality.
The next presents the literature in reference to customer satisfaction, customer loyalty and
customer expectations.
2.2 What are Services?
Concepts of service are of great importance, in developed countries as well as in the
developing countries, this is because of the impact it has in businesses across the world.
Kotler, et al., (2006) defined services as a form of product that consists of activities, benefits,
or satisfactions offered for sale that are essentially intangible and do not result in the
ownership of anything. Examples are banking, hotel, airline, retail, tax preparation, and home
repair services. Gronroos, (1990) was of the opinion that service is a process consisting of
series of more or less intangible activities that normally, but not necessarily, take place in
interactions between the customer and service employees and or physical resources or goods
or systems of the service provider which are provided as solutions to customer problems.
Zeithaml, et al., (1985), summarised the distinct characteristics between goods and services
in that services are heterogeneous, intangible, inseparable, and perishable which cannot be
stored. This results in heterogeneity and high variability in supply and performance of
services. Service delivery also depends on the producer (bank), who is not always able to
guarantee homogeneity in service delivery, so that services performed may not be those
promoted to consumers (Langeard, et al., 1981).

22
Service has three basic attributes. The first are processes consisting of activities, second
being the extent produced and consumed concurrently and thirdly the customer participation
in the production process to an extent. The differences between goods and pure services are
intangibility, simultaneous production, consumption and heterogeneity. At the designing
stage, a proper service system keeps in view the organisations service specifications and
competitors service specifications. Service organisations aim to keep their customers
satisfied by delivering service according to the standards and functions on quality parameters.
Increase in the service industry across the world has made organisations realise the need to
differentiate from the competitors in some form or the other by providing better service to its
customers and at the same time focus on service quality to attain financial gain. Service
quality has become a critical factor in enabling firms to achieve a differential advantage over
their competitors, and it thus makes a significant contribution to profitability and
productivity.
2.3 Service Quality
Nejati, et al. (2009) emphasised that service quality as a concept, has received much attention
in service marketing literature because of its sustainability as a source of competitive
advantage. The concept of service quality developed from the marketing discipline due to the
difficulty in applying product quality definitions to services (Gronroos, 1982; Lehtinen and
Lehtinen, 1982). Numerous researchers have given different definitions for service quality.
Kasper, et al., (1999) as cited by Nejati, et al., (2009) defined service quality as “the extent to
which the service, the service process and the service organisation can satisfy the
expectations of the user”.
Parasuraman, et al., (1988) defined service quality as “a function of the difference between
service expected and customers‟ perceptions of the actual service delivered”. Gronroos,
(1978) suggests that service quality is built of two components-technical quality and
functional quality. Technical quality refers to what the service provider delivers during the
service provision while functional quality is how the service employee provides the service.
Parasuraman, et al., (1985); Dawkins and Reichheld, (1990); Reichheld and Sasser, (1990)
and Zeithaml et al., (1990) are of the view that in this “customer age”, delivering quality

23
service is considered an essential strategy for success and survival in today‟s competitive
environment.
Based on this notion, the relevance of service quality can be seen a key driver of growth to
organisations, especially the banking industry.
2.3.1 The need for and Impact of Service Quality in banks
Banks in over the world offer similar kinds of services (Lim & Tang, 2000), quickly
matching their competitors‟ innovations. Banks have understood the importance of
concentrating on service quality as a means to increase customer satisfaction and loyalty, and
to improve their core competence and business performance (Kunst & Lemmink, 2000;
Stafford, 1996). This understanding stems from believing that service quality is difficult for
competitors to copy (Reichheld & Sasser, 1990).
Johnston, (1995) stated that service quality is customers‟ overall impressions of an
organisation‟s services in terms of relative superiority or inferiority. It should not only meet
but also exceed customer expectations and should include a continuous improvement process
(Lloyd-Walker & Cheung, 1998). Customers evaluate banks‟ performance mainly on the
basis of their personal contact and interaction (Grönroos, 1990). Judgments are formed by
comparing service expectations with the service actually received (Bloemer, et al., 1998).
In terms of qualitative benefits, customer satisfaction and loyalty have been perceived as
major concerns; it is widely accepted that a business must concentrate on pursuing service
quality to achieve customer satisfaction because survival of the business greatly depends on
that satisfaction (Naumann, 1995). Service quality determines the rate of customer
satisfaction, customer loyalty and ultimately, the competitive advantage of an organisation.
(Leonard and Sasser 1982; Cronin and Taylor, 1992; Gammie 1992; Hallowell, 1996; Chang
and Chen, 1998; Gummesson, 1998; Lasser et al., 2000; Silvestro and Cross, 2000; Newman,
2001; Sureshchander et al., 2002; Guru, 2003; Seth, et al., 2005) all agreed that “During the
past few decades service quality has become a major area of attention to practitioners,
managers and researchers owing to its strong impact on business performance, lower costs,
customer satisfaction, customer loyalty and profitability”.
Parasuraman, et al., (1985) proposes that service quality is a function of the differences
between expectations and performance along the quality dimensions.

24
In the report by Lewis, (1991), an international comparison of bank customers‟ expectations
and perceptions of service quality were made. It was found that in spite of the existence of
very high expectations of service quality and high perceptions services received, gaps did
exist.
Quality in the financial service industry (banks) entails focus on customer care and customer-
centric attributes. The success of any business model depends not just on margins but more
on ensuring the delivery of value based services to the customers. Delivery of quality service
depends on identifying the gaps between the perceived service quality the customer receives
and what they expect (Zeithaml, Parasuraman and Berry, 1990). Figure 2.1 shows these gaps.

25
Fig 2.1: Service Quality Gap Model
Source: Fig: 2.1 presents the service quality gap model by (Parasuraman, et al. 1985).
The gap identified in the Figure 1 identifies Gap 1 as the difference between what customers
expect of a service and what management perceives customers to be expecting. Gap 2 shows
the difference between what management perceives customers as expecting and the quality

26
specifications set service delivery. Gap 3 shows the difference between the quality
specifications set for service delivery and the actual quality of service delivery. Even if Gap 1
is closed and customer expectations have been accurately determined, Gap 2 and 3 could
probably create a problem. Gap 4 show the actual service delivery that is described in the
organisations external communications. This gap is concerned with the actual performance of
service and what the organisation promised to deliver in its external communications. Finally,
the importance of Gap 5 is to evaluate the difference between customer‟s expectation of
service and their perception of service actually delivered. The goal of Nigerian banks must be
to close this bank or at least narrow them as far as possible (Owusu-Frimpong, 2008).
2.3.2 Perceived Service Quality in Banks
Perceived service quality is a consumers judgement (a form of attitude) that has an outcome
based on comparisons consumers make between their expectations and their perceptions of
the actual service performance (Lewis, 1989) as cited by Bahia and Nantel, (2000). It is also
considered to be a dynamic phenomenon that changes with the receipt of various types of
delivered service (Boulding, et al; Hamer et al., 1999; Hamer, et al 2006).
Sureshchander, et al., (2001) emphasised that perceived service quality portrays a general;
overall appraisal of service and it could occur at multiple levels in an organisation for
instance banks.
Bahia and Nantel, (2000), pointed out that, in the banking sector, perceived service quality
results from the difference between customers‟ perceptions for the services offered by the
bank (received service) and their expectations in comparison with the banks that offer such
services (expected service).
Parasuraman, et al., (1988) suggested a five dimension construct of perceived service quality:
Tangibles
Reliability
Responsiveness
Assurance; and
Empathy

27
These five dimensions of dimensions of perceived service quality constitute the framework of
SERVQUAL, probably the best known universal scale designed to measure perceived service
quality in banks.
2.4 Customer Perception of Service Quality
Customer perception of service quality influences consumer behaviour (Bitner, 1990) and
intention (Henning-Thurau and Klee, 1997; Dutta and Dutta, 2009). Organisations can
provide the best services to their utmost capabilities but if the customer does not perceive
them to be of quality, all is vain. Thus it is very essential for the service provider to
understand how customers can perceive the service as quality service and carry a euphoric
feeling (Dutta and Dutta, 2009). It is the task of the marketing people to understand the
factors affecting customer perception, elements of service quality and satisfaction to have a
competitive edge and to create a perceptual difference. If all these are considered and then the
service provider targets the customers with a total service experience, the customer perceives
the service as quality and spreads positive word of mouth. Thus perception is one of the
factors affecting customer satisfaction (Zeithaml and Bitner, 2003; Dutta and Dutta 2009).
However, Customer perceptions are those processes that shape and produce what one actually
experiences. Customer perceptions are influenced by many external and internal factors such
as cultural, social, psychological and economic factors, making the way in which customer
perceives products and service highly subjective (Reisinger and Wryszak, 1994). Therefore
measuring customer perception of service is important as the customer‟s evaluation of service
and future behaviour depends on the customer perception of service.
In a situation where there is a gap between perception of service and expectation, where
perception falls completely short of expectation after comparison or where service meets or
exceeds customer expectation, it can result in either a dissatisfied or a satisfied customer after
the service encounter.

28
2.4.1 Factors influencing customer perception of service quality
Zeithaml and Bitner, (1996) identified four factors that influence customer perception of
service quality: They are- service encounters, the evidence of service, image and price. These
form customers overall perception of service quality, satisfaction and value.
1. Service encounters: Verbal and non-verbal behaviour are as important determinants
of quality as tangible cues such as the equipment and physical settings (Zeithaml &
Bitner, 1996).
2. Evidence of service: due to the intangibility of services and the simultaneity of
production and consumption, customers are searching for clues to help them
determine the level of service. Three major categories of evidence have been
identified:
Employees- how they are dressed, their personal appearance and their attitude and
behaviour
Process- whether the service is complex, bureaucratic; and
Physical evidence- all the tangible aspects of the service such as reports, equipment,
statement, and in most cases the physical facility where the service is offered (the
branch).
3. Image and reputation. The set of perceptions reflected in the associations held in the
memory of the consumer (Keller, 1993; Kangis & Voulkelatos 1997). These can be
specific (e.g. hours of operation, ease of access), or in terms of an intangible nature
(e.g. trustworthiness, tradition, reliability). A favourable image can influence
positively perceptions of quality, value and satisfaction.
4. Price- if the price is high, customers are likely to expect high quality, and their actual
perceptions will be influenced accordingly. If the price is too low, customers might
have doubts about both the ability of the organization to deliver quality and about the
actual level of service received.
29
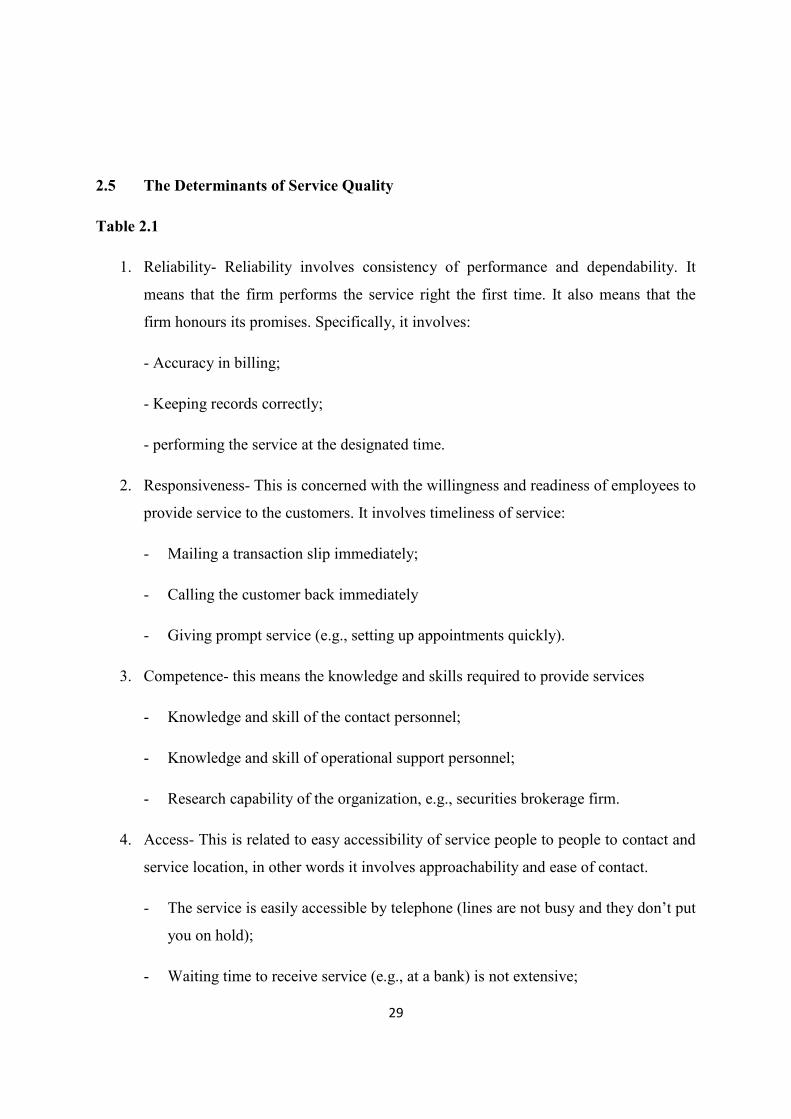
2.5 The Determinants of Service Quality
Table 2.1
1. Reliability- Reliability involves consistency of performance and dependability. It
means that the firm performs the service right the first time. It also means that the
firm honours its promises. Specifically, it involves:
- Accuracy in billing;
- Keeping records correctly;
- performing the service at the designated time.
2. Responsiveness- This is concerned with the willingness and readiness of employees to
provide service to the customers. It involves timeliness of service:
- Mailing a transaction slip immediately;
- Calling the customer back immediately
- Giving prompt service (e.g., setting up appointments quickly).
3. Competence- this means the knowledge and skills required to provide services
- Knowledge and skill of the contact personnel;
- Knowledge and skill of operational support personnel;
- Research capability of the organization, e.g., securities brokerage firm.
4. Access- This is related to easy accessibility of service people to people to contact and
service location, in other words it involves approachability and ease of contact.
- The service is easily accessible by telephone (lines are not busy and they don‟t put
you on hold);
- Waiting time to receive service (e.g., at a bank) is not extensive;

30
- Convenient hours of operation;
- Convenient location of service facility.
5. Courtesy- Courtesy involves politeness, respect, consideration, and friendliness of
contact personnel (including receptionists, telephone operators, etc). It includes:
- Consideration for the customer‟s property
- Clean and neat appearance of public contact personnel
6. Communication- This is referred to as informing customers about service and process.
In other words keeping them informed in a language they understand and listening to
them. It may entail that the service organization has to adjust its language for different
consumers-increasing the level of sophistication with a well-educated customer and
speaking simply and plainly with a novice. It involves:
- Explaining the service itself;
- Explaining how much the service will cost;
- Explaining the trade-offs between service and cost;
- Assuring the consumer that a problem will be handled
7. Credibility- Involves trustworthiness, honesty. It involves having the customer‟s best
interests at heart. Contributing to credibility are:
- Company name;
- Company reputation;
- Personal characteristics of the contact personnel;
- The degree of hard sell involved in interactions with the customers.
8. Security- this is the freedom from danger, risk, or doubt. It involves:
- Physical safety (will I get mugged at the ATM?);
- Financial security (Does the company know where my stock certificate is?);

31
- Confidentiality (are my dealings with the company private?).
9. Understanding- this involves making an effort to understand the customer‟s needs. It
also involves:
- Learning the customer‟s specific requirements;
- Providing individualised attention;
- Recognizing the regular customer.
10. Tangibles- it includes the physical evidence of the service.
- Physical facilities;
- Appearance and personnel;
- Tools or equipment used to provide the service;
- Physical representations of the service, such as plastic credit card or a bank
statement;
- Other customers in the service facility.
Sourced from- Parasuraman, A., Zeithaml, V.A., Berry, L.L., (1985).
2.6 SERVQUAL MODEL
One of the notable models used in service quality framework is the SERVQUAL. It is a
model that accounts for both expectations and perceived performance (Yu, et al., 2008). The
model proposes that customers evaluate the quality of a service on five distinct dimensions:
reliability, responsiveness, assurance, empathy, and tangibles. The SERVQUAL instrument
comprise of 22 statements for assessing consumer perceptions and expectations with their
perceptions of service delivered by the service providers (Zeithaml, et al., 1990; Munhurrun,
et al., 2010). It can also be argued that the factor underpinning the delivering of good
perceived service quality is actually meeting the expectations of the customers. Thus,
excellent service quality is exceeding the customers‟ expectations. Zeithaml and Bitner,
(2000) suggested that customer expectations are beliefs about a service that serve as
standards against which service performance is judged.

32
Parasuraman, et al., (1988) as cited in Munhurrun, et al. (2010) suggested that customer
expectations are what the customers think a service should offer rather than what might be on
offer. Zeithaml, et al., (1990) identified four factors that influence customer‟s expectations:
word-of-mouth communications; personal needs; past experience; and external
communications. A gap is created when the perceptions of the delivered service is not as per
the expectations of the customer. This gap is addressed by identifying and implementing
strategies that affect perceptions, or expectations, or both (Parasuraman et al., 1985; Zeithaml
et al., 1990; Munhurrun, et al., 2010). Parasuraman, et al., (1988) stated that SERVQUAL
had been designed to be “applicable across a broad spectrum of services” and the format
could be adapted to fit specific needs, and that it would be most valuable when used to track
service quality trends periodically. Parasuraman, et al., (1988) proposed that the
SERVQUAL model could be extended to measure gaps in quality and therefore be used as a
diagnostic tool to enable management to identify service quality shortfalls. The gap score is
calculated by the perception statement being deducted from the expectation statements. If any
gap scores turn out to be positive then this implies that expectations are actually being
exceeded. This would allow the service manager to review whether they need to re-deploy
resources to areas of underperformance (Wisniewski, 2001; Munhurrun, 2010). The
SERVQUAL model ascertains the level of service quality based on the five key dimensions
and also identifies where gaps in service exist and to what extent.
Reliability- the ability to perform the promised service dependably and accurately
Responsiveness- the willingness to help customers and to provide prompt service
Assurance- the knowledge and courtesy of employees and their ability to convey trust
and confidence
Empathy- the provision of caring, individualised attention to customers.
Tangibles- the appearance of physical facilities, equipment, personnel, and
communication materials.
Despite the fact that the SERVQUAL instrument has been widely adopted in service
marketing research, it has received tremendous criticism from various authors. (Asubonteg, et
al., 1996; Buttle, et al., 1996) argued that there has been concern about the central role of
expectation and the significance of reductive “gap” as a measure of quality. (Babakus and

33
Mangold, 1989; Carman, 1990; Bresinger and Lambert, 1990; Finn and Lamb, 1991;
Babakus and Boller, 1992; Spathis et al., 2004) affirmed this by highlighting that the
universality of SERVQUAL dimensions across different types of service has been
questioned. Gilmore and Carson, (1992) criticised the SERVQUAL model by establishing
that it lays emphasis on service and product dimensions and it neglects other dimensions of
the marketing mix, especially price.
On the other hand, Bahia and Nantel, (2000) consequently came up with a model called bank
service quality (BSQ). Their aim was to use it in measuring perceived service quality in retail
banking. The (BSQ) model is an extension of the original ten dimensions of Parasuraman, et
al. (1985). Bahia and Nantel, (2000) incorporated additional items such as courtesy and
access and items representing the marketing mix of “7Ps” (product/service, place, process,
people, physical environment, price, promotion). ). Bahia and Nantel, (2000) also suggested
that the instrument consists of 31 items of service quality relevant to the banking sector.
These 31 items are distributed across six dimensions:
1. Effectiveness and assurance
2. Access
3. Price
4. Tangibles
5. Service portfolio and
6. Reliability
Effectiveness and assurance- effectiveness refers to the effective delivery (particularly the
friendliness and courtesy of employees) of service and the ability of staff to inspire feeling of
security. Assurance is the ability of staff to exhibit communication skills and to deal
confidentially with the client‟s requests. Access looks at the speed of service delivery. Price
measures the cost of service delivery. Tangibles assess the appearance and cleanliness of a
banks physical facility. Service portfolio assessed the range, consistency, and innovation of
the bank‟s products. Reliability measures the ability to perform the promised service
accurately and without any form of error.

34
Although, the SERVQUAL approach has its shortcomings, it has important advantages
among which are: acceptance as a standard for assessing different dimensions of service
quality and validity for a number of service situations.
2.6.1 Application of SERVQUAL In the retail banking industry
The retail banking industry was one of five service categories that were used in the original
development of the SERVQUAL scale (Parasuraman, et al, 1988; Ladhari, 2009). Studies by
Parasuraman, et al., (2009) as cited by Ladhari, (2009) reported that the SERVQUAL scale
exhibited good reliability and validity in this context. However, relatively few subsequent
studies have replicated the use of the SERVQUAL scale in banking industry (Arasli, et al
2005; Lam 2002; Zhou, et al 2002; Chi Cui, C., et al 2003; Zhou, L. 2004; Ladhari, 2009).
Lam, (2002) used SERVQUAL in the banking sector in Macau (China). Rather than the five
generic SERVQUAL dimensions, the results of the Macau study suggested that six distinct
dimensions existed: (i) „assurance‟; (ii) „tangibles‟; (iii) „reliability‟; (iv) „responsiveness‟; (v)
„empathy 1‟ (tacit understanding of need); and (vi) „empathy 2‟ (convenient operating hours).
Regression analysis showed that „assurance‟ and „reliability‟ were the most important
dimensions in explaining overall service quality. Nevertheless, Lam, (2002) further reported
that the items comprising the dimensions of „assurance‟, „responsiveness‟ and „empathy‟
tended to load in an unstable manner.
Zhou, et al., (2002) used data collected from surveys of Chinese bank customers to examine
the dimensionality and predictive validity of SERVQUAL. The 22 items yielded a three-
factor solution for „performance‟ scores (and for „gap scores‟), but a six-factor pattern
emerged for the „expectations‟ scores.
The result showed that neither the performance perception scores nor gap scores were
significant determinants of customer satisfaction or switching behaviours.
Chi Cui, et al., (2003) replicated SERVQUAL in the banking sector in South Korea and
reported that the original five dimensions were not confirmed in their sample. They
concluded that SERVQUAL scale should not be used without appropriate adaption in the
banking sector in Korea.

35
Zhou, (2004) explored the multidimensional nature of the SERVPERF scale in the banking
sector in China. The author found a three-factor pattern. The first dimension,
„empathy/responsiveness‟ was mainly composed of items related to the original dimensions
of „empathy‟ and „responsiveness‟ from the SERVPERF scale. The second dimension,
„reliability/assurance‟ contained items from the original dimensions of „reliability‟ and
„assurance‟. The third dimension, „tangibles‟ represented the „tangibility‟ dimension of
SERVPERF scale.
Arasli, et al, (2005) replicated SERVQUAL in the Cyprus banking sector and found a three-
dimensional structure. The items for the „responsiveness‟ and „empathy‟ dimensions loaded
on the same dimension, and the „assurance‟ dimension was eliminated because of poor factor
loading.
2.8 Customer Satisfaction
Gerportt, et al., (2001) as cited by Hansemark, (2004) described customer satisfaction as a
direct determining factor in customer loyalty, which in turn, is a central determinant of
customer retention. Hansemark, (2004) description suggests that customer satisfaction is
based on desired customer‟s service experience.
Moutinho and Brownlie, (1989) explored the nature and direction of the satisfactions that are
delivered to consumers of bank services. The authors found out that respondents had high
levels satisfaction with regard to the location and availability of branches and ATMs, and
acceptance of the current levels of banking fees: but expressed some cautions in their
evaluation of new and improved service.
Luo and Homburg, (2007) pointed out that customer satisfaction has emerged as a key
variable in many firms, and it has been shown to affect many other performance-related
variables. Customer satisfaction with an organisation‟s products or services is often perceived
as a driver for the organisation‟s success and long-term competitive advantage. Management
theorists and consultants have urged organisations to focus on their customer‟s needs and
satisfaction. Over the past decades, the concern of managers has been the need to focus on
customer satisfaction, as a route to sustained high performance. Burns et al., (2006) regarded
customer satisfaction as a primary determining factor of repeat patronising and purchasing
behaviour. Owning to this, integration of customer satisfaction into service quality obviously
contributes to the organisation.

36
Satisfaction has been conceived in numerous ways in literatures of marketing. Researchers
such as Cronin and Taylor, (1992) as cited by Pappu et al., (2006:5) have debated that
satisfaction is a transaction-specific measure. Satisfaction is viewed by other researcher like
Anderson et al., (1994) as an overall evaluation based on the total purchase consumption and
experience. Generally, satisfaction has been conceived in terms of whether the product or
service meets the consumer‟s needs and expectation.
Piercy, (1995) expresses that many management theorists and consultants urge companies to
focus on their customer‟s needs and satisfaction – this is common to strategic management,
the marketing concept, the pursuit of excellence, market-orientation, total quality
management, relationship marketing strategies and service quality theorist‟s. In essence, the
needs of customers and the extent to which they are met will have a significant impact on
organisations.
Furthermore, authors like Grönroos, (1991) and Kotler and Armstrong, (2006) emphasized
that customer satisfaction is an emotional attitude generated towards a product, resulting from
the comparison of what was expected and what was received. That is, customers compare
their expectations from a product or service with their perceptions of what they received
eventually. The customers are satisfied if perceptions meet or exceed expectations while on
the other hand; they are unsatisfied with the service if expectations are not met.
Blanchard and Galloway, (1994); Heskett et al., (1990) as cited by Hallowell (1996) argues
that customer satisfaction is the result of a customer‟s perception of the value received in a
transaction or relationship – where value equals perceived service quality relative to price and
customer. Customer satisfaction is an immensely important matter for marketing managers,
especial those in the banking industry.
Bennett, (2004) states that the most mentioned outcome of the marketing process is a
satisfied customer. Levesque et al. (1996) expresses that in banking, there is an ongoing
relationship between the service provider and the customer. On the other hand, Bennett
(2004) disagrees with the statement by suggesting that there is no positive relationship
between customer satisfaction and repeat purchase in the banking industry. (Bloemer et al.
1998; Pont and Maquilken 2005; Leverin and Liljander 2006) agreed that customer
satisfaction with a bank relationship is a good basis for loyalty, though it does not guarantee
it, because even satisfied customers switch banks (Nordman, 2004). From the above, it can be
affirmed that there exists a relationship between customer satisfaction, loyalty and marketing
process in the banking industry.

37
2.9 Customer loyalty
The most widely accepted definition of loyalty is by (Jacoby and Kyner, 1973; McMullan
and Gilmore 2008), who described loyalty as the biased (i.e. non-random), behavioural
response (i.e. purchase), expressed over time, by some decision making unit, with respect to
one or more alternative brands out of a set of such brands, and is a function of psychological
(i.e. decision making, evaluation) processes.
However, Oliver (1999) criticises this with similar definitions (Dick and Basu, 1994), based
on the collective failure to provide a unitary definition and the reliance on three phases;
cognition, affect and behavioural intention. These three phases lead to a deeply held
commitment, predicting that consumers develop loyalty in a linear fashion. Oliver, (1999)
lays more emphasis on situational influences adding a fourth phase, action characterized by
commitment, preference and consistency while recognising the dynamic nature of the
marketing environment. Thus he defines customer loyalty as a deeply held commitment to
rebuy or repatronize a preferred product or service consistently in the future, causing
repetitive same brand or same brand-set purchasing, despite situational influences and
marketing efforts (Oliver, 1999). He does not distinguish between proactive loyalty and
situational loyalty calculated by frequency of purchase. The consumer frequently buying the
brand and settling for no other determines proactive loyalty. Situational loyalty is exhibited
when the consumer purchases a product or service for a special occasion. This is particularly
important within services, which are purchased annually. Thus customer loyalty is not
uniquely concerned with frequency and depth of purchase (behavioural dimensions) of one
brand over another; rather as the situation or opportunity arises.
Syzmigin & Carrigan, (2001) as cited in Ehigie (2006) was of the opinion that customer
loyalty is a feeling of commitment on the part of the consumer to a product, brand, marketer,
or services above and beyond that for the competitors in the market-place, which results in
repeat purchase. A research by Fisher (2001) on customer loyalty stated that a loyal customer
to a bank is, thus, one that will stay with same service provider, is likely to take new products
with the bank and is likely to recommend the bank services.

38
Evidence abounds (e.g. Duncan & Elliot, 2002; Kish, 2000; Ehigie, 2006) showing links
between customer loyalty and organisation profitability, implying that any organisation with
loyal customers has considerable competitive advantage.
2.10 Customer Expectation
Customers are the core focus of any organization and thus of prime importance to the
marketers. It is important for the service providers to know the level of customer expectations
so that they can meet and even exceed them to gain maximum customer satisfaction. Hence
understanding customer expectations is a prerequisite for delivering superior service
(Parasuraman et al., 1991).
In a highly competitive industry like the financial service sector, expectation can thus rise
quickly.
According to Zeithaml et al (2009), Customer expectations are beliefs about a service that
serves as standards or reference points to which the performance of the service is judged. It
was further affirmed that expectations have been viewed as benchmarks consumers use to
determine satisfaction (Cadotte et al., 1987; Churchill and Surprenant, 1982; Boulding et al.,
1993; Churchill and Surprenant, 1982; Parasuramnn et al 1985; 1988; Licata et al 2008).
However, Boulding et al (1993), maintain two principal conceptualisations of expectation
exist. The first holds that customer expectations are viewed as predictions made by customers
about what is likely to happen during an impending transaction or exchange. Alternatively the
term expectation has been used to represent what customers ideally want which is known as -
normative expectations. These are expressions of what the customer believe a service
provider should offer rather than would offer. In broad terms, customer expectations are
formed before a service is delivered and the performance of that service is based on if the
service delivered meets or exceeds the customer expectations.
Knowing what the customer expects is the first and possibly most critical factor in delivering
quality service. Getting what customers want wrong, can result in losing a customer to
another company who meets the target, expending money and resources in wrong places and
not surviving in a fiercely competitive market (Zeithaml, 2009).

39
2.11 Conclusion
This chapter described the literature reviewed for the purpose of this research, as there have
been no studies conducted regarding to customer perception of service quality in Nigerian
banks. A comprehensive study was undertaken. Following the finalisation of the literature
review, it was understood that the concept of service quality is of great importance not only
to financial service industries but also to all profit oriented organisations. It can be
understood from the literature that enhancing service quality and making customers satisfied,
leads to customer loyalty which in turn result in a successful organisation, despite the
competition in the business world.

40
CHAPTER 3: RESEARCH METHODOLOGY

41
RESEARCH METHODOLOGY
3.1 Introduction
This chapter presents a review of research methodology used in this study. The purpose is to
highlight the key activities that were undertaken, and to indicate their relevance to the study.
The research Philosophy, research approach, research strategy and design are discussed in
this chapter.
3.2 Distinguishing between research method and methodology
Mayor and Blackmon (2005) described research as a process of finding out information and
investigating the unknown to solve a problem, it involves identifying a problem and
understanding what information is relevant to addressing that problem, getting the
information and interpreting that information and its context.
Balnaves and Caputi (2001) refer to the term method as the actual techniques like
questionnaire and procedures used to quantify and collect data. Research method can be
described as techniques and tools employed in obtaining and analysing research data, which
include questionnaires, observations, and interviews, statistical and non-statistical techniques
(Saunders et al., 2007).
Hancock, (2002) describes methodology as all these matters regarding the structure and
design of the research study. It deals with issues like:
The type of information required
The research design
The method of collecting data
The source of information- also known as the sample
42
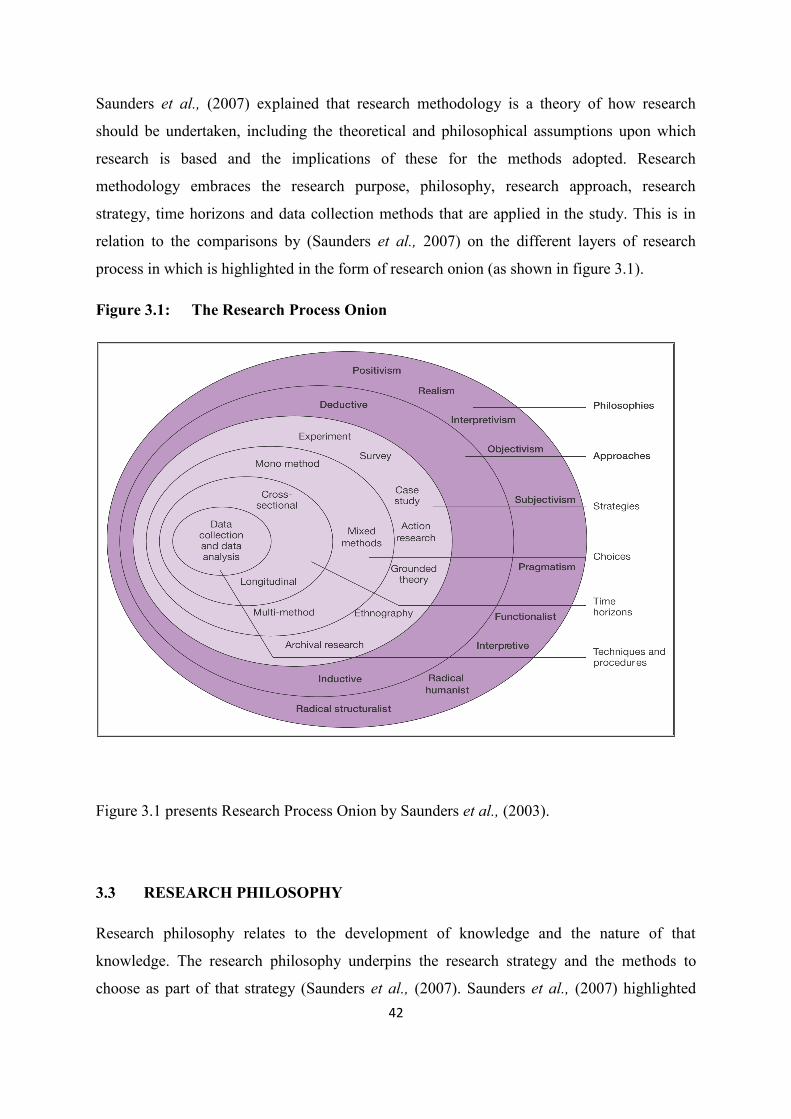
Saunders et al., (2007) explained that research methodology is a theory of how research
should be undertaken, including the theoretical and philosophical assumptions upon which
research is based and the implications of these for the methods adopted. Research
methodology embraces the research purpose, philosophy, research approach, research
strategy, time horizons and data collection methods that are applied in the study. This is in
relation to the comparisons by (Saunders et al., 2007) on the different layers of research
process in which is highlighted in the form of research onion (as shown in figure 3.1).
Figure 3.1: The Research Process Onion
Figure 3.1 presents Research Process Onion by Saunders et al., (2003).
3.3 RESEARCH PHILOSOPHY
Research philosophy relates to the development of knowledge and the nature of that
knowledge. The research philosophy underpins the research strategy and the methods to
choose as part of that strategy (Saunders et al., (2007). Saunders et al., (2007) highlighted

43
that the business management research is a mixture of positivism, interpretivism and reflects
a stance of realism. The research philosophy contains important assumptions about the
manner with which a research views the world. Depending upon the type of research
question, the research philosophy is selected.
3.3.1 Positivism
Bryman and Bell, (2003) stated that positivism is an epistemological position that advocates
the application of the methods of the natural sciences to the study of social reality and
beyond. Saunders et al., (2007) defines positivism as an epistemological position that
advocate working with observable social entity. Positivism generally seeks to test theory, in
an attempt to increase the predictive understanding of phenomena (Burke, 2007). According
to Riley et al., (2006), positivism embraces a number of assumptions which are as follows-
There exists a real world of social and physical phenomena
This real world is objective and tangible;
This world can be analysed in an objective fashion in order to increase understanding
of the phenomena of which it is comprised;
The methods employed in such research are objective and impartial as well as
immune from influence of human values and believes; and
If research is taken objectively, then the gradual accumulation of knowledge should
enable accurate description of the nature and behaviour of such phenomena, including
the interrelationships between phenomena in terms of cause and effect, dependency
and interdependency and so on.
Based on this research, the researcher preferred working with an “observable social reality
and the end product of the research can be law-like generalisations similar to those produced
by the physical and natural scientists” (Remenyi et al., 1998 and cited Saunders et al., 2007).
The important element of the positivist approach is that the research is undertaken and the
researcher is independent and the research is “conducted in a value-free way” (Saunders et
al., 2007).

44
3.3.2 Realism
Bryman and Bell, (2007) stated that realism is an approach that retains many of the ambitions
of the positivism but recognises, and comes to term with the subjective nature of research and
the inevitable role of values in it. The essence of realism is that what the senses show us as
reality is the truth, that objects have an existence independent of the mind. Saunders et al.,
(2007) defined realism as an epistemological position which relate to scientific enquiry. It is
similar to positivism; it assumes a scientific approach to the development of knowledge. It
reflects that reality is the truth: that objects are extremely independent of the human mind
(Saunders et al., 2007).
Realism can be divided in two further philosophies: direct and critical realism. Saunders et
al., (2007) described direct realism as primarily, the philosophy about what we experience
through our senses, and it portrays the world accurately while critical realism makes
allowance for perceptual errors in stimulus and argues that what we experience are sensations
but not necessarily an accurate interpretation of our world.
3.3.3 Interpretivism
Interpretivism or Phenomenology is a term given to a contrasting epistemology. They share a
view that the study of the social world requires a different logic of research procedure, one
that reflects the distinctiveness of humans as against the natural order. It is predicated upon
the view that a strategy is required that respects the differences between people and then
objects of the natural sciences and therefore requires the social scientist to take hold of the
subjective meaning of social action (Bryman and Bell, 2007).
However, In the case of the research, a combination of both positivism and Interpretivism
was adopted because statistical analysis can be incurred from the researcher‟s interpretation
of data based on the customer‟s perceptions towards bank services in Nigeria, attached with
other authors view to the subject. Saunders et al., (2007) emphasised that the complex and
unique nature of business situations and a need to know that business situations are functions

45
and a need to know that business situations are functions of a particular set of circumstances
and individuals. Due to avoiding generalisations of the researchers view on aiming to capture
the complexity of social situations, the researcher therefore combined both approaches that
were suitable for the research. Also the researcher adopted a positivist philosophy in order to
use existing theory to develop hypothesis; which were tested and confirmed within the
framework of service quality in the Nigerian banking industry. Hypotheses were developed
from an assessment of the literature review created from research gathered from secondary
sources like text books and academic journals.
Secondly, the researcher adopted Interpretivism philosophy based on the fact that he seeks to
understand the differences that exist between humans and their world from their point of
view. Saunders et al., (2007) explained that Interpretivism involves carrying out research
among people and not objects such as computers and trucks. Saunders et al., (2007),
emphasised that the Interpretivism is suitable in the case of business and management
research, particularly in such fields as organisational behaviour, marketing and human
resource management.
3.4 Research Approach
The research would employ a deductive approach which (Saunders et al., 2003) describes as
an approach which involves the testing of a theoretical proposition by the employment of a
research strategy specifically designed for the purpose of its testing. Gill and Johnson, (2002)
described the deductive approach as the development of a conceptual and theoretical structure
prior to its testing through empirical observation. Lancaster, (2005) further affirms that
“deductive approach develops theories or hypotheses and then tests these theories and
hypotheses through empirical observation”. This approach was employed because the
research project requires collection of qualitative data, necessary to select samples of ample
size in order to generalise conclusions, the need to explain causal relationships between
variables and other significant factors which the deductive approach emphasises.
Robson, (2002) listed out five sequential stages through which a research using the deductive
approach would advance. They are:
Deducting a hypothesis about the relationship between two or more events,
Expressing the hypothesis in operational terms,
Testing the hypothesis

46
Examining the outcome of the enquiry and
Modification of the theory in light of the results obtained, if necessary.
The researcher followed the deductive process shown in the Figure 3.2
Fig 3.2 Deductive Process
Source: Bryman, (2001), Social Research Methods.
3.5 Research choice
Creswell, (2003) explains that different types of research problems call for different types of
research approaches. According to Saunders et al., (2007), the terms qualitative and
quantitative are used widely in business and management research to differentiate both data
collection techniques and data analysis procedures.
Bryman and Bell, (2007) suggest that qualitative research can be construed as a research
choice that usually emphasises words rather than quantification in the collection and analysis
of data.
1. Theory 2. Hypothesis
3. Data Collection
4. Findings
5. Hypothesis Confirmed/Rejected
6. Revision of Theory

47
Bryman and Bell, (2007) proposed that quantitative research entails the collection of
numerical data and as exhibiting a view of the relationship between theories and research as
deductive.
A single research study may use both quantitative and qualitative techniques and procedures
in combination as well as use primary and secondary data (Curran and Blackburn, 2001).
Saunders et al., (2003) refers to this as a mixed method research strategy that uses both
quantitative and qualitative data collection techniques and analysis procedures.
Mixed method research uses quantitative and qualitative data collection techniques and
analysis procedures either at the same time (parallel) or one after the other (sequential).
Tashakkori and Teddlie, (2003) as cited by Saunders et al., (2003) argued that this method is
useful if it provides better opportunities for the research questions to be answered.
John and Vicki (2007) argued that a mixed method is significant when a single research
method is inadequate in tackling the research problem on its own. The combination of both
qualitative and quantitative data provides with, information on both trends and
generalisations as well as with a detailed knowledge, in the respondents point of view.
Tashakkori and Teddlie, (2003) as cited by Saunders et al., (2007) stated there are two
advantages associated with a mixed method of research.
Different methods can be employed for different purposes in a study. This gives the
researcher confidence that he is addressing the most important problems.
It allows triangulation wherein data can be triangulated against each of the data
collection technique used in getting satisfactory result.
Nevertheless, this research comprises of both quantitative and qualitative research strategies.
Firstly, the researcher aimed at constructing statistical models based on the finding obtained
from the self administered questionnaires to the retail bank customers of Skye Bank PLC.
Secondly, the researcher used this mixed research model in a manner that the quantitative
data obtained would be converted into descriptive so that it can be re-examined qualitatively.
This justifies the researcher‟s decision for using a mixed method research.
3.6 Research Strategy

48
A Research Strategy can be described as a generic plan guiding the researcher to answer
specific research questions (Saunders et al., 2007). In other words, a research provides the
overall direction of the research including the process in which the research is carried out.
Saunders et al., (2007) explained further that a research strategy should include clear
objectives, methods and sources for data collection, and the constraints in the research like
cost issues, access to information, time, money, location and ethical considerations.
There are different methods commonly employed in business and management project work,
and the choice made may be different depending on the nature and scope of the research
topic, the sources of the data to be employed, and the rationale for gathering them, the
amount of control prepared to exert in obtaining these data and the assumptions prepared in
analysing them (Jankowicz, 2000). To mention but not a few are different research strategies
which are-
Experiment
Survey
Case study,
Action research
Grounded theory and ethnography and archival research
3.6.1 Purpose for survey strategy
A survey research is basically an approach to data collection that involves collecting data
from large numbers of respondents. Surveys can be used to investigate issues or problems
within an organisation and outside of the organisation. It is a common strategy in business
and management research as it allows the collection of a large number of data from a sizeable
population in a low cost way through the use of interviews and questionnaire.
A survey strategy was adopted for the purpose of this research. This is because it supports in
the collection of data by surveying customers of the bank, as the researcher examines
customer‟s perceptions of service quality in Nigerian banks.
3.6.2 Advantages of Survey

49
1. Collection of data from a large number of respondents
2. it is perceived as authoritative by people and it is both straightforward to explain and
understand
3. it can take all types of forms ranging from highly structured questionnaires to small
scale surveys
4. data collected by survey is unlikely to be wide ranging than those collected by other
research strategies
5. it allows for the collection of quantitative data which can be analysed using
descriptive and inferential statistics
6. surveys are used to investigate any organisational issue or problem either inside, or
both
3.6.3 Disadvantages of survey
1. survey imposes the language and logic of the researcher onto questionnaire
respondents
2. wording the questions properly is difficult as the respondents are from different
ethnic backgrounds
3. in most cases, respondents are unwilling to provide desired information
4. The fixed response alternative in the question may not only allow a fully correct
question.
3.7 Time Horizon
There are two different approaches in terms of time horizon stipulated by Saunders et al.,
(2003). Firstly is the longitudinal also referred to as the “Diary” time horizon, which entails
gathering information over a long period of time. And the Cross sectional also known as
“snap shot” time horizon.
However the time horizon that was employed for the purpose of this research was the cross-
sectional studies, which can be described as the study of an exact phenomenon at a particular
point in time. This type of design is appropriate for studies focused on finding out the

50
occurrence of a phenomenon, situation, problem or issue at a certain moment in time by
taking a cross section of the population.
In conclusion, the researcher aimed at surveying a cross section of the population, identifying
their perceptions towards service quality in the banking industry (Skye Bank Plc. Nigeria).
3.8 Research Design
This comprise of analysing and putting together data in order to arrive at a solution. Research
designs are about organising research activity, including the collection of data, in ways that
are most likely to achieve the research aims. The collection of data has to be carried out on a
scientific basis in order to make sure that these data do reflect, as accurately as possible, the
phenomena they measure (Saunders et al., 2007). There are many potential choices to make
when developing a research design, and many of these choices are quite closely related to
different philosophical positions, and also awareness of this can at least ensure that different
elements of a research design are consistent with each other (Saunders et al., 2007).
Nevertheless, the research method used in gathering data was a well detailed questionnaire
with a prepared set of questions. Even though, this is time consuming and it is difficult to
control range of answers (Hussey & Hussey, 1997), the method was employed because it
enabled the researcher to win the respondents‟ cooperation. Their detailed response allowed a
good understanding of service quality improvements and initiatives throughout Skye Bank
Plc. and the Nigerian banking sector.
3.9 Credibility of the Research Finding
The credibility of research findings depend on reducing the possibility of getting the answer
wrong. For this reason, research design is very crucial. In order to reduce the possibility of
getting an answer wrong means that attention has to be paid to two particular emphases on
research design: reliability and validity (Saunders et al., 2007).
Reliability refers to the extent to which data collection techniques or analysis procedures
yield consistent findings. Researchers have to be careful of getting possible errors and faults
during the research process for the reasons, when identifying the research population, use of
wrong data collection method, interpretation of data, and developing the conclusions. The

51
reliability of this research was measured with the notion with (Easterby-Smith et al., 2002)
assessments. It will provide the same results on other occasions, similar observations could
be observed by other researchers and the raw data gathered is presented in a transparent
manner.
Validity is concerned with whether the findings are really about what they appear to be about
(Saunders et al., 2007). There are chances to get errors related to information gathering from
secondary data, collection of primary data where data validity becomes a question. In this
dissertation, each and every stage is carefully planned and the research is carried out
according to the plans in a view to avoid errors and ambiguity. The credibility of this research
finding is reliable and valid under all contexts.
3.10 DATA COLLECTION
Prior to the administration of questionnaires to the customers of Skye Bank P.L.C., senior
management permission to administer the questionnaire was internally given. The researcher
made use of survey monkey, an online tool for creating and publishing survey to send
questionnaires to the mailboxes of the respondents.
3.10.1 Secondary Data collection
Saunders et al., (2007) stated that secondary data can be a great tool to compare the findings
of the primary data in a way that the researcher can place the primary findings within a more
general context and triangulate it.
Brannick and Roche, (1997) suggested that secondary data is data that was developed for
some purposes other than helping to solve the problem in hand. It should be relevant,
available and accurate. Employing secondary data has the following advantages.
Gathering data from secondary sources is significantly quicker than designing and
conducting a new investigation.
Secondary data can provide the researcher with broader view of the context for their
study.
Bryman and bell, (2003) proposed that the secondary analysis of comparable data from two
or more countries provide one possible model for conducting cross-cultural research.
52
Saunders et al., (2007) suggested that the secondary data can be raw, where there has been
little if any processing, or compiled data that have received some form of selection or
summarising. Secondary data can be sub grouped into documentary data, survey-based data,
and those compiled from multiple sources. Documentary secondary data includes written
materials such as notices, correspondence; minutes of meeting, public records. Written
documents also include books, journals, magazine articles and articles.
The secondary data for this research study was basically obtained from Textbooks,
conference articles related to the banking industry especially Skye Bank PLC., newspaper
articles and online journals. In addition, academic journals available on the emerald insight
website, and ebsco database were used. All sources referenced proved to be invaluable in
terms of developing the research proposal, the research objectives followed by the
hypothesis. Academic Journals proved to be more important because it provided relevant
information on service quality while the textbooks laid the foundation for the research. All
the secondary research articles have been identified and thoroughly referenced using the
Harvard referencing style.
3.10.2 Primary Data collection
3.10.3 Questionnaires
Questionnaires are efficient data collection mechanism in which the researcher knows
exactly what is required and how to measure the variables of interest (Brannick et al., 1997).
A questionnaire can also be referred to as a series of questions designed to provide accurate
information from every member of the sample. To achieve this, a questionnaire should be
clear, easy to understand, unbiased and should maintain the respondent‟s interest, and
motivations.
However, in order to conduct this research, the researcher designed a questionnaire for the
retail customers of Skye bank Plc. Questionnaires can be administered through different
methods such as personally (face to face), mailed electronically or distributed by post.
Nevertheless, the researcher decided to adopt the mail questionnaire format, where the
questionnaire is delivered to respondent‟s electronically.
3.10.4 Production of Internet Questionnaires

53
Firstly, the questionnaire was typed using the Microsoft Word Office. Once this was done,
the data was then entered into survey monkey software that produces the questionnaire. A
survey invitation was designed to invite respondents to participate. Also an appreciation note
was designed to appear once the respondent had concluded the questionnaire.
3.10.5 Rationale for Internet Questionnaires
1. It covers a wide geographical area
2. It is convenient data collection mechanism
3. Most survey use this questionnaire to measure variables of interest
4. It is mostly used for organisational research
3.10.6 Questionnaire design process
The most common research instruments are the self-administered questionnaires. This is
principally used to collect quantitative data but open-ended questions can be used for
qualitative data. Williamson, (2007) was of the opinion that a systematic process in the
design of the questionnaire must be followed to achieve a well-constructed questionnaire that
is reliable and valid. Such steps include initial consideration followed by clarification of
concepts, typology of question, presenting a questionnaire and finally administering the
questionnaire (Hair et al., 2003).
Domegan and Fleming, (2003) as cited in Saunders et al., (2007) states that questionnaire
design can be broken down into seven different steps which includes preliminary
consideration, question content, response format, question wording, question sequence,
physical characteristics and pre-test/pilot. From the preliminary consideration, the researcher
answers questions relating to the largest respondents, the method of communication that will
be used and the information that will be required during the process.
Questions asked should be simple, clear and unambiguous. As question sequence relates to
the logical flow of the questions, related questions should be grouped together moving from
general to specific with complicated and difficult questions placed within the questionnaire.
54
Physical appearance of the questionnaire should appear as short as possible but at the same
time will look professional. Each question should be numbered and allowed for extra space
for answers especially open-ended questions.
Thus, deciding on what information needed to be collected through the questionnaire is
critical. Above all, data, collected must answer the general focus research question and meet
research objectives in other to test the hypothesis.
With the relevant academic literature review, secondary data consulted (including the
corporate internet/intranet websites, publications, e-mails, the researcher had to create this
knowledge and produce a questionnaire that would supply the quantitative data to test the
hypotheses.
3.10.7 Pilot test for the questionnaire
A pilot test was employed on the draft of the questionnaire. A pilot test is carried out in order
to detect the weaknesses in design and instrumentation and to provide proxy data of a
profitability sample.
It can be done to test the efficiency of the questions contained in the questionnaire and also
detect if it would draw adequate comments from the respondents. When designing the
questionnaire the characteristics of the respondents will be at all times considered in terms of
wording, willingness to respond and the kind of questions formulated.
The researcher pilot tested the questionnaire amongst the retail bank customer‟s in Skye Bank
PLC and in which he came up with modifications where necessary, it emerged that some of
the words were difficult to understand, those words were eliminated and straightforward
words were included.
3.11 POPULATION AND SAMPLING
3.11.1 Population
According to Cooper and Schindler, (2001), population is the total collection of elements
about which we wish to some certain inferences.
On the other hand, Bryman and Bell, (2003), stated that population basically refers to the
universe of units from which the sample is to be selected.

55
3.11.2 Research population defined:
Element: A population element is the subject on which the measurement is being taken. In
this scenario, the element is the customers of Skye Bank Plc. Osolo Branch Lagos
Sampling Unit: is the total collection of elements about which we need to make inferences.
A total number of 120 customers compose the population interest.
Extent: Skye Bank Plc. Osolo branch Lagos Nigeria
Time: April 2010
Based on these points, the researcher employed a sample to obtain information about
population.
A sample survey is a survey which covers the only part of a population and the term sample
usually refers to that part of a population studied for some research project. A sample is
employed for a large population.
3.11.3 Sampling
According to cooper and Schindler, (2001) the basic idea for sampling is that by selecting
some of the elements in a population, one may be able to generalise about the entire
population. Sampling is defined as the deliberate choice of a number of people, the sample,
who are to provide the researcher with data from which he draws a conclusion about some
larger group, the population, whom these people represent (Jankowicz, 1995).
Saunders et al., (2003) stated that sampling provide a range of methods that enables a
researcher reduce the amount of data he needs to collect by considering from a sub-group
rather than all possible cases or elements. For the purpose of the research, it was not possible
for the researcher to have surveyed all the 700 branches of Skye bank Plc in Lagos given the
deadline and cost associated with it, as a result, this prompted the need for sampling.
Cooper and Schindler, (2001) highlighted that certain reasons compel a researcher to
sampling they are:
Lower cost
Greater accuracy of results
56
Greater speed of data collection
Availability of population elements
The impossibility of a census
According to Bryman and Bell, (2007) sampling frame is listing of all units in the population
from which the sample is selected. The sampling frame for this research was drawn from a
mailing list that contains the email addresses of 120 retail bank customers of Skye Bank Plc.
Osolo Branch Lagos State Nigeria.
3.11.4 Sampling Technique
There are two main types of sampling design: Probability and Non-probability sampling
methods. According to Saunders et al., (2007), a probability sampling is most commonly
associated with survey-based strategies where you need to make inferences from your sample
about a population to answer your research question or to meet your objectives. On the other
hand, Non-probability sampling is where the probability of each case being selected is not
known and it is impossible to answer research questions or to address objectives that require
the researcher to make statistical inferences about the characteristics of the population
(Saunders et al., 2007).
Nevertheless, the probability sampling technique was adopted for the purpose of this
research. The technique facilitated the exploratory nature of the research. The researcher
selected the probability sampling because probability samplings are employed when the
representativeness of the sample is of importance in the interest of wider generalisation
(Sekaran, 2003). The researcher sampled a portion of the population based on their
perceptions on service quality and he came up with generalisations on the issue. Also in the
probability sampling, elements in the population have known chance of being selected, as
elements are selected by chance.
There are different methods under the probability sampling design; the researcher adopted the
Stratified random sampling technique. This type of Random sampling was used as it was
more appropriate for the course of the research. This technique of sampling is the type in
which the population is divided into two or more relevant and significant strata based on one
or a number of attributes. This gives out subsets and then a random sample in drawn from

57
each strata. This method has its advantages as well as its disadvantages; nevertheless, it was
suitable to the researcher as it allowed the researcher to have more control over the sample
size. Also, dividing the population into relevant strata also meant that the sample was likely
to be representative of the population which would rule out any form of bias.
3.12 Research Ethics
Ethics in research arise when a researcher seeks to access information from an organisation
for instance a bank and individuals on the subject of research. In research generally, the main
issue on ethics, according to Saunders et al (2007), refers to how we prepare and elucidate
our research design, collect and store the data, and analyse the write up of the finding from
the analysis should not subject those being researched. Given the nature of sampling carried
out in the course of study, the author found it relevant that confidentiality be maintained in
the course of his study. As a result the names of those interviewed were not included in the
dissertation. This was due to Nigerian data protection act in which every citizen, bank or any
organisation must adhere to. This entails that every personal data on identifiable living
persons must be protected by every organisation in question.
Nevertheless, the researcher ensured that the respondent‟s information was adequately
protected, the outcome of the research promises to be of vast benefit to them and for future
purposes.
3.13 Conclusion
This chapter described the research process that was chosen as there are different methods of
carrying out research, the researcher made sure that the chosen method, approach, strategy
and philosophy was appropriate and useful in answering the research question and drawing a
general conclusion and as well as not changing the objectives of the entire research.
Ultimately, in applying any one or several methods, ethics should be duly considered to
ensure the privacy and confidentiality of respondents.

58
CHAPTER 4: DATA ANALYSIS AND FINDINGS

59
CHAPTER 4
4.0 DATA ANALYSIS AND FINDINGS
The aim of this chapter is to explain the analysis done on the data obtained by primary
research. The findings obtained from these data are further explained in this chapter. Each
section explains the research objective and hypotheses. For each section, a detailed
explanation of the analysis obtained from quantitative research. That is, by self administered
questionnaires which were completed by the respondents in this case, customers of Skye bank
Plc.
4.1 Quantitative data analysis and findings- Questionnaire
The questionnaire administered to the customers was designed in order to find out customers
perception of service quality in Skye bank Plc. Nigeria which was selected by virtue of its
size and population of its customers as a representative of the banking industry. A sample
frame of 101 customers of the bank participated in this research. The sampling technique
employed was a probability sampling technique as the selection criteria was random. The
classification of customers was done on the basis of age and the number of years they have
patronised the bank. To convey the questionnaires to the customer‟s, the survey monkey
software for creating web surveys was employed. The customer‟s were sent a direct link of
the website to their email addresses in which they provided during the researchers visit to the
bank.
Nevertheless, the questionnaire is divided into three sections namely: the demographic
section which comprises of questions based on gender, age and how long the customers have
patronised the bank (Skye Bank Plc.), the next section is the next section comprises question
to know the perception of the customers towards the bank services, lastly, to determine the
level of satisfaction of the customers.
Each questionnaire contains number of items aiming to measure the customer perception of
service quality in Nigerian banks.

60
4.2 Gender
The survey results shown in table 4.1 and figure 4.1, indicates that 63.4% of the respondents
that participated in the research were males and the remaining 36.6% were females.
Table 4.1
Gender
Answer Options
Response Percent Response Count
Male 63.4% 64
Female 36.6% 37
answered question 101 skipped question 0
Figure 4.1: Gender
4.3 Age and Demographics
The survey result illustrated in table 4.2 and figure 4.2 shows that the majority of the
respondents (36.6%) that participated in the research are between the age group of 20-30
63.4%
36.6%
0.0%
10.0%
20.0%
30.0%
40.0%
50.0%
60.0%
70.0%
Male Female
Male
Female

61
years of age, 34.7% of respondents were between the age group of 31-40 years of age, the
least amongst the survey are respondents between the ages of 41 and above.
Table 4.2
Age
Answer
Options Response Percent Response Count
20 – 30 36.6% 37
31 – 40 34.7% 35
41 and
above 28.7% 29
answered question 101
skipped question 0
Figure 4.2: Age
4.4 Education
Table 4.3 and figure 4.3 shows that 82.0% of the respondents have a university degree, 15.0%
have a secondary school education, about 3.0% of respondents responded by agreeing that
they have primary school education.
36.6%
34.7%
28.7%
20 - 30
31 - 40
41 and above

62
Table 4.3
Education
Answer Options
Response Percent Response Count
Primary
school 3.0% 3
Secondary
school 15.0% 15
University 82.0% 82
answered question 100
skipped question 1
Figure 4.3: Education
3.0%
15.0%
82.0%
Primary school
Secondary school
University
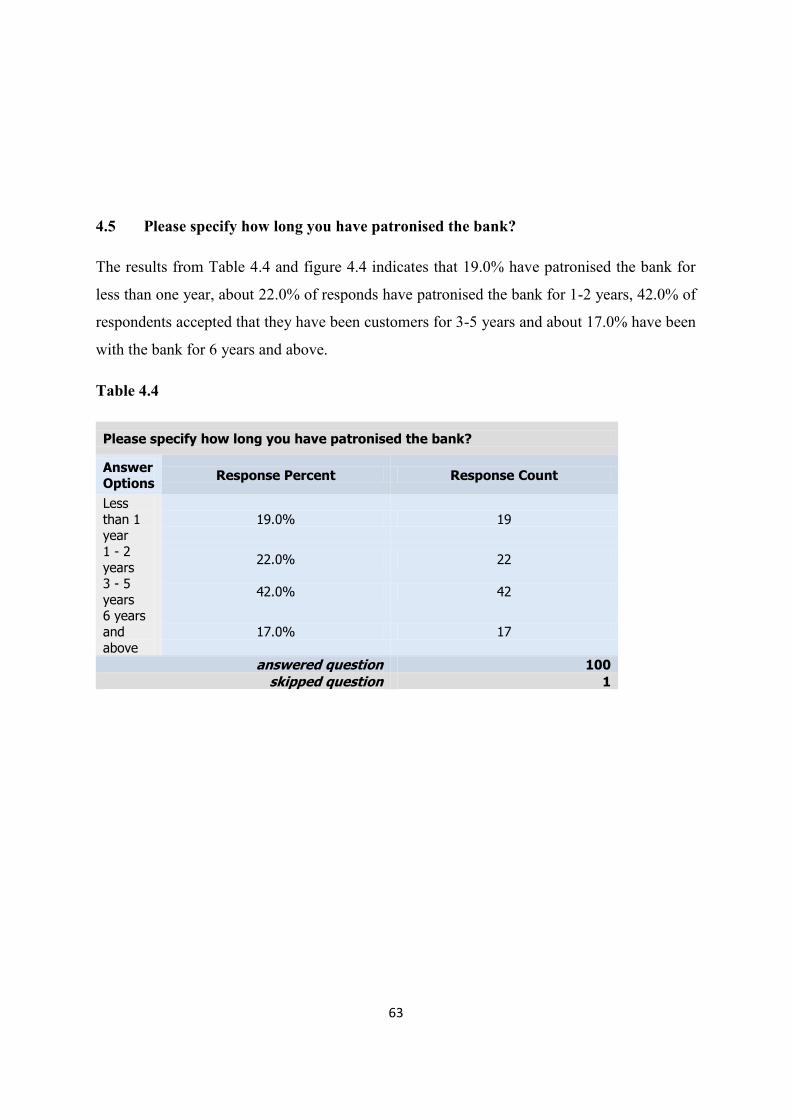
63
4.5 Please specify how long you have patronised the bank?
The results from Table 4.4 and figure 4.4 indicates that 19.0% have patronised the bank for
less than one year, about 22.0% of responds have patronised the bank for 1-2 years, 42.0% of
respondents accepted that they have been customers for 3-5 years and about 17.0% have been
with the bank for 6 years and above.
Table 4.4
Please specify how long you have patronised the bank?
Answer Options
Response Percent Response Count
Less
than 1 year
19.0% 19
1 - 2
years 22.0% 22
3 - 5
years 42.0% 42
6 years
and
above
17.0% 17
answered question 100 skipped question 1

64
Figure 4.4: Please specify how long you have patronised the bank?
4.6 Objective 1: to identify the factors influencing customer perception of service
quality.
A self administered questionnaire was used in this section. The statements were put forward
to quantify the responses of the respondents‟ perception towards service quality.
Furthermore, to identify the factors influencing service quality, it was satisfactory for the
majority of respondents (63.0%) to strongly agree with the statement put forward; that is, if
they felt the bank provides accurate records of all transactions that have taken place, 17.0%
of respondents slightly agreed with the sentence, 8.0% neither agreed nor disagreed, 5.0%
slightly disagreed, whereas, 7.0% of respondents strongly disagreed to the statement. These
figures are illustrated in table 4.5 and figure 4.5 below.
Table 4.5
Do you feel the bank provides accurate records of all transactions that
have taken place?
Answer
Options Response Percent Response Count
Strongly
Agree 63.0% 63
19.0%
22.0%
42.0%
17.0%
Less than 1 year
1 - 2 years
3 - 5 years
6 years and above

65
Slightly
Agree 17.0% 17
Neither
Agree
nor
Disagree
8.0% 8
Slightly
Disagree 5.0% 5
Strongly
Disagree 7.0% 7
answered question 100
skipped question 1
Figure 4.5: Do you feel the bank provides accurate records of all transactions that have
taken place?
The figure above shows that the majority of respondents are pleased with the precision of
account statements. Furthermore, the respondents were also asked if they feel the bank gives
a well written guarantee of transactions that have taken place. Table 4.6 and Figure 4.6 shows
that 63.4% strongly agreed to the statement, 16.8% slightly disagreed, 8.9% neither agreed
nor disagreed, 5.05% slightly disagree, while 5.9% strongly disagreed.
63.0%
17.0%
8.0% 5.0% 7.0%
0.0%
10.0%
20.0%
30.0%
40.0%
50.0%
60.0%
70.0%
Strongly
Agree
Slightly
Agree
Neither
Agree norDisagree
Slightly
Disagree
Strongly
Disagree
Strongly Agree
Slightly Agree
Neither Agree nor Disagree
Slightly Disagree
Strongly Disagree

66
Table 4.6
Do you feel the bank gives a well written guarantee of transaction that
has taken place?
Answer Options
Response
Percent
Response
Count
Strongly Agree 63.4% 64
Slightly Agree 16.8% 17
Neither Agree nor Disagree 8.9% 9
Slightly Disagree 5.0% 5
Strongly Disagree 5.9% 6
answered question 101
skipped question 0

67
Figure 4.6: Do you feel the bank gives a well written guarantee of transaction that has
taken place?
From table 4.6 and figure 4.6 it implies that most customers feel that the bank provides them
with adequate security in terms of their transactions. Another question that was put forward
to the customers to know if the bank informs them on a regular basis the products and
services they have available. About 56.1% of customers strongly agreed with the statement,
23.5% of the respondents slightly agreed while about 8.2% neither agreed nor disagreed,
9.2% slightly disagreed whereas about 3.1% strongly disagreed. From the figure shown in
table 4.7 and figure 4.7 indicates that the majority of respondents are satisfied with level of
communication between customer‟s and bank staff.
Table 4.7
63.4%
16.8%
8.9% 5.0% 5.9%
0.0%
10.0%
20.0%
30.0%
40.0%
50.0%
60.0%
70.0%
Strongly
Agree
Slightly
Agree
Neither
Agree norDisagree
Slightly
Disagree
Strongly
Disagree
Strongly Agree
Slightly Agree
Neither Agree nor Disagree
Slightly Disagree
Strongly Disagree
In your opinion do you think you were informed by the bank about all the
product and services they have available at the bank at the time of
opening the account?
Answer
Options Response Percent Response Count

68
Figure 4.7 In your opinion do you think you were informed by the bank about all the
product and services they have available at the bank at the time of opening the account?
Table 4.8 and figure 4.8 below shows the respondent‟s response towards security provided by
the bank, in terms of well lit ATM‟s for night time bank or in a safe environment. The results
56.1%
23.5%
8.2% 9.2%
3.1%
0.0%
10.0%
20.0%
30.0%
40.0%
50.0%
60.0%
Strongly
Agree
Slightly
Agree
Neither
Agree norDisagree
Slightly
Disagree
Strongly
Disagree
Strongly Agree
Slightly Agree
Neither Agree nor Disagree
Slightly Disagree
Strongly Disagree
Strongly
Agree 56.1% 55
Slightly
Agree 23.5% 23
Neither
Agree
nor
Disagree
8.2% 8
Slightly
Disagree 9.2% 9
Strongly
Disagree 3.1% 3
answered question 98
skipped question 3
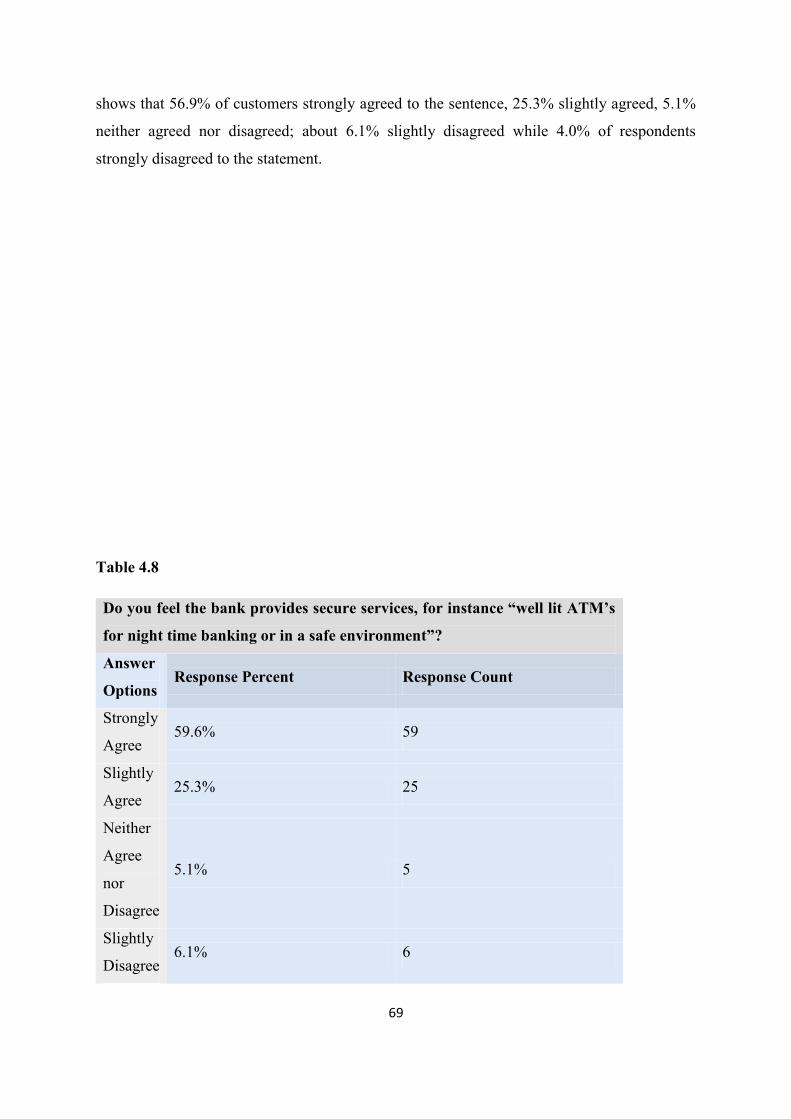
69
shows that 56.9% of customers strongly agreed to the sentence, 25.3% slightly agreed, 5.1%
neither agreed nor disagreed; about 6.1% slightly disagreed while 4.0% of respondents
strongly disagreed to the statement.
Table 4.8
Do you feel the bank provides secure services, for instance “well lit ATM’s
for night time banking or in a safe environment”?
Answer
Options Response Percent Response Count
Strongly
Agree 59.6% 59
Slightly
Agree 25.3% 25
Neither
Agree
nor
Disagree
5.1% 5
Slightly
Disagree 6.1% 6

70
Strongly
Disagree 4.0% 4
answered question 99
skipped question 2
Figure 4.8 Do you feel the bank provides secure services, for instance “well lit ATM’s
for night time banking or in a safe environment”?
Based on the aspect of convenience, the respondents were asked about their feeling towards
the bank hours of operation. Table 4.9 and figure 4.9 shows that 54.5% of the respondents
strongly agreed to this statement, 14.1% slightly agreed, 12.1% of customers neither agreed
nor disagreed, 7.1% slightly disagreed, while 12.1% of the respondents strongly disagreed.
This clearly indicates that the banks hour of operation is suitable to a majority of the
respondents.
59.6%
25.3%
5.1% 6.1% 4.0%
0.0%
10.0%
20.0%
30.0%
40.0%
50.0%
60.0%
70.0%
Strongly
Agree
Slightly
Agree
Neither
Agree norDisagree
Slightly
Disagree
Strongly
Disagree
Strongly Agree
Slightly Agree
Neither Agree nor Disagree
Slightly Disagree
Strongly Disagree

71
Table 4.9
Do you feel the bank has convenient hours of operation (24 hours a day,
seven days a week)?
Answer
Options Response Percent Response Count
Strongly
Agree 54.5% 54
Slightly
Agree 14.1% 14
Neither
Agree
nor
Disagree
12.1% 12
Slightly
Disagree 7.1% 7
Strongly
Disagree 12.1% 12
answered question 99
skipped question 2

72
Figure 4.9 Do you feel the bank has convenient hours of operation (24 hours a day,
seven days a week)?
4.7 Research Objective 2: To evaluate how well the bank satisfies its customers
Through the use of quantitative data, the respondents were asked if they were satisfied with
the manner with which the staff approach prospective customers. Table 4.10 and figure 4.10
below shows that the majority of the respondents (60.6%) strongly agreed with the statement,
16.2% slightly agreed, while 11.1% neither agreed nor disagreed, about 9.1% slightly
disagreed, whereas 3.0% of respondents strongly disagreed to the statement.
54.5%
14.1% 12.1%
7.1%
12.1%
0.0%
10.0%
20.0%
30.0%
40.0%
50.0%
60.0%
Strongly
Agree
Slightly
Agree
Neither
Agree norDisagree
Slightly
Disagree
Strongly
Disagree
Strongly Agree
Slightly Agree
Neither Agree nor Disagree
Slightly Disagree
Strongly Disagree

73
Table 4.10
Are you satisfied with the manner with which the staffs approach
prospective customers?
Answer
Options Response Percent Response Count
Strongly
Agree 60.6% 60
Slightly
Agree 16.2% 16
Neither
Agree
nor
Disagree
11.1% 11
Slightly
Disagree 9.1% 9
Strongly
Disagree 3.0% 3
answered question 99
skipped question 2

74
Figure 4.10: Are you satisfied with the manner with which the staffs approach
prospective customers?
In terms of the bank staff ability to handling customer complaints, the respondents were
asked if they were satisfied with the way the bank deals with their complaints, table 4.11 and
figure 4.11 shows that the majority of the respondents (56.0%) strongly agreed to the
statement which indicates that they are satisfied. 29.0% slightly agreed, 8.0% of neither
agreed nor agreed, 2.0% slightly disagreed, then the remaining part of the sample strongly
disagreed.
60.6%
16.2%
11.1% 9.1%
3.0%
0.0%
10.0%
20.0%
30.0%
40.0%
50.0%
60.0%
70.0%
Strongly
Agree
Slightly
Agree
Neither
Agree norDisagree
Slightly
Disagree
Strongly
Disagree
Strongly Agree
Slightly Agree
Neither Agree nor Disagree
Slightly Disagree
Strongly Disagree
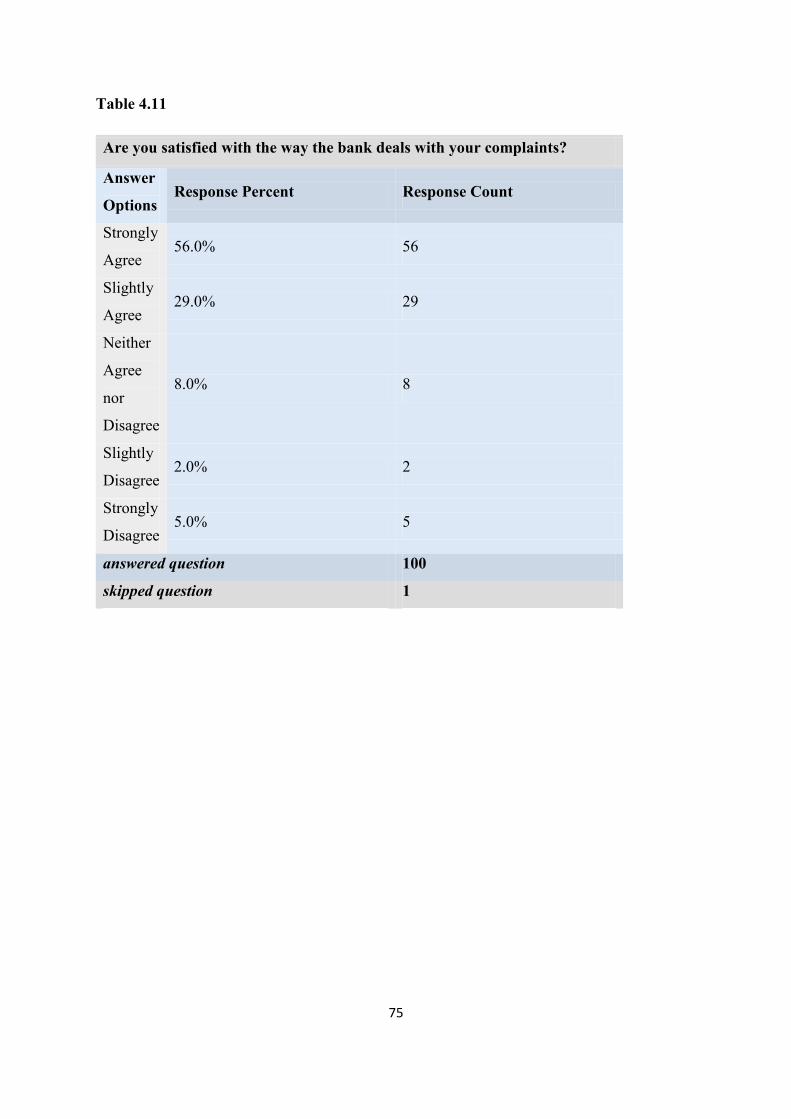
75
Table 4.11
Are you satisfied with the way the bank deals with your complaints?
Answer
Options Response Percent Response Count
Strongly
Agree 56.0% 56
Slightly
Agree 29.0% 29
Neither
Agree
nor
Disagree
8.0% 8
Slightly
Disagree 2.0% 2
Strongly
Disagree 5.0% 5
answered question 100
skipped question 1

76
Figure 4.11: Are you satisfied with the way the bank deals with your complaints?
Table 4.12 and figure 4.12 below shows the response of the respondents that is if they feel the
bank processes their transactions (so they do not need to wait for long), about 59.6% of the
respondents strongly agreed that the bank processes their transactions efficiently, 26.3%
slightly agreed, 7.1% neither agreed nor disagreed, 3.0% slightly disagreed, while 4.0% of
respondents strongly disagreed with the sentence. This implies that the respondents are
satisfied with the bank staff capability of delivering services on time.
56.0%
29.0%
8.0%
2.0% 5.0%
0.0%
10.0%
20.0%
30.0%
40.0%
50.0%
60.0%
Strongly
Agree
Slightly
Agree
Neither
Agree norDisagree
Slightly
Disagree
Strongly
Disagree
Strongly Agree
Slightly Agree
Neither Agree nor Disagree
Slightly Disagree
Strongly Disagree

77
Table 4.12
Do you feel the bank processes your transactions efficiently (so you do not
need to wait for long)?
Answer
Options Response Percent Response Count
Strongly
Agree 59.6% 59
Slightly
Agree 26.3% 26
Neither
Agree
nor
Disagree
7.1% 7
Slightly
Disagree 3.0% 3
Strongly
Disagree 4.0% 4
answered question 99
skipped question 2
Figure 4.12: Do you feel the bank processes your transactions efficiently (so you do not
need to wait for long)?
59.6%
26.3%
7.1% 3.0% 4.0%
0.0%
10.0%
20.0%
30.0%
40.0%
50.0%
60.0%
70.0%
Strongly
Agree
Slightly
Agree
Neither
Agree norDisagree
Slightly
Disagree
Strongly
Disagree
Strongly Agree
Slightly Agree
Neither Agree nor Disagree
Slightly Disagree
Strongly Disagree

78
4.8 Objective 3: To access the perception of the retail bank customers towards bank
service quality.
The results indicated in table 4.13 and figure 4.13 shows the bank services that are applicable
to the respondents that participated in the survey. The statement was put forward in a manner
so that the respondents can specify the bank services applicable to them. From the sample
tested, 64.4% of the respondents make use of the bank current account. 56.4% of respondents
specified that they make use of the savings account, 23% use fixed deposit, 10.9% personal
loan, 9.9% of respondents overdraft, 9.9% housing loan, 16.8% foreign exchange, while
22.8% make use of the bank remittance service. It is clearly illustrated in table 4.13 and
figure 4.13 below that a majority of the respondents make use of the bank current account.
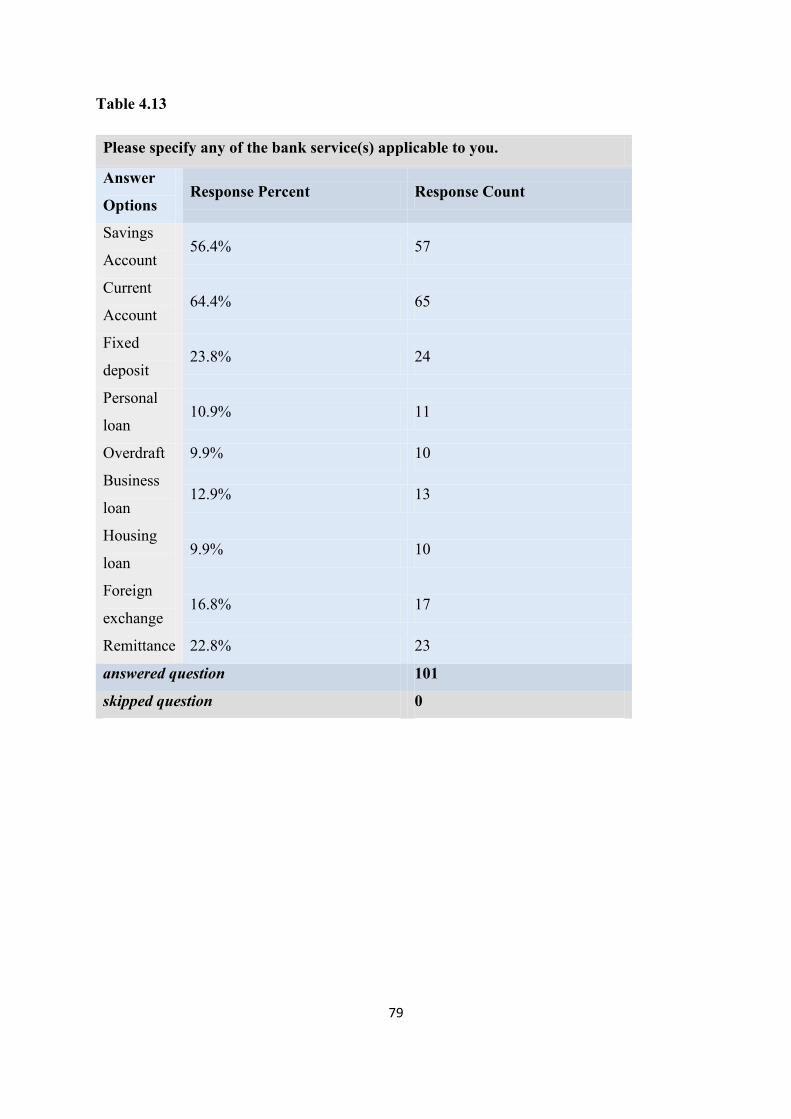
79
Table 4.13
Please specify any of the bank service(s) applicable to you.
Answer
Options Response Percent Response Count
Savings
Account 56.4% 57
Current
Account 64.4% 65
Fixed
deposit 23.8% 24
Personal
loan 10.9% 11
Overdraft 9.9% 10
Business
loan 12.9% 13
Housing
loan 9.9% 10
Foreign
exchange 16.8% 17
Remittance 22.8% 23
answered question 101
skipped question 0

80
Figure 4.13: Please specify any of the bank service(s) applicable to you?
In order to access the perception of the retail bank customers towards bank services
demonstrated in table 4.13 and figure 4.13, the respondents were asked to rate their level of
satisfaction on a scale of 1 to 5, where 1 stands for very poor and 5 for excellent. From the
sample tested, table 4.14 and figure 4.14 below shows that 70.3% of respondents are satisfied
with the bank services, whereas 15.8% of respondents opined that the services are very poor.
This reveals that the majority of the respondents are satisfied with the bank services they use.
56.4%
64.4%
23.8%
10.9% 9.9% 12.9%
9.9%
16.8%
22.8%
0.0%
10.0%
20.0%
30.0%
40.0%
50.0%
60.0%
70.0%

81
Table 4.14
On a scale of 1 to 5, where 1 stands for very poor and 5 for excellent, what
is the level of your satisfaction with the chosen service(s)?
Answer
Options Response Percent Response Count
1 15.8% 16
2 2.0% 2
3 5.0% 5
4 6.9% 7
5 70.3% 71
answered question 101
skipped question 0
Figure 4.14: On a scale of 1 to 5, where 1 stands for very poor and 5 for excellent, what
is the level of your satisfaction with the chosen service(s)?
Table 4.15 and Figure 4.15 below show the response of the respondents about contacting the
bank on telephone or through the internet whenever they have queries. The majority of
15.8%
2.0% 5.0%
6.9%
70.3%
0.0%
10.0%
20.0%
30.0%
40.0%
50.0%
60.0%
70.0%
80.0%
1 2 3 4 5
1
2
3
4
5

82
respondents (77.0%) said yes that they contact the bank through telephone or through
internet, whereas 23.0% of respondents said no the statement.
Table 4.15
Do you contact the bank on telephone or through the Internet when you
have any queries?
Answer Options
Response
Percent
Response
Count
Yes 77.0% 77
No 23.0% 23
answered question 100
skipped question 1
Figure 4.15: Do you contact the bank on telephone or through the Internet when you
have any queries?
77.0%
23.0%
Yes
No

83
Table 4.16 and figure 4.16 demonstrates the response of the respondents about if they get
connected to the service without a waiting time (telephone/internet connection). About 60.6%
of respondents agreed that they get connected without a waiting time, while 39.6% of the
respondents said no to the statement.
Table 4.16
Do you get connected to the service without a waiting time?
Answer
Options Response Percent Response Count
Yes 60.6% 60
No 39.4% 39
answered question 99
skipped question 2
Figure 4.16: Do you get connected to the service without a waiting time?
60.6%
39.4%
Yes
No

84
Table 4.17 and figure 4.17 below shows the responses of the respondents as regards the bank
provision of additional options for some customers (Customers with non-English speaking
backgrounds/for sight and impaired/elderly, About 77.6% of respondents responded by
saying yes to the statement, while 22.4% said no to the statement.
Table 4.17
Do you think the bank provides additional options for some customers
(customers with non-English speaking backgrounds/for sight or hearing
impaired/elderly?
Answer
Options Response Percent Response Count
Yes 77.6% 76
No 22.4% 22
answered question 98
skipped question 3
Figure 4.17: Do you think the bank provides additional options for some customers
(customers with non-English speaking backgrounds/for sight or hearing
impaired/elderly?
77.6%
22.4%
Yes
No

85
4.9 Hypothesis
H1: There is a relationship between service quality and customer satisfaction in banks
Table 4.18 and figure 4.18 shows the responses of the respondents when they were asked if
the bank contacts them about their needs and expectations. About 67.0% of the respondents
said yes to the question, while 33.0% of respondents said no to the sentence.
Table 4.18
Has the bank ever contacted you about your needs or expectations?
Answer
Options Response Percent Response Count
Yes 67.0% 67
No 33.0% 33
answered question 100
skipped question 1
Figure 4.18: Has the bank ever contacted you about your needs or expectations?
67.0%
33.0%
Yes
No
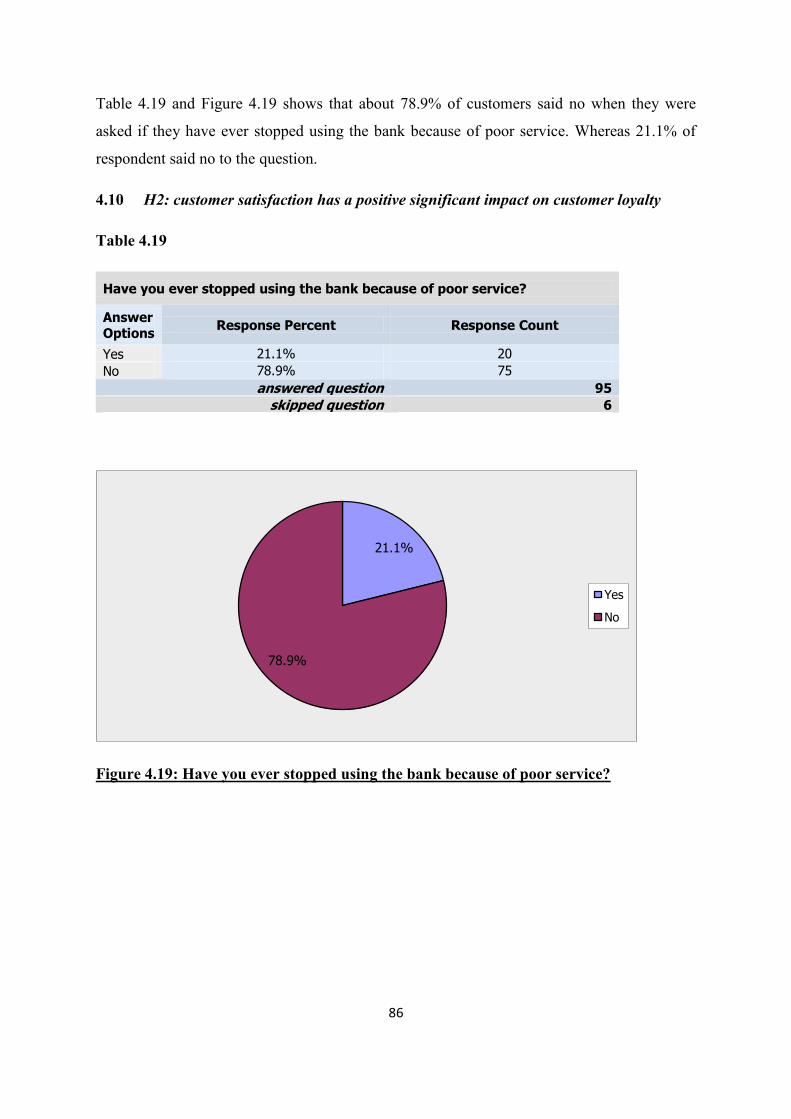
86
Table 4.19 and Figure 4.19 shows that about 78.9% of customers said no when they were
asked if they have ever stopped using the bank because of poor service. Whereas 21.1% of
respondent said no to the question.
4.10 H2: customer satisfaction has a positive significant impact on customer loyalty
Table 4.19
Have you ever stopped using the bank because of poor service?
Answer Options
Response Percent Response Count
Yes 21.1% 20
No 78.9% 75
answered question 95
skipped question 6
Figure 4.19: Have you ever stopped using the bank because of poor service?
21.1%
78.9%
Yes
No

87
CONCLUSION
This chapter presented the key findings based on the primary data collected by the researcher
during the course of study.
The findings for the quantitative data were based on the questionnaire. However the next
chapter would reflect how this analysis has helped achieve the objectives of the research,
tested hypothesis and answer the research question. The researcher has also provided
recommendations based on these findings.

88
CHAPTER 5: CONCLUSION AND RECOMMENDATIONS
89
CHAPTER 5
5.1 CONCLUSION AND RECOMMENDATIONS
Service quality is increasingly recognised as being strategic value by both “traditional”
service-oriented industries such as restaurants and banking and increasingly by the
manufacturing sector (Joseph and Stone, 2003). According to Lewis et al., (2003), the major
benefits of strong service include; satisfied and retained customers; opportunities for cross-
selling; attraction of new customers; development of customer relationships; increased sales
and market shares; enhanced corporate image; reduced costs and increased profit margins and
business performance.
At this point in the literature, as well as the results obtained from the present study, there is
little doubt that enhancing the service quality of the banking experience as defined by both
the quality of personal interaction for instance friendly, courteous, efficient tellers, delivered
while in the bank as well as the ease of use and security of the services provided by the bank
will enhance the overall customer perception of the quality of service provided by the bank.
This is to say that the higher the overall quality of services, the more positive the benefits for
the bank and its management.
However, this chapter has drawn on a sample of 101 Skye Bank retail banking customers in
exploring the dimensions of the relatively service quality construct, and evaluating how the
survey respondents perceive services offered by their bank. Also, the conclusions are drawn
in terms of research objectives and hypothesis derived at the beginning of this study and cross
verifying them with the findings available as a result of primary and secondary research.
Initially in the study, three research objectives were drawn by the researcher. They are listed
in a sequence and the analysis conducted thereon.
5.2 Research Objective one: To identify the factors influencing customer perception of
service quality.
The aim of this objective is to identify the factors influencing customer perception of service
quality. Zeithaml and Bitner, (1996) identified four factors influencing customer perception
of service quality they are: service encounters, evidence of service, image and price. Zeithaml
and Bitner, (1996) explained that these attributes form customers overall perception of
90
service quality, satisfaction and value. Having identified these characteristics, some important
facts and perception came into the limelight. This was evident from the fact that 63.0% of the
customers perceive their bank to provide accurate records of all transactions that have taken
place. Based on the survey findings, it was revealed that the majority of the respondents are
pleased with the precision of account statements. Furthermore, the majority of customers
(63.4%) feel their bank gives a well written guarantee of transactions that have taken place.
this indicates that the bank staff have the ability to perform the service dependably and
accurately. This fact can be supported by one of the five dimensions (Reliability) of the
SERVQUAL instrument proposed by Parasuraman et al., (1988). The survey result also
shows that most of the customers (56.1%) perceive their bank to inform them on a regular
basis the product and services they have available. This signifies that the level of
communication between the bank staff and customers is satisfactory.
5.3 Research Objective 2: To evaluate how well the bank satisfies its customers
After the analysis and discussion of the results of the primary research, the researcher can
conclude that customers are satisfied with the level of service delivered by Skye Bank Plc.
Nigeria. As regards the bank‟s ability to handling customer complaints, the majority of the
customers shown in (table 4.11 and figure 4.11) were satisfied with the manner with which
the bank deals with their complaints. The finding indicates that the bank pays attention to the
different needs of its customers and as a result develops new services based on customer‟s
needs. Furthermore, (table 4.12 and figure 4.12) revealed that the majority of the customers
feel that the bank processes their transaction (so they do not need to wait for long). The
finding reveals that the bank staff have a responsive attitude. This is to say that the bank staff
show willingness to assist the customers in their needs and also they possess the ability to
provide prompt service.
5.4 Research Objective 3: To access the perception of the retail bank customer’s
towards bank service quality.
Bahia and Nantel, (2000) pointed out that, in the banking sector, perceived service quality
results from the difference between customers‟ perceptions for the services offered by the
bank (received service) and their expectations in comparison with the banks that offer such
services (expected service). The stated objective was achieved based on the findings from
Table 4.13 and figure 4.13 which was in regards of the retail bank services applicable to the

91
bank customers that participated in the survey. The findings revealed that a majority of the
customers (64.4%) specified that they make use of the bank current account services. based
on the findings from table 4.14 and figure 4.14 revealed that the majority of customers
perceive these services offered by the bank to be off high quality. From all indications, it is
obvious that the expectations of the customers were met/exceeded while making use of the
bank‟s services. Furthermore, the findings revealed that the majority of respondents contact
the bank either by telephone or via the internet. Table 4.15 and Figure 4.15 revealed that
60.6% of the customers got connected to the service without a waiting time. The present
study implies that the general population appears generally satisfied with the technological
aspects of the bank.
Hypothesis
5.5 H1: There is a relationship between service quality and customer satisfaction in banks
The hypothesis can be perceived from several angles as it relates to a general behaviour in
banks. The research hypothesis can either be accepted or rejected based on available literature
and general observation. Wong et al., (2008) states that service quality and satisfaction are
constructs resulting from the comparison of expectation and performance. They are thus very
strongly related. however, the difference between these two constructs, is that perceived
service quality is a form of attitude and is a long run overall evaluation, while customer
satisfaction is more of a transaction-specific measure (Chadee and Mattson, 1996; Cronin and
Taylor, 1992; Bolton and Drew, 1991; Bitner, 1990; Wong et al., 2008). Despite these
differences, the link between service quality and satisfaction is an important one in this
research. Mattson, (1992) found that service quality is the outcome of the satisfaction
process; Spreng and Mackoy, (1996) connect the constructs of perceived service quality and
customer satisfaction derived from expectations, perceived performance and desires.
Nevertheless, the research finding and analysis for this research have established that there is
indeed a relationship between service quality and customer satisfaction in banks. This was for
the fact that the majority of customers (67.0%) agreed to the statement when they were asked
if the bank has ever contacted them about their needs and expectations. Zeithaml et al.,
(2009) posited that customers are satisfied if service meets or exceeds their expectation of
desired service but are dissatisfied if service drops below their expectation.

92
5.6 H2: customer satisfaction has a positive significant impact on customer loyalty
Satisfaction is referred to be the outcome of individual service transactions and the overall
service encounter, Oliver, (1999) defined customer loyalty as a deeply held commitment to
re-buy or re-patronize a preferred product or service consistently in the future, causing
repetitive same brand or same brand-set purchasing, despite situational influences and
marketing efforts. Nevertheless, the findings from the present study revealed that the majority
of the customers perceive the bank service quality to be of high quality. Table 4.19 and
Figure 4.19 indicate that 78.9% of customers said no to the statement that is if they have ever
stopped using the bank because of poor services.
The results of the survey indicates that the management of Skye Bank Plc. is committed to
offering the best service to its customers and develops new methods to improve service
quality in other to satisfy its customers.
5.7 Recommendation
From the research analysis, it was however evident that a number of initiatives could be taken
into consideration by Skye Bank Plc in order to ensure customers perceive the services
offered to be of high quality.
Further research should be carried out on customer perception of service quality in the
financial services sector of Nigeria as there is not much existing literature on the
topic. This will help to ensure improvement in consumer satisfaction and ultimately
the provision of bank services that will help meet and satisfy the needs of the
customers adequately.
The bank should introduce 24 hours banking to resolve customers complaints and
attend to their needs promptly
The bank needs to provide special services on the ATM for the elderly and the
disabled. Also the bank should provide more ATM‟s as well placing the ATM‟s in a
convenient area for customers to access easily.

93
Banks should pioneer new service delivery techniques to strengthen their relationships
with customers and to suit the underlying dimensions of quality of service and returns.
The management of the bank should provide the necessary logistics to staff because
they help achieve customer satisfaction.
The bank should reengineer their processes on a regular basis in order to allow
customers have greater control over their banking transactions. This could be a capital
intensive decision but in the long-run, it would enhance speed of banking operation as
well as service quality.
The bank should ensure that a user-friendly system is in place to make ATM
transactions. Also the bank management should provide adequate brochures to new
users to educate them on how to use the services.
Improvements in the efficiency of the telephone and the online site will assist in
developing trust in using the website. The bank should continually monitor the
fulfilment of personal needs and satisfaction with the organisation of the site if they
wish customers to remain loyal to online service.
Last but not least, there is a need to look beyond simply providing good service
quality to put up strong relationship with customers. This research provides further
confirmation that it is only through human interaction that strong relationships are
built. Hence if managers wish to retain customers through strong relationships, they
need to do this via person to person contact.

94
5.8 Main Limitations of the study
Due to time constraint and ease of access, the researcher was unable to gain access to all
the retail bank customers. As a result the majority of the retail bank customers that
participated in this research are customers that were present at the bank during the
researcher‟s visit to the bank.
Due to the Nigerian data protection act law adhered to by Nigerian banks; the researcher
was unable to gain full access to the respondent‟s details as to carrying out this research.
Gaining access to the customer‟s details would have aided the researcher to gain a more
holistic view of responses to participation.
This study covered only one region of Nigeria. The researcher acknowledges that Skye
Bank Plc. Nigeria operates in several regions in Nigeria and the sample from one region
(Osolo Lagos, state) may not be representative of the whole country.

95
CHAPTER 6: SELF REFLECTION AND LEARNING

96
CHAPTER SIX
6.0 SELF REFLECTION AND LEARNING
6.1 Introduction
This chapter explains the personal development plans that have been made over the course of
undergoing a Masters in Business Administration programme. This section also highlights an
assessment of the academic and professional Skills acquired during the completion of the
MBA programme and how the learning has helped to improve certain skills that certainly
benefit the researcher in future employment.
6.2 Learning style
Learning style refers to a learner‟s pattern of behaviour in approaching a learning experience
taking in new information, developing new skills, retaining new information and applying
new skills to life situations (Kolb, 1985; Palmer and Goetz, 1988; Sarasin, 1999; Yacizi
2005). It has been proven that determining a learning style enhances learning. (Buch and
Bartley, 2002). In order to realise this potential, it is necessary to establish and understand
what preference a researcher has for a learning style. Bearing this in mind, the researcher
discovered his learning style by employing the two most popular learning styles model: Kolb-
the learning style inventory and Honey and Mumford- the learning styles questionnaire.
Kolb, (1984) as cited in Reid et al., (2004) defines learning as cyclical experience,
“immediate concrete is the basis of observations and reflection. These observations are
assimilated into a theory from which new implications for action can be deduced. These
implications or hypotheses can serve as guides in acting to create new experiences”. Thus,
Kolb, (1984) described the process in four stages: Concrete experience, reflective
observation, abstract conceptualisation and active experimentation; this shown in (figure 6.1).
He argues that cyclical learning should be approached as a continuous ring and he suggests
that this learning ring process usually begins with a person performing a particular action (i.e
concrete experience).

97
Figure 6.1: Kolb’s Learning Style
In similar context, Honey and Mumford (1986) as cited in Reid et al., (2004) identified four
individual learning styles based on Kolb‟s four learning cycle stages (Reid et al., 2004):
6.2.1 Concrete Experience (Kolb)-Activists (Honey and Mumford): Activist prefer doing
and experiencing; they are impulsive, imaginable, emotional; they enjoy the “here and now”,
they seek new challenges and immediate experience. They prefer working in groups; they are
interested in people and are open minded.
6.2.2 Reflective Observation (Kolb) - Reflectors (Honey and Mumford): These individuals
prefer to “stand back”, they observe, listen, and gather data from experiences. They tend to be
very thoughtful and cautious and usually postpone conclusions.

98
6.2.3 Abstract (Kolb)- Theorists (Honey and Mumford): Theorist see things through in
logical steps, assimilate unlike facts into coherent theories, they rationalize objectively, and
rejects subjectivity.
6.2.4 Active Experimentation (Kolb)- Pragmatists (Honey and Mumford): these
individuals seek and try out new ideas, they tend to be practical. They are experimenters; they
enjoy trying to solve a problem and tend to make decision quickly. They tend to get bored
with long discussions.
With the use of the Honey and Mumford learning style assessment, it was discovered that the
researcher has a learning style of a Reflector. Reflectors perceive information (apprehend)
concretely and process (comprehend) through reflective observation. Research by Yacizi,
(2005) has shown that Reflectors enjoy idea generation activities such as brainstorming,
reflective activities and rhetorical questions and some evidence that reflectors are “social
learners” who regard feedback highly, and thus tend to feel isolated when working on-line.
Using the Honey and Mumford learning styles, the researcher also discovered that he learns
by observing and thinking about what has happened, which also match to his learning style of
a diverger. Honey and Mumford portrayed reflectors as people who like observing before
they offer their own opinion and like to look at a situation from different perspectives. These
learning styles were shown in the manner the researcher searched through information
(reflection and brainstorming) especially in the dissertation stage.
6.3 Masters Experience
Enrolling on the Masters in Business Administration (MBA) programme is one of the biggest
challenges the researcher has ever faced. This is because when he embarked on the
programme, he did not realise how diverse, extensive and demanding the programme was.
Another difficulty was as a result of the differences in writing styles during the researcher‟s
first degree and the MBA programme. The academic writing during his first degree, involved
less of searching for relevant articles and referencing the articles. The MBA program brought
him into the reality of these form of academic rigour, as he did a total of five modules that
involved taking up the task of finding articles and referencing it. He was also able to manage
and adopt the new way of academic writing.
The MBA programme has provided a sound basis upon which to build a career in
international business. So far, the programme has allowed the researcher to acquire the
99
necessary skills to make immediate, effective contribution upon employment in the area of
international business.
As an MBA graduate, the researcher will be able to combine new knowledge with past
experience and apply it to new circumstances. The Masters programme has empowered him
with skills that will enable the researcher to thoroughly analyse, synthesize and solve
complex unstructured business problems in his chosen career.
The MBA international course through its rigorous academic programme has done great
value addition to the researchers learning and knowledge base.
6.4 Learning outcomes
6.4.1 Research skills
Since commencing the MBA programme, the researcher has been able to notice that his
research skills have improved immensely. This was as a result of the modules that were
taught during the programme. The majority of the module assessment required a critical
review of academic literature because most of them were mainly case studies. At the initial
stage of the MBA programme, analysing case studies appeared to be something strange to the
researcher; this was due to the fact that his undergraduate course did not require much
research work. Most of the case studies analysed were based on real life scenarios that
occurred in business environments. And these are likely issues that a business manager might
encounter and would be needed to come up with a solution. In most cases, the case studies
require use of primary research through administering of questionnaires and conducting
personal interviews. For instance, the Service Marketing assessment (MGTMKM028)
completed in the first semester of the MBA programme. This aspect of development would
be of great relevance to the researcher in his quest to becoming a business manger because he
will be able conduct business research and make business analysis in a bid to solve business
issues in the future.
6.4.2 Data analysis
At the initial stage of writing the dissertation, the researcher thought he would use the SPSS
software to analyse the data he acquired from primary research without the knowledge that he

100
can also use the Survey Monkey software. Before then these software‟s were unknown to him
but in the long run he started learning how to go about it, he later on discovered that with the
Survey Monkey software, he would be able to analyse data and create charts. The Survey
Monkey is an online survey tool which is used to create, collect and analyse data. The
primary research has allowed him to have knowledge of both the SPSS software and the
Survey Monkey, which would be of great benefit to him in future as he would like to have a
career that would involve carrying out research, the knowledge of both SPSS and Survey
Monkey and other available tools of the same nature would really be of immense importance
the researcher.
6.4.3 Decision making skills
The MBA programme has also sharpened the researcher‟s decision making skill. The course
has been taught bearing in mind that the manager should be able to make right decisions in
the highly competitive business environment. This skill has been developed throughout the
course in which the researcher have been required to analyse various case studies and make
decisions, suggesting possible solutions to real world business problems. For instance, was
one of the courses the researcher undertook (International Business and Trade), in which the
researcher was given a real life case study to analyse the business strategy of an organisation.
One of the challenges for doing this type of assessment was that the researcher has to make
the decisions on applying appropriate business models in order to analyse the organisations
business environment. Nevertheless, the researcher was able to analyse the business strategy
and environment of the organisation and he also made recommendations as to factors that are
affecting the company‟s business strategy and environment.
Furthermore, the development of the decision making skill has required the researcher to
make decisions based on sound logic and rationale and be objective in the decision making
process without too much concern about if the decision made is right or wrong. This skill
developed during the course would facilitate the researcher when he starts his career, as he is
planning to work with a multinational company where he would be able to put the skill into
practice.

101
6.4.4 Team working skills
Learning as a group was unknown to the researcher till he started the MBA programme.
Despite the fact working as a team have its strengths as well as its weaknesses. This was
based on the difficulties the researcher encountered while working with others in a group.
Certain individuals in the group put up a nonchalant attitude whenever a group assessment
was assigned. The researcher on his own part understood that people do have their
shortcomings; this could be a member of the group not having a clear knowledge of the
group assessment, in most cases, a group member finding it difficult to work with other
people. The researcher on his own part tried as much as possible to make the group members
understand the implications of not completing a task before the due date, as well as assisting
the group members in completing the task.
The researcher found the group learning method used during the programme very helpful
because it helped to enhance his team working skills. Working together with people from
different cultural background is very challenging because we all have different cultures,
attitudes, believes and behaviour and this normally have an impact on the way that we work.
The right attitude is to be accommodating to other people‟s view in order to have an effective
team and the researcher was able to learn this virtue. He was able to develop his leadership
skill during this period because most of the time that he had group assessment, the researcher
takes it upon himself to coordinate the group work and seek for the commitment of every
team member in order to achieve a good result.
6.4.5 Time management skills
Since commencing the MBA course, the researcher would maintain the fact that he has
improved with the way he manages time compared to the way he did in the past. The
researcher realized that in order for him to be successful in a Masters Degree programme he
must be able to make use of any minute he has for studying and carrying out extensive
research on business related subjects. The researcher was able to work with deadlines during
his study. This was as a result of the compulsory set times for the submission of module
assessments.

102
The researcher would also say that he is more organised with the manner he does things now.
The researcher was able to keep things in an appropriate manner especially documents and
also handouts issued in the lecture room in a bid to reach them when needed. In conclusion to
this, the researcher would say that developing this skill will be of great relevance in his quest
for being a business manager.
6.5 Going Forward
In conclusion to this, the researcher would suggest that the experience he acquired
undergoing an MBA programme is of great relevance to him in today‟s business
environment. Especially, the team working skills developed as a result of module
assessments that required working in groups, communication and presentation skills, time
management and ultimately, analysing case studies has also helped the researcher to develop
his analytical skills and this aspect would be very useful to the researchers‟ career goals. The
researcher is now capable to study issues more objectively and perform critical analysis of
issues before making decision this is to say that the researcher was able to improve in his
decision making skills.

103
BIBLIOGRAPHY

104
BIBLIOGRAPHY
Ahmed , P . and Rafiq , M . (2003) “Internal marketing issues and challenges”. European
Journal of Marketing 37 (9) :1177 – 1186 .
Al-Hawari M., and Ward T., (2006), “The effect of automated service quality on Australian
banks‟ financial performance and the mediating role of customer satisfaction”. Marketing
Intelligence and planning vol.24 No.2, pp 127-147
Allred, T.A. and Addams, H.L. (2000), “Service quality at banks and credit unions: what do
their customers say?”, Managing Service Quality, Vol.10 No1, pp.52-60.
Anderson, J., and Narus, J., (1998) “Business marketing: Understand what customers value” .
Harvard Business Review 76: 53 – 65.
Angur, M.G. Natraajan, R., Jahera, J.S. (1999), “Service Quality in the banking industry: an
assessment in a developing economy”, international journal of bank marketing, Vol. 17
pp.116-123
Arasli, H., Katircioglu, T. S., Mehtap-Smadi, S., (2005) “A comparison of service quality in
the banking industry”. International Journal of bank marketing. Vol. 23, No:7 pp.508-526
Bahia K., Nantel J., (2000) “A reliable and valid measurement scale for the perceived service
quality of banks”. International Journal of marketing Vol: 18 No: 2 pp: 84-91.
Baurman C., Burton S., Elliot, G., Kehr H.M (2007) “Prediction of attitude and Behavioural
intentions in retail Banking”. An International Journal of marketing Vol:25, No: 2
Beck, T., Cull, R., Jerome, A. (2005) “Bank privatisation and Performance: Empirical
Evidence from Nigeria”, Journal of Banking & finance, Elsevier, Vol. 29 (8-9), pages 2355-
2379.
Bellou V., Andronikidis A., (2008) “the impact of internal service quality on customer
service behaviour”. International Journal of Quality & Reliability Management. Vol:25., No.
9. pp: 943-954

105
Bennett, R., Rundle-Thiele, S. (2004), “Customer satisfaction should not be the only goal”,
Journal of Services Marketing, Vol. 16 No.7, pp.514-23.
Berry , L . L . and Parasuraman , A . ( 1991 ) “Marketing Services: Competing through
Quality” . New York: The Free Press , pp. 152 164 – 169 .
Bialey Diane (1994): “Recovery from customer service short falls”, Journal of service
marketing, Vol. 4, No 6, pp. 25- 28.
Blanchard, R.F., Galloway, R.L. (1994), “Quality in retail banking”, International Journal of
Service Industry Management.
Bloemer, J., Ruyter, K.D. and Peeters, P. (1998), “Investing drivers of bank loyalty: the
complex relationship between image, service quality and satisfaction”, International Journal
of Bank Marketing, Vol. 16 No. 7, pp. 276–286.
Boshoff C., (1999) “RECOVSAT: an instrument to measure satisfaction with transaction-
specific service recovery”, Journal of services research, Vol. 1 No.3, pp.236-49
Boud, D, Keogh, R, Walker, D (1985), “Reflection: Turning Experience into Learning”,
Kogan Page, London
Brannick, T., Roche W (1997) Business research Methods: strategies, Techniques and
sources, Dublin Oak Tree Press.
Brown S.W and Bond E.U. III (1995) “The internal/external framework and service quality:
Toward theory in service marketing”, Journal of Marketing Management, February, pp-25-
39.
Bryman A. And Bell E., (2003) “Business research methods”, Oxford, university press,
Oxford
Bryman Alan and Bell Emma, (2006): “Business research methods”, Oxford press, New
York

106
Bryman Alan and Bell Emma, (2007): “Business research methods”, Oxford press, New
York
Burns, D.J., Neisner, L., (2006) “Customer satisfaction in a retail setting”, Journal of Retail
& Distribution Management, Vol. 34, No. 1, pp. 46 – 66.
Buttle, F. (1996), “SERVQUAL: review, critique, research agenda”, European Journal of
Marketing, Vol. 30 No. 1, pp. 8-32.
Cameron s., (2008) “The Business Student‟s Handbook: learning skills for study and
employment”, (4th
Ed) Pearson Education limited, Essex, England.
Carman, J. (1990), “Consumer perceptions of service quality: an assessment of the
SERVQUAL dimensions”, Journal of Retailing, Vol. 66 No. 1, Spring, pp. 33-55.
Central Bank of Nigeria (1995), “Monetary Policy in Nigeria”, CBN Briefs, Research
Department series 95/03.
CBN, (2008). “Indigenous Banking in Nigeria”, Central Bank of Nigeria. [Online].
Available at: http://www.cenbank.org/documents/gpagedocs.asp
CBN, (2005). Annual Report for the year ended 31 December, 2005. [Online]. Available at:
http://www.cenbank.org/OUT/PUBLICATIONS/REPORTS/RD/2006/ARP-200-
PART1.PDF
CIBN, (2008). “Bank Consolidation – History Summary”. The Chartered
Institute of Bankers of Nigeria.
Chi Cui, C., Lewis, B. R. and Park, W. (2003) Service quality measurement in the banking
sector in South Korea. International Journal of Bank Marketing 21 (4/5): 191 – 201.

107
Clough, P., and Nutbrown, C., (2002) “A students guide to methodology: justifying enquiry”.
1st Ed, Sage Publications, London.
Creswell, J.W. (2003). “Research design: Qualitative, quantitative, and mixed methods
approaches”. (2nd Ed.) Thousand Oaks: Sage.
Cronin, J. Jr., Taylor, S.A., (1992), "Measuring service quality: a re-examination and
extension", Journal of Marketing, Vol. 56 No.3, pp.55-68.
Dawkins, P., Reichheld, F. (1990), “Customer retention as a competitive weapon”, Directors
and Boards, Vol. 14 pp.42-7
Davis, M. And Heineke, J., (1998), “How disconfirmation perception and actual waiting
times impact customer satisfaction”, international journal of service industry management,
Vol.9, No.1, pp, 64-73
De Ruyter K., Wetzels, M (2000), “customer equity considerations in service recovery: a
cross industry perspective”, international journal of service industries management, Vol.11,
No.1, pp.99-108.
Dewey, J (1933), “How we Think”, D.C. Heath, Boston, MA.
Dick, A.S. and Basu, K. (1994), “Customer loyalty: toward an integrated conceptual
framework”, Journal of the Academy of Marketing Science, Vol. 22, pp. 99-113.
Dutta, K., and Dutta, A., (2009). “Customer Expectations and Perceptions across the Indian
Banking Industry and resultant financial implications”. Journal of Services Research, Vol.9,
No.1
Ehigie O.,B., (2006) “Correlates of customer loyalty to their bank: A case study in Nigeria”.
International Journal of Bank Marketing.Vol.24 No.7., pp: 494-508
Fatt, J.P.T. and Joo, N.T. (2001) “Learning styles: Implications for design and Technology
and education”, Management Research News, 24(5), pp.24-37

108
Fisher A., (2004), “Researching and writing a dissertation; a guidebook for business
students”, (2nd
Ed), England, Pearson Education Limited 2007.
Friesener T and Hart M (2005) “Learning Logs: Assessment or Research Method” The
electronic Journal of Business Research Methodology Vol:3 Issue 2, pp.117-122,
Frost, F.A., Kumar, M. (2001), “Service quality between internal customers and internal
suppliers in an international airline”, International Journal of Quality & Reliability
Management, Vol.18, No.4/5,pp.371-386.
Gill J., and Johnson P., (2002) “Research Methods For Managers”, 3rd
ed., Sage Publications
Ltd.
Gilmore, A., Carson, D. (1992), “Research in service quality: have the horizons become too
narrow”?, Marketing Intelligence & Planning, Vol. 10 No.7, pp.5-7.
Glaveli N., Petridou E., Liassides C., Spathis C., (2006) “Bank service quality: evidence from
five Balkan countries”. Managing service quality Vol 16, No. 4, pp. 380-394
Gounaris S., P., Stathakopoulos V., Athanassopoulos (2003) “Antecedents to perceived
service quality: An exploratory study in the banking Industry”. International Journal of Bank
Marketing. Vol: 21 No.4. pp:168-190
Grönroos, C. (1978), “A service oriented approach to marketing of service”, European
Journal of Marketing, Vol. 12 No.8, pp. 588 -96.
Grönroos, C. (1982), “Strategic Management and Marketing in the Services Sector”, Swedish
School of Economics and Business Administration, Helsingfors.
Grönroos, C. (1991), “Scandinavian management and the Nordic School of Services -
contributions to service management and quality”, International Journal of Service Industry
Management, Vol. 2 No.3, pp. 17-25.
Guo X., Duff A., Hair M., (2008) “Service Quality Measurement in the Chinese corporate
banking market”. International Journal of Bank marketing Vol. 26, No: 5, pp.305-327.

109
http://www.nigerianmuse.com/important_documents/?u=CBN_Press_release_on_bank_cons
olidation_Jan_3_2006.htm
http://www.skyebankng.com/
http://www.cenbank.org/out/speeches/2005/consultative%20committee%20on%20banking%
20sector%20consolidation16-6-05.pdf
http://www.tralac.org/cgibin/giga.cgi?cmd=cause_dr_news_item&cause_id=1694&news_id=
42479&cat_id=1210
http://siteresources.worldbank.org/DEC/Resources/nigeria.pdf
http://www.kpmg.co.za/images/naledi/pdf%20documents/kpmg%202009%20banking%20sur
vey%20report%20brochure.pdf
Hallowell, R. (1996), “The relationships of customer satisfaction, customer loyalty, and
profitability: an empirical study”, International Journal of Service Industry Management,
Vol. 7 No.4, pp.27-42
Hansemark, O.C., Albinsson, M. (2004), “Customer satisfaction and retention: the
experiences of individual employees”, Managing Service Quality, Vol. 14 No.1, pp.40-57.
Hamer L.O., (2006) “A confirmation perspective on perceived service quality”. Journal of
services marketing 20/4, pp.219-232
Hocutt, M., Stone T.H (1998) “The impact of employee empowerment on the quality of
service recovery effort”. Journal of quality management, vol. 3 No 1 pp. 117-32
Huang W., (2008), “The impact of other-customer failure on service satisfaction”.
International Journal of Service Industry Management, Vol.19, No.4, pp.521-536
Hung-Chang, C. (2002). “A study on the cognitive and affective components of service
quality”, A journal of Total Quality Management, Vol 13, No.2, PP. 265-274
Jamal A., Anastasiadou K., (2007) “investigating the effects of service quality dimensions
and expertise on loyalty”. European Journal of Marketing, Vol. 43, No:3/4 pp. 398-420.

110
Jankowicz A.D., (2000) “Business research Projects” (3rd
Ed) Business Press Thomson
Learning, High Holborn, London
Johnston, R. (1995), “The determinants of service quality: satisfiers and dissatisfiers”.
International journal of service industry management, Vol.6 No. 5, pp.53-71.
Johnston, R. (1997), “Identifying the critical determinants of service quality in retail banking:
importance and effect”, international Journal of Bank Marketing, Vol. 15 No. 4, pp. 111-6
Johnston, R. and Michel S. (2008), “Three outcomes of service recovery: customer recovery,
process recovery and employee recovery”, International Journal of operations and
Production Management, Vol. 28, No 1, pp. 79-99
Johnson R.L., Tsiros M., and Lancioni R.A (1995) “Measuring Service Quality: a systems
approach”. Journal of Services Marketing Vol.9 No: 5 1995, pp.6-19
Jones H., and Farquhar (2007) “Putting it right: service failure and customer loyalty in UK
banks”, International Journal of bank marketing. Vol.25, No.3 pp.161-172
Joseph M., McClure C., Joseph C., (1999) “Service quality in the banking sector: the impact
of technology on service delivery”. International Journal of bank marketing. No.17/4 ,pp
182-191
Kangis P., and Voukelatos V., (1997) “Private and public banks: a comparison of customer
expectations and perceptions”. International Journal of Bank Marketing. No: 15/7 pp 279-
287
Kano, N., Seraku, K., Takahashi, F., Tsuji, S. (1984), “Attractive quality and must-be
quality”, Hinshitsu (Quality), The Journal of the Japanese Society for Quality Control), Vol.
14 No.2, pp.39-48
Keaveney S., (1995) “Customer Switching behaviour in service industries: an exploratory
study”, Journal of marketing. April, Vol. 59 pp.71-82
Kolb, J.A. (1984) “Experiential Learning experience as the source of learning and
development”, Prentice-Hall, Englewood Cliffs, NJ.

111
Kotler, P. (2000) “Marketing management”, Prentice Hall, New Jersey.
Kotler, P. and Keller, K.L. (2006) “Marketing Management”, (12th
ed)., Prentice Hall: New
Jersey.
Kotler, P. & Armstrong G., (2006) “Principles of Marketing”, (12th
ed). Upper Saddle River,
New Jersey.
Kretovics, M.A. (1999): “Assessing the MBA- what do our students learn?”. journal of
management development, 182(2), pp.125-136
Kueh, K., Voon B., H., (2007) “Culture and Service Quality Expectations: Evidence from
Generation Y Consumers in Malaysia”.Vol.17 No.6, pp.656-680.
Kumar M., Kee T.F., Manshor A.T (2009) “determining the relative importance of critical
factors in delivering service quality of banks: An application of dominance analysis in
SERVQUAL model”. Vol 19, No:2, pp.211-228.
Kunst, P. and Lemmink, J. (2000), “Quality management and business performance in
hospitals: A search for success parameters”, journal of Total Quality Management, Vol. 11
No. 8, pp. 1123–1133.
Ladhari R., (2009) “Assessment of the psychometric properties of SERVQUAL in the
Canadian banking industry”. Journal of Financial Services Marketing, Vol.14, No.1, pp. 70-
82
Lam, T. K. P. (2002) “Making sense of SERVQUAL‟s dimensions to the Chinese customers
in Macau”. Journal of Market – Focused Management 5 (10): 43 – 58.
Langeard, E., Bateson, G., Lovelock, C.H. and Eiglier, P. (1981), “Service Marketing: New
insights from consumers and managers”, Marketing Science Institute, Cambridge, M.A.
Lehtinen, J.R., Lehtinen, U. (1982), "Service quality: a study of quality dimensions",
unpublished Working Paper”, Service Management Institute, Helsinki.

112
Leverin, A. and Liljander, V. (2006) “Does relationship marketing improve customer
relationship satisfaction and loyalty”?, International Journal of Banking Marketing, Vol. 24,
No. 4, pp. 232 – 251.
Levesque, T., McDougall, G.H.G., (1996), “Determinants of customer satisfaction in retail
banking”, International Journal of Bank Marketing, Vol. 14 No.7,, pp.12-20.
Lewis B.R., Orledge J., Mitchell V.W., (2000) “Service Quality: students‟ assessment of
banks and building societies”. International journal of bank marketing, Vol. 12 No. 4, 1994.
pp.3-12 .
Lewis, B. and Spyrakopoulos, S. (2001), “Service failures and recovery in retail banking; the
customer‟s perspective”, International journal of bank marketing, Vol. 19, No 1, pp 37-47
Lim, P.L. & Tang, N.K.H. (2000), “A study of patients‟ expectations and satisfaction in
Singapore hospitals”, International Journal of Health Care Quality Assurance, Vol. 13 No. 7,
pp. 290–299.
Lloyd-Walker, B. and Cheung, Y.P. (1998), “IT to support service quality excellence in the
Australia banking industry”, Managing Service Quality, Vol. 8, November, pp. 350–358.
Lopez J., Kozloski L.H., Rampersad A., (2007) “Ethnicity and customer satisfaction in the
financial services sector”. Journal of Managing Service Quality, Vol 17, No.3, pp. 259-274
Luo, X., Homburg, C. (2007) “Neglected outcomes of customer satisfaction”, Journal of
Marketing, Vol. 71, pp.133 - 49.
Manville , B . and Ober , J . ( 2003 ) “Beyond empowerment: Building a company of
citizens” . Harvard Business Review 81 (1) : 48 – 53.
Maritz A., Nieman G., (2006) “Best practice relationship with service quality in a home
entertainment franchised system”. Journal of south African Business review vol.10, No.2 .
McCollough M.A., Berry, LL. Yadav M.S., (2000), “An empirical investigation of customer
satisfaction after service failure and recovery”, Journal of service research, Vol.3 pp. 121-37
113
McMullan, R., and Gilmore, A., (2008). “Customer loyalty: an empirical study”. European
Journal of Marketing, Vol. 42 No. 9/10, pp. 1084-1094.
Mishkin, F.S., (2001), “The Economics Of Money, Banking and Financial Markets”, (6th
ed).,
Addison-Wesley, Reading, MA.
Mukherjee, A. and Nath, P., (2005), “An empirical assessment of comparative approaches to
service quality measurement”, Journal of services marketing, Vol. 19, No 3, pp. 174-184
Mumford, A., (1995): “Putting learning styles to work: an integrated approach”, journal of
European Industrial Training, 27(8),pp.28-35.
Moutinho, L and Brownlie, D.T. (1989) “Customer Satisfaction with Bank Services: A
multidimensional Space Analysis”, The International Journal of Bank Marketing, Vol. 7.
Naumann, E. (1995), “Customer satisfaction measurement and management: using the voice
of the customer”, Thomson Executive Press, Cincinnati, OH
Nejati, M., Nejaji, M., Shafaei, A. (2009) “Ranking airlines service quality factors using a
fuzzy approach: study of the Iranian society”, International of Journal of Quality &
Reliability Management, Vol. 26, No. 3, pp 247 260.
Newman K., (2001), “Interrogating SERQUAL: a critical assessment of service quality
measurement in a high street retail bank”, International Journal of bank marketing, Vol.19,
No.3, pp.126-139.
Nordman, C. (2004), “Understanding customer loyalty and disloyalty – the effect of loyalty-
supporting and – repressing factors”, Swedish School of Economics and Business
Administration, Helsinki, Finland
NPC, (2004). “Meeting everyone‟s Needs: National Economic Empowerment and
Development Strategy”, Nigerian National Planning Commission
Oliver, R.L. (1999), “Whence consumer loyalty?”, Journal of Marketing, Vol. 63, pp. 33-44.

114
Omar, O. & Orakwue, E. (2006) “Gender-Based choice of retail banking in nigeria”. (Online
assessed 03/03/09) Http//www.jbrmr.com/sample_page.pdf
Owusu-Frimpong N., (2008) “An Evaluation of customers‟ Perception and usage of rural
community (RCBs) In Ghana”. International Journal of emerging markets. Vol: 3 No.2
pp:181-196.
Oyedegi T.A and Bankole S.A. (2001) “Liberalisation of the services sector in Nigeria:
Implications of Unilateral and Multilateral Approaches”.
Palmer, A., (2008) “Principles of Service marketing” (5th
Ed) McGraw-Hill Education,
Berkshire.
Palmer, A., (2001) “Principles of Service marketing” (3rd
Ed) McGraw-Hill Education,
Berkshire
Pappu R and Quester (2006), “Does customer satisfaction lead to improved brand equity? An
empirical examination of two categories of retail brands”, Journal of Product and Brand
Management, Vol. 15, No 1, pp. 4-14.
Parasuraman, A, Zeithaml, V.A., Berry, L.L (1985), “A conceptual model of service quality
and its implications for future research”, Journal of Marketing, Vol. 49, PP.41-45.
Parasuraman, A., Zeithaml, V.A., Berry, L.L., (1988). “A multiple-item scale for measuring
consumer perceptions of service quality”, journal of retailing.
Parasuraman, A., Zeithaml, V.A., Berry, L.L., (1991), “Refinement and reassessment of the
SERVQUAL scale”, Journal of retailing, Vol.67, No.4, pp.420-450
Parasuraman, A., (2004) “Assessing and improving service performance for maximum
impact: Insights from a two-decade-long research journey”. Performance Measurement and
Metrics 5 (2): 45 – 52.
Piercy, N.F. (1995) “Customer satisfaction and the internal market”, Journal of Marketing
Practice: Applied Marketing Science, Vol. 1, No. 1, pp 22 – 44.
115
Ramseook-Munhurrun P, Lukea-Bhiwajee, S.D, Naidoo, P., (2010)., “Service Quality in the
Public Service”. International journal of management and marketing research. Vol: 3,
Number 1.
Reynolds, M (1999) “Critical Reflection and Management education: rehabilitating less
hierarchical approaches”, Journal of Management Education, Vol.23, No.5, pp.537-53
Reichheld, F.F, Sasser, W.E. (1990), “Zero defection: quality comes to services”, Harvard
Business Review, Vol.68, pp.105-11
Reisinger Y and Waryszak (1994), “Tourists‟ perceptions of service in shops, Japanese
tourists in Australia”, International Journal of Retail and Distribution management, Vol. 22
pp. 20 -28.
Rod M., Ashill N.J., Shao J., Carruthers J., (2009) “An examination of the relationship
between service quality dimensions, overall internet banking service quality and customer
satisfaction”. Journal of marketing Intelligence and planning, Vol.27, No.1, pp.103-126.
Roos I., (1999), “Switching process in customer relationships”, Journal of services research,
Vol.2, No. 1, pp.68-85
Saunders M., Lewis P., Thornhill A., (2003) “Research Methods for Business Students” (3rd
Ed) Pearson Education Limited Essex England.
Saunders M., Lewis P., Thornhill A., (2007) “Research Methods for Business Students” (4th
Ed) Pearson Education Limited Essex England.
Sachdev S.B & Verma H.V (2004) “Relative Importance of Service Quality Dimensions: A
multisectoral Study”. Journal of services research, Vol.4, No:1
Seth N., Deshmukh S.G., Vrat P., (2004) “Service quality models: a review”. International
Journal of quality management. Vol.22, No. 9, pp.913-949
Sekaran Uma, (2003), “Research Methods for Business: a skill building approach”,
Hermitage publishing, U.S.A.

116
Silvestro, R. (2005) “Applying gap analysis in the health service to inform the service
improvement agenda”, International Journal of Quality & Reliability Management, Vol. 22,
No. 2, pp. 215 – 233.
Smith A., Bolton R., Wagner J., (1999) “A model of customer satisfaction with service
encounters involving failure and recovery”, Journal of marketing research, Vol XXXVI,
pp.356-72
Soludo, C., (2006). “Financial Sector reforms and the real economy”. Speech to the Council
of Fellows of the Pharmaceutical Society of Nigeria.
Soludo, C., (2006). “Beyond banking sector consolidation in Nigeria Presentation at the
Global Banking Conference on Nigerian Banking Reform”.
Soteriou, A.C., Stavrinides, Y. (2000), “An Internal customer service quality data
envelopment analysis model for bank branch”, interlocal Journal of bank marketing, Vol.18,
No. 5, pp.226-52
Spathis, C., Petridou, E., Glaveli, N. (2004), “Managing service quality in banks: customers
gender effects”, Managing Service Quality, Vol. 14, No. 1, pp 90 – 102.
Stafford, M.R. (1996), “Demographic discriminators of service quality in the banking
industry”, The Journal of Services Marketing, Vol. 10 No. 4, pp. 6–22.
Stafford, M.R., Stafford, T.F., & Wells, B.P. (1998). “Determinants of Customer Satisfaction
In the Casualty Claims Process”. The Journal of Services Marketing, 12 (6), 426-440.
Stein, H., Ajakaiye, O., Lewis, P. (2002): “Deregulation and Banking Crisis in Nigeria”,
Palgrave, New York.
Sureshchander, G.S., Rajendran, C., Kamalanabhan, T.J. (2001), "Customer perceptions of
service quality: a critique", Total Quality Management, Vol. 12 No.1, pp.111-24.
Swanson S., Kelley S., (2001) “Service recovery attributions and word-of-mouth intentions”.
European Journal of Marketing, Vol. 35 No.1/2, pp.194-211

117
Uche, C.U. (1996), “The Nigerian failed banks decree: a critique”, Journal of International
Banking Law, Vol. 11 No. 10, pp. 436-41.
Uche, C.U. and Ehikwe, A.E. (2001), “Marketing of banking services in Nigeria”, Journal of
Financial Services Marketing, Vol. 6 No. 2, pp. 133-46
Vorhees C., Brady M., Horowitz D., (2006), “A voice from the silent masses: an exploratory
and comparative analysis of noncomplainers”, Journal of the academy of marketing science,
Vol.34, No.4, pp.514-27
Waters D., (2008). “Quantitative Methods of Business”, (4th
edition), England, Pearson
Education Limited 1997, 2001.
Wong D,H., Rexha N., Phau I., (2008) “Re-examining traditional Service quality in an e-
banking era”. “International Journal of Bank Marketing”, Vol. 26, No.7, pp.526-545.
Yu, L., Hong, Q., Gu, S., Wang, Y., (2008), “An epistemological critique gap theory based
on library assessment: the case SERVQUAL”, Journal of Documentation, vol. 64 No.4,
pp.511-51.
Zeithaml, V., A., Bitner, M., J., Gremler D., D., (2006) “Service Marketing: Integrating
Customer Focus across the Firm” (5th
ed) McGraw-Hill/Irwin, New-York.
Zeithaml, V., A., Bitner, M., J., Gremler D., D., (2009) “Service Marketing: Integrating
Customer Focus across the Firm” (6th
ed) McGraw-Hill/Irwin, New-York.
Zeithaml, V., Rust, R. & Lemon, K. (2001) “The customer pyramid: Creating and Serving
profitable customers”. California Management Review 43(4): 118-142.
Zhou, L., Zhang, Y. and Xu, J. (2002) “A critical assessment of SERVQUAL‟s applicability
in the banking context of China”. In: Ramizwick and Tu Ping (eds.) Asia Pacific Advances in
Consumer Research, Vol. 5. Valdosta, GA: Association for Consumer Research , pp. 14 – 21

118
Zhou, L (2004), “A dimension-Specific analysis of performance only measurement of service
quality and satisfaction in China‟s retail banking”, The Journal of Services Marketing, Vol.18
No:6/7, P.534

119
APPENDICES

120
APPENDIX 1
Questionnaire Request
Dear Sir/Madam,
I am a post graduate student in Dublin Business School (Dublin, Ireland) pursuing an international
MBA. Presently, I am conducting a research on customer‟s perception of service quality in the
commercial banking sector of Nigeria. It is expected that this research will provide the useful
information to discover how customers perceive service delivery in bank.
I kindly ask for your support by dedicating some time to take part in this online based questionnaire.
A space is provided where you can fill in your answers. These questions would take approximately 5
to 10 minutes. Please answer these questions in the space provided. If you wish to add further
comments, please feel free to do so.
I would really appreciate if you take part in this questionnaire. I firmly believe that your experiences
with the bank would provide an invaluable input to my research.
If you have any queries, please do not hesitate to contact me either by phone (+353876560347) or by
email ([email protected]). Please be rest assured that your response are treated anonymously
and your reviews will be strictly confidential. I would analyse the data on an aggregated level without
reference to individual respondents.
I am looking forward to your response.
Yours faithfully,
Okoroafor Chukwuemezuo