cuyahoga county urban tree canopy...
TRANSCRIPT
Cuyahoga County Urban Tree Canopy Assessment, 2013.
Cuyahoga County Planning Commission 1
Cuyahoga County Urban
Tree Canopy Assessment,
2013
Prepared by
The Cuyahoga County Planning Commission
and
Cleveland Metroparks
December 20, 2013

Cuyahoga County Urban Tree Canopy Assessment, 2013.
Cuyahoga County Planning Commission 2
Tree canopy (TC) is the layer of leaves, branches, and stems of trees that cover the ground when viewed from above. Tree canopy provides many benefits to communities, improving water quality, reducing ero-sion, reducing stormwater runoff, saving energy, lowering city temperatures, reducing air pollution, en-hancing property values, providing wildlife habitat, facilitating social and educational opportunities, and providing aesthetic benefits. Establishing a tree canopy goal is crucial for communities seeking to improve their green infrastructure. A tree canopy assessment is the first step in this goal-setting process, providing estimates for the amount of tree canopy currently present in a city as well as the amount of tree canopy that could theoretically be established.
Why is Tree Canopy Important?
Project Background
The goal of the project was to apply the USDA Forest Service’s Tree Canopy (TC) Assessment Protocols to Cuyahoga County. The analysis was conducted based primarily on 2011 infrared imagery from the National Agricultural Inventory Program (NAIP), together with a number of local data sources. This project was made possible by funding from a US Forest Service grant administered by the Ohio Department of Natural Resources, Division of Forestry, with support from the Cuyahoga River Community Planning Organization. Funding was matched by equal in-kind contributions from the Cuyahoga County Planning Commission and Cleveland Metroparks, as well as a number of individual communities. Land cover analysis was conducted by the Spatial Analysis Laboratory (SAL) at the University of Vermont’s Rubenstein School of the Environment and Natural Resources, in collaboration with SavATree, Inc.. Tree canopy metrics were developed by the Cuyahoga County Planning Commission and Cleveland Metroparks.
Cuyahoga County Urban Tree Canopy Assessment, 2013.
Cuyahoga County Planning Commission 3
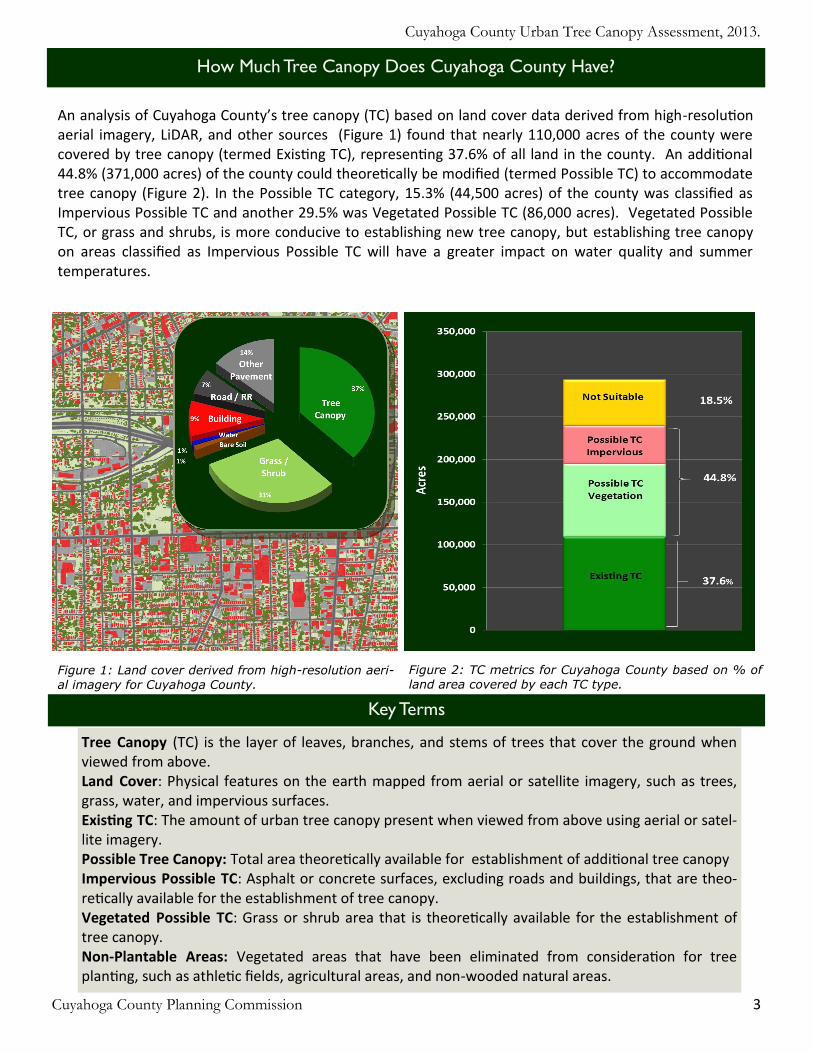
How Much Tree Canopy Does Cuyahoga County Have?
An analysis of Cuyahoga County’s tree canopy (TC) based on land cover data derived from high-resolution aerial imagery, LiDAR, and other sources (Figure 1) found that nearly 110,000 acres of the county were covered by tree canopy (termed Existing TC), representing 37.6% of all land in the county. An additional 44.8% (371,000 acres) of the county could theoretically be modified (termed Possible TC) to accommodate tree canopy (Figure 2). In the Possible TC category, 15.3% (44,500 acres) of the county was classified as Impervious Possible TC and another 29.5% was Vegetated Possible TC (86,000 acres). Vegetated Possible TC, or grass and shrubs, is more conducive to establishing new tree canopy, but establishing tree canopy on areas classified as Impervious Possible TC will have a greater impact on water quality and summer temperatures.
Figure 1: Land cover derived from high-resolution aeri-al imagery for Cuyahoga County.
Figure 2: TC metrics for Cuyahoga County based on % of land area covered by each TC type.
Key Terms
Tree Canopy (TC) is the layer of leaves, branches, and stems of trees that cover the ground when viewed from above. Land Cover: Physical features on the earth mapped from aerial or satellite imagery, such as trees, grass, water, and impervious surfaces. Existing TC: The amount of urban tree canopy present when viewed from above using aerial or satel-lite imagery. Possible Tree Canopy: Total area theoretically available for establishment of additional tree canopy Impervious Possible TC: Asphalt or concrete surfaces, excluding roads and buildings, that are theo-retically available for the establishment of tree canopy. Vegetated Possible TC: Grass or shrub area that is theoretically available for the establishment of tree canopy. Non-Plantable Areas: Vegetated areas that have been eliminated from consideration for tree planting, such as athletic fields, agricultural areas, and non-wooded natural areas.

Cuyahoga County Urban Tree Canopy Assessment, 2013.
Cuyahoga County Planning Commission 4
Mapping Cuyahoga County’s Trees
Prior to this study, the only comprehensive remotely-sensed estimates of tree canopy for Cuyahoga County were from the 2006 National Land Cover Database (NLCD 2006). While NLCD 2006 is valuable for analyzing land cover at the regional level, it is derived from relatively coarse, 30-meter resolution satellite imagery (Figure 3a). The NLCD substantially under estimated Cuyahoga County’s tree canopy, at 17.6%, largely because it failed to capture smaller patches. Instead, using advanced automated processing techniques to combine high resolution aerial imagery (Figure 3b), with a variety of locally developed sources to develop land cover mapping for the entire county in much greater detail (Figure 3c). Data sources include: Leaf-on 4-band aerial imagery, 1 meter resolution (USDA National Agricultural Imagery Program, 2011) Leaf-off 3-band color infrared aerial imagery, 1 foot resolution (Cuyahoga County, 2011) LiDAR point cloud (Cuyahoga County, 2006) Building polygons (Cuyahoga County, 2006 and City of Cleveland, 2008) Road polygons (Cuyahoga County, 2006) Property parcel polygons (Cuyahoga County, 2013) Hydrography polygons (Cuyahoga County, 2006) Impervious surface polygons (NEORSD, 2012)
b. Color-infrared Aerial Imagery (1 meter)
a. NLCD P Tree Canopy (30 meter)
Figure 3a, 3b, 3c: Comparison of NLCD to high-resolution land cover.
c. Land Cover Derived from 2011 Aerial Imagery
Tree CanopyGrass/ShrubBare SoilWaterBuildingsRoads/RailroadsOther Paved

Cuyahoga County Urban Tree Canopy Assessment, 2013.
Cuyahoga County Planning Commission 5
4a. Parcels
Geographic Area Metrics
After land cover was mapped county-wide, Tree Canopy (TC) metrics were summarized for a number of geographic scales. Existing TC and Possible TC metrics were calculated for Communities, Watersheds, Riparian Zones, Census Tracts and Blocks, and individual parcels. Metrics were calculated both in terms of total acres and as a percentage of the land area within each parcel (TC area ÷ land area of the parcel). See Figures 4a—4d for a graphic view of parcel level summarization. In addition to those calculated metrics, any characteristics of those areas can be applied to the analysis. Population demographics, for example, can be tied to the metrics for census geographies. Property appraisal characteristics, such as land use or ownership can be applied at the parcel level.
Figure 4a, 4b, 4c, 4d: Parcel-based TC metrics.
4c. Existing Tree Canopy 4d. Possible Tree Canopy
% Possible Tree Canopy
0% -
15%
16%
- 35
%
36%
- 55
%
56%
- 75
%
76%
- 10
0%
4b. Land Cover
Cuyahoga County Urban Tree Canopy Assessment, 2013.
Cuyahoga County Planning Commission 6
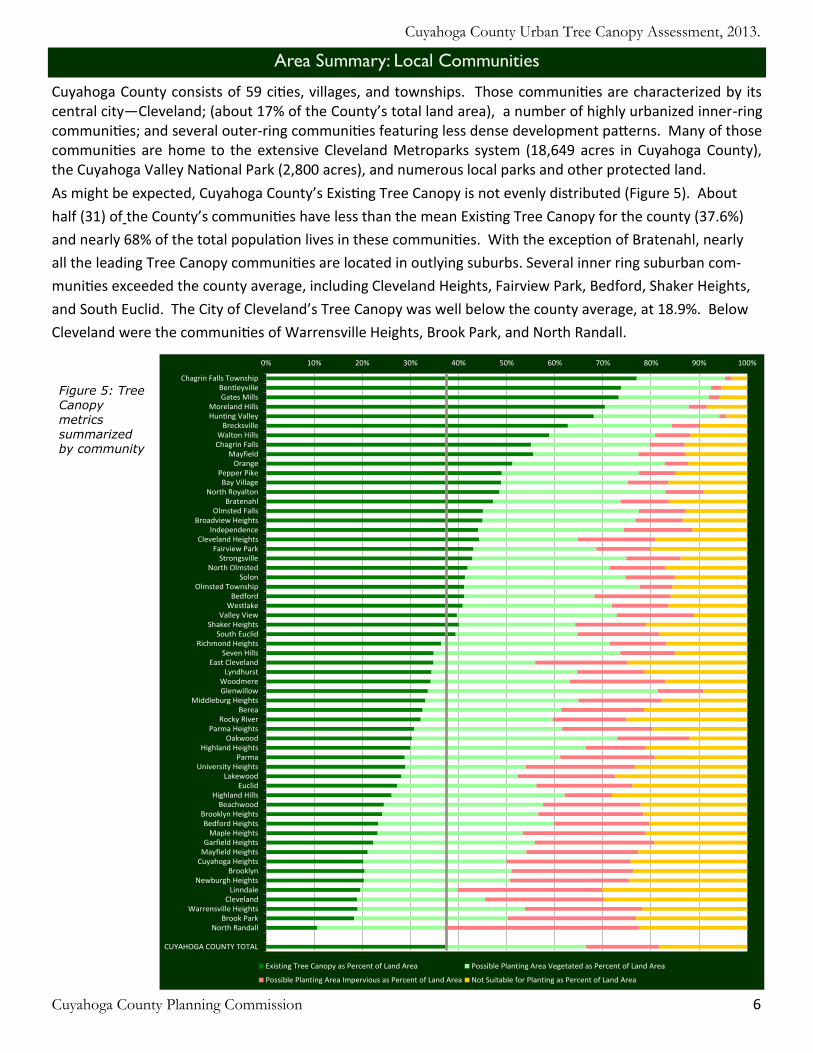
Figure 5: Tree Canopy
metrics summarized by community
Area Summary: Local Communities
Cuyahoga County consists of 59 cities, villages, and townships. Those communities are characterized by its central city—Cleveland; (about 17% of the County’s total land area), a number of highly urbanized inner-ring communities; and several outer-ring communities featuring less dense development patterns. Many of those communities are home to the extensive Cleveland Metroparks system (18,649 acres in Cuyahoga County), the Cuyahoga Valley National Park (2,800 acres), and numerous local parks and other protected land.
As might be expected, Cuyahoga County’s Existing Tree Canopy is not evenly distributed (Figure 5). About
half (31) of the County’s communities have less than the mean Existing Tree Canopy for the county (37.6%)
and nearly 68% of the total population lives in these communities. With the exception of Bratenahl, nearly
all the leading Tree Canopy communities are located in outlying suburbs. Several inner ring suburban com-
munities exceeded the county average, including Cleveland Heights, Fairview Park, Bedford, Shaker Heights,
and South Euclid. The City of Cleveland’s Tree Canopy was well below the county average, at 18.9%. Below
Cleveland were the communities of Warrensville Heights, Brook Park, and North Randall.
0% 10% 20% 30% 40% 50% 60% 70% 80% 90% 100%
Chagrin Falls TownshipBentleyvilleGates Mills
Moreland HillsHunting Valley
BrecksvilleWalton HillsChagrin Falls
MayfieldOrange
Pepper PikeBay Village
North RoyaltonBratenahl
Olmsted FallsBroadview Heights
IndependenceCleveland Heights
Fairview ParkStrongsville
North OlmstedSolon
Olmsted TownshipBedford
WestlakeValley View
Shaker HeightsSouth Euclid
Richmond HeightsSeven Hills
East ClevelandLyndhurst
WoodmereGlenwillow
Middleburg HeightsBerea
Rocky RiverParma Heights
OakwoodHighland Heights
ParmaUniversity Heights
LakewoodEuclid
Highland HillsBeachwood
Brooklyn HeightsBedford Heights
Maple HeightsGarfield Heights
Mayfield HeightsCuyahoga Heights
BrooklynNewburgh Heights
LinndaleCleveland
Warrensville HeightsBrook Park
North Randall
CUYAHOGA COUNTY TOTAL
Existing Tree Canopy as Percent of Land Area Possible Planting Area Vegetated as Percent of Land Area
Possible Planting Area Impervious as Percent of Land Area Not Suitable for Planting as Percent of Land Area
Cuyahoga County Urban Tree Canopy Assessment, 2013.
Cuyahoga County Planning Commission 7
Figure 7: Possible
Planting Area
summarized by community.
Area Summary: Local Communities
WALTONHILLS
GLENWILLOW
ROCKYRIVER
GARFIELDHEIGHTS
MIDDLEBURGHEIGHTS
BAYVILLAGE
BEREAOLMSTEDTOWNSHIP
WARRENSVILLEHEIGHTS
SOLON
BENTLEYVILLEMAPLE
HEIGHTS
PARMA
OAKWOOD
BRATENAHL
WESTLAKE
NORTHRANDALL
OLMSTEDFALLS
CHAGRINFALLS
NORTHROYALTON
CHAGRINFALLS
TOWNSHIP
BROADVIEWHEIGHTS
NORTHOLMSTED
STRONGSVILLE
SOUTHEUCLID
WOODMERE
ORANGE
PARMAHEIGHTS
LINNDALE
LAKEWOOD
SEVENHILLS
BROOKLYNHEIGHTSBROOK
PARK
SHAKERHEIGHTS
BEDFORDHEIGHTS
NEWBURGHHEIGHTS
FAIRVIEWPARK CUYAHOGA
HEIGHTS
HUNTINGVALLEY
INDEPENDENCE
VALLEYVIEW
LYNDHURST
EASTCLEVELAND
PEPPERPIKE
CLEVELANDHEIGHTS
MORELANDHILLS
EUCLID
HIGHLANDHILLS
RICHMONDHEIGHTS
HIGHLANDHEIGHTS
MAYFIELD
BRECKSVILLE
UNIVERSITYHEIGHTS
GATESMILLS
MAYFIELDHEIGHTS
BROOKLYN
CLEVELAND
BEDFORD
BEACHWOOD
11% - 20%
21% - 40%
41% - 60%
61% - 80%
Source: Cuyahoga County Urban Tree Canopy Assessment, 2013.
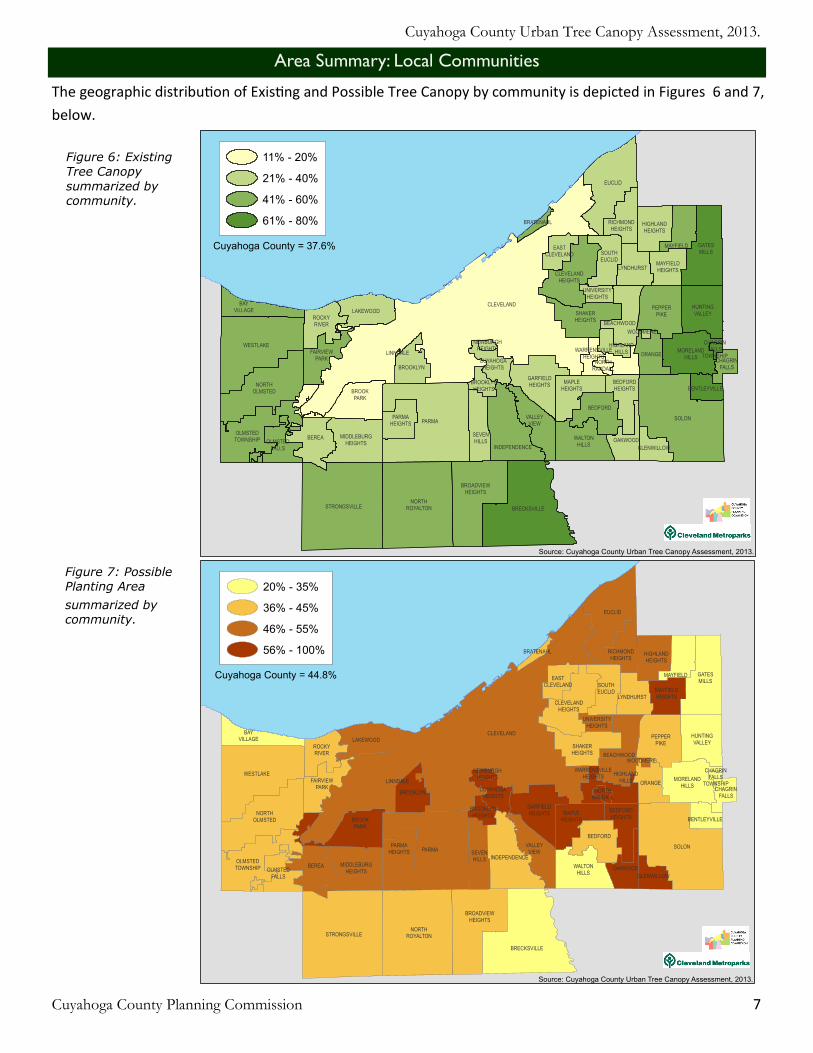
Cuyahoga County = 37.6%
Figure 6: Existing Tree Canopy
summarized by community.
WALTONHILLS
GLENWILLOW
ROCKYRIVER
GARFIELDHEIGHTS
MIDDLEBURGHEIGHTS
BAYVILLAGE
BEREAOLMSTEDTOWNSHIP
WARRENSVILLEHEIGHTS
SOLON
BENTLEYVILLEMAPLE
HEIGHTS
PARMA
OAKWOOD
BRATENAHL
WESTLAKE
NORTHRANDALL
OLMSTEDFALLS
CHAGRINFALLS
NORTHROYALTON
CHAGRINFALLS
TOWNSHIP
BROADVIEWHEIGHTS
NORTHOLMSTED
STRONGSVILLE
SOUTHEUCLID
WOODMERE
ORANGE
PARMAHEIGHTS
LINNDALE
LAKEWOOD
SEVENHILLS
BROOKLYNHEIGHTS
BROOKPARK
SHAKERHEIGHTS
BEDFORDHEIGHTS
NEWBURGHHEIGHTS
FAIRVIEWPARK CUYAHOGA
HEIGHTS
HUNTINGVALLEY
INDEPENDENCE
VALLEYVIEW
LYNDHURST
EASTCLEVELAND
PEPPERPIKE
CLEVELANDHEIGHTS
MORELANDHILLS
EUCLID
HIGHLANDHILLS
RICHMONDHEIGHTS
HIGHLANDHEIGHTS
MAYFIELD
BRECKSVILLE
UNIVERSITYHEIGHTS
GATESMILLS
MAYFIELDHEIGHTS
BROOKLYN
CLEVELAND
BEDFORD
BEACHWOOD
20% - 35%
36% - 45%
46% - 55%
56% - 100%
Source: Cuyahoga County Urban Tree Canopy Assessment, 2013.
Cuyahoga County = 44.8%
The geographic distribution of Existing and Possible Tree Canopy by community is depicted in Figures 6 and 7,
below.

Cuyahoga County Urban Tree Canopy Assessment, 2013.
Cuyahoga County Planning Commission 8
Figure 8: Tree Canopy metrics summarized by subwatershed
Area Summary: Subwatersheds
Cuyahoga County is intersected by 3 major watersheds: the Rocky, Cuyahoga, and
Chagrin. In addition, much of the County drains directly to the shores of Lake Erie.
Within those major watersheds are 32 smaller subwatersheds (Figure 8), ranging in size
from 200 acres to more than 20,000 acres. Although they follow the natural contours
of their respective drainage areas (as opposed to local community boundaries), these
subwatersheds are characterized by varying degrees of urbanization and degradation.
In a few subwatersheds, there is no significant above-ground drainage, while others
benefit from extensive protection in the form of parks and conservation easements.
Research by Goetz et al. (2003) indicates that watersheds with 37% tree canopy can be categorized as “fair” in a
stream health rating; watersheds with 45% tree canopy can be categorized as “good.”
0% 10% 20% 30% 40% 50% 60% 70% 80% 90% 100%
Willow Creek
Chagrin River Upper Main Branch / Beaver Creek
Chagrin River Main Branch
Cuyahoga River / Cuyahoga Valley National Park
Chippewa Creek
Chagrin River Aurora Branch
Pond Brook
Rocky River East Branch
Lake Erie Tributaries East of Black River
French Creek
Plum Creek
Doan Brook
Porter Creek
Furnace Run
Lake Erie West Tribs (Cahoon, Sperry Creeks)
Baldwin Creek
Rocky River West Branch
Rocky River Main Stem
Tinkers Creek
Euclid Creek
Dugway / Nine Mile / Green Creeks
West Creek
Brandywine Creek
Big Creek
Mill Creek
Abrams Creek
Lake Erie Tributaries West of Chagrin River
Lake Erie West Tributaries
Cuyahoga River Navigation Channel / Kingsbury Run
Lake Erie East Tributaries
Cuyahoga River Navigation Channel
Cuyahoga Navigation Channel / Morganna / Burke Br
CUYAHOGA COUNTY TOTAL
Existing Tree Canopy as Percent of Land Area Possible Planting Area Vegetated as Percent of Land Area
Possible Planting Area Impervious as Percent of Land Area Not Suitable for Planting as Percent of Land Area

Cuyahoga County Urban Tree Canopy Assessment, 2013.
Cuyahoga County Planning Commission 9
Figure 10: Possible
P l a n t i n g A r e a summarized by
subwatershed.
Area Summary: Local Communities
Figure 9: Existing T r e e C a n o p y summarized by
subwatershed.
ABRAMSCREEK
BALDWINCREEK
BIGCREEK
BRANDYWINECREEK
CHAGRIN RIVERAURORA BRANCH
CHAGRINRIVER MAIN
BRANCH
CHAGRIN RIVERUPPER MAIN BRANCH
/ BEAVER CREEK
CHIPPEWACREEK
CUYAHOGA NAVIGATIONCHANNEL / MORGANNA
/ BURKE BR
CUYAHOGA RIVER /CUYAHOGA VALLEY
NATIONAL PARK
CUYAHOGA RIVERNAVIGATION
CHANNEL
CUYAHOGA RIVERNAVIGATION CHANNEL
/ KINGSBURY RUN
DOANBROOK
DUGWAY /NINE MILE /
GREEN CREEKS
EUCLIDCREEK
FRENCHCREEK
FURNACERUN
LAKE ERIEEAST
TRIBUTARIES
LAKEERIE EAST
TRIBUTARIES
LAKE ERIETRIBUTARIES EAST
OF BLACK RIVER
LAKE ERIETRIBUTARIES WESTOF CHAGRIN RIVER
LAKE ERIE WESTTRIBS (CAHOON,
SPERRY CREEKS)
LAKEERIE WEST
TRIBUTARIES
MILLCREEK
PLUMCREEK POND
BROOK
PORTERCREEK
ROCKYRIVER EAST
BRANCH
ROCKY RIVERMAIN STEM
ROCKYRIVER WEST
BRANCH
TINKERSCREEK
WESTCREEK
WILLOWCREEK
WILLOWCREEK
20% - 35%
36% - 45%
46% - 55%
56% - 100%
Source: Cuyahoga County Urban Tree Canopy Assessment, 2013.
Cuyahoga County = 44.8%
ABRAMSCREEK
BALDWINCREEK
BIGCREEK
BRANDYWINECREEK
CHAGRIN RIVERAURORA BRANCH
CHAGRINRIVER MAIN
BRANCH
CHAGRIN RIVERUPPER MAIN BRANCH
/ BEAVER CREEK
CHIPPEWACREEK
CUYAHOGA NAVIGATIONCHANNEL / MORGANNA
/ BURKE BR
CUYAHOGA RIVER /CUYAHOGA VALLEY
NATIONAL PARK
CUYAHOGA RIVERNAVIGATION
CHANNEL
CUYAHOGA RIVERNAVIGATION CHANNEL
/ KINGSBURY RUN
DOANBROOK
DUGWAY /NINE MILE /
GREEN CREEKS
EUCLIDCREEK
FRENCHCREEK
FURNACERUN
LAKE ERIEEAST
TRIBUTARIES
LAKEERIE EAST
TRIBUTARIES
LAKE ERIETRIBUTARIES EAST
OF BLACK RIVER
LAKE ERIETRIBUTARIES WESTOF CHAGRIN RIVER
LAKE ERIE WESTTRIBS (CAHOON,
SPERRY CREEKS)
LAKEERIE WEST
TRIBUTARIES
MILLCREEK
PLUMCREEK POND
BROOK
PORTERCREEK
ROCKYRIVER EAST
BRANCH
ROCKY RIVERMAIN STEM
ROCKYRIVER WEST
BRANCH
TINKERSCREEK
WESTCREEK
WILLOWCREEK
WILLOWCREEK
11% - 20%
21% - 40%
41% - 60%
61% - 80%
Source: Cuyahoga County Urban Tree Canopy Assessment, 2013.
Cuyahoga County = 37.6%
Area Summary: Subwatersheds
The geographic distribution of Existing and Possible Tree Canopy by subwatershed is depicted in Figures 9 and
10, below.
Cuyahoga County Urban Tree Canopy Assessment, 2013.
Cuyahoga County Planning Commission 10
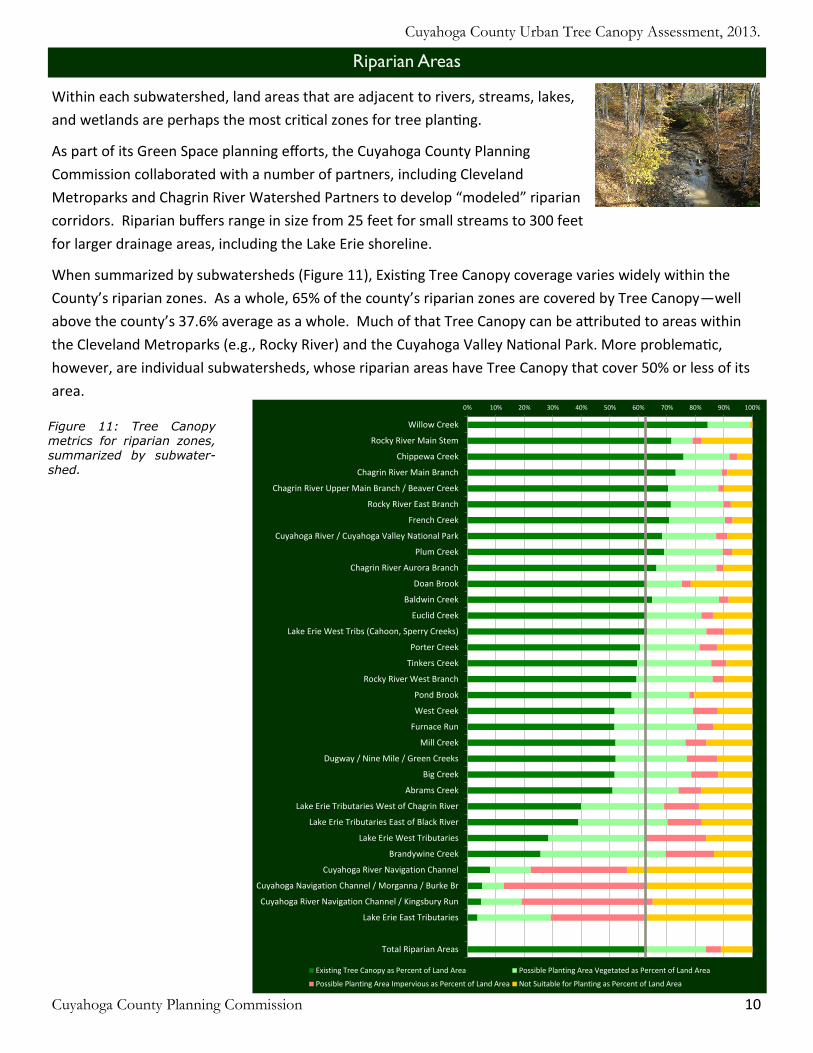
Riparian Areas
Within each subwatershed, land areas that are adjacent to rivers, streams, lakes,
and wetlands are perhaps the most critical zones for tree planting.
As part of its Green Space planning efforts, the Cuyahoga County Planning
Commission collaborated with a number of partners, including Cleveland
Metroparks and Chagrin River Watershed Partners to develop “modeled” riparian
corridors. Riparian buffers range in size from 25 feet for small streams to 300 feet
for larger drainage areas, including the Lake Erie shoreline.
When summarized by subwatersheds (Figure 11), Existing Tree Canopy coverage varies widely within the
County’s riparian zones. As a whole, 65% of the county’s riparian zones are covered by Tree Canopy—well
above the county’s 37.6% average as a whole. Much of that Tree Canopy can be attributed to areas within
the Cleveland Metroparks (e.g., Rocky River) and the Cuyahoga Valley National Park. More problematic,
however, are individual subwatersheds, whose riparian areas have Tree Canopy that cover 50% or less of its
area.
Figure 11: Tree Canopy metrics for riparian zones, summarized by subwater-shed.
0% 10% 20% 30% 40% 50% 60% 70% 80% 90% 100%
Willow Creek
Rocky River Main Stem
Chippewa Creek
Chagrin River Main Branch
Chagrin River Upper Main Branch / Beaver Creek
Rocky River East Branch
French Creek
Cuyahoga River / Cuyahoga Valley National Park
Plum Creek
Chagrin River Aurora Branch
Doan Brook
Baldwin Creek
Euclid Creek
Lake Erie West Tribs (Cahoon, Sperry Creeks)
Porter Creek
Tinkers Creek
Rocky River West Branch
Pond Brook
West Creek
Furnace Run
Mill Creek
Dugway / Nine Mile / Green Creeks
Big Creek
Abrams Creek
Lake Erie Tributaries West of Chagrin River
Lake Erie Tributaries East of Black River
Lake Erie West Tributaries
Brandywine Creek
Cuyahoga River Navigation Channel
Cuyahoga Navigation Channel / Morganna / Burke Br
Cuyahoga River Navigation Channel / Kingsbury Run
Lake Erie East Tributaries
Total Riparian Areas
Existing Tree Canopy as Percent of Land Area Possible Planting Area Vegetated as Percent of Land Area
Possible Planting Area Impervious as Percent of Land Area Not Suitable for Planting as Percent of Land Area

Cuyahoga County Urban Tree Canopy Assessment, 2013.
Cuyahoga County Planning Commission 11
Figure 12: Tree Canopy metrics summarized by land use.
The Cuyahoga County Fiscal Office maintains land use
classification as part of its parcel records. Existing and
Possible Tree Canopy (TC) were summarized for the seven
aggregated parcel land use classes and two types of public
right-of-way (Figure 12, Table 1).
For each land use class, Tree Canopy metrics were
calculated as a percentage of land area in the specified
land use category, and as a percentage of all land in the
county. Residential land is the largest land use type within
the county, at 50.8%, and contributes 62.4% of the
county’s total tree canopy. In fact, residential land is
second only to Parks/Open Space in its percentage of tree canopy cover among all uses.
Possible Tree Planting Area is also dominated by Residential land uses, accounting for 57% of all Vegetated
Possible Tree Planting Area in the County, as well as 34% of the county’s Impervious Possible Tree Planting
Area. Commercial and Industrial land uses provide significant potential planting area, particularly in their
“Impervious” areas (paved surfaces that are not buildings or roads). Parking lots and areas immediately
adjacent provide significant area for the establishment of tree canopy to reduce stormwater runoff and
urban heat effects.
Similarly, Public Right-of-Way offers substantial area for tree planting efforts, with a combined 11.6% of the
county’s Vegetated Possible Tree Planting Area. In addition to their ecological and societal benefits,
establishing tree canopy in these areas could add to tree canopy totals at the expense of current roadway
and other adjacent impervious cover.
0 20,000 40,000 60,000 80,000 100,000 120,000 140,000 160,000
Residential
Commercial
Industrial
Park/Open Space
Institutional
Agricultural
Transportation/Utility
R/W Highway
R/W Street
ACRES
Existing Tree Canopy
Possible Planting Area Vegetated
Possible Planting Area Impervious
Not Suitable for Planting
Parcels
Public Right-of-Way
Area Summary: Land Use
Parma
Brooklyn
LAND USE
RESIDENTIAL
COMMERCIAL
INDUSTRIAL
PARK / OPEN SPACE
INSTITUTIONAL
AGRICULTURAL
TRANSPORTATION / UTILITY
RIGHT OF WAY
Source: Cuyahoga County Urban Tree Canopy Assessment, 2013.

Cuyahoga County Urban Tree Canopy Assessment, 2013.
Cuyahoga County Planning Commission 12
PERCENT OF LAND USE CATEGORY PERCENT OF COUNTY LAND
Land Use
Existing
Tree
Canopy
Possible
Planting
Area
Vegetated
Possible
Planting
Area
Impervi-
ous
Not
Suitable
for
Planting
Total
Land Use
Existing
Tree
Canopy
Possible
Planting
Area
Vegetated
Possible
Planting
Area I
mpervious
Not
Suitable
for
Planting
Total
County
Land
Residential 45.4% 33.5% 10.3% 11.1% 100.0% 62.4% 57.1% 34.4% 30.4% 50.8%
Commercial 16.1% 22.3% 42.6% 19.5% 100.0% 2.5% 4.3% 16.1% 6.0% 5.8%
Industrial 18.4% 27.4% 33.9% 21.1% 100.0% 4.6% 8.5% 20.5% 10.5% 9.2%
Park/Open pace 67.2% 14.9% 3.5% 17.5% 100.0% 18.7% 5.1% 2.4% 9.7% 10.3%
Institutional 25.6% 32.6% 22.3% 19.9% 100.0% 3.5% 5.6% 7.4% 5.5% 5.1%
Agricultural 43.7% 43.8% 3.6% 11.3% 100.0% 0.8% 1.0% 0.2% 0.4% 0.7%
Transp./Utility 13.0% 38.0% 17.4% 32.4% 100.0% 1.9% 6.8% 6.1% 9.3% 5.4%
R/W Highway 10.0% 44.2% 15.7% 30.2% 100.0% 0.6% 3.3% 2.3% 3.6% 2.3%
R/W Street 17.5% 23.5% 15.5% 43.6% 100.0% 5.0% 8.3% 10.7% 24.6% 10.5%
Total County 37.0% 29.9% 15.3% 18.6% 100.0% 100.0% 100.0% 100.0% 100.0% 100.0%
Table 1: Tree Canopy metrics summarized by land use
Note: PERCENT OF LAND USE CATEGORY: Add Across / PERCENT OF COUNTY LAND: Add Down.
Area Summary: Land Use

Cuyahoga County Urban Tree Canopy Assessment, 2013.
Cuyahoga County Planning Commission 13
Due in large part to the recent foreclosure crisis, vacant
land in Cuyahoga County has grown in recent years.
Countywide, over 35,500 parcels and nearly 25,000 acres
of land is now estimated to be vacant.
As might be expected, 56% of vacant land in Cuyahoga
County consists of Existing Tree Canopy (Figure 13). More
than 40% of the remaining area is available as Possible
Tree Canopy—largely vegetated.
While much of this land consists of smaller, isolated urban parcels, there are significant opportunities for
land assembly. In a recent analysis of vacant land in the County, the CCPC aggregated adjacent vacant par-
cels to form vacant “tracts”, and found that over 20,000 acres of the County’s vacant land were in tracts that
were 2 acres or larger (see sample area, Figure 14).
Additional consideration should be given to reforestation opportunities are available on large former indus-
trial properties as well. The City of Flint, Michigan has undertaken an effort to plant approximately 1,000
tree on its Chevy in the Hole brownfield site .
Area Summary: Vacant Land
Figure 13: TC metrics for Vacant Land in Cuyahoga County.
Vacant Tracts
Tree Canopy
Grass/Shrub
Bare Soil
Water
Buildings
Roads / Railroads
Other Paved
Source: Cuyahoga County Urban Tree Canopy Assessment, 2013.
Figure 14: Vacant “tracts” overlaid on Land Cover.

Cuyahoga County Urban Tree Canopy Assessment, 2013.
Cuyahoga County Planning Commission 14
0% 20% 40% 60% 80% 100%
Anne Arundel County, MD
Allegheny County, PA
Scranton Metro Area, PA
Greater Fairfax County, VA
Prince George's County, MD
Mecklenburg County, NC
Howard County, MD
Montgomery County, MD
Baltimore County, MD
Pittsburgh, PA
Berkeley County, WV
Jefferson County, WV
Cuyahoga County, OH
Toronto, ONT
Baltimore City , MD
New York, NY
Philadelphia, PA
Percent of Land Area
% Tree Canopy - Land Area % Possible Tree Canopy - Vegetation % Possible Tree Canopy - Impervious Not Suitable
Figure 15: Tree Canopy metrics for selected counties and cities.
Comparisons to Other Areas
At 38% of the land area, Cuyahoga County’s overall tree canopy is a lower
percentage than other available counties (Figure 15). In addition, a majority of
the County’s residents live in communities with substantially less tree canopy.
The City of Cleveland, at 19% Tree Canopy, is comparable to New York and Phil-
adelphia.
By aggressively replanting in its existing potential planting areas, Cuyahoga County can meet or surpass
many of those areas.

Cuyahoga County Urban Tree Canopy Assessment, 2013.
Cuyahoga County Planning Commission 15
Conclusions
In its “Watershed Book”, the Cuyahoga River Community Planning Organization (CRCPO) identifies
several Key Benefits of Preserving and Expanding Forest Cover:
Roots stabilize soils, while canopy and leaf cover interrupt precipitation to reduce erosion and
sedimentation in streams
Cleans stormwater before releasing into groundwater and streams
Reduces flooding by absorbing and managing stormwater
Absorbs airborne pollutants, especially particulates, that would otherwise enter the water
system
Provides wildlife habitat
Conserves household energy costs
Increases property values
The tree canopy metrics, in combination with neighborhood indicators such as poverty and crime,
can be used to prioritize neighborhoods for tree planting initiatives. For more information on these
approaches, see the available publications on the US Forest Service website:
http://www.nrs.fs.fed.us/urban/utc/pubs/
Although this assessment indicates that nearly half of the land in Cuyahoga County could
theoretically support tree canopy, planting new trees on much of this land may not be socially
desirable or financially feasible (e.g. parking lots). Setting a realistic goal requires a detailed
feasibility assessment using the geospatial datasets generated as part of this assessment.
Cuyahoga County’s residents are the largest steward of the County’s tree canopy and have most of
the land to plant tees. Programs that educate residents on tree stewardship and provide incentives
for tree planting are crucial if Cuyahoga County is going to sustain its tree canopy in the long term.
Existing and Possible Tree Canopy metrics have been summarized at detailed geographic levels and
integrated into GIS databases, and are particularly useful at the parcel level. Individual parcels,
groups of parcels, and classes of parcels can be examined and targeted for tree canopy
improvement. Of particular focus should be parcels that have large, contiguous impervious surfaces.
These parcels contribute high amounts of runoff, which degrades water quality. The establishment
of tree canopy on these parcels will help reduce runoff during periods of peak overland flow. Vacant
lands should also be a focus as they present a unique opportunity.

Cuyahoga County Urban Tree Canopy Assessment, 2013.
Cuyahoga County Planning Commission 16
Daniel Meaney Cuyahoga County Planning Commission 2429 Superior Viaduct Cleveland, Ohio 44113 (216) 443-3700 [email protected]
Prepared by:
Additional Information
More information on Cuyahoga County’s Urban Tree Canopy Assessment will be posted soon on the
Cuyahoga County Planning Commission’s website, including an interactive mapping application
(courtesy of Cleveland Metroparks), downloadable spreadsheet and GIS data, and links to a variety of
related resources:
http://planning.co.cuyahoga.oh.us/canopy/
More information on local reforestation efforts and best practices is available from the Cuyahoga River Community Planning Organization’s “Releaf” program site, especially its Watershed Book:
http://www.crcpo.org/education.html
… and its Watershed Strategies page, including a section on Forest Canopy and Tree Mitigation: http://www.crcpo.org/watershedstrategies/WatershedStrategies.html
More information on Urban Tree Canopy Assessments can be found at the US Forest Service Urban Tree Canopy site, including links to other studies and further research topics:
http://nrs.fs.fed.us/urban/utc/
Special thanks to Jarlath O’Neil-Dunn of the University of Vermont Spatial Analysis Lab for their excel-lent land cover analysis, and for providing templates for the metric graphics and for portions of this report’s narrative content; to Stephen Mather of Cleveland Metroparks for accuracy assessment, web development and analysis; and, to numerous local communities for their participation in quality con-trol.