cvs case study final
DESCRIPTION
case solutionTRANSCRIPT
A Strategic Management Case Study on CVS Caremark Corporation
By: Carter Vaillancourt, Megan Land, and Emily Michaud
UMFK
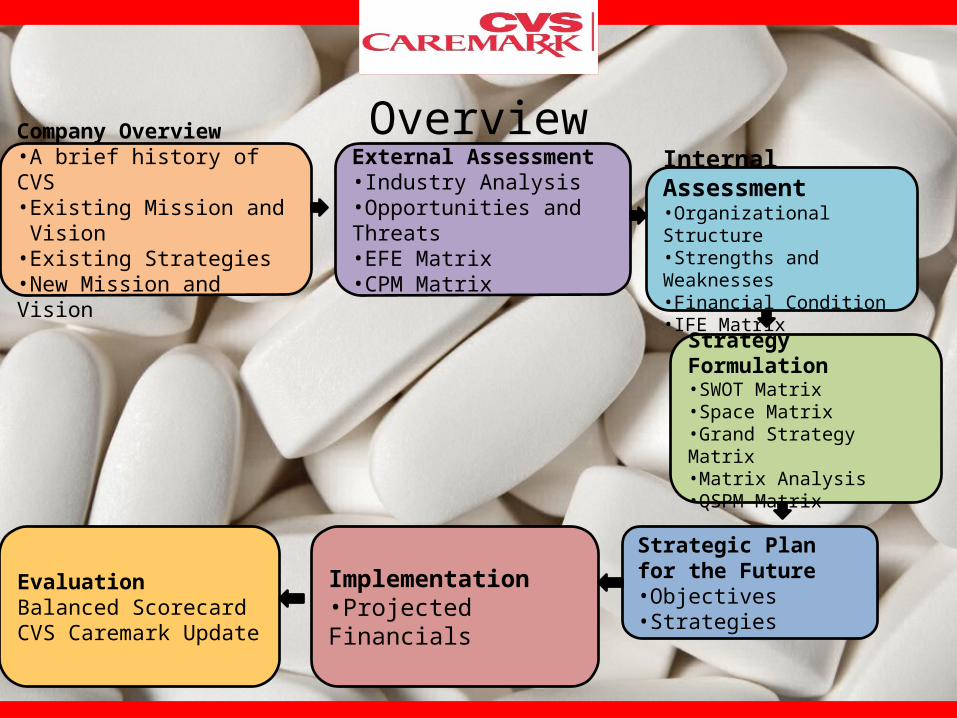
Company Overview•A brief history of CVS•Existing Mission and Vision•Existing Strategies•New Mission and Vision
External Assessment•Industry Analysis•Opportunities and Threats•EFE Matrix•CPM Matrix
Internal Assessment•Organizational Structure•Strengths and Weaknesses•Financial Condition•IFE Matrix
Strategy Formulation•SWOT Matrix•Space Matrix•Grand Strategy Matrix•Matrix Analysis•QSPM Matrix
Strategic Plan for the Future•Objectives•Strategies
Implementation •Projected Financials
EvaluationBalanced ScorecardCVS Caremark Update
Overview
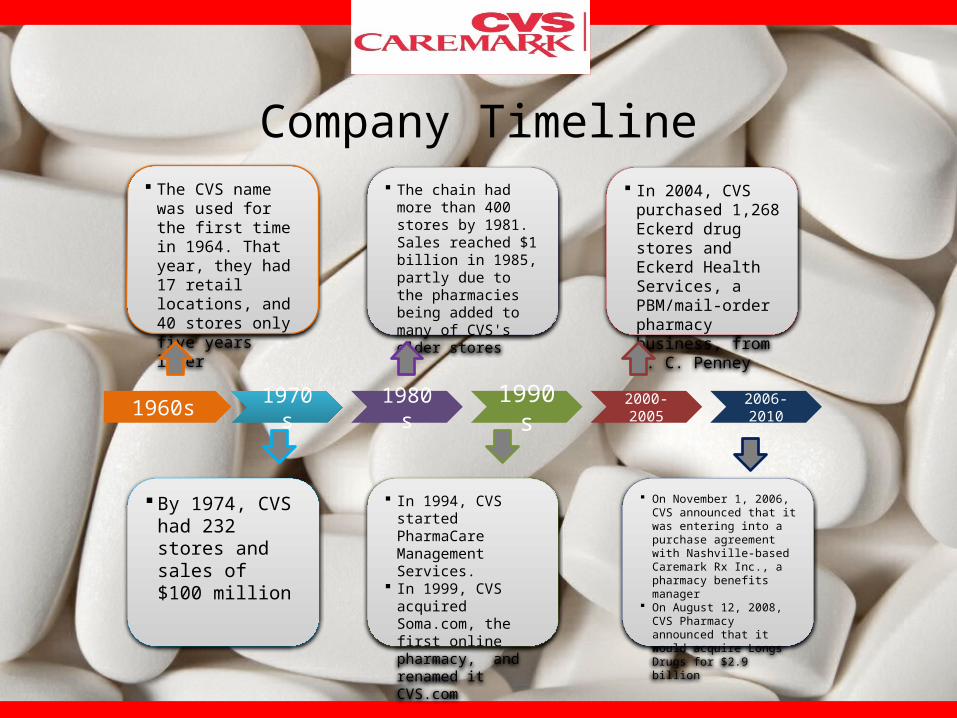
Company Timeline
1960s 1970s 1980s 1990s 2000-2005
2006-2010
The CVS name was used for the first time in 1964. That year, they had 17 retail locations, and 40 stores only five years later
By 1974, CVS had 232 stores and sales of $100 million
The chain had more than 400 stores by 1981. Sales reached $1 billion in 1985, partly due to the pharmacies being added to many of CVS's older stores
In 1994, CVS started PharmaCare Management Services.
In 1999, CVS acquired Soma.com, the first online pharmacy, and renamed it CVS.com
In 2004, CVS purchased 1,268 Eckerd drug stores and Eckerd Health Services, a PBM/mail-order pharmacy business, from J. C. Penney
On November 1, 2006, CVS announced that it was entering into a purchase agreement with Nashville-based Caremark Rx Inc., a pharmacy benefits manager
On August 12, 2008, CVS Pharmacy announced that it would acquire Longs Drugs for $2.9 billion
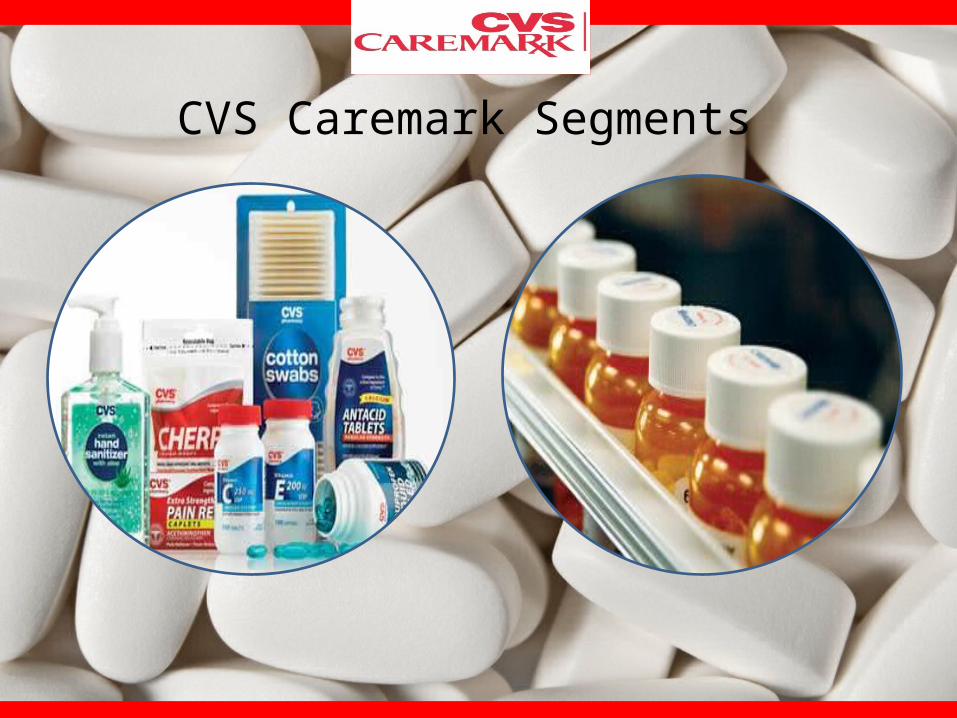
CVS Caremark Segments

Figure 11: 2010 CVS Caremark Retail Segment Revenue Break Down
2010 CVS Caremark Retail Segment Revenue
Break Down
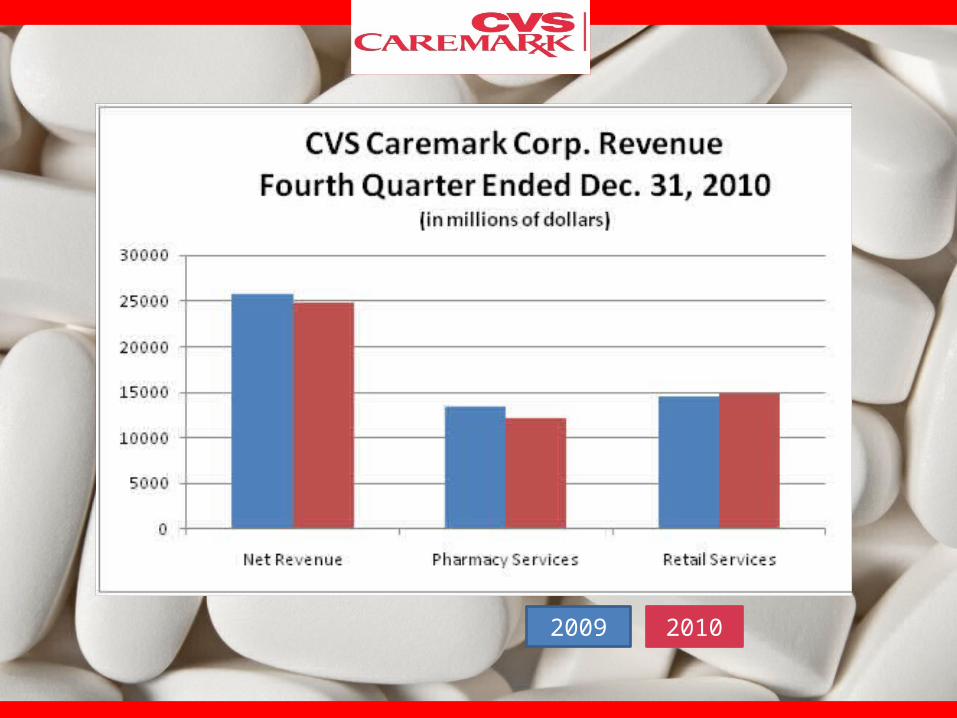
2009 2010
Existing Vision Statement
We strive to improve the
quality of human life.
Existing Mission Statement
We provide expert care and innovative solutions in pharmacy and health care that are effective
and easy for our customers.
Existing Strategies
• Use Minute Clinic locations and Specialty pharmacy division to lower cost while improving the health of those we serve
• Increase CVS Caremark leadership in and contribution to the areas of pharmacy services and healthcare
Proposed Vision Statement
CVS Caremark’s vision is to improve the quality of life through convenient
and cost efficient offerings.
Proposed Mission Statement At CVS Caremark our mission is to provide quality products and services through our pharmaceuticals
and consumer products (2). We strive to be the number one provider in the United States (3) by
investing not only in our company (5) and technological advances (4) but also in the communities in which we serve (8). Whether our customers are new
to this world our are veterans, (1) we know that our company can provide them with the newest and most effective products and services, while promoting the healthy communities in which they live. Through our valued employees (9), CVS is able to provide quality
services and quality products (7).
External Analysis

Operating Expenses as a % of Revenue
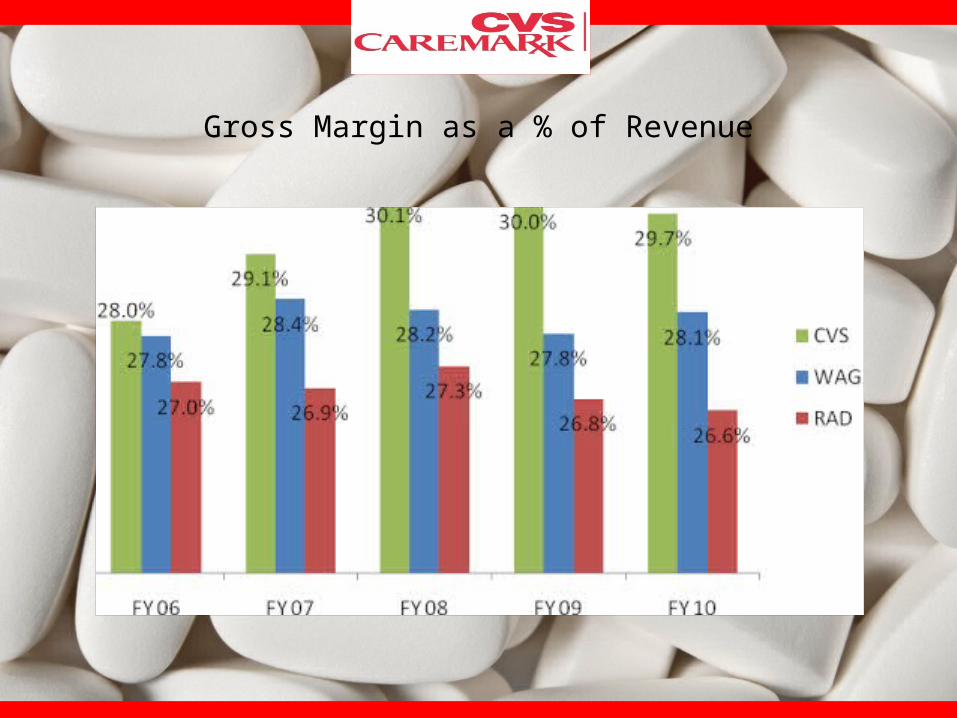
Gross Margin as a % of Revenue

Competitive Analysis

U.S Pharmacies 2010
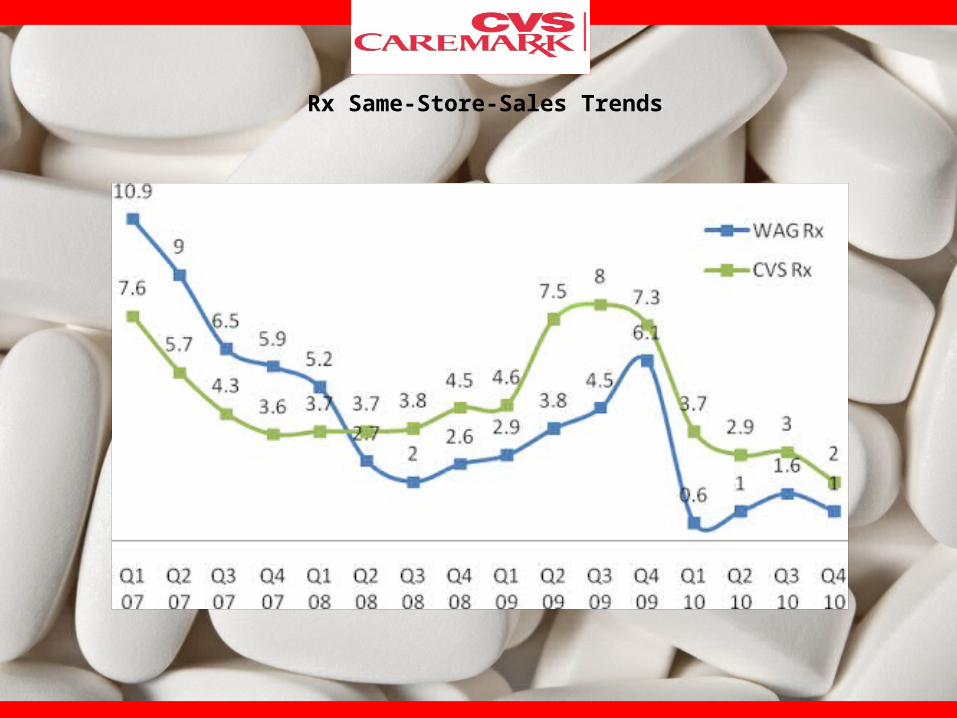
Rx Same-Store-Sales Trends
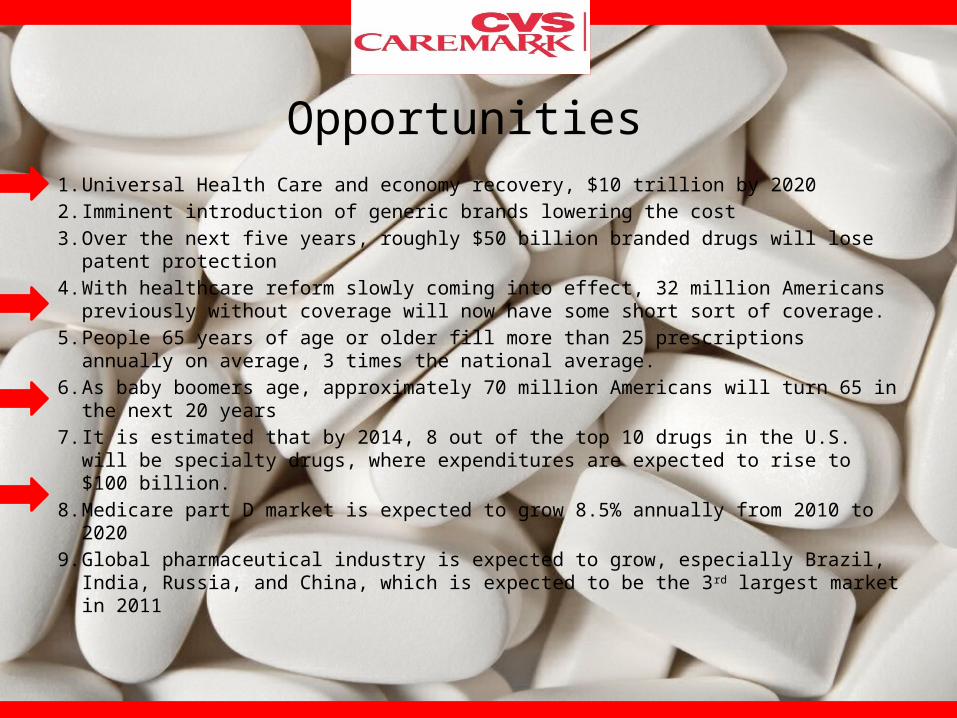
Opportunities 1. Universal Health Care and economy recovery, $10 trillion by 20202. Imminent introduction of generic brands lowering the cost 3. Over the next five years, roughly $50 billion branded drugs will lose patent
protection4. With healthcare reform slowly coming into effect, 32 million Americans
previously without coverage will now have some short sort of coverage. 5. People 65 years of age or older fill more than 25 prescriptions annually on
average, 3 times the national average.6. As baby boomers age, approximately 70 million Americans will turn 65 in the
next 20 years7. It is estimated that by 2014, 8 out of the top 10 drugs in the U.S. will be
specialty drugs, where expenditures are expected to rise to $100 billion.8. Medicare part D market is expected to grow 8.5% annually from 2010 to 20209. Global pharmaceutical industry is expected to grow, especially Brazil, India,
Russia, and China, which is expected to be the 3rd largest market in 2011

Threats 1. It is estimated that there could be a dearth of 200,000 healthcare professionals
and 800,000 nurses by 20202. Potential government intervention in health care after election in 20123. Imminent introduction of generic brands lowering the margin4. CVS’ is behind Wal-Mart by nearly $140 billion in market cap.5. CVS’ additional competitor Walgreens is behind them by a market cap of roughly
$10 billion.6. Walgreens increased the number of prescriptions filled in 2010 by 7.5% ,
whereas ours decreased.7. In the next 5 years, 9 out of the top 10 best-selling drugs in the world will go off
patent, resulting in an expected loss of sales8. Extensive regulation has increased the time from drug discovery to approval
from 6 years in the 1970s to 13.5 years in the 2000s.9. Pharmaceutical companies struggle to develop new drugs as R&D costs become
high, on average between $4 billion to $11 billion per drug
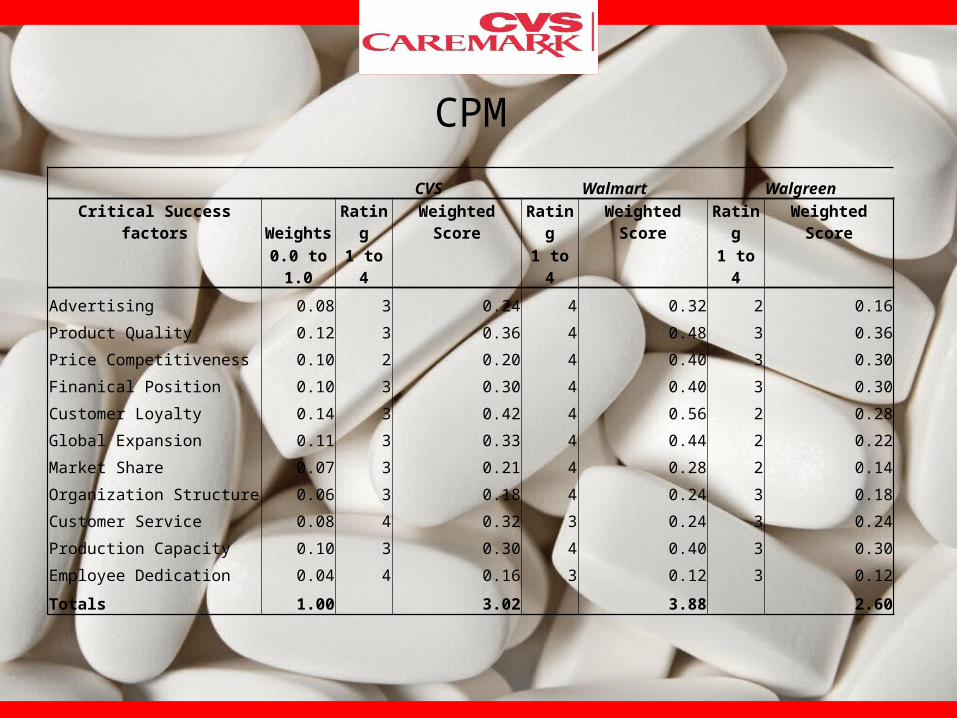
CVS Walmart Walgreen
Critical Success factors Weights Rating Weighted Score Rating Weighted Score Rating Weighted Score
0.0 to 1.0 1 to 4 1 to 4 1 to 4
Advertising 0.08 3 0.24 4 0.32 2 0.16
Product Quality 0.12 3 0.36 4 0.48 3 0.36
Price Competitiveness 0.10 2 0.20 4 0.40 3 0.30
Finanical Position 0.10 3 0.30 4 0.40 3 0.30
Customer Loyalty 0.14 3 0.42 4 0.56 2 0.28
Global Expansion 0.11 3 0.33 4 0.44 2 0.22
Market Share 0.07 3 0.21 4 0.28 2 0.14
Organization Structure 0.06 3 0.18 4 0.24 3 0.18
Customer Service 0.08 4 0.32 3 0.24 3 0.24
Production Capacity 0.10 3 0.30 4 0.40 3 0.30
Employee Dedication 0.04 4 0.16 3 0.12 3 0.12
Totals 1.00 3.02 3.88 2.60
CPM

Key External Factors Weights Rating Weighted Score 0.0 to 1.0 1 to 4
Opportunities
Universal Health Care and economy recovery, $10 trillion by 2020 0.06 4 0.24 Imminent introduction of generic brands lowering the cost 0.07 3 0.21
Over the next five years, roughly $50 billion branded drugs will lose patent protection 0.04 2 0.08
With healthcare reform slowly coming into effect, 32 million Americans previously without coverage will now have some sort of coverage. 0.04 2 0.08
People 65 years of age or older fill more than 25 prescriptions annually on average, 3 times the national average 0.06 2 0.12
As baby boomers age, approximately 70 million Americans will turn 65 in the next 20 years 0.06 3 0.18
It is estimated that by 2014, 8 out of the top 10 drugs in the U.S. will be specialty drugs, where expenditures are expected to rise to $100 billion 0.04 3 0.12
Medicare part D market is expected to grow 8.5% annually from 2010 to 2020 0.05 2 0.1
Global pharmaceutical industry is expected to grow, especially Brazil, India, Russia, and China, which is expected to be the 3rd largest market in 2011 0.05 3 0.15Threats 0It is estimated that there could be a dearth of 200,000 healthcare professionals and 800,000 nurses by 2020 0.04 3 0.12
Potential government intervention in health care after election in 2012 0.06 2 0.12Imminent introduction of generic brands lowering the margin 0.06 2 0.12
CVS’ is behind Wal-Mart by nearly $140 billion in market cap 0.07 3 0.21
CVS’ additional competitor Walgreens is behind them by a market cap of roughly $10 billion 0.07 4 0.28
Walgreens increased the number of prescriptions filed in 2010 by 7.5% , whereas ours decreased 0.05 2 0.1
In the next 5 years, 9 out of the top 10 best-selling drugs in the world will go off patent, resulting in an expected loss of sales 0.04 2 0.08
Extensive regulation has increased the time from drug discovery to approval from 6 years in the 1970s to 13.5 years in the 2000s 0.05 4 0.2
Pharmaceutical companies struggle to develop new drugs as R&D costs become high, on average between $4 billion to $11 billion per drug 0.09 4 0.36Totals 1 2.87
EFE
Internal Analysis

Organizational ChartTHOMAS M. RYANChairman of the Board and
Chief Executive Officer
LARRY J. MERLOPresident and Chief Operating
Officer
TROYEN A. BRENNAN, M.D.Executive Vice President andChief Medical
Officer
DAVID M. DENTONExecutive Vice President andChief Financial
Officer
HELENA B. FOULKESExecutive Vice President andChief Marketing
Officer
PER G.H. LOFBERGExecutive Vice President and President– Caremark Pharmacy
Services
JONATHAN C. ROBERTSExecutive Vice President andChief Operating Officer – CaremarkPharmacy Services
DOUGLAS A. SGARROExecutive Vice President andChief Legal Officer
LISA G. BISACCIASenior Vice President andChief Human Resources
Officer
NANCY R. CHRISTALSenior Vice President – Investor
Relations
LAIRD K. DANIELSSenior Vice President – Finance andController and Chief Accounting
Officer
CAROL A. DENALESenior Vice President andCorporate
Treasurer
SARA J. FINLEYSenior Vice President and General
Counsel
STUART M. MCGUIGANSenior Vice President andChief Information
Officer
EVP; President, Caremark Pharmacy Services
EVP Internal Operations, Real Estate, Retail Field,
Organizations

CVS Worth Analysis for 2010 (in millions)
Shareholder's equity - Goodwill - Intangibles 2,281
Net Income * 5 17,120
(Stock Price/EPS) * NI 45,726
# of Shares Out * Stock Price 45,822
Four Method Average 27,737
CVS Worth Analysis

Income Statement

Balance Sheet
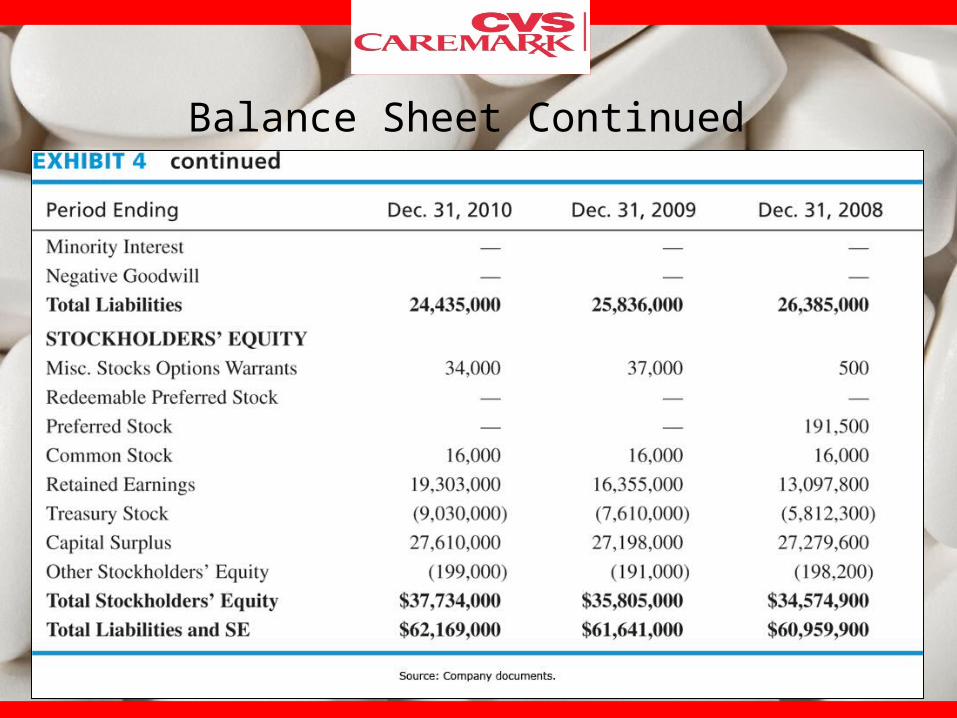
Balance Sheet Continued
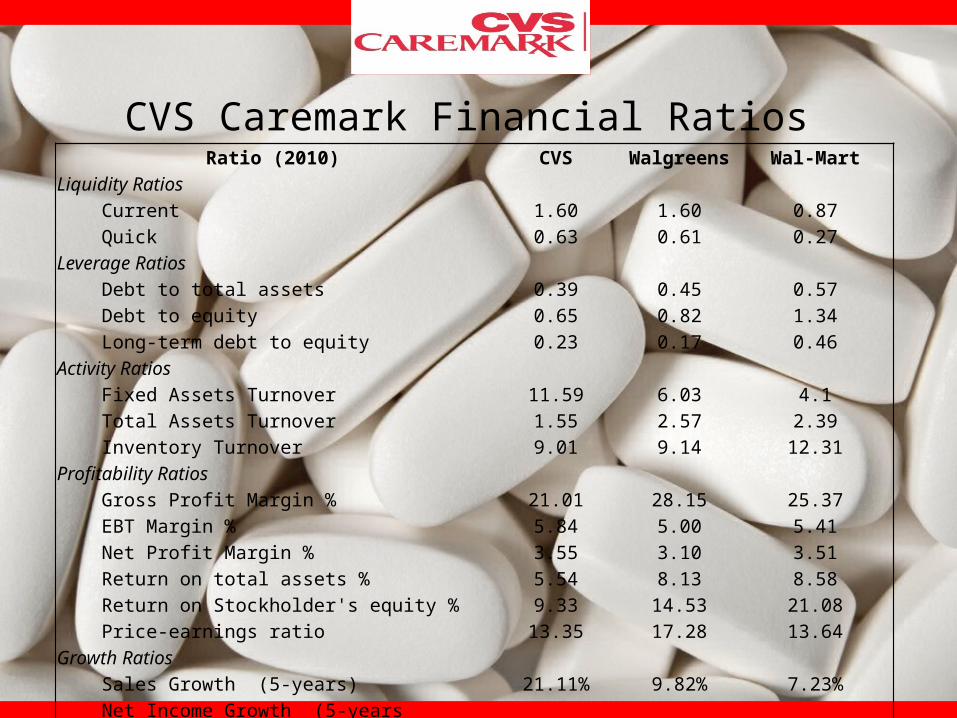
Ratio (2010) CVS Walgreens Wal-MartLiquidity Ratios Current 1.60 1.60 0.87 Quick 0.63 0.61 0.27Leverage Ratios Debt to total assets 0.39 0.45 0.57 Debt to equity 0.65 0.82 1.34 Long-term debt to equity 0.23 0.17 0.46Activity Ratios Fixed Assets Turnover 11.59 6.03 4.1 Total Assets Turnover 1.55 2.57 2.39 Inventory Turnover 9.01 9.14 12.31Profitability Ratios Gross Profit Margin % 21.01 28.15 25.37 EBT Margin % 5.84 5.00 5.41 Net Profit Margin % 3.55 3.10 3.51 Return on total assets % 5.54 8.13 8.58 Return on Stockholder's equity % 9.33 14.53 21.08 Price-earnings ratio 13.35 17.28 13.64Growth Ratios Sales Growth (5-years) 21.11% 9.82% 7.23% Net Income Growth (5-years Average) 22.85% 6.04% 6.90%
Earnings per share Growth (5-year Average) 11.42% 6.88% 8.95%
CVS Caremark Financial Ratios
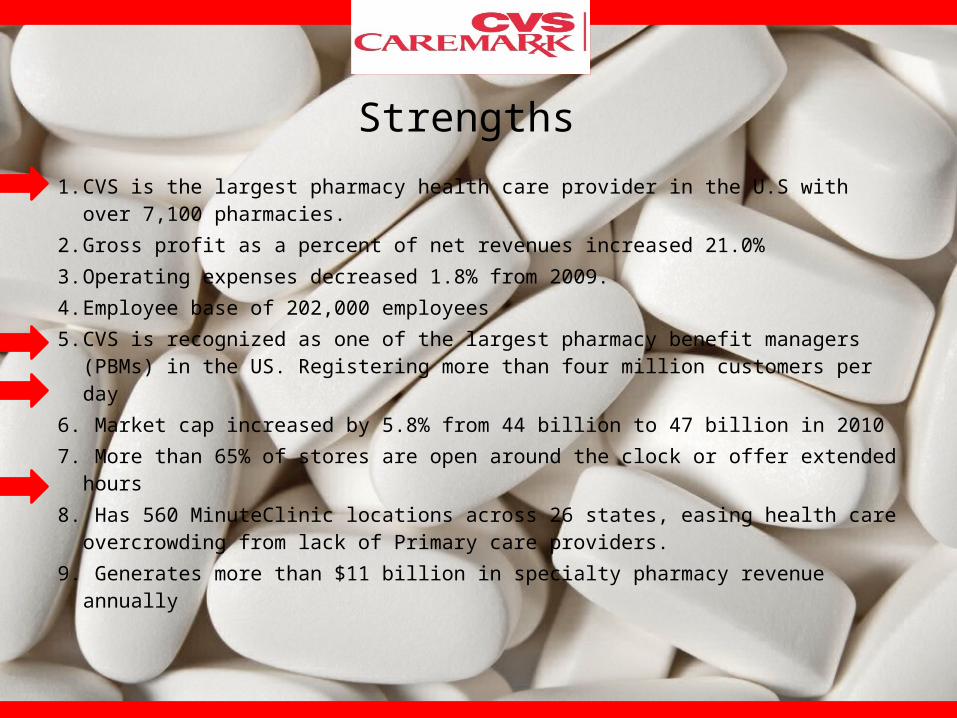
Strengths 1. CVS is the largest pharmacy health care provider in the U.S with over
7,100 pharmacies. 2. Gross profit as a percent of net revenues increased 21.0%3. Operating expenses decreased 1.8% from 2009.4. Employee base of 202,000 employees5. CVS is recognized as one of the largest pharmacy benefit managers
(PBMs) in the US. Registering more than four million customers per day6. Market cap increased by 5.8% from 44 billion to 47 billion in 20107. More than 65% of stores are open around the clock or offer extended
hours8. Has 560 MinuteClinic locations across 26 states, easing health care
overcrowding from lack of Primary care providers. 9. Generates more than $11 billion in specialty pharmacy revenue annually
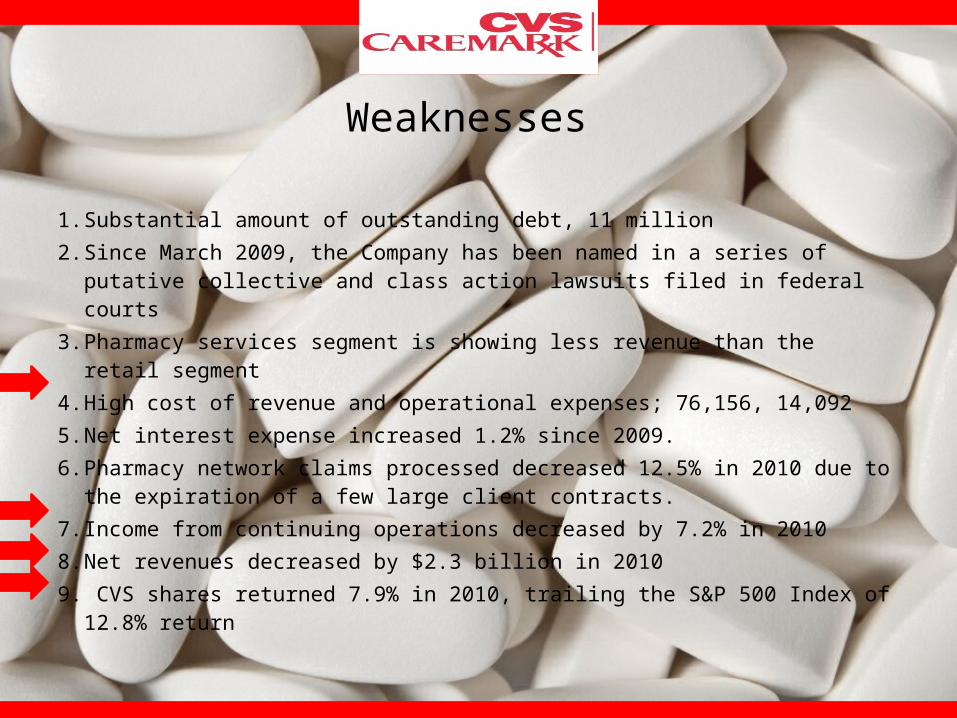
Weaknesses 1. Substantial amount of outstanding debt, 11 million2. Since March 2009, the Company has been named in a series of putative
collective and class action lawsuits filed in federal courts3. Pharmacy services segment is showing less revenue than the retail segment4. High cost of revenue and operational expenses; 76,156, 14,0925. Net interest expense increased 1.2% since 2009.6. Pharmacy network claims processed decreased 12.5% in 2010 due to the
expiration of a few large client contracts. 7. Income from continuing operations decreased by 7.2% in 20108. Net revenues decreased by $2.3 billion in 20109. CVS shares returned 7.9% in 2010, trailing the S&P 500 Index of 12.8%
return
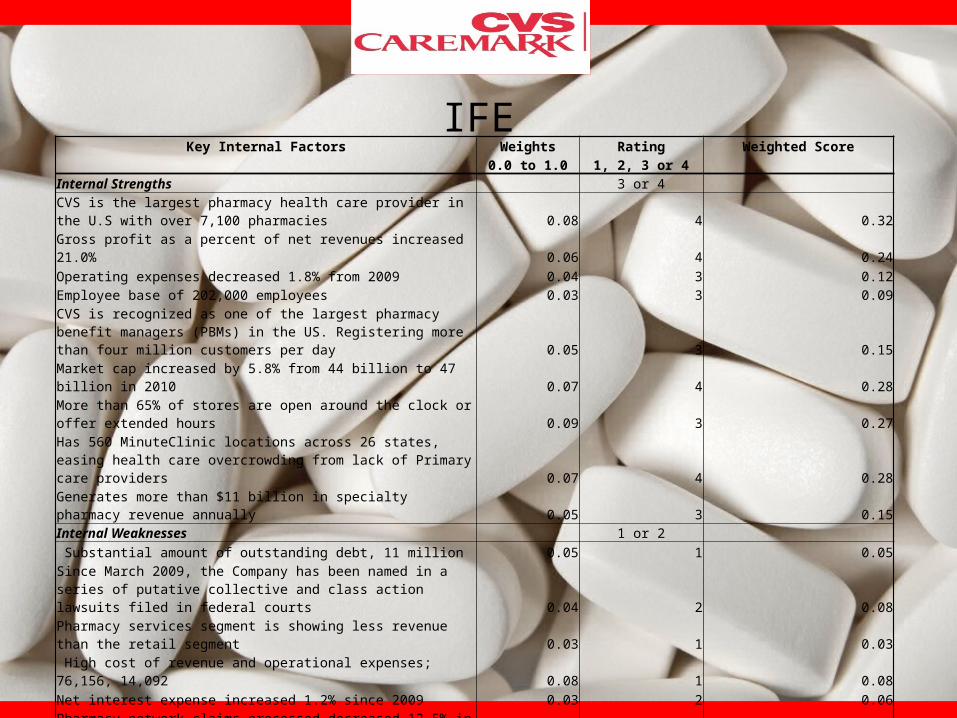
Key Internal Factors Weights Rating Weighted Score 0.0 to 1.0 1, 2, 3 or 4
Internal Strengths 3 or 4 CVS is the largest pharmacy health care provider in the U.S with over 7,100 pharmacies 0.08 4 0.32
Gross profit as a percent of net revenues increased 21.0% 0.06 4 0.24
Operating expenses decreased 1.8% from 2009 0.04 3 0.12Employee base of 202,000 employees 0.03 3 0.09
CVS is recognized as one of the largest pharmacy benefit managers (PBMs) in the US. Registering more than four million customers per day 0.05 3 0.15
Market cap increased by 5.8% from 44 billion to 47 billion in 2010 0.07 4 0.28
More than 65% of stores are open around the clock or offer extended hours 0.09 3 0.27Has 560 MinuteClinic locations across 26 states, easing health care overcrowding from lack of Primary care providers 0.07 4 0.28
Generates more than $11 billion in specialty pharmacy revenue annually 0.05 3 0.15Internal Weaknesses 1 or 2
Substantial amount of outstanding debt, 11 million 0.05 1 0.05Since March 2009, the Company has been named in a series of putative collective and class action lawsuits filed in federal courts 0.04 2 0.08
Pharmacy services segment is showing less revenue than the retail segment 0.03 1 0.03
High cost of revenue and operational expenses; 76,156, 14,092 0.08 1 0.08
Net interest expense increased 1.2% since 2009 0.03 2 0.06Pharmacy network claims processed decreased 12.5% in 2010 due to the expiration of a few large client contracts. 0.04 1 0.04
Income from continuing operations decreased by 7.2% in 2010 0.03 1 0.03
Net revenues decreased by $2.3 billion in 2010 0.04 2 0.08
CVS shares returned 7.9% in 2010, trailing the S&P 500 Index of 12.8% return 0.03 2 0.06Totals 1 2.64
IFE

Strategy Formulation
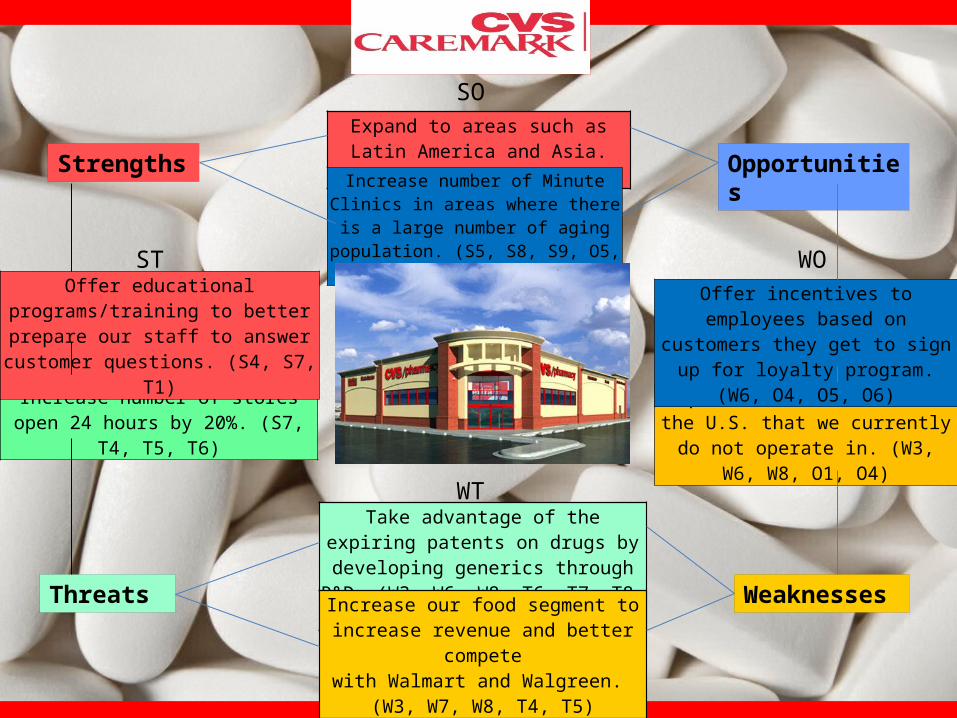
Expand to areas such as Latin America and Asia. (S4, S6, O2, O3, O9)
Increase number of Minute Clinics in areas where there is a large number of
aging population. (S5, S8, S9, O5, O6, O8)
Increase number of stores open 24 hours by 20%. (S7, T4, T5, T6)
Offer educational programs/training to better prepare our staff to answer customer questions. (S4, S7, T1)
Expand to states/areas in the U.S. that we currently do not operate in. (W3,
W6, W8, O1, O4)
Offer incentives to employees based on customers they get to sign up for loyalty program. (W6, O4, O5, O6)
Take advantage of the expiring patents on drugs by developing generics through
R&D. (W3, W6, W8, T6, T7, T8, T9)
Increase our food segment to increase revenue and better compete
with Walmart and Walgreen. (W3, W7, W8, T4, T5)
Strengths
Threats
Opportunities
Weaknesses
SO
ST
WT
WO

FS
CS
ES
IS-1-2-3-4-5-6 654321
Conservative Aggressive
CompetitiveDefensive
1
2
3
4
5
6
-6
-5
-4
-3
-2
-1
Financial Strengthrating is 1 (worst) to 7 (best)
1 Cash Flow 4.02 Price Earnings Ratio 4.03 Earnings per Share 5.04 Working Capital 3.05 Liquidity 2.06 Net Income 5.07 Return on Assets 3.0
Industry Strength
rating is 1 (worst) to 7 (best) Total
1 Profit Potential 5.02 Financial Stability 6.03 Resource Utilization 5.04 Productivity, capacity utilization 5.05 Market Entry 2.06 Growth Potential 4.07 Extent Leveraged 2.0
Environmental Stability
IS Total 29.0
1 Rate of Inflation -4.02 Barriers to Enter the Market -3.03 Competitive Pressure -2.04 Price Elasticity -4.05 Demand Variability -1.06 Price Range of Competing Products -4.07 Ease of Exit from Market -2.0
Competitive advantage
rating is -1 (best) to -7 (worst)
ES Total
-20.
01 Market Share 1.02 Product Quality 1.03 Customer Loyalty 2.04 Capacity Utilization 4.05 Technologically Advanced 3.06 Global Expansion 7.07 Product Life Cycle 5.0
X Coordinate 0.86Y Coordinate 0.86
Space Matrix
Rapid Market Growth
Weak Competitve
Position
Strong Competitive Position
Slow Market Growth
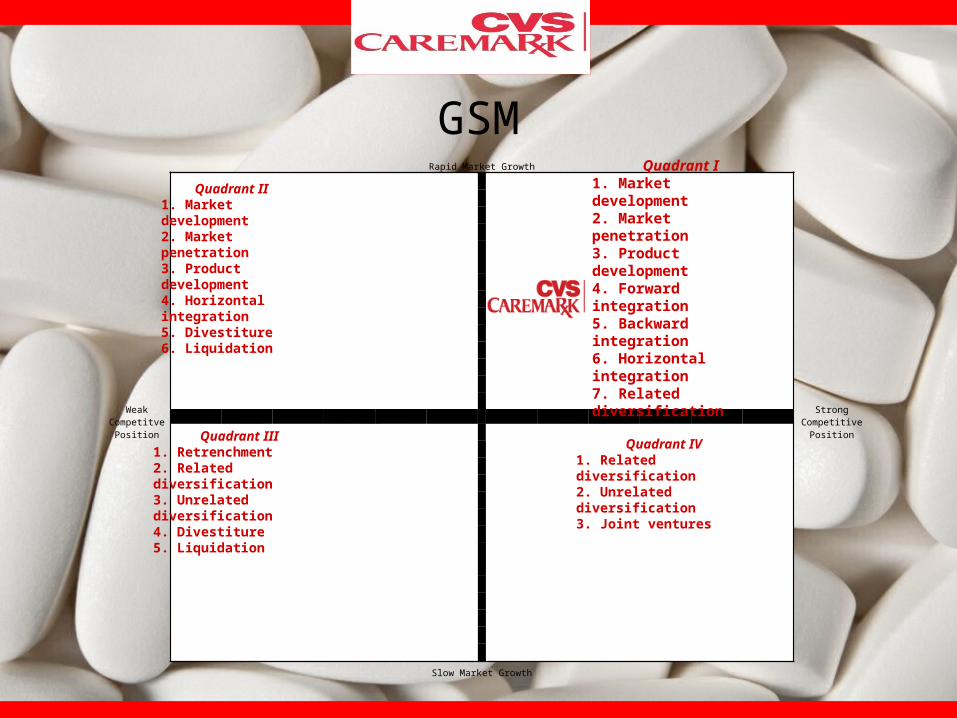
Quadrant II1. Market development2. Market penetration3. Product development4. Horizontal integration5. Divestiture6. Liquidation
Quadrant III1. Retrenchment2. Related diversification3. Unrelated diversification4. Divestiture5. Liquidation
Quadrant IV1. Related diversification2. Unrelated diversification3. Joint ventures
Quadrant I1. Market development2. Market penetration3. Product development4. Forward integration5. Backward integration6. Horizontal integration7. Related diversification
GSM
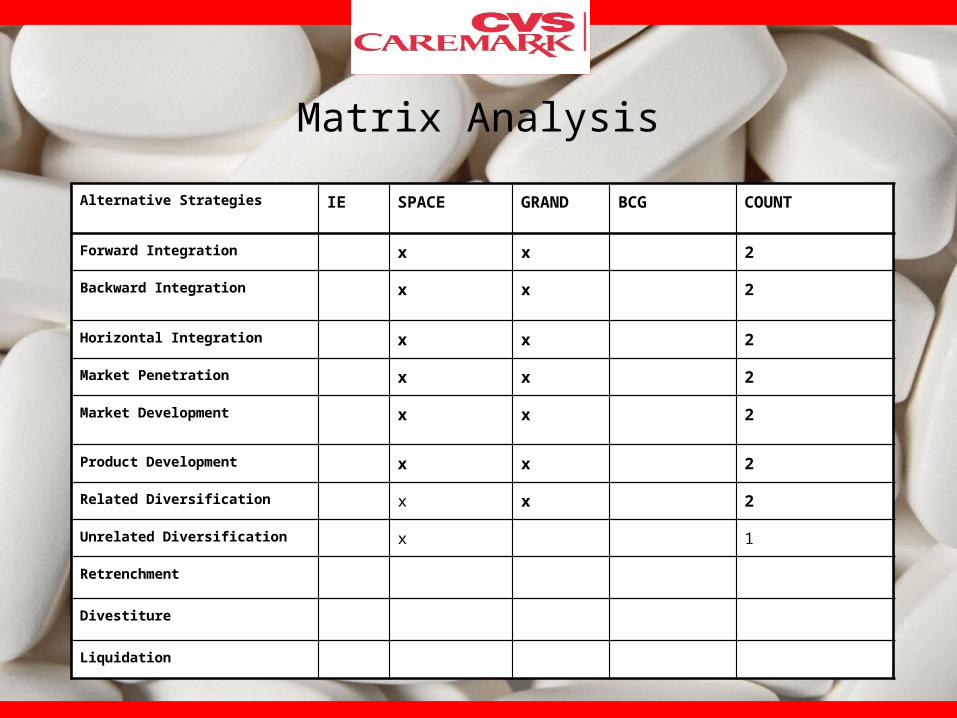
Alternative Strategies IE SPACE GRAND BCG COUNT
Forward Integration x x 2
Backward Integration x x 2
Horizontal Integration x x 2
Market Penetration x x 2
Market Development x x 2
Product Development x x 2
Related Diversification x x 2
Unrelated Diversification x 1
Retrenchment
Divestiture
Liquidation
Matrix Analysis
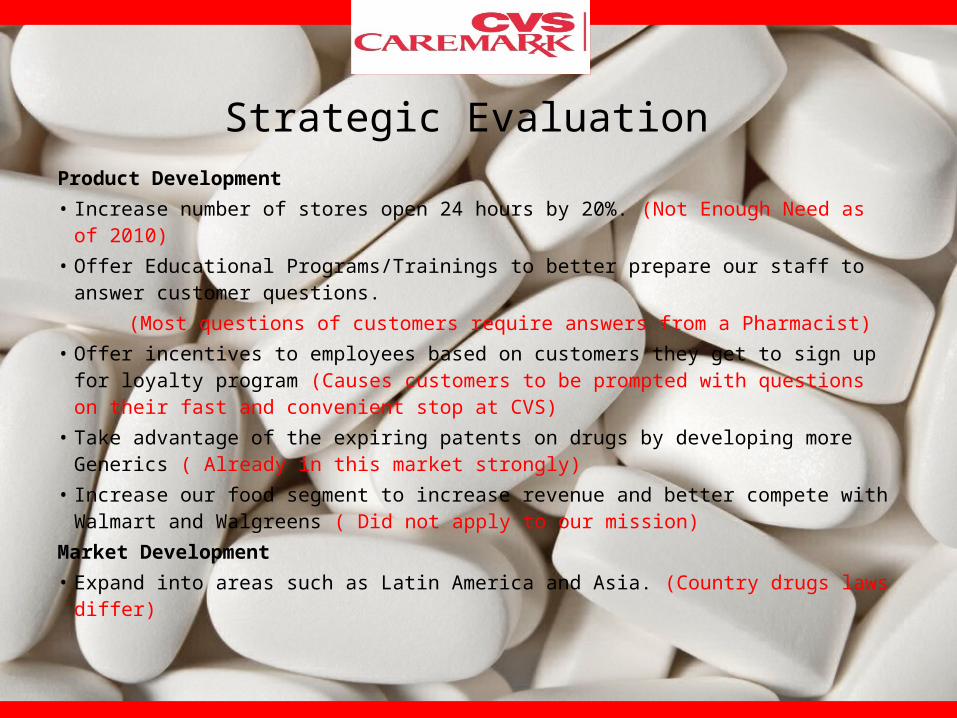
Strategic Evaluation Product Development • Increase number of stores open 24 hours by 20%. (Not Enough Need as of 2010)• Offer Educational Programs/Trainings to better prepare our staff to answer
customer questions. (Most questions of customers require answers from a Pharmacist)• Offer incentives to employees based on customers they get to sign up for loyalty
program (Causes customers to be prompted with questions on their fast and convenient stop at CVS)
• Take advantage of the expiring patents on drugs by developing more Generics ( Already in this market strongly)
• Increase our food segment to increase revenue and better compete with Walmart and Walgreens ( Did not apply to our mission)
Market Development• Expand into areas such as Latin America and Asia. (Country drugs laws differ)
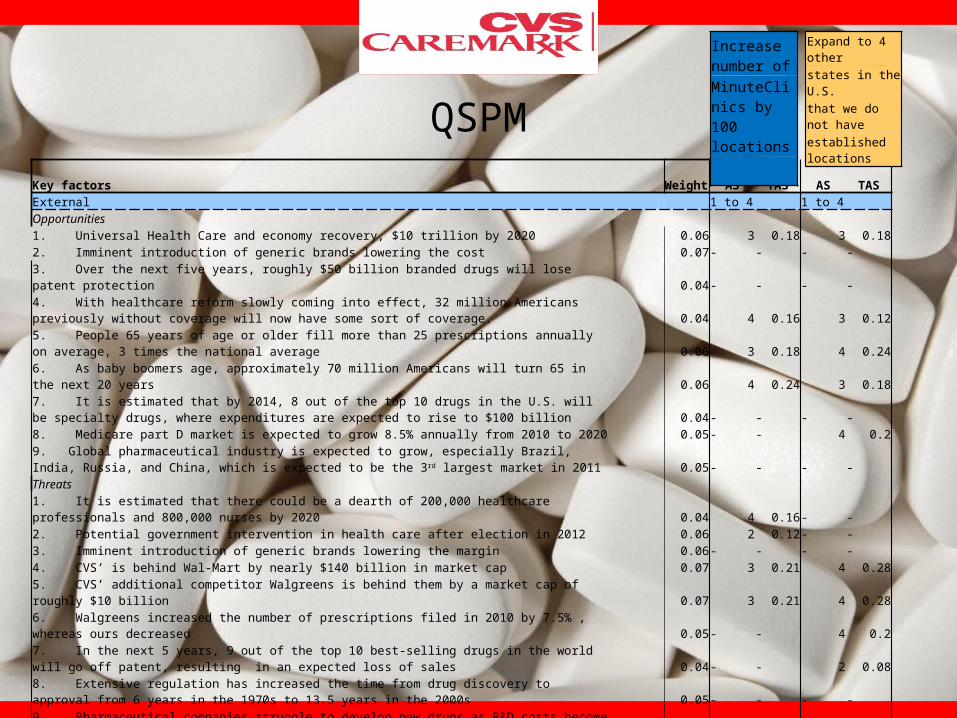
Key factors Weight AS TAS AS TASExternal 1 to 4 1 to 4 Opportunities 1. Universal Health Care and economy recovery, $10 trillion by 2020 0.06 3 0.18 3 0.182. Imminent introduction of generic brands lowering the cost 0.07- - - -3. Over the next five years, roughly $50 billion branded drugs will lose patent protection 0.04- - - -4. With healthcare reform slowly coming into effect, 32 million Americans previously without coverage will now have some sort of coverage. 0.04 4 0.16 3 0.125. People 65 years of age or older fill more than 25 prescriptions annually on average, 3 times the national average 0.06 3 0.18 4 0.246. As baby boomers age, approximately 70 million Americans will turn 65 in the next 20 years 0.06 4 0.24 3 0.187. It is estimated that by 2014, 8 out of the top 10 drugs in the U.S. will be specialty drugs, where expenditures are expected to rise to $100 billion 0.04- - - -8. Medicare part D market is expected to grow 8.5% annually from 2010 to 2020 0.05- - 4 0.29. Global pharmaceutical industry is expected to grow, especially Brazil, India, Russia, and China, which is expected to be the 3rd largest market in 2011 0.05- - - -Threats 1. It is estimated that there could be a dearth of 200,000 healthcare professionals and 800,000 nurses by 2020 0.04 4 0.16- -2. Potential government intervention in health care after election in 2012 0.06 2 0.12- -3. Imminent introduction of generic brands lowering the margin 0.06- - - -4. CVS’ is behind Wal-Mart by nearly $140 billion in market cap 0.07 3 0.21 4 0.285. CVS’ additional competitor Walgreens is behind them by a market cap of roughly $10 billion 0.07 3 0.21 4 0.286. Walgreens increased the number of prescriptions filed in 2010 by 7.5% , whereas ours decreased 0.05- - 4 0.27. In the next 5 years, 9 out of the top 10 best-selling drugs in the world will go off patent, resulting in an expected loss of sales 0.04- - 2 0.088. Extensive regulation has increased the time from drug discovery to approval from 6 years in the 1970s to 13.5 years in the 2000s 0.05- - - -9. Pharmaceutical companies struggle to develop new drugs as R&D costs become high, on average between $4 billion to $11 billion per drug 0.09- - - -
total should be 1.0 1
QSPM
Increase number of MinuteClinics by 100 locations
Expand to 4 other
states in the U.S.
that we do not have
established locations

Strengths 1. CVS is the largest pharmacy health care provider in the U.S with over 7,100 pharmacies 0.08 3 0.24 4 0.322. Gross profit as a percent of net revenues increased 21.0% 0.06 3 0.18 4 0.243. Operating expenses decreased 1.8% from 2009 0.04 0 04. Employee base of 202,000 employees 0.03 4 0.12 3 0.095. CVS is recognized as one of the largest pharmacy benefit managers (PBMs) in the US. Registering more than four million customers per day 0.05 4 0.2 3 0.156. Market cap increased by 5.8% from 44 billion to 47 billion in 2010 0.07- - - -7. More than 65% of stores are open around the clock or offer extended hours 0.09 4 0.36 3 0.278. Has 560 MinuteClinic locations across 26 states, easing health care overcrowding from lack of Primary care providers 0.07 4 0.28- -9. Generates more than $11 billion in specialty pharmacy revenue annually 0.05- - 3 0.15Weaknesses 1. Substantial amount of outstanding debt, 11 million 0.05 4 0.2 3 0.152. Since March 2009, the Company has been named in a series of putative collective and class action lawsuits filed in federal courts 0.04- - - -3. Pharmacy services segment is showing less revenue than the retail segment 0.03- - 1 0.034. High cost of revenue and operational expenses; 76,156, 14,092 0.08- - - -5. Net interest expense increased 1.2% since 2009 0.03 2 0.06- -6. Pharmacy network claims processed decreased 12.5% in 2010 due to the expiration of a few large client contracts. 0.04- - 2-7. Income from continuing operations decreased by 7.2% in 2010 0.03 3 0.09- -8. Net revenues decreased by $2.3 billion in 2010 0.04 4 0.16 2 0.089. CVS shares returned 7.9% in 2010, trailing the S&P 500 Index of 12.8% return 0.03- - - -
3.35
3.24
Increase number of MinuteClinics by 100 locations
Expand to 4 other
states in the U.S.
that we do not have
established locations
QSPM Continued
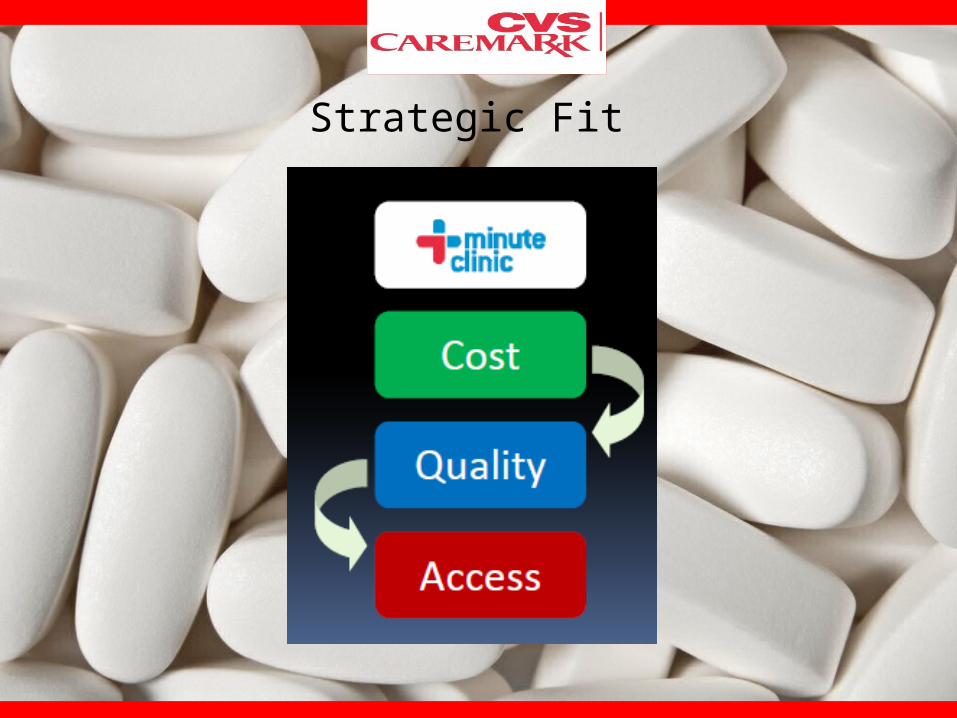
Strategic Fit
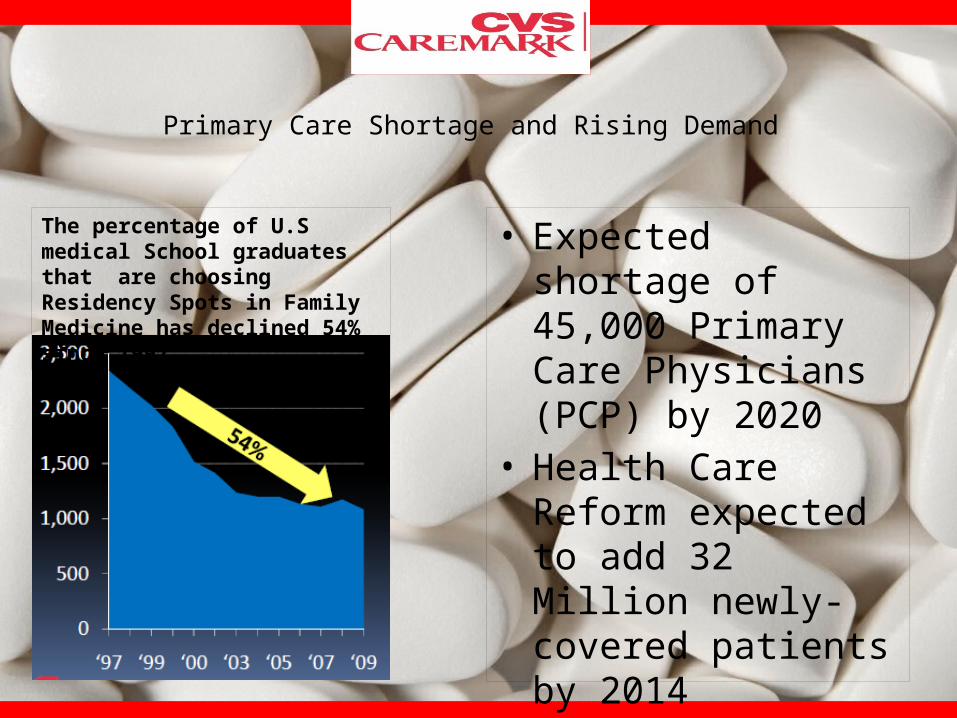
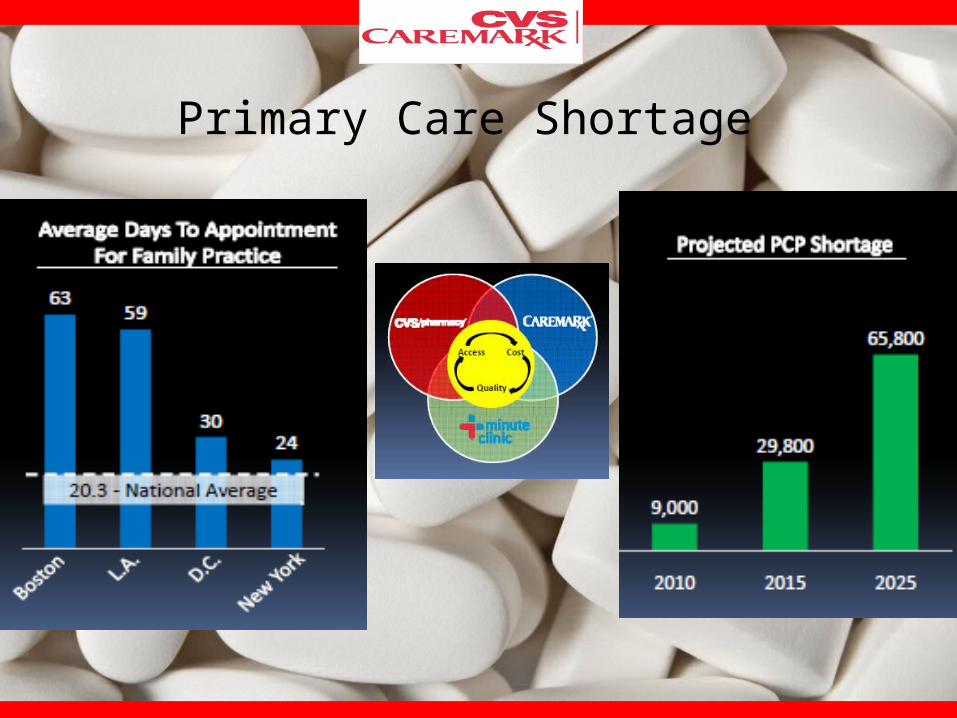
Primary Care Shortage and Rising Demand
• Expected shortage of 45,000 Primary Care Physicians (PCP) by 2020
• Health Care Reform expected to add 32 Million newly-covered patients by 2014
The percentage of U.S medical School graduates that are choosing Residency Spots in Family Medicine has declined 54% since 1997
Primary Care Shortage

MinuteClinic Revenue Growth from 2007 to 2010

Lower total Healthcare costs for Person who used MinuteClinic
MinuteClinic User vs. Non User 2010

2010 MinuteClinic Overview
• Largest Retail Clinic Provider
• Health Care/Retail Leadership
• 9 Million Visits since inception
• 50% of Population Reports for no current physician

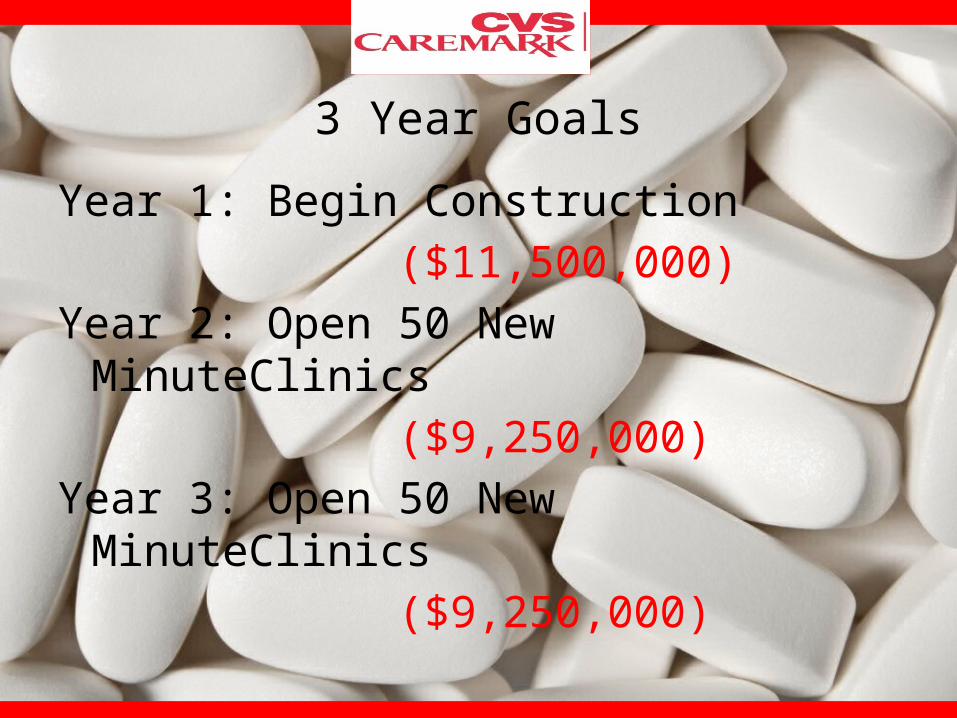
3 Year Goals
Year 1: Begin Construction ($11,500,000)Year 2: Open 50 New MinuteClinics ($9,250,000)Year 3: Open 50 New MinuteClinics ($9,250,000)

Strategic Implementation
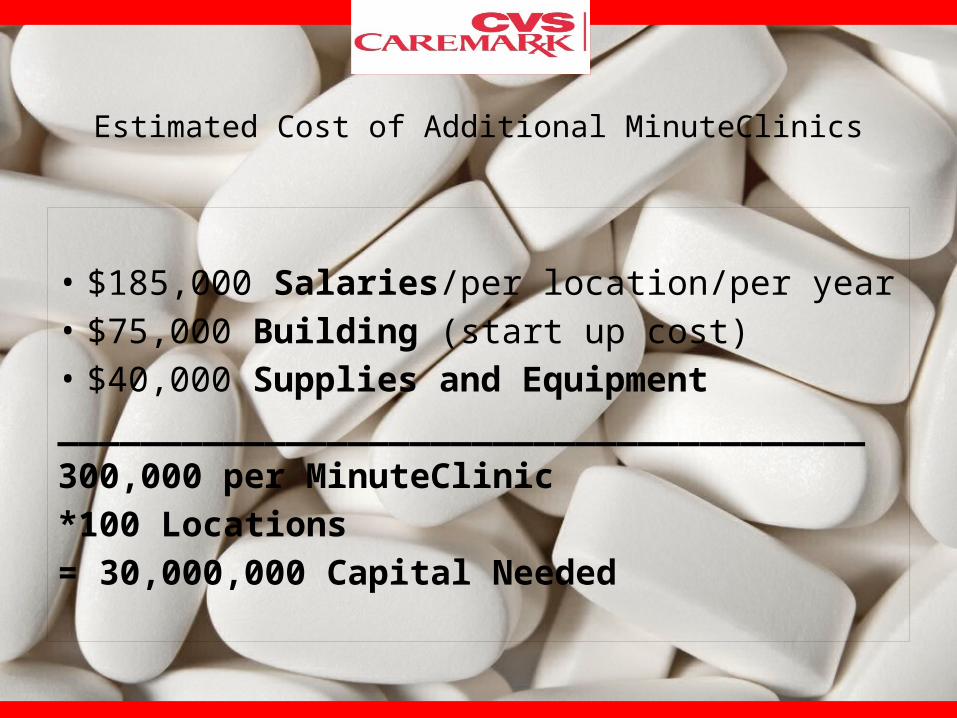
Estimated Cost of Additional MinuteClinics
• $185,000 Salaries/per location/per year • $75,000 Building (start up cost)• $40,000 Supplies and Equipment _______________________________________300,000 per MinuteClinic *100 Locations = 30,000,000 Capital Needed
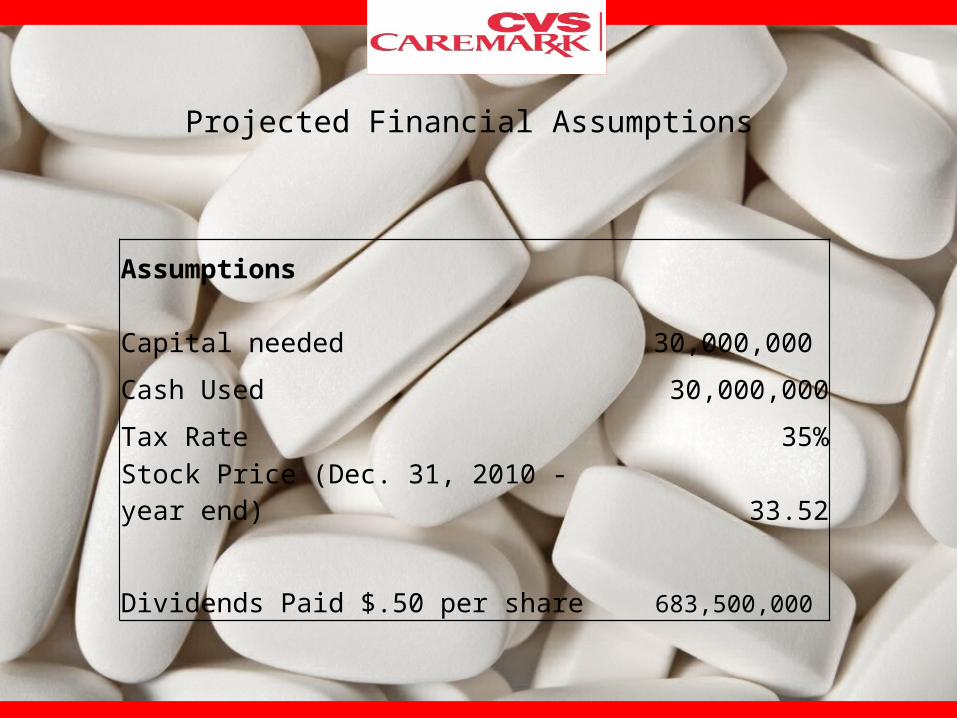
Projected Financial Assumptions
Assumptions
Capital needed 30,000,000
Cash Used 30,000,000
Tax Rate 35%
Stock Price (Dec. 31, 2010 - year end) 33.52
Dividends Paid $.50 per share 683,500,000

Projected Financials-Income Statement
Projected Income Statement (in millions) 2009 2010 2011
Total Revenue 98,729 96,413 110,874 15% increase
Cost of Revenue 78,349 76,156 88,379 % of total revenue
Gross Profit 20,380 20,257 22,495 Operating Expenses - - -
Selling, General, and Administrative 13,942 14,092 15,238 8% increase, plus $18.5 mil. In salariesOperating Income or Loss 6,438 6,165 7,257
Total Other Income/Expense - - - EBIT 5,913 5,629 7,257 Interest Expense - - - Income Before Tax 5,913 5,629 7,257 Income Tax Expense 2,205 2,190 2,540 35% tax Minority Interest - 3 3 Same
Net Income from Continuing Operations 3,708 3,439 4,720
Loss from Discontinued Operations (12) (15) (15) Same (possible store closings) Net Income 3,696 3,424 4,705 Basic EPS 2.58 2.51 3.44 Diluted EPS 2.55 2.49 3.42 Basic Average Shares Outstanding 1,434 1,367 1,367 Diluted Average Shares Outstanding 1,450 1,377 1,377 Dividends Per Share 0.305 0.35 0.50

Projected Financials-Balance Sheet (1)
Projected Balance Sheet (in millions) 2009 2010 2011 ASSETS Current Assets
Cash/Cash Equivalents 1,086
1,427
1,397 Decrease by $30 mil. For capital needed
Short-term Investments 5
4
4 Same
Net Receivables 5,963
5,436
5,653 4% increase
Inventory 10,343
10,695
11,765 10% increase
Other Assets 140
144
151 5% increase
Total Current Assets 17,537
17,706
18,970
Long-term Investments - - -
Plant, Property, and Equipment 7,923
8,322
8,750 5% increase, plus $11.5 mil. In supplies/building
Goodwill 25,680
25,669
26,657 4%increase
Intangible Assets 10,127
9,784
10,273 5% increase
Accum. Amortization - - -
Other Assets 374
688
708 3% increase
Deferred Long-term Asset - - -
Total Assets 61,641
62,169
65,358
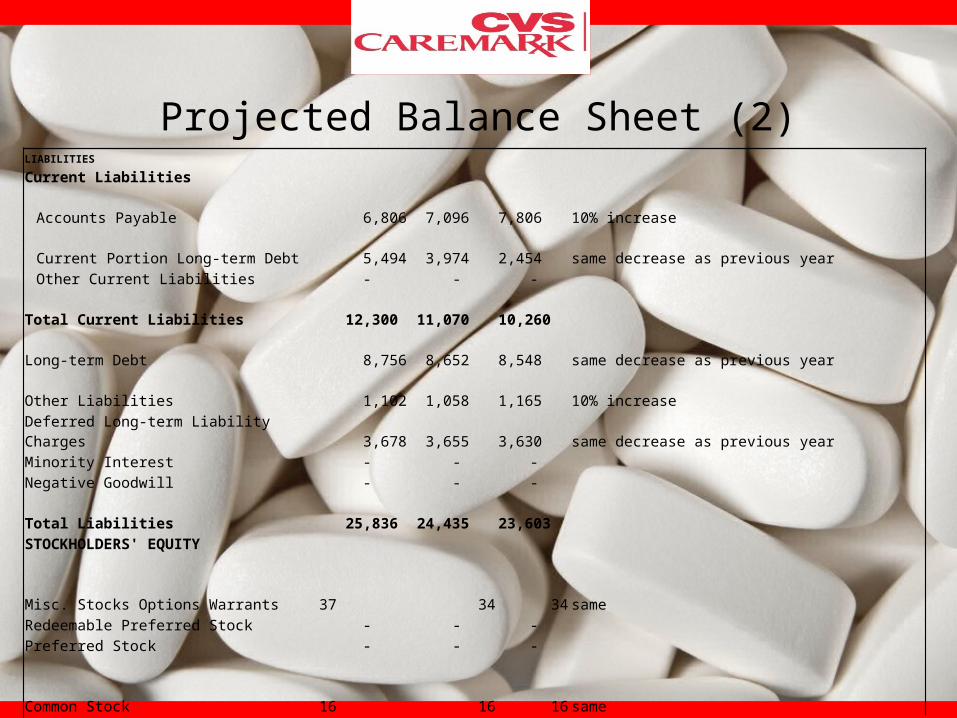
LIABILITIES
Current Liabilities
Accounts Payable 6,806 7,096 7,806 10% increase
Current Portion Long-term Debt 5,494 3,974 2,454 same decrease as previous year
Other Current Liabilities - - -
Total Current Liabilities 12,300 11,070 10,260
Long-term Debt 8,756 8,652 8,548 same decrease as previous year
Other Liabilities 1,102 1,058 1,165 10% increase
Deferred Long-term Liability Charges 3,678 3,655 3,630 same decrease as previous year
Minority Interest - - -
Negative Goodwill - - -
Total Liabilities 25,836 24,435 23,603
STOCKHOLDERS' EQUITY
Misc. Stocks Options Warrants 37 34 34 same
Redeemable Preferred Stock - - -
Preferred Stock - - -
Common Stock 16 16 16 same
Retained Earnings 16,355 19,303 23,324 Increase from net income, minus dividends paid
Treasury Stock (7,610) (9,030) (9,030) same
Capital Surplus 27,198 27,610 27,610 same
Other Stockholders' Equity (191) (199) (199) same
Total Stockholders' Equity 35,805 37,734 41,755
Total Liabilities and Stockholders' Equity 61,641 62,169 65,358
Projected Balance Sheet (2)

Project Financial Ratios
CVS's Projected Ratios 2010 v. 2011 2010 2011Current Ratio 1.60 1.85Quick Ratio 0.63 0.70Debt to Total Assets 0.39 0.36Debt to Equity 0.65 0.57Fixed Asset Turnover 11.59 12.67Total Asset Turnover 1.55 1.70Inventory Turnover 9.01 9.42Gross Profit Margin % 21.01 20.29Return on Stockholders' Equity % 9.33 11.26

Strategic Evaluation
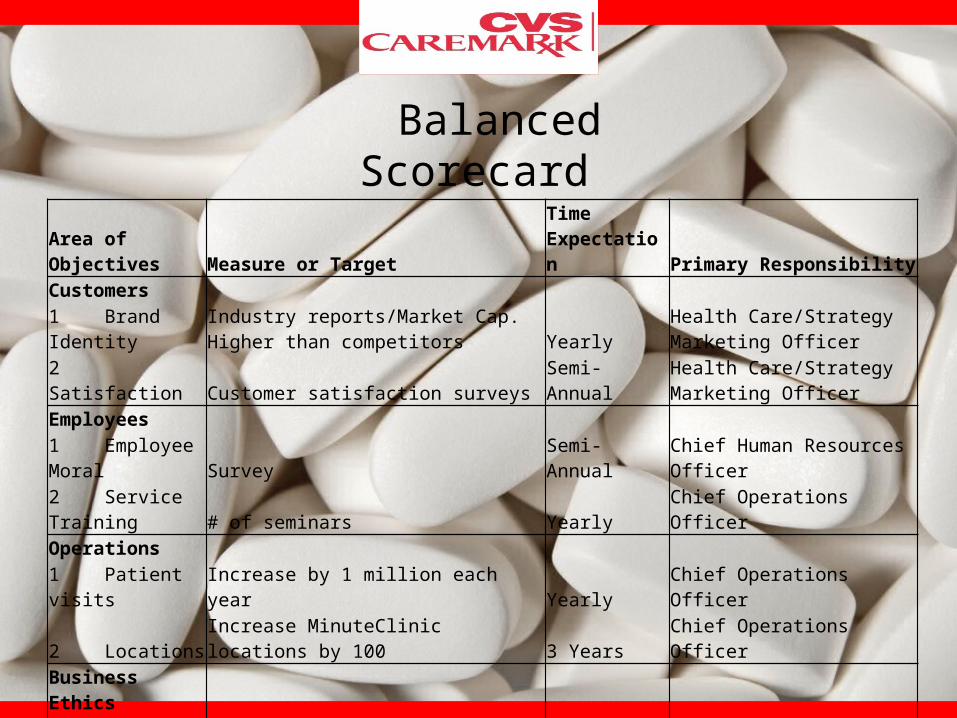
Area of Objectives Measure or TargetTime Expectation Primary Responsibility
Customers
1 Brand IdentityIndustry reports/Market Cap. Higher than competitors Yearly
Health Care/Strategy Marketing Officer
2 Satisfaction Customer satisfaction surveys Semi-AnnualHealth Care/Strategy Marketing Officer
Employees 1 Employee Moral Survey Semi-Annual Chief Human Resources Officer2 Service Training # of seminars Yearly Chief Operations OfficerOperations 1 Patient visits Increase by 1 million each year Yearly Chief Operations Officer2 Locations Increase MinuteClinic locations by 100 3 Years Chief Operations OfficerBusiness Ethics 1 Ethics Training # of ethics training sessions Yearly Chief Human Resources Officer2 Patient Awareness
"Learn about your medicines"- medicinal information Yearly
Health Care/Strategy Marketing Officer
Financial 1 Revenues Increase by 15% each year Yearly CFO2 Ratio Analysis Better than competitors/industry Avg. Yearly CFO
Balanced Scorecard
CVS Caremark Update

Current CVS Locations (2013)

Stock Performance

MinuteClinic Current Locations

Update Facts• In 2012, Email-Pharmacist was used 2,000 times. • CVS Pharmacy filled 1.3 million prescriptions filled through
mail service and 3.7 million retail prescriptions in 2012• 99.998% Dispensing Accuracy in 2012 for mail service• Filled 602,992 prescriptions that were 90-day supplies• Order Refill is the most visited area of their Website • 60.4% of Mail Service scripts required no intervention,
39.6% required some time of follow up• In 2011 Tom Ryan ( CEO ) retired, and new CEO was hired-
Larry Merlo