cw500 power quality analyzer user's manual · thank you for purchasing the cw500 power quality...
TRANSCRIPT

User’sManual CW500
Power Quality Analyzer
IM CW500-01EN2nd Edition

iIM CW500-01EN
Thank you for purchasing the CW500 Power Quality Analyzer. This user’s manual explains the features and operating procedures of the CW500.To ensure correct use, please read this manual thoroughly before beginning operation. Keep this manual in a safe place for quick reference in the event that a question arises.The following five manuals, including this one, are provided as manuals for the CW500.Please read all manuals.Manual Title Manual No. DescriptionCW500Power Quality Analyzer User’s Manual
IM CW500-01EN This guide. This manual explains the CW500’s standard features and how to use these features.
Application Software User’s Manual
IM CW500-61EN The supplied CD contains the PDF file of this manual. This manual explains how to use the application software.
CW500Power Quality AnalyzerGetting Started Guide
IM CW500-02EN The guide explains the handling precautions and basic operations of the CW500 and provides a list of specifications.
Application Software Installation Manual
IM CW500-62JA This manual describes how to install the application software.
CW500 Power Quality Analyzer User’s Manual
IM CW500-92Z1 Chinese document
The “-EN” in the manual number is the language code.Contact information of Yokogawa offices worldwide is provided on the following sheet.Manual No. DescriptionPIM113-01Z2 List of worldwide contacts
2nd Edition : October 2017 (YMI)All Rights Reserved, Copyright © 2015 Yokogawa Test & Measurement Corporation

ii IM CW500-01EN
Notes• The contents of this manual are subject to change without prior notice
as a result of continuing improvements to the software’s performance and functionality. The figures given in this manual may differ from those that actually appear on your screen.
• Every effort has been made in the preparation of this manual to ensure the accuracy of its contents. However, should you have any questions or find any errors, please contact your nearest YOKOGAWA dealer.
• Copying or reproducing all or any part of the contents of this manual without the permission of YOKOGAWA is strictly prohibited.
•
Trademarks• Microsoft, Windows, Windows 7, Windows 8, and Windows 10 are
either registered trademarks or trademarks of Microsoft Corporation in the United States and/or other countries.
• Adobe, Acrobat, and PostScript are either registered trademarks or trademarks of Adobe Systems Incorporated.
• In this manual, the TM and ® symbols do not accompany their respective registered trademark or trademark names.
• Other company and product names are trademarks or registered trademarks of their respective companies.
RevisionsSeptember 2015 1st EditionOctober 2017 2nd Edition

iiiIM CW500-01EN
Contents
Chapter 1 Product Outline1.1 Feature Outline .....................................................1-11.2 Features ................................................................1-31.3 System Configuration Diagram .............................1-51.4 Measurement Procedure ......................................1-6
Chapter 2 Component Names2.1 Display (LCD) and Control Keys ...........................2-12.2 Connectors ...........................................................2-22.3 Side Panel ............................................................2-32.4 Voltage Probe and Current Clamp-on Probe ........2-4
Chapter 3 Basic Operation3.1 Description of Control Keys ..................................3-13.2 Marks Displayed in the Top Area of the LCD ........3-33.3 Display Symbols ...................................................3-43.4 BacklightandContrastAdjustment .......................3-53.5 Screens and Screen Configuration .......................3-6
Chapter 4 Recording4.1 Starting and Stopping Recording ..........................4-14.2 Starting to Record with “Quick start guide” ...........4-3
Chapter 5 Setup5.1 Settings .................................................................5-15.2 Basic Setup ...........................................................5-25.3 Measurement Setup ...........................................5-125.4 Recording Setup .................................................5-255.5 Other Settings .....................................................5-315.6 Saved Data .........................................................5-36
iv IM CW500-01EN
Chapter 6 Display Items of Each Screen6.1 Instantaneous Value (W) ......................................6-16.2 Integrated Value (Wh) ...........................................6-96.3 Demand .............................................................. 6-116.4 Vector ..................................................................6-146.5 Waveform............................................................6-176.6 Harmonics ...........................................................6-196.7 Power Quality .....................................................6-25
Chapter 7 Other Features7.1 Other Features ......................................................7-1
Chapter 8 Connecting to Peripheral Devices8.1 TransferringDatatoaPC .....................................8-18.2 SignalControlwithExternalDevices ....................8-28.3 SupplyingPowerthroughMeasurementLines .....8-5
Chapter 9 PC Software for Configuration and Analysis9.1 PC Software for Configuration and Analysis .........9-1
Chapter 10 Troubleshooting10.1 Troubleshooting ..................................................10-110.2 Error Messages and Corrective Actions .............10-3
AppendixWhen Using 96030, 96033, or 96036 ......................... App-1
Index
Contents

1-1IM CW500-01EN
1.1 Feature Outline
Starting and Ending RecordingStart recording normally or start by following the Quick Start Navigation, which guides you through the necessary setup for recording. See “Starting and Stopping Recording.”
Displaying Instantaneous, Integrated, and DemandDisplays instantaneous, average, maximum and minimum values for current, voltage, active power, apparent power, and reactive power. Switch the screen to display integrated values. Set a demand target value and display the demand values from start to finish.See “Displaying Instantaneous, Integrated, and Demand.”
Displaying Vectors and Checking the WiringDisplays a vector diagram of voltage and current for the measurement channel and checks the wiring.See “Vector.”
Chapter 1 Product Outline
1-2 IM CW500-01EN
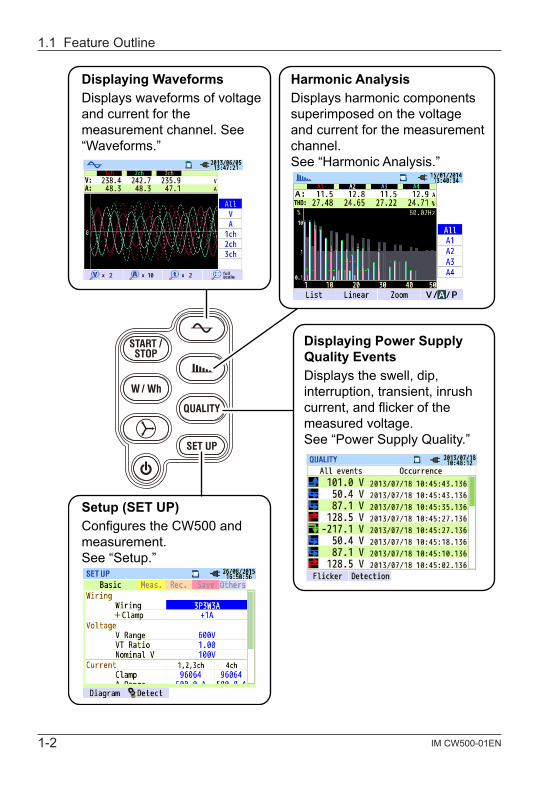
Displaying WaveformsDisplays waveforms of voltage and current for the measurement channel. See “Waveforms.”
Harmonic AnalysisDisplays harmonic components superimposed on the voltage and current for the measurement channel.See “Harmonic Analysis.”
Displaying Power Supply Quality EventsDisplays the swell, dip, interruption, transient, inrush current, and flicker of the measured voltage.See “Power Supply Quality.”
Setup (SET UP)Configures the CW500 and measurement.See “Setup.”
1.1 Feature Outline

1-3IM CW500-01EN
1.2 Features
This product is a clamp-type power quality analyzer that supports a variety of wiring systems. It simultaneously performs simulations of instantaneous values, integrated values, demand values for power management, harmonic analysis, power quality events, and phase lead capacitor values for improving the power factor. Voltage and current can be displayed as waveforms and vectors.Measured data can be saved to files in SD memory cards or internal memory, and the files can be transferred to a PC through USB communication.Safety Design This product complies with safety standard IEC 61010-1 CAT. IV 300V/CAT. III 600V/CAT. II 1000V.
Power Quality Measurement This product supports international power quality measurement standard IEC61000-4-30 Class S. It can perform highly accurate frequency and rms voltage measurements and harmonic analysis as well as simultaneously measure without gaps swell, dip, interruption, transient, inrush current, and flicker that are necessary for capturing and monitoring power abnormalities.
Power Measurement This product can measure active, reactive, and apparent powers as well as watt-hour, power factor, rms current, phase angle, and neutral line current.
Wiring Systems This product supports single-phase two-wire (four systems), single-phase three-wire (two systems), three-phase three-wire (two systems), and three-phase four-wire measurement lines.
Demand Measurement You can monitor in a simplified form the usage condition so that the specified target value (contract demand) is not exceeded.

1-4 IM CW500-01EN
Waveform and Vector Displays Voltage and current can be displayed as waveforms and vectors.
Saving Measured Data This product is equipped with a logging function whose recording interval can be specified. Measured data can be saved manually or by specifying the date and time. Further, the print screen function can be used to save image data to SD memory cards.
Dual Power System This product can be driven by AC power or batteries. For batteries, AA alkaline batteries (LR6) or off-the-shelf rechargeable AA nickel-metal hydride batteries (Ni-MH) can be used. For rechargeable AA nickel-metal hydride (Ni-MH) batteries, use the battery manufacturer’s charger to charge them. You cannot charge them on the CW500. If a power failure occurs while the CW500 is running off of AC power, the power supply is automatically switched to battery power.
Display Screen This product has a color TFT LCD.
Easy Wiring and Compact, Lightweight Design Wiring is easy as this product is a clamp type. Its compact, lightweight design makes it convenient to install and carry around.
Application Files saved in SD memory cards and internal memory can be downloaded to a PC through USB. Downloaded files can be analyzed easily using the accompanying PC software. It is also possible to configure the CW500 from a PC.
Auxiliary I/O Function The 2-channel analog input (DC voltage) can be used to simultaneously measure analog signals from thermometers, lux meters, and the like.If a power quality event occurs, a contact signal can be sent to an alarm through the 1-channel digital output.
1.2 Features

1-5IM CW500-01EN
1.3 System Configuration Diagram
(Option)
Current input
AC voltage input
Power cord
USB
SD memorycard
PC
AA alkaline batteries (LR6)AA Ni-MH batteries
Digital output (1 ch) to recorder or alarm
Analog input (2 ch) from thermometer or illuminometer

1-6 IM CW500-01EN
1.4 Measurement Procedure
Measurement preparationGetting Started Guide, “Making Preparations for Measurements” Page 5
Connecting cords and sensors to the CW500Getting Started Guide, “Connecting a Voltage Probe and Clamp-on Probe”
Page 15
Turning the power onGetting Started Guide, “Power Supply” Page 7
Setting common measurement items5.2, “Basic Settings” Page 5-3
Loading CW500 settings5.6, “Save Data” Page 5-36
Wiring measurement linesGetting Started Guide, “Safety Precautions” Page vii
Checking the wiring6.4, “Vectors” Page 6-14
Configuring measurement settings and save method5.3, “Measurement Settings” Page 5-12 and 5.4, “Record Settings” Page
5-25.
Checking measured values6.1, “Instantaneous Value W” Page 6-1 and 6.4, “Vectors” Page 6-14
Starting and stopping recording4.6, “Starting and Stopping Recording” Page 4-12
Checking Measured DataChapter 6, “Display Items of Each Screen” Page 6-1
Removing cords and sensors from the measurement line and turning the power off
Analyzing recorded data on a PC8.1, “Transferring Data to a PC” Page 8-1
Chapter 9, “PC Software for Configuration and Analysis” Page 9-1

2-1IM CW500-01EN
2.1 Display (LCD) and Control Keys
Display (LCD)
Control keys
Chapter 2 Component Names

2-2 IM CW500-01EN
2.2 Connectors
AC voltage input terminals(VN, V1, V2, V3)
Current input terminals(A1, A2, A3, A4)
Terminal coversPower inlet
Wiring System AC Voltage Input Terminal
Current Input Terminal*
Single-phase two-wire (1 system) 1P2W×1 VN, V1 A1Single-phase two-wire (2 system) 1P2W×2 VN, V1 A1, A2Single-phase two-wire (3 system) 1P2W×3 VN, V1 A1, A2, A3Single-phase two-wire (4 system) 1P2W×4 VN, V1 A1, A2, A3, A4Single-phase three-wire (1 system) 1P3W×1 VN, V1, V2 A1, A2Single-phase three-wire (2 system) 1P3W×2 VN, V1, V2 A1, A2, A3, A4Three-phase three-wire (1 system) 3P3W×1 VN, V1, V2 A1, A2Three-phase three-wire (2 system) 3P3W×2 VN, V1, V2 A1, A2, A3, A4Three-phase three-wire 3A 3P3W3A V1, V2, V3 A1, A2, A3Three-phase four-wire 3P4W×1 VN, V1, V2, V3 A1, A2, A3* Current terminals that are not used in wiring can measure only rms values and harmonics.

2-3IM CW500-01EN
2.3 Side Panel
With the Connector Cover Closed
SD memory card area USB area
Analog input/digital output area
With the Connector Cover Open
SD memory card slot USB port
Analog input/digital output terminals
2-4 IM CW500-01EN
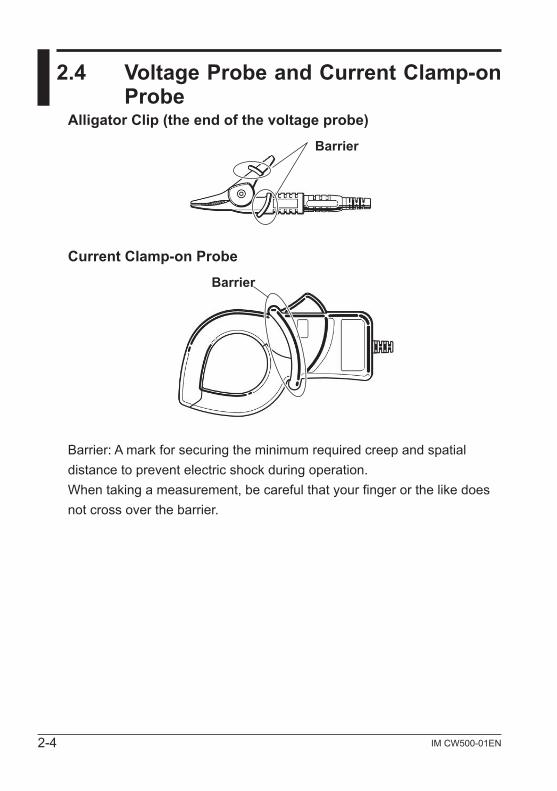
2.4 Voltage Probe and Current Clamp-on Probe
Alligator Clip (the end of the voltage probe)
Barrier
Current Clamp-on Probe
Barrier
Barrier: A mark for securing the minimum required creep and spatial distance to prevent electric shock during operation.When taking a measurement, be careful that your finger or the like does not cross over the barrier.

3-1IM CW500-01EN
3.1 Description of Control Keys
LCD keyTurns on/off the backlight and adjusts the contrast and brightness.
ENTER keyConfirms the operation or setting.
Arrow keysSelects items and changes displays.
Function keysSelects or executes the menu items at the bottom of the screen.
ESC/RESET keyResets to the original setting.
Power keyTurns the power on and off.
Display
SETUP KeyChanges basic, measurement, recording, saved data, and other settings.
START/STOP keyStarts or stops recording.
Display SW keySee page 3-2.
Status LEDShows the recording status.Green solid: RecordingGreen blinking: StandbyRed blinking: Backlight off
PRINT SCREEN keySaves the screen as a BMP file.
DATA HOLD/KEY LOCK keyDATA HOLDHolds the display. But, measurement continues.KEY LOCKHold down for 2 s to lock all keys. Hold down for 2 s again to release.
Chapter 3 Basic Operation

3-2 IM CW500-01EN
Display Switch KeyWaveform keyDisplays voltage and current waveformsHarmonic analysis keyDisplays harmonic voltage, harmonic current, and harmonic power
QUALITY keyDisplays the occurrence of swell, dip, interruption, transient, inrush current, and flicker
W/Wh keyDisplays instantaneous values, integrated values, and “demand”
Vector keyDisplays phases

3-3IM CW500-01EN
3.2 Marks Displayed in the Top Area of the LCD
Mark Status When DisplayedRunning on batteries. Shows the battery level using four levels.
Running on AC power.
Screen updating is held.
Keys are locked.
The buzzer is turned off.
SD memory card can be used.
Recording to SD memory card.
Not enough space in SD memory card to record.
Unable to access SD memory card.
Possible to record to internal memory. This appears when recording is started without an SD memory card inserted.
Recording to internal memory.
Not enough space in internal memory to record.
Waiting to record.
Recording measurement values.
Recording medium is full.
USB can be used.
Bluetooth®canbeused.

3-4 IM CW500-01EN
3.3 Display Symbols
Display SymbolV1 Phase voltage VL1 Line voltage A Current
P Activepower
+ Consumption Q Reactivepower
+ Lag S Apparent power– Regeneration – Lead
PF power factor
+ Lag f Frequency– Lead
DC1 Analog inputchannel 1 voltage DC2 Analog input
channel 2 voltage
An2 Neutral line current PA3 Phase angle
+ LagC3
Phase advance capacitor
capacitance– Lead
WP+ Active energy (consumption) WS+ Volt-ampere hours
(consumption) WQi+ Reactive energy (lag)
WP- Active energy (regeneration) WS- Volt-ampere hours
(regeneration) WQc+ Reactive energy (lead)
THD Voltage/current distortionPst
(1min) 1-minute voltage flicker Pst Short term voltage flicker Plt Long term voltage
flicker1 The V and VL displays can be customized when 3P4W is selected. 2 An appears only when 3P4W is selected. 3 PA and C can be displayed by customization.

3-5IM CW500-01EN
3.4 Backlight and Contrast Adjustment
Holding down the LCD key for 2 seconds when the backlight is on displays slidebars for adjusting thebacklight brightnessanddisplaycontrast.Toadjustthebrightnessorcontrast,usethearrowkeystomovethe slidebars.After adjusting, pressENTER to confirm.To cancel theadjustment,pressESCorLCDagain.
Backlight brightness can be changedto any of the 11 available levels.
Brightness adjustment
Contrast can be changedto any of the 11 available levels.
Contrast adjustment

3-6 IM CW500-01EN
3.5 Screens and Screen Configuration
Instantaneous, Integrated, and DemandSwitching the W/Wh ScreenEach time you press function key F1, the display screen changes.
Demand
Customize
Zoom
4 windows 8 windowsZoom in on selected items.
Select and change the items to be displayed.
TrendMeasurement variation trendsare displayed on a graph.
Wh (Integrated value)W (instantaneous value)
3-7IM CW500-01EN
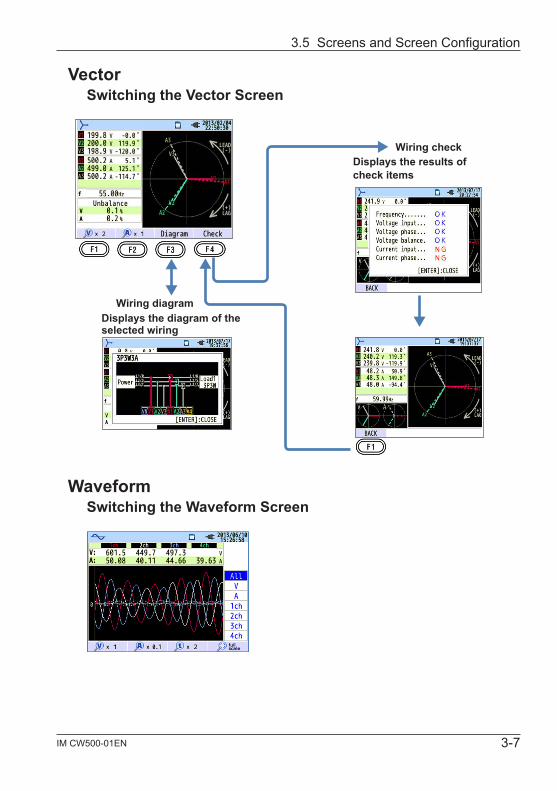
VectorSwitching the Vector Screen
Displays the diagram of the selected wiring
Wiring diagram
Displays the results ofcheck items
Wiring check
WaveformSwitching the Waveform Screen
3.5 Screens and Screen Configuration

3-8 IM CW500-01EN
3.5 Screens and Screen Configuration
HarmonicsSwitching the Harmonic Analysis Display Items
Voltage, Linear, Overall display
List, percentage content Logarithm Zoom
Phase angle Rms value
Current Power
Current Power

3-9IM CW500-01EN
Power QualitySwitching the Quality Display Items
Event Flicker
SetupSwitching the Setup Display Items
Use the left and right arrow keys switch between screens.
3.5 Screens and Screen Configuration

4-1IM CW500-01EN
4.1 Starting and Stopping Recording
Starting RecordingPress START/STOP.
You can select the recording start method from “Quick start guide” and “Start now.”Quick start guideYou can easily start recording by setting the items by following the instructions displayed on the screen. However, the items that you can set are those related to wiring and recording. If you need to specify other settings, set them from the SETUP menu.Start nowRecording starts immediately using the current settings.<Procedure>Using the up and down arrow keys, select “Quick start guide” or “Start now,” and press ENTER.To cancel, press ESC.
Chapter 4 Recording

4-2 IM CW500-01EN
Stopping RecordingWhile recording is in progress, press START/STOP.
Data number
Recording method
Record items
Recording information is displayed, and recording stops.
Display ItemsRecorded
datanumber
The ID number of the recorded data is displayed. This is also used as the name of the folder in which measured data is saved.
Elapsed time Elapsed time from the start of recording is displayed.
Recording method
Manual The recording start date and time are displayed.
Constant rec.
The recording start/end date and time are displayed.
Time period rec.
The recording start date and time, recording period, and recording time are displayed.
Save to The location where measured data is being recorded to is displayed.
Record items Measurement items being recorded are displayed.
<Procedure>Using the up and down arrow keys, select CANCEL or STOP, and then press ENTER.You can also cancel by pressing ESC.
4.1 Starting and Stopping Recording
4-3IM CW500-01EN
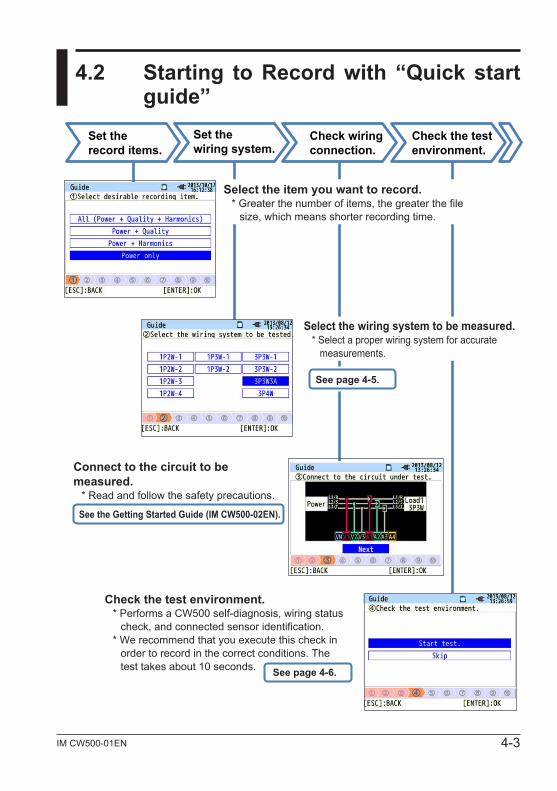
4.2 Starting to Record with “Quick start guide”
Connect to the circuit to be measured.
* Read and follow the safety precautions.
Check the test environment.* Performs a CW500 self-diagnosis, wiring status
check, and connected sensor identification.* We recommend that you execute this check in
order to record in the correct conditions. The test takes about 10 seconds.
Select the item you want to record.* Greater the number of items, the greater the file
size, which means shorter recording time.
Select the wiring system to be measured.* Select a proper wiring system for accurate
measurements.
See page 4-5.
See the Getting Started Guide (IM CW500-02EN).
See page 4-6.
Check wiring connection.
Set the record items.
Set the wiring system.
Check the test environment.

4-4 IM CW500-01EN
Select a recording interval.* Selecting a short interval results in a large
file size preventing long-term recording.
Ready. Recording will start.When recording starts, the screen shows REC, and the Logging LED turns green.To stop recording, press START/STOP, and follow the instructions on the screen.
See page 5-29.
See page 4-9.
Select the rec. method.
Select the rec interval
Select the rec method
Confirm to start recording.
Start recording
4.2 Starting to Record with “Quick start guide”
4-5IM CW500-01EN
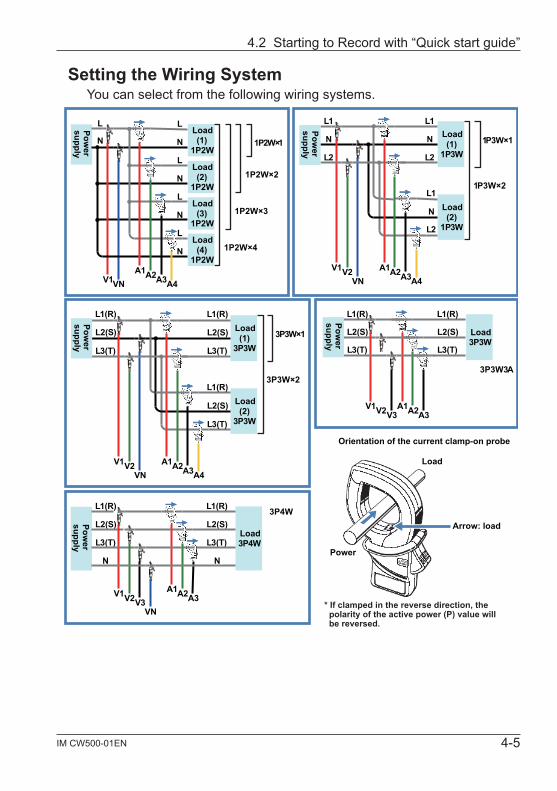
Setting the Wiring SystemYou can select from the following wiring systems.
Orientation of the current clamp-on probe
* If clamped in the reverse direction, the polarity of the active power (P) value will be reversed.
Arrow: load
Load
L1
L1
N
LLoad(1)
1P2W
Power
supply
Load(2)
1P2W
Load(3)
1P2W
Load(4)
1P2W
N
L
N
L
N
L
N
L
A4A3A2A1VNV1
N Load(1)
1P3W
Load(2)
1P3W
N
L2
L2
N
A4A3A2A1VN
V1
L1
L2
V2
L1(R)
L2(S) Load(1)
3P3W
Load(2)
3P3W
L2(S)
L3(T)
A4A3A2A1VN
V1
L1(R)
L3(T)
V2
L2(S)
L3(T)
L1(R)
L2(S) Load3P3W
L2(S)
L3(T)
A3A2A1V3
V1
L1(R)
L3(T)
V2
L1(R)
L2(S)Load3P4W
L2(S)
L3(T)
A3A2A1V3
V1
L1(R)
L3(T)
V2
L1(R)
VN
N NPower
3P4W
3P3W×2
3P3W×1
3P3W3A
1P3W×1
1P3W×2
1P2W×1
1P2W×2
1P2W×3
1P2W×4Pow
ersupply
Power
supply
Power
supplyPow
ersupply
4.2 Starting to Record with “Quick start guide”

4-6 IM CW500-01EN
Test Environment CheckTest environment checkSelect Start test and press ENTERto check the test environment and display the results.
Displays the test results of each item.* If measuring at site with extremely poor power factor, this check may fail even if the wiring is correct.
Wiring check
Select the OK or NG of a test resultto see the details.
Displays the results of a system operationcheck.
Self-diagnosis
Automatically detects connected current probesand sets the range to their maximums.
Sensor detection
4.2 Starting to Record with “Quick start guide”

4-7IM CW500-01EN
NG JudgmentWiring Check
Closing the test results causes the NG values and vectors to blink. If everything is OK, the ideal vector diagram will be displayed in the lower left corner.
Wiring Check Criteria and Failure CauseCheck Judgment Criteria Failure Cause
Frequency • TheV1frequencyisbetween 40 to 70 Hz.
• Thevoltageclipisnotfirmlyconnectedto the DUT.
• Harmoniccomponentsarelarge.AC voltageinput
• ACvoltageinputis 10% of (nominal voltage × VT) or higher.
• Thevoltageclipisnotfirmlyconnectedto the DUT.
• Voltageprobeisnotcorrectlyinsertedinto the AC voltage input terminal of this instrument.
Voltagebalance
• ACvoltageinputis within ±20% of reference voltage V1.
* Not checked for single-phase wiring
• Settingsarenotappropriateforthemeasurement line wiring system.
• Thevoltageclipisnotfirmlyconnectedto the DUT.
• Voltageprobeisnotcorrectlyinsertedinto the AC voltage input terminal.
Voltage phase
• ACvoltageinputphase is within ±10% of the reference value (appropriate vector).
• Voltageprobeisnotconnectedcorrectly.
(The connected channel is incorrect.)
Current input
• Currentinputis5%orhigher and 110% or less of (current range × CT).
• Currentclamp-onprobeisnotcorrectly inserted into the AC power input terminal of this instrument.
• Currentrangesettingistoohighortoo low for the input level.
Current phase
• Powerfactor(PF,absolute value) of each channel is 0.5 or higher.
• Activepower(P)of each channel is positive.
• Currentdirectionmarkofthecurrentclamp-on probe is not matched with the current-to-load direction.
• Clamp-onprobeisnotconnectedcorrectly.
4.2 Starting to Record with “Quick start guide”

4-8 IM CW500-01EN
Self-DiagnosisIf NG is displayed frequently, the instrument may be malfunctioning. Stop using it immediately, and see chapter 10, “Troubleshooting,” on page 10-1.
Sensor DetectionIf detection fails, current clamp-on probe types are displayed in red.
Detection Failure CauseCheck Cause
Current clamp-on probe type
• Differenttypesofcurrentclamp-onprobesareconnectedto each channel. Use the same type of current clamp-on probes for measurement.
???(cause unknown)
• Currentclamp-onprobeisnotfirmlyconnectedtotheinstrument.
• Troubleshooting Connect the current clamp-on probe that failed to be
detected to a channel that detection was successful, and test again. If the same channel fails again, the instrument may be malfunctioning. If detection fails on the channel connected to the current clamp-on probe that failed to be detected the last time, the clamp-on probe may be malfunctioning. If you suspect a malfunction, stop using it immediately, and see chapter 10, “Troubleshooting,” on page 10-1.
4.2 Starting to Record with “Quick start guide”

4-9IM CW500-01EN
Reserving by Specifying the Date and Time
From the specified start date and time to the end date and time, recording is performed at a given interval.If the date and time are set as shown above, recording will be performed during the following period.8:00onAugust2,2013to18:00onAugust7,2013
Reserving a Repetitive Recording
Recording is repeated during the specified time slot at a given interval for the specified period.If the date and time are set as shown above, recording will be performed during the time slots (i) to (viii) below. Recording is not performed from 18:00to8:00ofthenextday.(i) 8:00to18:00onAugust1,2013(ii) 8:00to18:00onAugust2,2013(iii) 8:00to18:00onAugust3,2013(iv) 8:00to18:00onAugust4,2013(v) 8:00to18:00onAugust5,2013(vi) 8:00to18:00onAugust6,2013(vii) 8:00to18:00onAugust7,2013(viii)8:00to18:00onAugust8,2013
4.2 Starting to Record with “Quick start guide”

4-10 IM CW500-01EN
OperationThe basic procedure to operate this instrument is to use the arrow keys to select an item or value, the ENTER key to confirm, and the ESC key to cancel. As an example, the operation is explained for entering settings in Quick start guide. The operation is similar for entering settings on other display screens.
Using arrow keys, you can select the items in blue letters (unselected) and the highlighted item with blue background and white letters (selected). On the Record start screen shown on the left, you can use the up and down arrow keys to select the recording method and ENTER to confirm. To cancel the settings and close the Quick start guide, press ESC.On a screen that shows selectable items in a table form, you can use the up, down, left, and right arrow keys to select an item. On the wiring selection screen shown on the left, you can use the up, down, left, and right arrow keys to select the wiring system to be measured and ENTER to confirm. To cancel the settings and return to the previous screen, press ESC.To enter values such time, use the left and right arrow keys to select the digit and the up and down arrow keys to change the number. On the recording time selection screen shown on the left, left and right arrow keys were used to select the tenth digit of the date. In this condition, pressing the up and down arrow keys will increment or decrement the tenth digit. To confirm the change, press ENTER. To cancel the settings and return to the previous screen, press ESC.
4.2 Starting to Record with “Quick start guide”

4-11IM CW500-01EN
Notes on SettingsIf the current range is set to AUTO, only “Power + Harmonics” or “Power only” can be selected with “1. Select desirable recording item.” If you want to record power quality, change the current range to a fixed range before starting to record. Only wiring and recording settings can be specified in “Quick start guide.” Nominal voltage, nominal frequency, threshold for power quality events (included in the measurement settings), and filter coefficient (ramp) for flicker measurement must be set in advance. Set these items from the SETUP menu. Note that the “+ Clamp” option clamp-on probe setting is automatically set to OFF.
4.2 Starting to Record with “Quick start guide”

5-1IM CW500-01EN
5.1 Settings
Before starting measurement, you need to set measurement conditions and data saving conditions.To set these conditions, press SET UP to enter the SET UP mode.The SET UP mode is divided into the following five categories. Use the arrow keys to move between the categories.The settings that you change take effect after you exit from the SET UP mode and appears in the upper left of the screen.Note that even if you change the settings, if you turn off the power while in SET UP mode, the settings will not take effect.
Basic Set common measurement items.
Measurement Set specific measurement items.
Recording Set the saving method.
Saved Data Edit recorded data or change the instrument settings.
Others Configure environmental settings.
Settings
Measurement(Demand)
(Harmonics)
(Power quality)
(Flicker)
(Phase advancecapacitor)
Recording(REC item)
(Rec method)
(Manual/Constant rec.
Time period rec.)
Basic (Wiring)
(Voltage)
(Current)
(External input DC)
(Frequency)
Saved Data(Rec data)
(System settings)
Others(Environment)
(System settings)
Chapter 5 Setup

5-2 IM CW500-01EN
5.2 Basic Setup
<Procedure>Press SETUP. → Use the left and right arrow keys to select the Basic tab.

5-3IM CW500-01EN
Wiring System Settings
WiringFrom the 10 available wiring systems, select the appropriate one for the wiring system to be measured.
Settings1P2W×1 1P2W×2 1P2W×3 1P2W×41P3W×1 1P3W×23P3W×1 3P3W×2 3P3W3A 3P4W (default setting)* Current terminals that are not used in “+Clamp” wiring can measure only rms values and harmonics.
<Procedure>Use the up and down arrow keys to move to Wiring. → Press ENTER to show a pull-down menu. → Select the wiring system. → Press ENTER to confirm or ESC to cancel.
+Clamp (optional clamp-on probe)<Procedure>Use the up and down arrow keys to move to +Clamp. → Press ENTER to show a pull-down menu. → Use the up and down arrow keys to select the optional clamp. → Press ENTER to confirm or ESC to cancel.
5.2 Basic Setup

5-4 IM CW500-01EN
Wiring DiagramsWhen you move to the Wiring item, you can use the F1 (Diagram) key to show the wiring diagram of the selected wiring system.<Procedure>After showing the wiring diagram, press F1 (previous wiring system) or F2 (next wiring system) to change the wiring system. → Press ENTER to confirm or ESC to cancel.
5.2 Basic Setup

5-5IM CW500-01EN
Voltage Measurement Settings
V RangeSelect the voltage range to use.To perform a measurement according to the international power quality standard IEC61000-4-30 Class S, select 600V.
Settings600V*/1000V
* Default value
<Procedure>Use the up and down arrow keys to move to V Range. → Press ENTER to show a pull-down menu. → Use the up and down arrow keys to select the voltage range. → Press ENTER to confirm or ESC to cancel.
VT RatioSet this when an external VT (voltage transformer) is installed in the system. The VT ratio will be applied to all voltage measurements.
Settings0.01 to 9999.99 (1.00*)
* Default value
5.2 Basic Setup

5-6 IM CW500-01EN
<Procedure>Use the up and down arrow keys to move to VT Ratio. → Press ENTER to show a value entry window.* → Use the arrow keys to select the VT ratio. → Press ENTER to confirm or ESC to cancel.* The input range is shown in a pop-up.
VT/CTThe measurement accuracy of this instrument when VT or CT is used is not guaranteed. When using a VT or CT, take into consideration the VT or CT accuracy, phase characteristics, and the like in addition to the instrument accuracy.
If the voltage or current on the measurement line exceeds the maximum measurement range of this instrument, you can use a VT or CT with specifications appropriate for the measurement line voltage and current to measure the secondary side and display the value on the primary side.
Example of single-phase two-wire (1 system) (1P2W × 1)
VN V1 A1
N
L
VT CT
Power Load
i
5.2 Basic Setup
5-7IM CW500-01EN
If the rating of the secondary side of the CT is 5 A, We recommend that you use a 50 A type clamp-on probe and measure at the 5 A range.Make sure to set the appropriate VT and CT ratios.
Nominal VSet the nominal voltage applied from the DUT.
Settings50V~600V(100V*)
* Default value<Procedure>Use the up and down arrow keys to move to Nominal V. → Press ENTER to show a value entry window.* → Use the arrow keys to enter the nominal voltage. → Press ENTER to confirm or ESC to cancel.* The input range is shown in a pop-up.
Default ValuesWhen you move to the Nominal V item, you can press F1 (default values) to show a list of typical nominal voltages that you can choose from.
Settings100V/101V/110V/120V/200V/202V/208V/220V/230V/
240V/277V/346V/380V/400V/415V/480V/600V<Procedure>Use the arrow keys to select nominal voltage. → Press ENTER to confirm or ESC to cancel.
5.2 Basic Setup

5-8 IM CW500-01EN
Current Measurement Settings
Clamp (Current clamp-on probe)Select the current clamp-on probe you want to use. If you selected an optional clamp-on probe for “+Clamp,” you can select a current clamp-on probe that is of a different type than the current clamp-on probe connected to the DUT only for channel 4. If you select a current clamp-on probe from the pull-down menu, the rated current and the conductor size are displayed in a pop-up.
Settings96060: 2A Leak current clamp-on probe96061: 5/50A/AUTO96062: 10/100A/AUTO96063: 20/200A/AUTO96064*: 50/500A*/AUTO96065: 100/1000A/AUTO96066: 300/1000/3000
Power measurement clamp-on probe
* Default value<Procedure>Use the arrow keys to move to Clamp. → Press ENTER to show a pull-down menu. → Use the arrow keys to select the current clamp-on probe. → Press ENTER to confirm or ESC to cancel.
5.2 Basic Setup

5-9IM CW500-01EN
Current RangeSelect the current range to use. If power quality events are set to be recorded, AUTO is not available.* If you want the current range to switch automatically, set power quality events to “Do not record.” For details on power quality event settings, see “Power Quality (Event) Threshold Settings”onpage5-18.* If AUTO range is selected, measurements according to international power quality standard IEC61000-4-30 Class S cannot be performed.<Procedure>Use the arrow keys to move to A Range. → Press ENTER to show a pull-down menu. → Use the up and down arrow keys to select the range. → Press ENTER to confirm or ESC to cancel.
CT RatioSet this when an external CT (current transformer) is installed in the system. The CT ratio will be applied to all current measurements. For details on CT, see “VT/CT” on page 5-6.
Settings0.01~9999.99(1.00*)
* The default value is 1.00.<Procedure>Use the arrow keys to move to CT Ratio. → Press ENTER to show a value entry window.* → Use the arrow keys to select the CT ratio. → Press ENTER to confirm or ESC to cancel.* The input range is shown in a pop-up.
5.2 Basic Setup

5-10 IM CW500-01EN
Sensor DetectionPress F2 (sensor detection) to automatically set the connected current clamp probe. However, if a current clamp-on probe whose type is not appropriate for the DUT is connected or if the type fails to be detected, this will not work. If this happens, an error message appears in a pop-up, and Clamp, A Range, and CT ratio settings will be cleared. For details on sensor detection, see section 4.2, “Sensor Detection.”
5.2 Basic Setup

5-11IM CW500-01EN
External Input Terminal and Reference Frequency Settings
DC RangeSelect the DC range according to the input DC voltage signal.
Settings100mV/1000mV*/10V
* Default value<Procedure>Use the up and down arrow keys to move to DC Range. → Press ENTER to show a pull-down menu. → Use the up and down arrow keys to select the range. → Press ENTER to confirm or ESC to cancel.
FrequencySet the nominal frequency for the DUT. If the voltage frequency cannot be determined, such as during a power failure, the CW500 measures based on the preset nominal frequency.
Settings50Hz*/60Hz
* Default value<Procedure>Use the up and down arrow keys to move to Nominal f. → Press ENTER to show a pull-down menu. → Use the up and down arrow keys to select the frequency. → Press ENTER to confirm or ESC to cancel.
5.2 Basic Setup

5-12 IM CW500-01EN
5.3 Measurement Setup
<Procedure>Press SETUP. → Use the left and right arrow keys to select the Measurement tab.
Demand Measurement Settings
5-13IM CW500-01EN
MeasurementDisable demand measurement or select the demand measurement cycle. When demand measurement is started, the demand value is determined every measurement interval and recorded. In demand measurement, the recording interval can be set only to the times shown below. If the interval is set to some other value and the measurement interval is set, the interval is automatically set to the same value as the measurement interval.Selectable intervals: 1 s, 2 s, 5 s, 10 s, 15 s, 20 s, 30 s, 1 min, 2 min, 5 min, 10 min, 15 min,* 30 min*
* The interval cannot be set to a value longer than the measurement interval.
SettingsNot be used, 10 min, 15 min, 30 min*
* Default value
<Procedure>Use the up and down arrow keys to move to Measurement. → Press ENTER to show a pull-down menu. → Use the up and down arrow keys to select the time. → Press ENTER to confirm or ESC to cancel.
TargetSet the demand measurement target value.
Settings0.001mW~999.9TW(100.0kW*)
* Default value<Procedure>Use the arrow keys to move to Target. → Press ENTER to show a value entry window.* → Use the arrow keys to enter the target value. → Press ENTER to confirm or ESC to cancel.* The input range is shown in a pop-up.
5.3 Measurement Setup

5-14 IM CW500-01EN
When the target value entry window is displayed, the following operations become valid. You can specify an active power or apparent power for the demand target value. To switch between active power and apparent power, press F1 (VA/W) to change to the appropriate power unit.* To change the unit,* use the left and right arrow keys to move to the unit, and use the up and down arrow keys to change it. Press F2 and F3 to move the decimal point.* Apparent power:mVA, _VA, kVA, MVA, GVA, TVA Active power:mW, _W, kW, MW, GW, TW
Inspection cycleSelect the cycle (time) during which a buzzer is sounded when the estimated value exceeds the target value during demand measurement. You cannot set the inspection cycle longer than the measurement cycle. The inspection cycles that can be selected depending on the measurement cycle are shown below.
Measurement cycle setting Selectable inspection cycles10 min or 15 min 1 min, 2 min, 5 min
30 min 1 min, 2 min, 5 min, 10 min,* 15 min* Default value<Procedure>Use the up and down arrow keys to move to Inspection. → Press ENTER to show a value entry window.* → Use the arrow keys to select the time. → Press ENTER to confirm or ESC to cancel.* The input range is shown in a pop-up.
5.3 Measurement Setup
5-15IM CW500-01EN
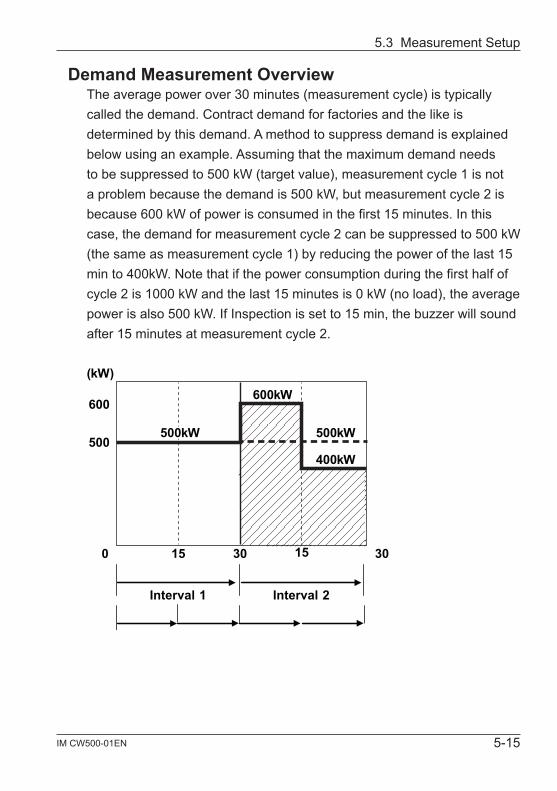
Demand Measurement OverviewThe average power over 30 minutes (measurement cycle) is typically called the demand. Contract demand for factories and the like is determined by this demand. A method to suppress demand is explained below using an example. Assuming that the maximum demand needs to be suppressed to 500 kW (target value), measurement cycle 1 is not a problem because the demand is 500 kW, but measurement cycle 2 is because 600 kW of power is consumed in the first 15 minutes. In this case, the demand for measurement cycle 2 can be suppressed to 500 kW (the same as measurement cycle 1) by reducing the power of the last 15 min to 400kW. Note that if the power consumption during the first half of cycle 2 is 1000 kW and the last 15 minutes is 0 kW (no load), the average power is also 500 kW. If Inspection is set to 15 min, the buzzer will sound after 15 minutes at measurement cycle 2.
(kW)
600600kW
500500kW
400kW
0 15 30 15 30
Inspection cycle
Inspectioncycle
Inspectioncycle
Inspectioncycle
Interval 2Interval 1
500kW
5.3 Measurement Setup

5-16 IM CW500-01EN
Harmonic Analysis Settings
THD calculationSelect the THD (total harmonic distortion) calculation method. Select THD-F to calculate the total harmonics distortion based on the fundamental waveform and “THD-R” to calculate based on all rms values.
SettingsTHD-F (fundamental waveform as reference)*/THD-R (all rms values as reference)* Default value<Procedure>Use the up and down arrow keys to move to THD calc. → Press ENTER to show a pull-down menu. → Use the up and down arrow keys to select the calculation method. → Press ENTER to confirm or ESC to cancel.
MAX holdIf MAX hold is set to ON, the maximum percentage content from the start of measurement is marked on the harmonics graph.
SettingsON*/OFF
* Default value<Procedure>Use the up and down arrow keys to move to MAX hold. → Press ENTER to show a pull-down menu. → Use the up and down arrow keys to select ON or OFF. → Press ENTER to confirm or ESC to cancel.
5.3 Measurement Setup

5-17IM CW500-01EN
Editing the Allowable RangeSet the EMC allowable range (percentage content) for harmonics for each order. The specified ranges are displayed as a bar graph on the harmonics graph.
SettingsSpecified value*/customize (voltage/current)
* Default value<Procedure>Use the up and down arrow keys to move to Edit allowable range. → Press ENTER to display the allowable range entry window. → Use the arrow keys to select the harmonic order you want to set. → Press ENTER to open a value entry window.* → Use the arrow keys to enter the allowable values. → Press ENTER to confirm or ESC to cancel.* The input range is shown in a pop-up.
When the allowable range entry window is displayed, the following operations become valid. The default allowable values of each harmonic order are the values of the international EMC standard IEC61000-4-7: industrial environment Class 3. If you change the values and want to reset to their defaults, press F3 (default). Press F2 (A/V [%]) to switch between the allowable value entry window of harmonic current and that of harmonic voltage. To return to the measurement setup screen, press F1 (return).
5.3 Measurement Setup

5-18 IM CW500-01EN
Power Quality (Event) Threshold Settings
Press F1 (OFF/ON) to enable the threshold of each event to be entered. Even if a threshold is specified, the event will not be detected if it is set to OFF. When you set an event back to ON, the threshold set previously appears.
Notes on Setting the ThresholdsBecause the SWELL, DIP, and INT thresholds are set as percentages of the nominal voltage, if the nominal voltage is changed, the threshold voltages also change. The default value is the peak voltage (300%). Because the InrushCurrent threshold is set as a percentage of the current range, if the current range is changed, the threshold current also changes. Keep these in mind.
5.3 Measurement Setup

5-19IM CW500-01EN
HysteresisSet the measurement area where events will not be detected as a percentage of the threshold. Setting a proper hysteresis will help to prevent unnecessary detections of events that are caused by voltage or current fluctuations near the threshold values.
Settings1 to 10% (5%*) of the threshold
* Default value<Procedure>Use the arrow keys to move to Hysteresis. → Press ENTER to show a value entry window.* → Use the arrow keys to enter the hysteresis [%]. → Press ENTER to confirm or ESC to cancel.* The input range is shown in a pop-up.
Transient (Over-voltage (Impulse))Set the transient threshold as an instantaneous voltage. The selectable range varies depending on the VT ratio.
Settings±50 to ±2200 Vpeak (300% of the nominal voltage*)
* Default value<Procedure>Use the arrow keys to move to Transient. → Press ENTER to show a value entry window.* → Use the arrow keys to enter the voltage. → Press ENTER to confirm or ESC to cancel.* The input range is shown in a pop-up.
Example of Transient DetectionFor details, see “Displaying Recorded Events” on page 6-27.
Threshold (Voltage) Voltage waveform
5.3 Measurement Setup

5-20 IM CW500-01EN
Swell (Instantaneous voltage rise)Set the swell threshold (rms voltage in one cycle) as a percentage of the nominal voltage. The selectable range varies depending on the VT ratio. Hysteresis is applied to this threshold.
Settings100 to 200% (110%*) of the nominal voltage
* Default value<Procedure>Use the up and down arrow keys to move to SWELL. → Press ENTER to show a value entry window.* → Use the arrow keys to enter a percentage of the nominal voltage.* The input range is shown in a pop-up.
Inrush current (Instantaneous current rise)Set the inrush current threshold (rms current in one cycle) as a percentage of the maximum value of the current range. The selectable range varies depending on the CT ratio. Hysteresis is applied to this threshold.
Settings0 to 110% (100%*) of the current range
* Default value<Procedure>Use the up and down arrow keys to move to InrushCurrent. → Press ENTER to show a value entry window.* → Use the arrow keys to enter a percentage of the maximum value of the current range.* The input range is shown in a pop-up.
5.3 Measurement Setup

5-21IM CW500-01EN
Example of Swell and Inrush Current DetectionFor details, see “Displaying Recorded Events” (section 6.7).
Rms value (1)
Rms value (2)
Rms value (3) Rms value (5) Rms value (7) Rms value (9)
Rms value (4) Rms value (6) Rms value (8)
Voltage/currentwaveform
Rms waveform
HysteresisThreshold (4)
(5)(6)
(7) (8) (9)(1) (2) (3)
Dip (Instantaneous voltage drop)Set the dip threshold (rms voltage in one cycle) as a percentage of the nominal voltage. The selectable range varies depending on the VT ratio. Hysteresis is applied to this threshold.
Settings0 to 100 % (90 %*) of the nominal voltage
* Default value<Procedure>Use the up and down arrow keys to move to DIP. → Press ENTER to show a value entry window.* → Use the arrow keys to enter a percentage of the nominal voltage.* The input range is shown in a pop-up.
5.3 Measurement Setup
5-22 IM CW500-01EN
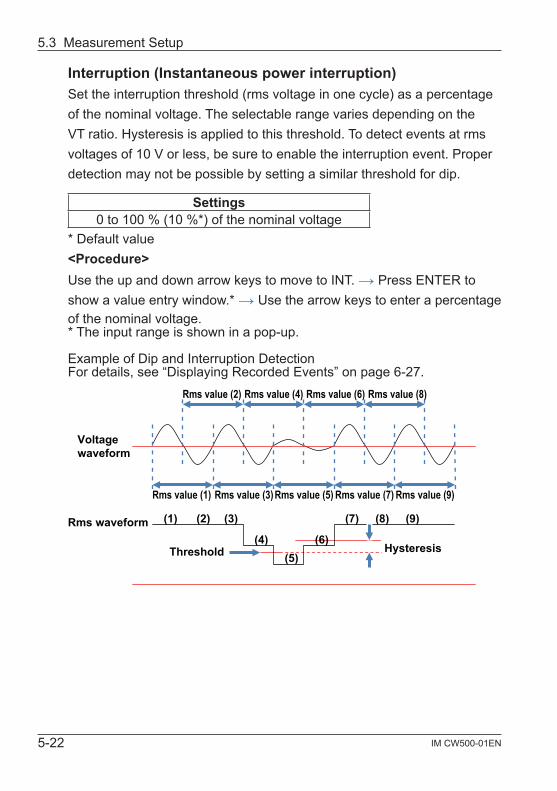
Interruption (Instantaneous power interruption)Set the interruption threshold (rms voltage in one cycle) as a percentage of the nominal voltage. The selectable range varies depending on the VT ratio. Hysteresis is applied to this threshold. To detect events at rms voltages of 10 V or less, be sure to enable the interruption event. Proper detection may not be possible by setting a similar threshold for dip.
Settings0 to 100 % (10 %*) of the nominal voltage
* Default value<Procedure>Use the up and down arrow keys to move to INT. → Press ENTER to show a value entry window.* → Use the arrow keys to enter a percentage of the nominal voltage.* The input range is shown in a pop-up.
Example of Dip and Interruption DetectionFor details, see “Displaying Recorded Events” on page 6-27.
Rms value (1)
Rms value (2)
Rms value (3) Rms value (5) Rms value (7) Rms value (9)
Rms value (4) Rms value (6) Rms value (8)
Voltagewaveform
Rms waveform
Hysteresis Threshold(4)
(5) (6)
(7) (8) (9) (1) (2) (3)
5.3 Measurement Setup

5-23IM CW500-01EN
Flicker Filter Coefficient Settings
Filter CoefficientSelect an appropriate filter coefficient according to the nominal voltage. To accurately measure flicker, the nominal voltage, nominal frequency, and filter coefficient must be set properly for the actual DUT. If possible, use the same voltage for the nominal voltage and filter coefficient.
Settings230V*/220V/120V/100V
* Default value<Procedure>
Use the up and down arrow keys to move to Filter. → Press ENTER to show a pull-down menu. → Select the appropriate filter coefficient. → Press ENTER to confirm or ESC to cancel.
5.3 Measurement Setup

5-24 IM CW500-01EN
Target Power Factor for Phase Advance Capacitor
Target Power FactorSet the power factor for when phase advance capacitors are installed. The power factor degrades if inductive loads, such as motors, are connected to the power supply because current phases lag behind the voltage phases. Usually, phase advance capacitors are installed in high-voltage-receiving installations, to improve this situation.
Settings0.5 to 1 (1.000*)
* Default value<Procedure>Use the up and down arrow keys to move to Target PF. → Press ENTER to show a value entry window.* → Use the arrow keys to enter the target power factor.* The input range is shown in a pop-up.
5.3 Measurement Setup

5-25IM CW500-01EN
5.4 Recording Setup
<Procedure>Press SETUP. → Use the left and right arrow keys to select the Recording tab.
Recording Item Settings
The length of time that measured data can be recorded to an SD memory card or internal memory varies depending on the number of recorded items and interval. Recording time can be extended by setting unnecessary record items to “Do not record.” For details, “Possible Recording Time” on page 5-30.
PowerThis is fixed to “Record.” Power measurement items are always recorded.

5-26 IM CW500-01EN
HarmonicsSelect whether to record the harmonic data of voltage, current, and power.
SettingsRecord*/Not record
* Default value
EventSelect whether to record detailed data when a power quality event occurs. If the current range is set to AUTO, “Record” cannot be selected. To select “Record,” change the current range to a fixed range first.* If AUTO range is selected, measurements according to international power quality standard IEC61000-4-30 Class S cannot be performed.
SettingsRecord*/Not record
* Default value<Procedure>Use the up and down arrow keys to move to Harmonics or Event. → Press ENTER to show a pull-down menu. → Use the up and down arrow keys to select Record or Do not record. → Press ENTER to confirm or ESC to cancel.
5.4 Recording Setup

5-27IM CW500-01EN
Record ItemsThe following data measured on each channel is recorded according to the selected record method.Record items vary depending on the record method and wiring system.
Record file Record items Recording setupPower +Harmonics +Event
Power measurement
data
RMS voltage (line/ phase)
● ● ●
Rms currentActive power
Reactive PowerApparent power
Power factorFrequency
Neutral line current (3P4W)Voltage/current phase angle (1st order)
Analog input voltage, 1CH, 2CHVoltage/current unbalance ratio
1-minute voltage flickerShort term voltage flicker (Pst)Long term voltage flicker (Plt)
Phase advance capacitor capacitanceActive energy (consumption/regeneration)
Reactive power (consumption) lag/leadVolt-ampere hours (consumption/regeneration)
Reactive power (regeneration) lag/leadDemand (W/VA)
Target demand (W/VA)Total harmonic voltage distortion (F/R)Total harmonic current distortion (F/R)
Harmonic measurement
data
Harmonic voltage/current (1 to 50th order)
●Voltage/current phase angle (1 to 50th order)V/A phase difference (1 to 50th order)
Harmonic power (1 to 50th order)Voltage/current
fluctuation data
Rms voltage per half-cycle●Rms current per half-cycle
Event typedata
Event detection date and time●Event type
Measured values at event detectionWaveform data Voltage/current waveforms ●
5.4 Recording Setup

5-28 IM CW500-01EN
Record Method Settings
IntervalSet the interval to record the measured data to the SD memory card or internal memory. Seventeen different intervals are available, but if the measurement interval of demand measurement is already set, the record interval cannot be set longer than the measurement interval. To set a longer interval, change the measurement interval of demand measurement to “Not be used” first. If you set the measurement interval of demand measurement after you set the record interval, the record interval is automatically set to the same setting as the measurement interval. For details, see “Demand Measurement Settings” (page 5-12).
Settings1s/2s/5s/10s/15s/20s/30s/
1min/2min/5min/10min/15min/20min/30min*/1h/2h/150,180cycle(approx.3s)
* Default valueTheintervals150,180cycles(approx.3sec)aredefinedintheinternational power quality standard IEC61000-4-30. Data will be collectedfor150cyclesfor50Hznominalfrequencyand180cyclesfor60 Hz nominal frequency.<Procedure>Use the arrow keys to move to Interval. → Press ENTER to show a selection window.* → Use the arrow keys to enter the recording interval. → Press ENTER to confirm or ESC to cancel.
5.4 Recording Setup

5-29IM CW500-01EN
StartSelect the method to start recording.
SettingsManual*/Constant rec./Time period rec.
* Default value<Procedure>Use the up and down arrow keys to move to Start. → Press ENTER to show a pull-down menu. → Use the up and down arrow keys to select the recording start method. → Press ENTER to confirm or ESC to cancel.
ManualThe CW500 records during the period from when you start recording to when you stop recording using the START/STOP key.
Constant rec.Set the time to start and stop recording. The CW500 records repeatedly during the period between the start and stop times at the specified interval. For details see “Reserving by Specifying the Date and Time” or “Reserving a Repetitive Recording” (page 4-9).
Settings SettingsStart date/time Day/Month/Year Hour:Minute (00/00/0000 00:00)Stop date/time Day/Month/Year Hour:Minute (00/00/0000 00:00)<Procedure>Use the arrow keys to move to REC Start/REC End. → Press ENTER to show a time entry window. → Use the arrow keys to select the date and time. → Press ENTER to confirm or ESC to cancel.
5.4 Recording Setup

5-30 IM CW500-01EN
Time Period RecordingSet the recording period by specifying the start date and stop date, and the common time slot during which recording will take place on each day of the recording period. During each time slot, recording is performed at the specified interval. For details see “Reserving by Specifying the Date and Time” or “Reserving a Repetitive Recording” (page 4-9).
Settings Settings
REC Period Start—Stop Day/Month/Year (DD/ MM/ YYYY) -Day/Month/Year (DD/ MM/ YYYY)
REC Time Start—Stop Hour:Minute (hh:mm) - Hour:Minute(hh:mm)<Procedure>Use the arrow keys to move to REC Period. → Press ENTER to show a time entry window. → Use the arrow keys to enter the date and time. → Press ENTER to confirm or ESC to cancel. → Use the arrow keys to move to Time period rec. → Press ENTER to show a time entry window. → Use the arrow keys to enter the time. → Press ENTER to confirm or ESC to cancel.
Possible Recording TimeEstimated recording time for a 2GB SD memory card
Interval REC item Interval REC itemPower +Harmonics Power +Harmonics
1 s 13 days 3 days 1 min 1 year or more 3 months2 s 15 days 3 days 2 min 2 year or more 6 months5 s 38days 7 days 5 min 6 year or more 1 year or more10 s 2.5 months 15 days 10 min
10 year or more
2 year or more15 s 3.5 months 23 days 15 min 3 year or more20 s 5 months 1 months 20 min 5 year or more30 s 7.5 months 1.5 months 30 min 7 year or more
1 hour 10 year or more2 hours150/180cycle 23 days 4 days
* The above figures do not include power quality event data. If events are recorded, the possible recording time will decrease by the amount of such events. The maximum event data size that can be saved per recording is 1 GB.
* The SD memory cards that can be used with this instrument are those provided by YOKOGAWA.
5.4 Recording Setup

5-31IM CW500-01EN
5.5 Other Settings
<Procedure>Press SETUP. → Use the left and right arrow keys to select the Others tab.
System Environment Settings
LanguageSelect the language to be displayed.
SettingsEnglish*/Japanese/French/Spanish/Polish/Korean/Chinese
* Default value. However, this setting will not be initialized even when the system is reset.
<Procedure>Use the up and down arrow keys to move to Language. → Press ENTER to show a pull-down menu. → Use the up and down arrow keys to select the language. → Press ENTER to confirm or ESC to cancel.
5-32 IM CW500-01EN
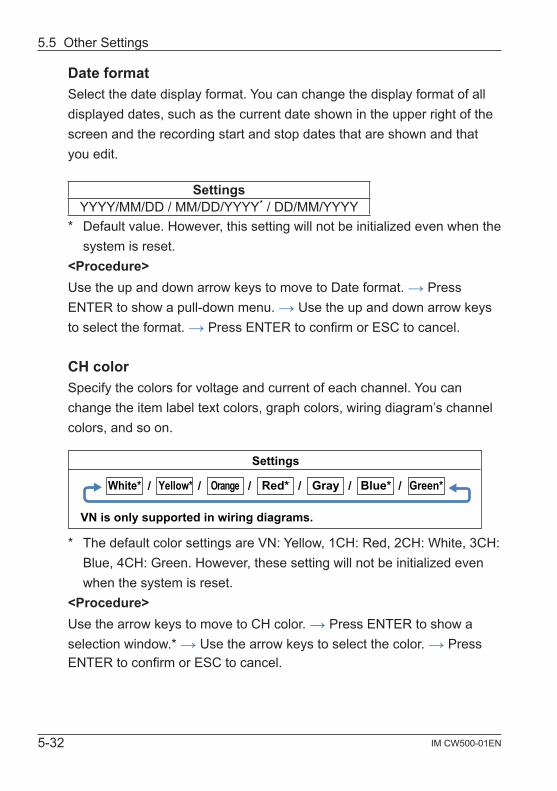
Date formatSelect the date display format. You can change the display format of all displayed dates, such as the current date shown in the upper right of the screen and the recording start and stop dates that are shown and that you edit.
SettingsYYYY/MM/DD / MM/DD/YYYY* / DD/MM/YYYY
* Default value. However, this setting will not be initialized even when the system is reset.
<Procedure>Use the up and down arrow keys to move to Date format. → Press ENTER to show a pull-down menu. → Use the up and down arrow keys to select the format. → Press ENTER to confirm or ESC to cancel.
CH colorSpecify the colors for voltage and current of each channel. You can change the item label text colors, graph colors, wiring diagram’s channel colors, and so on.
Settings
VN is only supported in wiring diagrams.
White* Yellow* Orange Red* Gray Blue* Green*// / / / /
* The default color settings are VN: Yellow, 1CH: Red, 2CH: White, 3CH: Blue, 4CH: Green. However, these setting will not be initialized even when the system is reset.
<Procedure>Use the arrow keys to move to CH color. → Press ENTER to show a selection window.* → Use the arrow keys to select the color. → Press ENTER to confirm or ESC to cancel.
5.5 Other Settings

5-33IM CW500-01EN
CW500 System Settings
TimeSet the system clock to the current time.
Settingsyyyy/mm/dd hh:mm
* The input format is synchronized with the Date format setting.<Procedure>Use the arrow keys to move to Time. → Press ENTER to show a time entry window. → Use the arrow keys to select the date and time. → Press ENTER to confirm or ESC to cancel.
ID NumberSet the CW500 ID number. Assigning numbers in an organized manner will make it convenient to analyze recorded data when several CW500s are used or when several locations are measured periodically using a single CW500.
Settings00-001~99-999(00-001*)
* Default value<Procedure>Use the arrow keys to move to ID Number. → Press ENTER to show a value entry window. → Use the arrow keys to enter the ID number. → Press ENTER to confirm or ESC to cancel.
5.5 Other Settings

5-34 IM CW500-01EN
BuzzerTurnonoroffthekeypadsound.Warningbuzzersfordemandjudgmentand low battery are not affected by this setting.
SettingsOn*/Off
* Default value<Procedure>Use the up and down arrow keys to move to Buzzer. → Press ENTER to show a pull-down menu. → Use the up and down arrow keys to select on or off. → Press ENTER to confirm or ESC to cancel.
Bluetooth (option)Enable or disable the built-in Bluetooth function. Disable it when you are not using Bluetooth communication.
SettingsOn/Off*
* Default value<Procedure>Use the up and down arrow keys to move to Bluetooth. → Press ENTER to show a pull-down menu. → Use the up and down arrow keys to select on or off. → Press ENTER to confirm or ESC to cancel.
5.5 Other Settings
5-35IM CW500-01EN
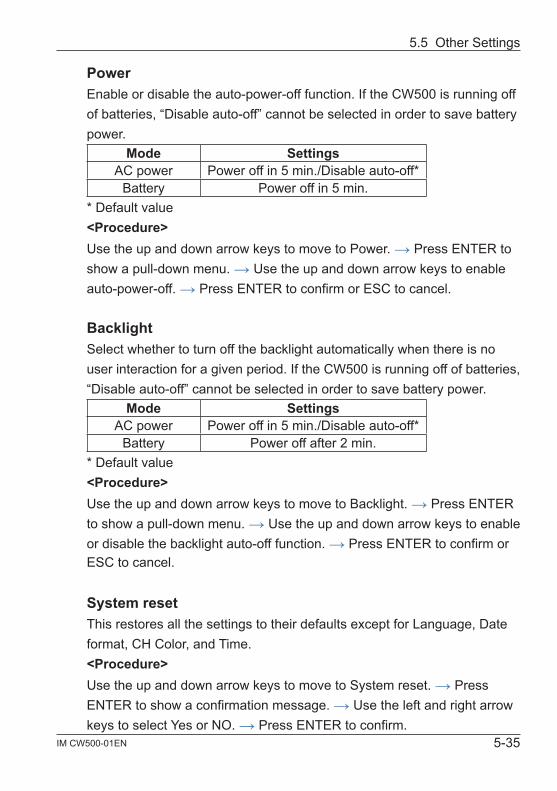
PowerEnable or disable the auto-power-off function. If the CW500 is running off of batteries, “Disable auto-off” cannot be selected in order to save battery power.
Mode SettingsAC power Power off in 5 min./Disable auto-off*
Battery Power off in 5 min.* Default value<Procedure>Use the up and down arrow keys to move to Power. → Press ENTER to show a pull-down menu. → Use the up and down arrow keys to enable auto-power-off. → Press ENTER to confirm or ESC to cancel.
BacklightSelect whether to turn off the backlight automatically when there is no user interaction for a given period. If the CW500 is running off of batteries, “Disable auto-off” cannot be selected in order to save battery power.
Mode SettingsAC power Power off in 5 min./Disable auto-off*
Battery Power off after 2 min.* Default value<Procedure>Use the up and down arrow keys to move to Backlight. → Press ENTER to show a pull-down menu. → Use the up and down arrow keys to enable or disable the backlight auto-off function. → Press ENTER to confirm or ESC to cancel.
System resetThis restores all the settings to their defaults except for Language, Date format, CH Color, and Time.<Procedure>Use the up and down arrow keys to move to System reset. → Press ENTER to show a confirmation message. → Use the left and right arrow keys to select Yes or NO. → Press ENTER to confirm.
5.5 Other Settings

5-36 IM CW500-01EN
5.6 Saved Data
<Procedure>Press SETUP. → Use the left and right arrow keys to select the Saved data tab.
You can save measured data, screenshots, and setup data to the SD memory card or internal memory. If an SD memory card is inserted in the instrument, data will be automatically saved to the card. Do not insert an SD memory card if you want to save to the internal memory. You cannot set the save destination.We recommend that you save data to an SD memory card. Up to three measured data files and eight other files can be saved to the internal memory.
Recorded Data Operation
<Procedure>Use the up and down arrow keys to move to the desired operation. → Press ENTER to confirm.

5-37IM CW500-01EN
Delete dataThis is used to delete measured data, screenshots, and setup data from the SD memory card or internal memory. Be careful when deleting data files because they are not sorted by recording date. The data recording dates are listed to the right of file names. Note that dates of data files transferred from the internal memory to an SD memory card are the dates when they were transferred. A scroll bar appears when not all the data can be displayed on the screen.
Data location
Scroll bar
Check box
<Procedure>Use the up and down arrow keys to move to the data you want to delete.
→ Press ENTER to select it. → Press F2 to show a delete confirmation message. → Use the left and right arrow keys to select Yes or NO. → Press ENTER to confirm.
When you select a data file, the corresponding check box is selected. You can delete several data files at once.
DeletePress F2 (delete) to show a confirmation message. Select “Yes” to delete the data.
Internal/SD cardPress F3 to switch between the SD memory card and internal memory. The selected medium is displayed in the upper left of the screen.Switching the screen clears all the selected check boxes.
5.6 Saved Data

5-38 IM CW500-01EN
SpacePress F4 (free space) to display a pop-up screen showing the selected medium information. Press ENTER to return to the data deletion screen.
Item Displayed Information
Capacity Total size Size of used space + free spaceFree size Size of free space only
Possible recording
time
Power onlyEstimated possible recording time when only power parameters are recorded
Power+HarmonicsEstimated possible recording time when power and harmonic parameters are recorded
Max number of saved data* Internal memory only
Measured dataNumber of completed measurements* The maximum number of files that can be saved in the internal memory is three.
Settings/Print
screen
Number of recorded settings and screenshots* The maximum number of files that can be saved in the internal memory is eight.
BackPress F1 (back) to return to the Saved data screen.
5.6 Saved Data

5-39IM CW500-01EN
Transfer dataThis is used to transfer measured data, screenshots, and setup data from the internal memory to an SD memory card. Be careful when transferring data files because they are not sorted by recording date. The data recording dates are listed to the right of file names. Note that dates of data files transferred from the internal memory to an SD memory card are the dates when they were transferred. A scroll bar appears when not all the data can be displayed on the screen.
Data location
Scroll bar
Check box
<Procedure>Use the up and down arrow keys to move to the data you want to transfer. → Press ENTER to select it. → Press F2 to show a delete confirmation message. → Use the left and right arrow keys to select Yes or NO. → Press ENTER to confirm.
When you select a data file to be transferred, the corresponding check box is selected. You can transfer several data files at once.
TransferPress F2 (transfer) to show a confirmation message. Select “Yes” to transfer the data.
SD cardPress F3 (SD memory card) to view the data stored in the transfer destination SD memory card. To return to the transfer data selection screen, press F3 (internal memory) again. Switching the screen clears all the selected check boxes.
5.6 Saved Data

5-40 IM CW500-01EN
Free sizePress F4 (free space) to display a pop-up screen showing the selected medium information. Press ENTER (close) to return to the data transfer screen.Fordetails,see“Space”onpage5-38.
BackPress F1 (back) to return to the Saved data screen.
FormatThis is used to format an SD memory card or internal memory.When you format, all the saved data will be deleted. Save necessary data to a different storage medium before formatting.
Data locationScroll bar
<Procedure>Press F2 to show a format confirmation message. → Use the left and right arrow keys to select Yes or NO. → Press ENTER to confirm.
FormatPress F2 (format) to show a confirmation message. Press ENTER (yes) to start formatting.
5.6 Saved Data

5-41IM CW500-01EN
Internal/SD cardPress F3 (internal memory/SD memory card) to switch the target medium. The selected medium is displayed in the upper left of the screen.
Free sizePress F4 (free space) to display a pop-up screen showing the selected medium information. Press ENTER (close) to return to the format screen.Fordetails,see“Space”onpage5-38.
BackPress F1 (back) to return to the Saved data screen.
5.6 Saved Data

5-42 IM CW500-01EN
Types of Saved DataFile NameFile names are automatically assigned with incrementing file numbers. As the current file number is retained even when the power is turned off, it will keep incrementing until the system is reset or until the maximum count is reached. Even if you change the save destination, files are saved with serial numbers.If a file with the same file number already exists at the save destination, the measured data file name is automatically incremented to the next number. Screenshot data and setup data are overwritten with the same file names. Be careful when you reset the system and start saving the files from number zero and when sharing a single SD memory card between several CW500s. Note that if all the file numbers from 0 to 9999 are used up, measured data files are also overwritten.If files are deleted or the folder or files are renamed from a PC or the like, data operations on the CW500 and analysis using CW500 Viewer will no longer be possible. Do not change folder names or file names from a PC.
Print screenPress PRINT SCREEN to save a screen image as BMP data.
File name: PS- SD 000 .BMP| | |
Dest. codeFile No. Extension
(BMP file)SD: SD memory cardME: Internal memory (000 to 999)
System settingsPress SETUP, and select Saved data and then Save Settings to save the CW500 setup data.
File name: SUP S 0000 .PRE| |
Dest. codeS: SD memory cardM: Internal memory
File No.(0000 to 9999)
5.6 Saved Data
5-43IM CW500-01EN
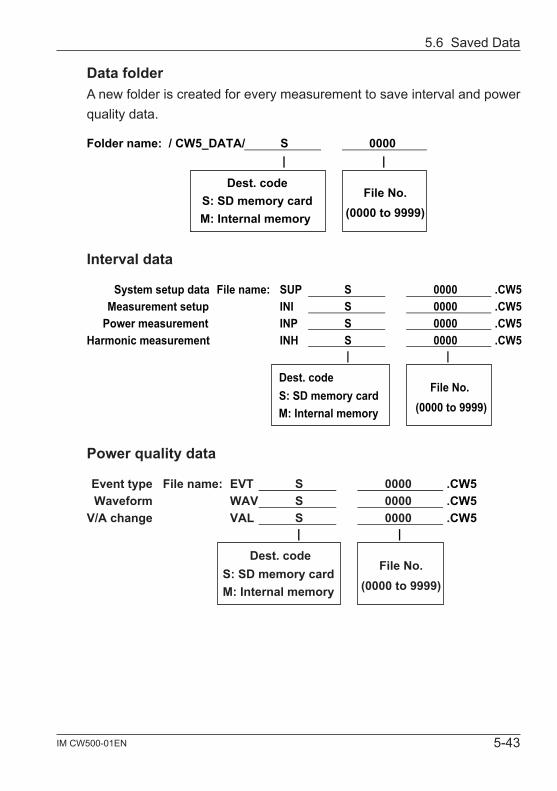
Data folderA new folder is created for every measurement to save interval and power quality data.
Folder name: / CW5_DATA/ S 0000
Dest. code S: SD memory card M: Internal memory
File No. (0000 to 9999)
| |
Interval data
File name: SUP S 0000
File No. (0000 to 9999)
.CW5 Measurement setup INI S 0000 .CW5
Power measurement INP S 0000 .CW5 Harmonic measurement INH S 0000 .CW5
| |
Dest. code S: SD memory card M: Internal memory
System setup data
Power quality data
File name: EVT S 0000
File No. (0000 to 9999)
.CW5 Waveform WAV S 0000 .CW5
V/A change VAL S 0000 .CW5| |
Dest. code S: SD memory card M: Internal memory
Event type
5.6 Saved Data
5-44 IM CW500-01EN
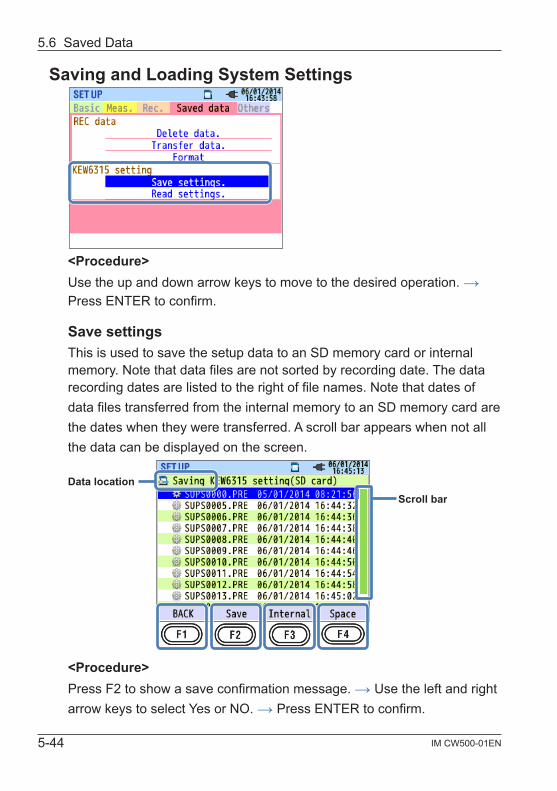
Saving and Loading System Settings
<Procedure>Use the up and down arrow keys to move to the desired operation. → Press ENTER to confirm.
Save settingsThis is used to save the setup data to an SD memory card or internal memory. Note that data files are not sorted by recording date. The data recording dates are listed to the right of file names. Note that dates of data files transferred from the internal memory to an SD memory card are the dates when they were transferred. A scroll bar appears when not all the data can be displayed on the screen.
Data locationScroll bar
<Procedure>Press F2 to show a save confirmation message. → Use the left and right arrow keys to select Yes or NO. → Press ENTER to confirm.
5.6 Saved Data

5-45IM CW500-01EN
SavePress F2 (save) to show a confirmation message. Select Yes to save the system settings to the SD memory card or internal memory.
Internal/SD cardPress F3 (internal memory/SD memory card) to change the save destination. The current save destination is displayed with a mark in the upper left of the screen.
Free sizePress F4 (free space) to display a pop-up screen showing the selected medium information. Press ENTER (close) to return to the data transfer screen.Fordetails,see“Space”onpage5-38.
BackPress F1 (back) to return to the Saved data screen.
Settings That Are SavedBasic Setup Measurement Setup
Settings SettingsWiring
DemandMeasurement interval
Voltage range Inspection cycleVT ratio Target value
Nominal voltageHarmonics
THD (total harmonic distortion) calculation method
Clamp/Current range Allowable rangeCT ratio MAX hold
DC range
Power quality
Hysteresis thresholdFrequency Transient threshold
Swell thresholdOther Setup Dip threshold
Settings Interruption thresholdEnvironment Date format Inrush current threshold
System settings
ID number Flicker Filter coefficient (ramp)
Buzzer Phase advance capacitor Target power factor
5.6 Saved Data

5-46 IM CW500-01EN
Recording setupSettings
REC item HarmonicsPower quality (event)
Record method IntervalStart
Constant rec. Start date/timeStop date/time
Time period rec.
REC period Start—StopREC time slot Start—Stop
Read settingsThis is used to read setup data from an SD memory card or internal memory to change the system settings. Note that data files are not sorted by recording date. The data recording dates are listed to the right of file names. Note that dates of data files transferred from the internal memory to an SD memory card are the dates when they were transferred. A scroll bar appears when not all the data can be displayed on the screen.
Data location
Check box
Scroll bar
<Procedure>Use the up and down arrow keys to move to the data you want to transfer.
→ Press ENTER to select it. → Press F2 to show a read confirmation message. → Use the left and right arrow keys to select Yes or NO. → Press ENTER to confirm.
When you select a data file you want to read, the corresponding check box is selected.
5.6 Saved Data

5-47IM CW500-01EN
ReadPress F2 (read) to show a confirmation message. Select Yes to transfer the data.
Internal/SD cardPress F3 (internal memory/SD memory card) to change the save destination. The current save destination is displayed with a mark in the upper left of the screen.
Free sizePress F4 (free space) to display a pop-up screen showing the selected medium information. Press ENTER (close) to return to the data transfer screen.Fordetails,see“Space”onpage5-38.
BackPress F1 (back) to return to the Saved data screen.
5.6 Saved Data
6-1IM CW500-01EN
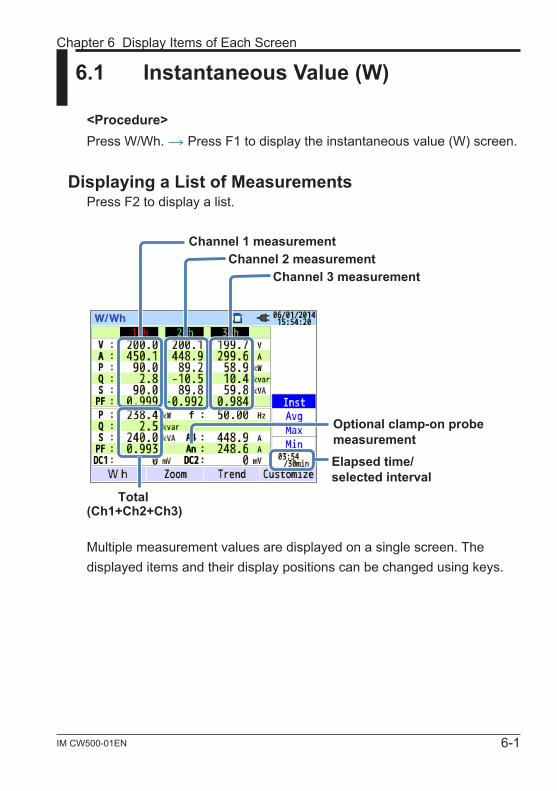
6.1 Instantaneous Value (W)
<Procedure>Press W/Wh. → Press F1 to display the instantaneous value (W) screen.
Displaying a List of MeasurementsPress F2 to display a list.
(Ch1+Ch2+Ch3)Total
Elapsed time/selected interval
Optional clamp-on probemeasurement
Channel 3 measurement Channel 2 measurement
Channel 1 measurement
Multiple measurement values are displayed on a single screen. The displayed items and their display positions can be changed using keys.
Chapter 6 Display Items of Each Screen

6-2 IM CW500-01EN
Display SymbolV1 Phase voltage VL1 Line voltage A Current
P Active power
+ ConsumptionQ Reactive
Power+ Lag
S Apparent power- Regeneration - Lead
PF Power factor
+ Lag f Frequency- Lead
DC1 Analog inputchannel 1 voltage DC2 Analog input
channel 2 voltage
An2 Neutral line current PA3
Voltage-currentphase
difference
+ Lag
C3Phase advance
capacitor capacitance- Lead
1 The V and VL displays can be customized when 3P4W is selected.2 “An” appears only when 3P4W is selected.3 PA and C can be displayed pressing F4 (customization). Line voltages
are converted into phase voltages to determine currents and phase angles for “PA” of 3P3W3A.
Example: Instantaneous values measured under 1P3W-2 (2 systems)
6.1 Instantaneous Value (W)

6-3IM CW500-01EN
Changing the Displayed SystemsUse the left and right arrow keys to change the displayed systems. Items displayed on the screen depend on the selected wiring system and the number of systems. The dotted lines represents the range that can be displayed on a single screen.
1P2W-1 to -4 (single-phase two-wire, system 1, 2, 3, or 4)
1-system
Measured values on
1ch(V1/A1)
Totalvalues
Measured values on
1ch(V1/A2)
Measured values on
1ch(V1/A3)
Measured values on
1ch(V1/A4)
2-system 3-system 4-system
1P3W-1 to -2 (single-phase three-wire, system 1 or 2)
Measured values on
1ch(V1/A1)
Sum of1ch and 2ch of
1 system
Measured values on
2ch(V2/A2)
Sum of1ch and 2ch of
2 systemsTotal values
Measured values on
1ch(V1/A3)
Measured values on
2ch(V2/A4)
Sum of1ch and
2ch of1 system
Sum of1ch and
2ch of2 systems
2-system1-system Σ
1P3W-1 to -2 (three-phase three-wire two-wattmeter, system 1 or 2)1-system 2-system Σ
Measured values on
1ch(V12/A1)
Sum of1, 2 and 3ch of
1 system
Sum of1, 2 and 3ch of
2 systemsTotal values
Measured values on
2ch(V23/A2)
Computedvalues on
3ch
Measured values on
1ch(V12/A3)
Measured values on
2ch(V23/A4)
Computedvalues on
3ch
Sum of1, 2 and
3ch of1 system
Sum of1, 2 and
3ch of2 systems
6.1 Instantaneous Value (W)

6-4 IM CW500-01EN
3P3W3A (three-phase three-wire) 3P4W (three-phase four-wire)
Measured values on
2ch(V23/A2)
Measured values on
3ch(V31/A3)
Measured values on
1ch(V1/A1)
Measured values on
1ch(V12/A1)
Measured values on
2ch(V2/A2)
Measured values on
3ch(V3/A3)
Sum of 1, 2 and 3ch Sum of 1, 2 and 3ch
Changing the Type of Displayed ValuesUse the up and down arrow keys to change the display type between instantaneous values or average, maximum, or minimum within the interval.If the interval is set to 1 second, the instantaneous, average, maximum, and minimum values will all be the same because the display update rate is also 1 second.
Wh (Integrated value)Press F1 (Wh) to switch to a screen that shows integrated values. For details, see section 6.2, “Integrated Value (Wh)” on page 6-9.
ZoomPress F2 (zoom) to switch between zooming in on four selected measurement values or eight selected measurement values. For details, see “Zoom Display” on page 6-5.
Trend graphPress F3 (trend) to switch to a screen that shows the trends of display items in a graph. The display range is from the present to the past 60 minutes. For details, see “Displaying a Trend Graph” on page 6-7.
CustomizePress F4 (customize) to change the displayed items and their display positions. For details, see “Changing Displayed Items and Display Positions”onpage6-8.
6.1 Instantaneous Value (W)

6-5IM CW500-01EN
Zoom DisplayDisplayed item Type of value: Inst/AVG
The selected four or eight measured values are displayed on one screen. Measured values are easier to read because the text is larger than that on the list screen.
Displayed Items
Select the measurement items you want to display. From the list of measurement items in the left menu, select the items you want to display. The right menu will display the measurement item with channels that you can choose from. From the right menu, select the measurement items you want to display.
<Procedure>Use the arrow keys to move to the item you want to display. → Press ENTER to show a selection menu. → Use the arrow keys to select an item. → Press ENTER to confirm or ESC to cancel.
6.1 Instantaneous Value (W)

6-6 IM CW500-01EN
Type of ValueFor the selected measurement item, select whether to display the instantaneous value (INST) or the average (AVG), maximum (MAX), or minimum (MIN) value among the data values that were measured in the interval. If the interval is set to 1 second, the instantaneous, average, maximum, and minimum values will all be the same because the display update rate is also 1 second.<Procedure>Use the arrow keys to move to the type of value you want to display. → Press ENTER to show a pull-down menu. → Use the arrow keys to select a type. → Press ENTER to confirm or ESC to cancel.
List DisplayPress F2 (list) to display all the values in a list.
4-split/8-splitPress F3 (4-split/8-split)tosetthenumberofitemstodisplayononescreen to four or eight.
Displaying a Trend Graph
Elapsed time
Different colors foreach channel
Inst value on ch2 of system 2 Inst value on ch1 of system 2
Inst value on ch2 of system 1 Inst value on ch1 of system 1
You can select measured values and graph their variation with time.
6.1 Instantaneous Value (W)

6-7IM CW500-01EN
Changing the Items Displayed on the Trend GraphUse the up and down arrow keys to change the items to display on the trend graph.
Σ/CHPress F2 (Σ/CH)toswitchbetweentrendgraphsofthesumforeachsystem and the total sum and trend graphs of each channel. The selection of“Σ”or“CH”willapplytoalltrendgraphs.SelectingΣwilldisplaythetrend graph of the sum of each system and the total sum. Selecting CH willdisplaythetrendgraphofeachchannel.Ifyouselect“Σ”whenrmscurrent value (A) is selected for 3P4W, neutral line currents (An) will be displayed on the trend graph.
List DisplayPress F3 (list) to display all the values in a list.
6.1 Instantaneous Value (W)

6-8 IM CW500-01EN
Changing Displayed Items and Display Positions
Currently displayed items After change
You can change the displayed items.<Procedure>Use the up and down arrow keys to move to the item you want to change.
→ Press ENTER to show a pull-down menu. → Use the up and down arrow keys to select a measurement item you want to display. → Press ENTER to confirm or ESC to cancel. → Use the left and right arrow keys to select OK or Cancel. → Press ENTER to confirm or ESC to cancel.
Voltage and current measurement items can only be changed other voltage and current measurement items. Likewise, power and phase advance capacitor measurement items can only be changed to other power and phase advance capacitor measurement items.For details on the symbols displayed on the screen, see “Displaying a List of Measurements” on page 6-2.
6.1 Instantaneous Value (W)

6-9IM CW500-01EN
6.2 Integrated Value (Wh)
<Procedure>Press W/Wh. → Press F1 to display the integrated value (Wh) screen.
Elapsed time
: total amount: sum per system
ΣΣ
The power that flows during a given period is displayed as integrated power.
Display Symbol
WP Active energy
+ ConsumptionWQ Var hours
+ LagWS Volt-ampere
hours+ Consumption
– Regeneration – Lead – Regeneration

6-10 IM CW500-01EN
Changing the Displayed SystemsUse the left and right arrow keys to change the displayed systems. For the relationship between wiring and the number of systems, see “Wiring System Settings” in section 5.2.
Changing the Displayed ChannelsUse the up and down arrow keys to change the displayed channels. For the relationship between wiring and channels, see “Wiring System Settings” in section 5.2.
DemandPress F1 (demand) to switch to a screen that shows demand values. For details, section 6.3, “Demand,” on the next page.
6.2 Integrated Value (Wh)

6-11IM CW500-01EN
6.3 Demand
<Procedure>Press W/Wh. → Press F1 to display the demand screen. → Use the up and down arrow keys to display the measured value, shift in specific period, or demand change screen
Displaying Measured ValuesUse the up and down arrow keys to display the measured value screen.
The demand is an average power over a given period. When the estimated value exceeds the target value during demand measurement, a warning buzzer sounds at each inspection cycle.
Display ItemsRemaining time
(time left)Demand interval is counted down.
DEM Target Demand target value.
DEM Guess
Estimated demand value after the measurement interval of the current load.(Present value×Measurement interval) / Elapsed timeis calculated as time elapses.
DEM PresentDemand value (average power) within a demand interval.(WP+ x 1 hour) / Interval is calculated as time elapses.
DEM MaxRecorded date
The maximum demand recorded during a measuring period is displayed. The display is updated each time the measured value exceeds the maximum demand.

6-12 IM CW500-01EN
Instantaneous Value (W)Press F1 (W) to show instantaneous values on the screen. For details, see section 6.1, “Instantaneous Value (W).”
Shifts in Specific Period
Display ItemsRemaining time
(time left)Demand interval is counted down.
DEM PThe present value as a percentage of the target value.
Present value Target value is displayed.
DEM GThe estimated value as a percentage of the target value.Estimated value
Target value is displayed.
Interval
Saved point
Estimated value
Demand value(Present)
Target value
Time left
Inspectioncycle
Inspectioncycle
Inspectioncycle
A warning buzzer sounds when the estimated value exceeds the target value after the inspection cycles have been completed.
6.3 Demand

6-13IM CW500-01EN
Demand change
Cursor
Scroll bar
Use the left and right arrow keys to move the cursor and scroll the graph horizontally. The white area of the scroll bar shows the entire measurement period while the dark orange area shows the present display range.
Display ItemsDemand
measurement/Recorded date
Demand value at the cursor is displayed with the recorded date and time.
End of demand/Most recent recording time
Demand value
Start of demandRec start time
Target value
Most recentDemand value
Max. measured demand (displayed on the measurement screen)
Start of demand and recording start date and time are displayed when the graph does not fit on one screen.
6.3 Demand

6-14 IM CW500-01EN
6.4 Vector
Press the vector key.
Measured values
1 For 3P3W3A, rms line voltages are displayed.2 Phase angle is displayed using the V1 phase as the reference (0°).
Vector display
V: rms voltage1 /Phase angle2 A: rms current /Phase angle2
Solid circle line: Maximum voltage/current range
Vector displayrms voltage (solid line)rms current (dotted line)
±0°±180°
Phase angle (leading)-0° to –180°
Phase angle (lagging)+0° to +180°
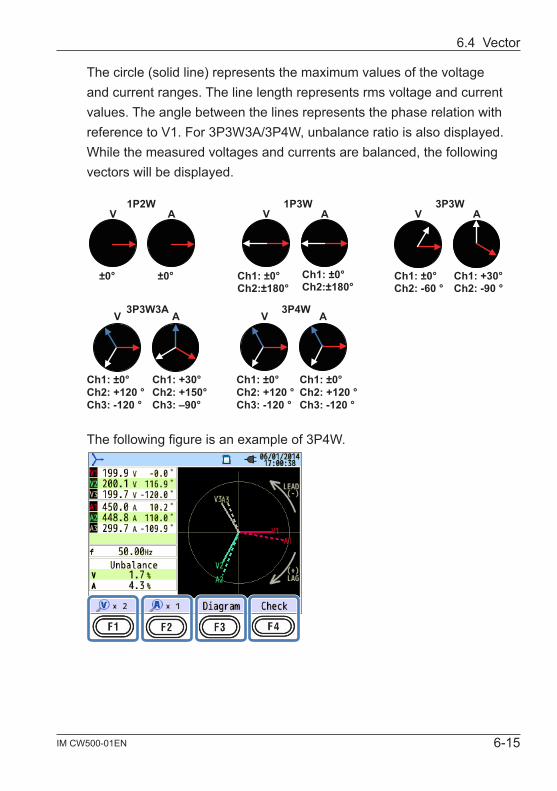
6-15IM CW500-01EN
The circle (solid line) represents the maximum values of the voltage and current ranges. The line length represents rms voltage and current values. The angle between the lines represents the phase relation with reference to V1. For 3P3W3A/3P4W, unbalance ratio is also displayed. While the measured voltages and currents are balanced, the following vectors will be displayed.
3P3W3A
Ch2: -90 °Ch1: +30°
Ch2: -60 °Ch1: ±0°
Ch2:±180°Ch1: ±0°
Ch2:±180°Ch1: ±0°±0°±0°
AV3P3W
AV1P3W
AV1P2W
Ch3: -120 °Ch2: +120 °Ch1: ±0°
Ch3: -120 °Ch2: +120 °Ch1: ±0°
Ch3: –90°Ch2: +150°Ch1: +30°
Ch3: -120 °Ch2: +120 °Ch1: ±0°
AV 3P4WAV
The following figure is an example of 3P4W.
6.4 Vector

6-16 IM CW500-01EN
V × MagnificationPress F1 (V×magnification) to set the magnification of the length of voltage vector lines.
1x 2x 5x 10x
A × MagnificationPress F2 (A×magnification) to set the magnification of the length of current vector lines.
1x 2x 5x 10x
Wiring DiagramsPress F3 (diagram) to show the wiring diagram of the selected wiring system. For details, see “Wiring Diagram” in section 5.2.
Wiring CheckPress F4 (wiring check) to display the results of the wiring check.If measuring at site with extremely poor power factor, this check may fail even if the wiring is correct. For details, see “Wiring Check” in section 4.2.
6.4 Vector

6-17IM CW500-01EN
6.5 Waveform
Press the waveform key.
Measured valuesV: rms voltage*A: rms current
* For 3P3W3A, rms line voltages are displayed.
Waveforms with different colors for each channel
Voltage and current waveforms are displayed for up to 10 cycles at 50 Hz and up to 12 cycles at 60 Hz. If switched to the waveform screen, the scale is automatically set so that the waveform amplitude and period are displayed at their maximum size.
Changing the Displayed WaveformsUse the up and down arrow keys to change the displayed waveforms.

6-18 IM CW500-01EN
V × MagnificationPress F1 (V×magnification) to set the vertical magnification of the voltage waveform.0.1x, 0.5x, 1x, 2x, 5x, 10x
0.1x 0.5x 1x 2x 5x 10x
A × MagnificationPress F2 (A×magnification) to set the vertical magnification of the current waveform.0.1x, 0.5x, 1x, 2x, 5x, 10x
0.1x 0.5x 1x 2x 5x 10x
t × MagnificationPress F3 (t×magnification) to set the time-axis (horizontal) magnification.1x, 2x, 5x, 10x
1x 2x 5x 10x
full scalePress F4 (full scale) to set a magnification that displays the voltage and current waveforms at their maximum size.
6.5 Waveform

6-19IM CW500-01EN
6.6 Harmonics
Press the harmonic analysis key.
Displaying Harmonics on a Bar GraphPress F1 (graph) .
Display Symbol
VVoltage
* For 3P3W3A, rms line voltages are displayed.
A Current
THDVoltage total harmonic distortion is displayed while “V” is displayed. Current total distortion factor is displayed while “A” is displayed. Total harmonic distortion is calculated according to the selected THD calculation method.
P Active power of each channel
+ InΣP
System total/total sum
Active power
+ In
— Out — Out

6-20 IM CW500-01EN
Bar Graph Display
Harmonic analysis up to the 50th order
Percentage content
In the above example, “Linear” and “full-scale” are selected. In this case, the upper limit of the percentage content is “100%” and all harmonics, 1st to 50th, are displayed on one screen.
Display ItemsPercentage
contentPercentage content of each harmonic in reference to the
fundamental waveform.
Percentagecontent
Harmonic analysis up to the 15th orderScroll bar
In the above example, “log” and “zoom” are selected. In this case, the upper limit of the percentage content is “10 %” and harmonics up to the 15th are displayed on one screen. Press the left and right arrow keys to scroll the display range. The fundamental waveform does not scroll. The dark orange area of the scroll bar shows the present display range.
6.6 Harmonics
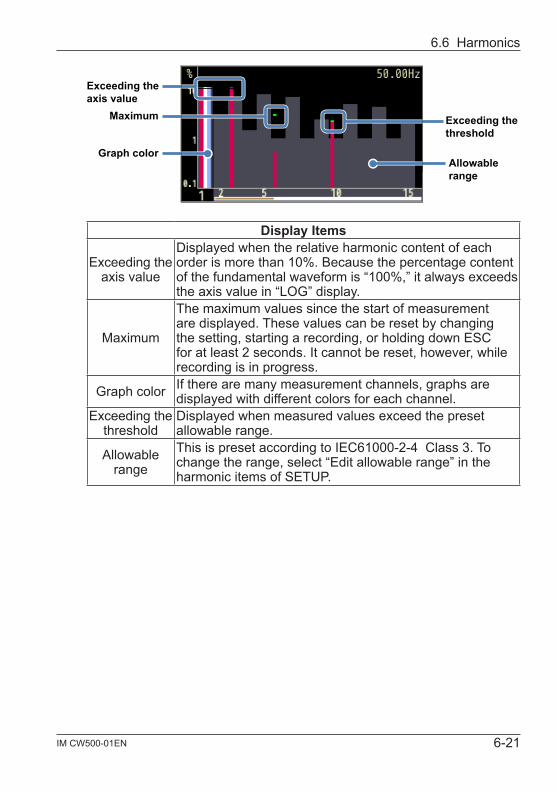
6-21IM CW500-01EN
Exceeding the axis value
Exceeding thethreshold
Maximum
Graph colorAllowablerange
Display Items
Exceeding the axis value
Displayed when the relative harmonic content of each order is more than 10%. Because the percentage content of the fundamental waveform is “100%,” it always exceeds the axis value in “LOG” display.
Maximum
The maximum values since the start of measurement are displayed. These values can be reset by changing the setting, starting a recording, or holding down ESC for at least 2 seconds. It cannot be reset, however, while recording is in progress.
Graph color If there are many measurement channels, graphs are displayed with different colors for each channel.
Exceeding the threshold
Displayed when measured values exceed the preset allowable range.
Allowable range
This is preset according to IEC61000-2-4 Class 3. To change the range, select “Edit allowable range” in the harmonic items of SETUP.
6.6 Harmonics
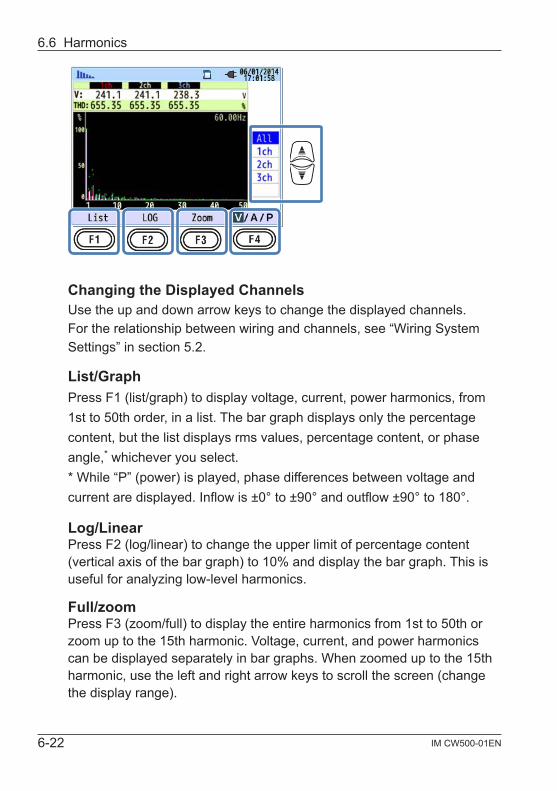
6-22 IM CW500-01EN
Changing the Displayed ChannelsUse the up and down arrow keys to change the displayed channels. For the relationship between wiring and channels, see “Wiring System Settings” in section 5.2.
List/GraphPress F1 (list/graph) to display voltage, current, power harmonics, from 1st to 50th order, in a list. The bar graph displays only the percentage content, but the list displays rms values, percentage content, or phase angle,* whichever you select.* While “P” (power) is played, phase differences between voltage and currentaredisplayed.Inflowis±0°to±90°andoutflow±90°to180°.
Log/LinearPress F2 (log/linear) to change the upper limit of percentage content (vertical axis of the bar graph) to 10% and display the bar graph. This is useful for analyzing low-level harmonics.
Full/zoomPress F3 (zoom/full) to display the entire harmonics from 1st to 50th or zoom up to the 15th harmonic. Voltage, current, and power harmonics can be displayed separately in bar graphs. When zoomed up to the 15th harmonic, use the left and right arrow keys to scroll the screen (change the display range).
6.6 Harmonics

6-23IM CW500-01EN
V/A/P/ΣPPressF4(V/A/P/ΣP)toselecttheharmonicanalysisparameter(voltage,current, power, or system total or total sum power).
Displaying a List of HarmonicsPress F1 to display a list of harmonics.
The voltage, current, rms value of power harmonics, percentage content, and phase angle, from 1st to 50th order, in a list.
Display SymbolV Voltage1 A Current
P2 Active power of each channel
+ In ΣP2 System total/total sumActive power
+ In– Out – Out
1 For 3P3W3A, rms line voltages are displayed.2 The letters and numbers displayed at the top represent the displayed
parameter and the channel or system number. If there is a space between the letter P and the number, only the system number is displayed. In this case, the measured values are the sum of each system. If only P is displayed, the measured values are total sums.
6.6 Harmonics

6-24 IM CW500-01EN
Changing the Displayed Harmonic OrdersUse the up and down arrow keys to vertically scroll the screen thereby changing the displayed orders.
Graph/ListPress F1 (graph/list) to display voltage, current, power harmonics, from 1st to 50th order, in bar graphs. On the bar graph screen, only the percentage content is displayed.
Percentage Content, Phase Angle, RMS Value (Power)Press F2 (percentage content/phase angle/rms value (power) to change the measurement items displayed in the list. If V (voltage) or A (current) is selected, select percentage content, phase angle (in reference to V1 (0°)), orrmsvalue.IfP(ΣP)(power)isselected,selectpercentagecontent,phase angle (current-to-voltage difference between channels), or power.
V/A/P/ΣPPressF4(V/A/P/ΣP)toselecttheharmonicanalysisparameter(voltage,current, power, or system total or total sum power).
6.6 Harmonics

6-25IM CW500-01EN
6.7 Power Quality
Press QUALITY.
Factors That Degrade Power Quality and SymptomsEvent Waveform Symptoms Adverse Effects
Harmonics
The device control circuit uses an inverter (capacitor input full-wave rectifier) and thyristor (phase-control) circuits. These circuits cause current distortion, which generates harmonics.
Harmonic currents can cause phase advance capacitor and reactor burnouts, transformer buzz, circuit breaker malfunction, flicker in TV images, and noises in audio devices.
Voltageswell
RMS
Inrush current occur when the power line switch is turned on causing the voltage to increase temporarily.
Equipment, robots, and other machines may shut down, or PCs and office appliances may be reset.
Voltagedip
RMS
Inrush current occurs when motors and other loads are applied causing the current to dip.
Voltage interruption
RMS
Lightning and other electric surges interrupt the power supply.
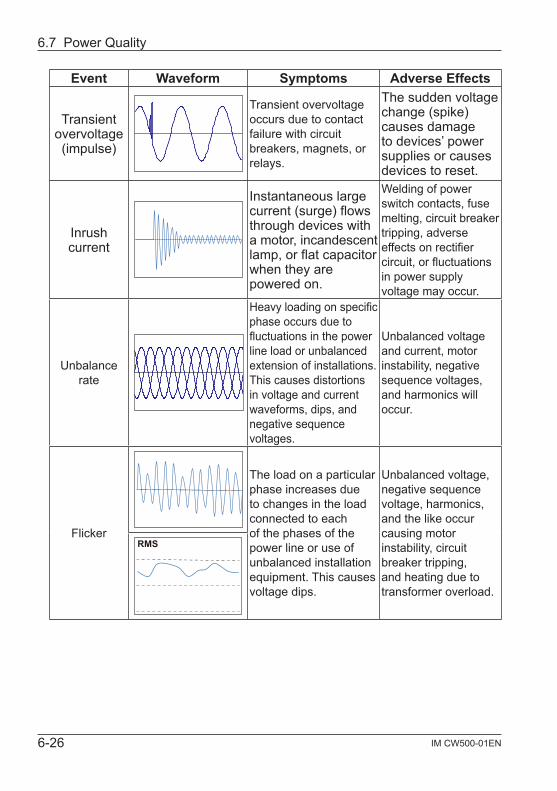
6-26 IM CW500-01EN
Event Waveform Symptoms Adverse Effects
Transient overvoltage (impulse)
Transient overvoltage occurs due to contact failure with circuit breakers, magnets, or relays.
The sudden voltage change (spike) causes damage to devices’ power supplies or causes devices to reset.
Inrush current
Instantaneous large current (surge) flows through devices with a motor, incandescent lamp, or flat capacitor when they are powered on.
Welding of power switch contacts, fuse melting, circuit breaker tripping, adverse effects on rectifier circuit, or fluctuations in power supply voltage may occur.
Unbalance rate
Heavy loading on specific phase occurs due to fluctuations in the power line load or unbalanced extension of installations. This causes distortions in voltage and current waveforms, dips, and negative sequence voltages.
Unbalanced voltage and current, motor instability, negative sequence voltages, and harmonics will occur.
Flicker
The load on a particular phase increases due to changes in the load connected to each of the phases of the power line or use of unbalanced installation equipment. This causes voltage dips.
Unbalanced voltage, negative sequence voltage, harmonics, and the like occur causing motor instability, circuit breaker tripping, and heating due to transformer overload.
RMS
6.7 Power Quality

6-27IM CW500-01EN
Displaying Recorded EventsPress F1 to display the event screen.
Event symbol
Measured value
Display Symbol
Event symbol
Swell
Dip
Interruption
Transient
Inrush current
Start End
Measured value
Instantaneous values recorded when the start and end of an event were detected. If the interval between the start and end of an event is short, the measured value at the end of the event may not be displayed. To check the rms values before and after the detection, check rms variation data. For the measured values of a long-lasting event, check the interval measurement data. For power quality analysis, short interval recording is effective.
Time of occurrence
The times recorded when the start and end of an event were detected.
Event Detection on Poly-Phase SystemsInterruptionThe start of an event is detected when the voltages of all the relevant channels for the wiring system are interrupted. The end of the event is detected when the interruption on any of the channels is restored.Swell, Dip, Inrush Current, and TransientThe start of an event is detected when any of the voltages of the relevant channels for the wiring system meets the event condition. The end of the event is detected when the condition is no longer met by any of the channels.
6.7 Power Quality

6-28 IM CW500-01EN
How Swell, Dip, Inrush Current, and Transient Are MeasuredEvents are detected from the rms values of single waveforms that overlap each other at every half period. If an event is first detected in the rms value of a single waveform, the beginning of that waveform is considered the start of the event. If the event is no longer detected in the rms value of a later waveform, the beginning of that waveform is considered the end of the event. The detected event is assumed to continue from the start to the end.
Rms value (1)
Rms value (2)
Rms value (3) Rms value (5) Rms value (7) Rms value (9)
Rms value (4) Rms value (6) Rms value (8)
Measuredwaveform
Rmswaveform
Start of dip End of dip
Duration
Rms value (1)
Rms value (2)
Rms value (3) Rms value (5) Rms value (7) Rms value (9)
Rms value (4) Rms value (6) Rms value (8)
Measuredwaveform
Rms waveform
Hysteresis
Start of swell
Duration
End of swell
Threshold
HysteresisThreshold(4)
(5)
(7) (8) (9)(1) (2) (3)
(4)(5)
(6)(7) (8) (9)(1) (2) (3)
(6)
Example of dip detection* Interruption is detected with the same method.
Example of swell detection* Inrush current is detected with the same method.
6.7 Power Quality

6-29IM CW500-01EN
Transient DetectionVoltage waveforms are monitored at approximately 40 ksps without gaps to detect transients every approximately 200 ms. The beginning of a 200 ms period where the first transient is detected is regarded as the start of the event. The beginning of a later 200 ms period where a transient is no longer detected is regarded as the end of the event. The detected event is assumed to continue from the start to the end.
Example of Transient Detection Threshold
Start of transient Approx. 200 msDuration
End of transient
Measuredwaveform
Saved DataWhen an event occurs, the event type, the start and end times, and the measured values are recorded together with the event waveform and rms variation data. Note that for the event waveform, only the 200 ms period within the 1-second data update interval is recorded.
Event WaveformThe voltage and current waveform data of all channels in the 200 ms period (10 cycles for 50 Hz, 12 cycles for 60 Hz) that includes the eventdataisrecorded(8192points).Ifdifferenteventsoccurwithinthe 1-second data update interval, only the waveform data of the 200 ms period containing the highest priority event is recorded. If several events of the same time occur within the same period, the one with the highest (deepest) value is recorded. If the values are also the same, the one lasting the longest is recorded. There are no priority levels between connected channels.[Highest priority]→Voltage transient→Interruption→Dip→Swell→Inrush current
6.7 Power Quality

6-30 IM CW500-01EN
Rms VariationThe rms voltage and current (resolution: half-cycle) variation data of all channels is recorded in the 1-second data update interval that includes the event data.
Example of a 800 ms dip detection (saved data)
Measuredwaveform
Event start waveform (approx. 200 ms)
Event end waveform (approx. 200 ms)
Rms waveform
Event start rms value variation(approx. 1 s)
Even end rms valuevariation (approx. 1 s)
Changing the Displayed AreaUse the up and down arrow keys to vertically scroll the screen thereby changing the displayed area.
FlickerPress F1 (flicker) to switch to a screen that shows flicker values. For details, see “Displaying a List of Flicker Measurements” on the next page.
6.7 Power Quality

6-31IM CW500-01EN
Event DetectionPress F2 (detection) to toggle the type of displayed events.
All eventsSwell Dip INT Transient Inrush
current
Displaying a List of Flicker Measurements<Procedure>Press F1 to display the flicker screen. → Use the up and down arrow keys to display a screen showing V: List display/Pst(1min): Trend graph/Plt: Transitional change.
Time left
If variable loads, such as an arc furnace, are connected, voltages may vary and cause lights to flicker. This phenomenon is called voltage flicker, and its severity level is expressed by Pst and Plt.
Display SymbolRemaining
time (time left)The countdown time until a Pst calculation completes. This usually takes about 10 minutes.
V Phase voltage.* For 3P3W and 3P3W3A, rms line voltages are displayed.
f Frequency
Pst,1min Severity of short-term flicker measured over 1 minute. This is useful for power quality survey or study.
Pst Severity of short-term flicker measured over 10 minutes.
Pst,MAXThe maximum Pst value measured since the start of measurement. The display is updated every time the measured value exceeds the previous maximum value.
6.7 Power Quality

6-32 IM CW500-01EN
Display SymbolPlt Severity of long-term flicker measured over 2 hours.
Plt,MAXThe maximum Plt value measured since the start of measurement. The display is updated every time the measured value exceeds the previous maximum value.
EventPress F1 (event) to switch to a screen that shows recorded events. For details, see “Displaying Recorded Events” on page 6-26.
Displaying the Trend Graph of “Pst, 1 min”
Pst,1minMost recent
Elapsed time
Maximum
Pst,1min
The “Pst, 1min” measured in the recent 120 minutes is displayed on the trend graph.
Display Symbol
Pst,1min Severity of most recent short-term flicker measured over 1 minutes.
MaximumThe maximum “Pst, 1min” value measured since the start of measurement. The display is updated every time the measured value exceeds the previous maximum value.
Elapsed timeThe most recent measured value is displayed at the right end (0 minutes) and shifts to left as time passes. Measured values in the recent 120 minutes can be displayed.
6.7 Power Quality

6-33IM CW500-01EN
Displaying the Plt Trend Graph
Cursor
Scroll bar
Use the left and right arrow keys to move the cursor and scroll the Plt trend graph horizontally. The dark orange area of the scroll bar shows the present display range.
Display ItemsMeasured Plt/Recorded date
The Plt of each channel at the cursor is displayed with the recorded date and time.
Maximum
Measured Plt
Most recent Plt
Rec start time Most recent recording time
The recording start date and time are displayed when the Plt trend graph does not fit on one screen.
Display Symbol
MaximumThe maximum Plt value measured since the start of measurement. The display is updated every time the measured value exceeds the previous maximum value.
6.7 Power Quality

7-1IM CW500-01EN
7.1 Other Features
Data HoldPressing DATA HOLD stops display updating regardless of the measurement condition. An icon appears at the top of the screen. Pressing DATA HOLD again causes the icon to disappear and resumes display updating. Even when data is being held, you can switch the display to view the measured values of other screens. Even when display updating is stopped during recording, the CW500 continues to record measurement values and events.
Key LockHolding down DATA HOLD for 2 seconds causes an icon to appear on the screen and disables all keys except the LCD key. Holding down the key again for 2 seconds causes the icon to disappear and clears key lock.
Turning Off the BacklightPress LCD to turn off the backlight. Pressing a key other than the power key turns on the backlight.
Backlight Auto-OffWhen Connected to an AC Power SupplyIf you do not perform any operations for 5 minutes, the backlight automatically turns off. To turn it back on, press any key other than the power key. You can also disable the backlight auto-off function by selecting Disable auto-off from the SETUP menu.During Battery OperationTo reduce power consumption, the brightness of the backlight while operating on batteries is about half that while operating on AC power. In addition, during battery operation, if you do not perform any operations for 2 minutes, the backlight automatically turns off. To turn it back on, press any key other than the power key. Auto-off cannot be disabled during battery operation.
Chapter 7 Other Features

7-2 IM CW500-01EN
Auto Power OFFWhen Connected to an AC Power SupplyThe CW500 automatically turns off if you do not perform any operations for about 5 minutes. It does not turn off while the CW500 is recording. To turn the power on again, press the power key. You can also disable the this function by selecting Disable auto-off from the SETUP menu.During Battery OperationThe CW500 automatically turns off if you do not perform any operations for about 5 minutes. It does not turn off while the CW500 is recording. To turn the power on again, press the power key. Auto power off cannot be disabled during battery operation.
Auto Current RangeThe current ranges of clamp-on probes are automatically switched according to the measured rms values. This function cannot be enabled while recording power quality events. The range shifts to the next higher range when the input exceeds 300% peak of the next lower range and shifts to the next lower range if the input falls below 100% peak of the next lower range. However, the display is fixed to the next higher range.
Sensor DetectionIf sensor detection is enabled from the SETUP menu, current clamp-on probes connected to the CW500 are automatically detected.When the CW500 starts, it automatically checks the connected current clamp-on probes to the current clamp-on probe settings of the previous measurement.
Power Failure RecoveryIf the CW500 shuts down while it is recording due to a power failure, when the power supply recovers, the CW500 automatically resumes recording.
Print ScreenPressing PRINT SCREEN captures the current screen to a BMP file. The file size is about 77 KB.
7.1 Other Features

7-3IM CW500-01EN
Setup MemoryThe CW500 retains all the settings used in the previous measurement and starts in the same condition when the power is turned on.The default settings are used when the CW500 is turned on the first time after purchase.
Quick start guidePress START/STOP to run the Quick start guide. You can easily start recording by setting the items by following the instructions displayed on the screen.
Status LEDThe LED blinks red when the backlight is off and lights green when recording is in progress regardless of the backlight state. The LED blinks green when the CW500 is standing by.
7.1 Other Features

8-1IIM CW500-01EN
8.1 Transferring Data to a PC
Data saved in an SD memory card or internal memory can be transferred to a PC through a USB connection or an SD memory card reader.
Transfer MethodUSB Card reader
SD memory card data (file) Yes but not recommended Yes
Internal memory data (file) Yes ---------
The USB data transfer rate on the CW500 is about 320 MB/hour. Transferring large data files over a USB connection may take a long time. We recommend that you use an SD memory card to transfer large data files to a PC.
For information on how to handle SD memory cards, refer to the user’s manual provided with the card. To prevent problems, only save data files of the CW500 to the SD memory card. Delete unnecessary files in advance.
USB
SD memory card
Internal memory/ SD memory card data
SD memory card data
Chapter8ConnectingtoPeripheralDevices

8-2 IM CW500-01EN
8.2 Signal Control with External Devices
Connecting I/O Terminals
CAUTION• Apply voltage in the rangeof ±11V to the input terminals
and in the range of 0 to 30 V (50 mA, 200 mW) to the output terminals. Exceeding these ranges can damage the CW500.
• TheL terminalsofeachchannelareconnected internally.Donot simultaneously connect different ground levels to the L terminals.
Input Terminals Output Terminals
Do not mistake input terminals for output terminals or vice versa.
Connectable signal wire sizes are as follows.Suitablewire:Singlewireφ1.2mm(AWG16) Stranded wire 1.25 mm2(AWG16)stranddiameter0.18mm
or moreUsablewire: Singlewireφ0.4to1.2(AWG26to16) Stranded wire 0.2 to 1.25 mm2 (AWG24 to 16) strand
diameter0.18mmormoreStandard length of stripped wire: 11 mm

8-3IIM CW500-01EN
<Procedure>
1 Open the connector cover.
2 While pressing the rectangular area above the appropriate terminal with a flat-bladed screwdriver or the like, insert a signal wire.
3 Remove the screwdriver to fix the wire in place.
Signal wire
Flathead screwdriver or the like
Input TerminalsInput terminals are used to monitor voltage output signals from temperature sensors or the like. They are useful when you need to simultaneously measure a signal output from another device and the anomalies that occur on that power supply. Number of channels: 2 Inputresistance:Approx.225.6kΩ
8.2SignalControlwithExternalDevices

8-4 IM CW500-01EN
Output TerminalsOutput terminals transmit low level signals while a power quality event is occurring. The terminals are normally at high level. If the event lasts less than 1 second, the output signal is set to low level for 1 second.The output target event is the event with the highest priority among the specified events. If you want the output to synchronize with a lower priority event, turn off events that are higher priority than that event. For details,see“PowerQuality(Event)ThresholdSettings”inpage5-18.Theevents are arranged in order by priority below.[Highest priority]→Transient→Interruption→Dip→Swell→Inrush current
+5V
H
L
OUTPUT
Output format: Open collector outputMaximum input: 30 V, 50 mA, 200 mWOutput voltage: Hi 4 to 5 V Lo 0 to 1 V
8.2SignalControlwithExternalDevices

8-5IIM CW500-01EN
8.3 Supplying Power through Measurement Lines
If AC power cannot be supplied from an outlet, you can use a power supplyadapter(98031)tosupplypowerthroughvoltageprobes.
WARNING• If theprobeand themeasurement categoryof themainunit
are mismatched, the lower measurement category takes precedence. Be sure to check that the measurement voltage and rating are matched.
• Never connect voltageprobes that arenot necessary for themeasurement that you are taking.
• Donotconnecttothemeasurementlinewhentheprobeisnotconnected to the main unit.
• Never remove theprobe from themainunit connectorwhilemeasuring (power running from the measurement line).
• Besuretoconnecttothesecondarysideofthecircuitbreaker.The current capacity is large on the primary side and is dangerous.
• Connecttheprobeaftercheckingthattheinstrumentisturnedoff.
• Connect themainunit endof the cord first. Firmly insert theprobe up to the base.
• If theprobecracksor themetalpartsbecomeexposed,stopusing it immediately.

8-6 IM CW500-01EN
To connect the power supply adapter to the instrument, follow the procedure below.
1 Check that the power supply adapter’s power switch is off.2 Connect the power supply adapter plug to the VN and V1 terminals of
the CW500.
3 Connect the power supply adapter power plug to the power inlet of the CW500.
4 Connect voltage probes to the VN and V1 terminals of the power supply adapter.
5 Connect the voltage probe’s alligator clip to the circuit under measurement.
6 Turn on the power supply adapter’s power switch.7 Turn on the CW500 power switch.
To remove the power supply adapter from the CW500, reverse the steps 1 to 7 above.For details on how to operate the power supply adapter, see the user’s manual for the adapter.
98031 Power Supply AdapterFuse rating: 500 mAAC/600 V,Fast acting, Φ6.3 x 32 mm
1 /6
23
4
5
7
240 V or less
8.3SupplyingPowerthroughMeasurementLines

9-1IM CW500-01EN
9.1 PC Software for Configuration and Analysis
The software “CW500VIewer” can be used to analyze the data recorded on the CW500 and also configure the CW500. You can automatically create graphs and lists from recorded data with a single click, convert recorded data to CSV format, centrally manage setup data and recorded data of several CW500s, and output data expressed in crude oil and CO2 equivalent values in reports.
To use CW500Viewer, install the application and USB driver in your PC according to the installation manual provided as a PDF file.
• Interface The CW500 is equipped with a USB interface. Transmission mode: USB Ver 2.0 USB communication can be used to perform the following operations.• DownloadfilesintheCW500internalmemorytoaPC• ConfiguretheCW500fromaPC• RetrievemeasuredvaluesinrealtimefromtheCW500anddisplay
them and a graph on the PC• SystemRequirements• OperatingSystem Windows7,Windows8,Windows10• DisplayScreen 1024×768dots,65536colorsormore• Harddiskspace 1 GB or more (including Framework)• .NETFramework(3.5orhigher)
Chapter 9 PC Software for Configuration and Analysis

9-2 IM CW500-01EN
• Trademarks• Windows is a registered trademarksor trademarkofMicrosoft
Corporation in the United States and/or other countries.
The latest software is available for download from the following webpage.http://www.yokogawa.com/ymi/
9.1 PC Software for Configuration and Analysis

10-1IM CW500-01EN
10.1 Troubleshooting
If you suspect that the CW500 is malfunctioning, check the following items. If your problems is not listed, contact your nearest YOKOGAWA dealer.
Symptom CheckThe power does not turn on even when the power key is pressed. (Nothing is displayed on the LCD.)
When operating on AC power• Checkthatthepowercordisconnectedproperlytoan
outlet.• Checkthatthepowercordisnotbroken.• Checkthatthesupplyvoltageiswithintheallowable
range.When operating on battery power• Checkthatthebatteriesaresetwithproperpolarity.• IfyouareusingAAnickel-metalhydride(Ni-MH)
batteries, check that they are charged sufficiently.• IfyouareusingAAalkalinebatteries,checkthatthe
batteries are not flat.If you problem is still not solved• DisconnecttheACpowercord,andremoveallthe
batteries. Load the batteries again, connect the AC power, and turn on the power. If the CW500 still fails to turn on, it may be malfunctioning.
Keys do not work. • Checkthatkeylockisnotactivated.• Checkthevalidkeysofeachmeasurementrangein
this manual.Measured values are not displayed.Measured values are unstable or inaccurate.
• Checkthatthefrequencyappliedtovoltagechannel1is within the guaranteed accuracy range. It should be between 40 to 70 Hz.
• Checkthatthevoltageprobesandcurrentclamp-onprobes are connected properly.
• CheckthattheCW500settingsandwiringareappropriate for the measurement line.
• Checkthatthecurrentclamp-onprobeandclampsettings are correct.
• Checkthatthevoltageprobesarenotbroken.• Checkwhethernoiseisintroducedintheinputsignal.• Checkthattherearenostrongelectromagneticfields
nearby.• Checkthatthemeasurementenvironmentmeetsthe
specifications of the CW500.
Chapter 10 Troubleshooting

10-2 IM CW500-01EN
Symptom CheckData cannot be saved to internal memory.
• Checkthenumberoffilesthathavebeensaved.• Check whether an SD memory card is inserted. If an SD
memory card is inserted, data cannot be saved to internal memory.
Data cannot be saved to SD memory cards.
• CheckthatanSDmemorycardisinsertedproperly.• CheckthattheSDmemorycardisformatted.• CheckthatthereisfreespaceontheSDmemorycard.• Checkthenumberoffilesthathavebeensavedtothe
SD memory card and the capacity.• CheckthattheSDmemorycardiscompatiblewiththe
CW500.• CheckthattheSDmemorycardoperatesonknown
hardware.Downloading and configuration are not possible through USB communication.
• Check that the CW500 is connected properly to the PC with a USB cord.
• Usethecommunicationapplicationsoftware(CW500 Viewer) to check that the connected device is displayed. If it is not, the USB driver may not be installed properly. See the separate installation manual, and reinstall the USB driver in the PC.
Self-diagnosis frequently displays “NG.”
• IfitisanSDmemorycardfailure,check“Datacannot be saved to SD memory cards.” For other failures, disconnect the AC power cord, and remove all the batteries. Load the batteries again, connect the AC power, and turn on the power. Then, perform the self-diagnosis again. If “NG” still appears, the CW500 may be malfunctioning.
10.1 Troubleshooting

10-3IM CW500-01EN
10.2 Error Messages and Corrective Actions
Messages may appear on the screen during operation.This section describes the error messages and how to respond to them.
Message Description and Corrective ActionNo SD card. • CheckthatanSDmemorycardisinsertedproperly.
For details, see “Inserting and Removing the SD Memory Card” in the Getting Started Guide.
Check the amount of free space in the SD card.Check the amount of free space in the SD card.
• CheckthefreespaceontheSDmemorycard.If there is not enough free space, delete files or format the SD memory card, or use another SD memory card that has been formatted on the CW500. For details, see “Recorded Data Operation” in section 5.6.
Failed to detect sensors. Check the connection of the sensor(s).
• Checkthatcurrentprobesaresecurelyconnectedtothe CW500.
• Ifyoususpectamalfunction,checkwiththefollowingprocedure.
Connect the current clamp-on probe that failed to a channel that detection was successful, and test again. If the same channel fails again, the instrument may be malfunctioning. If detection fails on the channel connected to the current clamp-on probe that failed to be detected the last time, the current clamp-on probe may be malfunctioning. If a malfunction is found, stop using the CW500 or probe immediately.
Battery level is low. Powering off…
• UseACpower,orreplacetheAAalkalinebatteries(LR6) with new ones or the AA nickel-metal hydride (Ni-MH) batteries with recharged ones. For details, see “Installing Batteries” in the Getting Started Guide.
Not having free space on the internal memory. Format the memory or delete unnecessary files.
• Checkthefreespaceintheinternalmemoryandthenumber of saved files. Up to three measured data files and eight other files can be saved to the internal memory. If there is not enough free space, delete files or format the memory. For details, see “Recorded Data Operation” in section 5.6.

10-4 IM CW500-01EN
Message Description and Corrective ActionCannot read the setting file.The file may be damaged.
• Tryloadingthesetupfileagain.Ifitstillfails,theSDmemory card may be damaged if the setup file is on the card or the CW500 may be malfunctioning if the setup file is in the internal memory. If the CW500 is malfunctioning, stop using it immediately.
Available memory is low. Check the amount of free space in the SD card and internal memory.
• CheckthefreespaceontheSDmemorycardandinthe internal memory and the number of saved files. Up to three measured data files and eight other files can be saved to the internal memory. If there is not enough free space, delete files or format the SD memory card, or use another SD memory card that has been formatted on the CW500. For details, see “Recorded Data Operation” in section 5.6.
There is no available space in the storage area.Start time is set in the past.Check the recording start method.
• Thisappearswhen“Start”forrecordingissettoConstant rec. or Time period rec., and the stop time of recording is set to a time in the past. Check the time settings. For details see “Reserving by Specifying the Date and Time” or “Reserving a Repetitive Recording” (section 4.2).
Failed to start recording.
• CheckthesettingsontheRecordingtabofSETUP.For details, see section 5.4, “Recording Setup.”
• Startrecordingagain.Ifitstillfails,theSDmemorycard may be damaged if the recording destination is the card or the CW500 may be malfunctioning if the recording destination is the internal memory. If the CW500 is malfunctioning, stop using it immediately.
Cannot change the instrument settings during recording or in stand-by mode.
You can only view the settings while recording is in progress. To change the settings, be sure to stop recording, and wait for the message “Recording stopped” to disappear.
New sensor is detected. Recheck the basic setting for SET UP before measurements.
• Thisappearswhenacurrentclamp-onprobedifferentfrom the previous measurement is connected. On the Basic tab of SET UP, specify the currently connected clamp-on probe, or use sensor detection to automatically detect the current clamp-on probe.
Sensor connection is not correct. Check the connected sensor(s).
• Anappropriatecurrentprobemaynotbeconnectedto a channel for the wiring system to be measured. Only the same type of current probes may be used in a measurement.
10.2 Error Messages and Corrective Actions

10-5IM CW500-01EN
Message Description and Corrective ActionOut of SD card space. Recording will be stopped.
• Besuretowaitforthemessage“Recordingstopped” to disappear, and back up the saved files to a PC or the like. Delete the files or format the SD memory card, or use another SD memory card that has been formatted on the CW500. Then, resume recording. For details, see “Recorded Data Operation” in section 5.6.
Out of internal memory space. Recording will be stopped.
• Besuretowaitforthemessage“Recordingstopped” to disappear, and back up the saved files to a PC or SD memory card. Delete the files or format the internal memory. Then, resume recording. For details, see “Recorded Data Operation” in section 5.6.
10.2 Error Messages and Corrective Actions

App-1IM CW500-01EN
When Using 96030, 96033, or 96036
To use a YOKOGAWA’s 96030, 96033, or 96036 current clamp-on probe with the CW500, you need a 99073 banana-DIN adapter.The sensor identification function cannot be used.Configure the clamp-on probe settings manually.The clamp-on probe settings and specifications are as follows.Probe 96030 96033 96036Current-Clamp setting of CW500
96063 96061 96060
Accuracy Band width
±0.5%rdg±0.1mV(45Hz to 66Hz)±0.8%rdg±0.2mV(66Hz to 1kHz)±2.0%rdg±0.4mV(1kHz to 3.5kHz)
±0.5%rdg±0.1mV(45Hz to 66Hz)±0.8%rdg±0.2mV(66Hz to 1kHz)±1.0%rdg±0.3mV(1kHz to 3.5kHz)
±0.5%rdg±0.01mV(45Hz to 66Hz)±0.8%rdg±0.02mV(66Hz to 1kHz)±2.0%rdg±0.04mV(1kHz to 3.5kHz)
Phase ±0.5° or less(45Hz to 3.5kHz)
±1.0° or less(45Hz to 3.5kHz)
-
Maximum allowable input
5% to 110% of each measuring range
Safety standard Do not comply with safety standard.
Appendix

Index-1IM CW500-01EN
Index
Index
DEM Max ...........................................6-11DEM P .............................................. 6-12DEM Present .....................................6-11DEM Target ........................................6-11Detection failure cause ....................... 4-8DIP .................................................... 5-21
E PageEdit allowable range ......................... 5-17ENTER key ......................................... 3-1ESC key.............................................. 3-1Event ................................................ 5-26Event data ........................................ 6-29
F PageFile name .......................................... 5-42Filter .................................................. 5-23Format .............................................. 5-40Frequency..........................................5-11full scale............................................ 6-18Full/zoom .......................................... 6-22Function key ....................................... 3-1
G PageGraph/List ......................................... 6-24
H PageHarmonic analysis ............................ 6-19Harmonic analysis key........................ 3-2Harmonic orders ............................... 6-24Harmonics ..................................3-8,5-26Hysteresis ......................................... 5-19
Symbol PageΣ/CH ................................................... 6-7
Numeric Page4-split/8-split ....................................... 6-6
A PageA × Magnification ......................6-16,6-18Auto power OFF ................................. 7-2AVG .................................................... 6-6
B PageBacklight ...............................3-5,5-35,7-1Barrier ................................................. 2-4Basic ................................................... 5-1Basic Setup ........................................ 5-2Bluetooth .......................................... 5-34Buzzer .............................................. 5-34
C PageChanging the displayed channels..... 6-10CH color............................................ 5-32Clamp ................................................. 5-8Constant rec. .................................... 5-29Contrast .............................................. 3-5CT Ratio ............................................. 5-9Current measurement......................... 5-8Current Range .................................... 5-9Customize........................................... 6-4
D PageData folder ........................................ 5-43DATA HOLD ........................................ 7-1DATA HOLD key ................................. 3-1Data transfer ....................................... 8-1Date format ....................................... 5-32DC Range ..........................................5-11Delete data ....................................... 5-37Demand ...................................... 3-6,6-10DEM G .............................................. 6-12DEM Guess .......................................6-11

Index-2 IM CW500-01EN
I PageID Number ........................................ 5-33InrushCurrent.................................... 5-20Inspection cycle ................................ 5-14INST ................................................... 6-6Instantaneous ..................................... 3-6Instantaneous value ........................... 6-1INT .................................................... 5-22Integrated ........................................... 3-6Integrated value .................................. 6-9Interruption ....................................... 5-22Interval .............................................. 5-28I/O terminal ......................................... 8-2
K PageKey Lock ............................................. 7-1KEY LOCK key ................................... 3-1
L PageLanguage.......................................... 5-31LCD key .............................................. 3-1LED..................................................... 3-1List/Graph ......................................... 6-22List of flicker measurements ............. 6-31Log/Linear......................................... 6-22
M PageManual .............................................. 5-29MAX .................................................... 6-6MAX hold .......................................... 5-16Measurement.............................. 5-1,5-13Measurement setup .......................... 5-12MIN ..................................................... 6-6
N PageNGjudgment ...................................... 4-7Nominal V ........................................... 5-7
O PageOthers ................................................. 5-1Output terminal ................................... 8-4
P PagePlt trend graph .................................. 6-33Power ....................................... 5-25,5-35Power key ........................................... 3-1Power quality ..............................3-9,5-18Power Quality ................................... 6-25Power supply adapter ......................... 8-5Print screen ........................................ 7-2PRINT SCREEN ............................... 5-42PRINT SCREEN key .......................... 3-1
Q PageQUALITY key .............................. 3-2,6-25Quick start guide........................... 4-1,4-3
R PageRead settings.................................... 5-46REC End........................................... 5-29Recording ................................... 5-1,5-25Record items .................................... 5-27REC Period....................................... 5-30REC Start ......................................... 5-29RESET key ......................................... 3-1
S PageSaved data ....................................... 5-36Saved Data ......................................... 5-1Save settings .................................... 5-44SD card............................................. 5-39Self-Diagnosis .................................... 4-8Sensor detection...........................4-8,7-2Sensor Detection .............................. 5-10SETUP key ......................................... 3-1Starting recording ............................... 4-1Start now ............................................ 4-1START/STOP key ............................... 3-1Stopping recording ............................. 4-2SWELL ............................................. 5-20System reset..................................... 5-35
Index

Index-3IM CW500-01EN
T PageTarget................................................ 5-13Target PF .......................................... 5-24Test environment check ...................... 4-6THD calc ........................................... 5-16Threshold current ............................. 5-18Time .................................................. 5-33Time period recording ....................... 5-30t × Magnification ............................... 6-18Transfer data .................................... 5-39Transient ........................................... 5-19Trend graph ........................................ 6-4
V PageV/A/P/ΣP ................................... 6-23,6-24Vector ......................................... 3-7,6-14Vector key ........................................... 3-2V × Magnification ......................6-16,6-18Voltage measurement......................... 5-5V Range.............................................. 5-5VT/CT ................................................. 5-6VT Ratio .............................................. 5-5
W PageWaveform ................................... 3-7,6-17Waveform key ..................................... 3-2Wh ................................................ 6-4,6-9Wiring check ....................................... 4-7Wiring system ............................... 4-5,5-3W/Wh .................................................. 6-1W/Wh key ........................................... 3-2
Z PageZoom .................................................. 6-4
Index