cyanobacteria monitoring on lake champlain summer 2017 cyano... · 1 cyanobacteria monitoring on...
TRANSCRIPT
1
Cyanobacteria Monitoring on Lake Champlain Summer 2017
Final Report for the Lake Champlain Basin Program
May 2018
Prepared by
Angela Shambaugh Watershed Management Division
Vermont Department of Environmental Conservation
Montpelier, Vermont
in conjunction with
Bridget O’Brien Radiological & Toxicological
Division
Vermont Department of Health
Burlington, Vermont
Lori Fisher Lake Champlain Committee
Burlington, Vermont
Heather Campbell Drinking Water & Groundwater
Protection Division
Vermont Department of
Environmental Conservation
Montpelier, Vermont
2
Executive Summary An annual monitoring program has been in place on Lake Champlain since 2002. Since 2012, oversight of
the program has been the responsibility of the state of Vermont. The program represents a strong
partnership between the Vermont Department of Environmental Conservation (VT DEC), the Vermont
Department of Health (VDH) and the Lake Champlain Committee (LCC). Funding is provided by the Lake
Champlain Basin Program, the State of Vermont, the CDC, and private donors. Data are collected by
state staff and an extensive network of trained citizen volunteers.
Cyanobacteria monitoring on Lake Champlain in 2017 continued to integrate qualitative observations,
photographic documentation and quantitative analysis of cyanobacteria populations into guidance for
lake users. Analysis of water for the presence of microcystin and anatoxin, when warranted, provided
additional data to inform public health decisions in response to the presence of cyanobacteria.
Objectives
• monitor cyanobacteria at locations on Lake Champlain and selected Vermont inland lakes through
the established partnership between state staff, the Lake Champlain Committee and citizen
volunteers;
• provide consistent quantitative data at selected locations around Lake Champlain and selected
Vermont lakes;
• test for the presence of cyanotoxins when cyanobacteria density and composition triggers are
reached at selected monitoring locations;
• conduct 12 weeks cyanobacteria toxin testing for drinking water facilities drawing from Lake
Champlain in Vermont;
• facilitate communication about lake conditions through weekly updates to stakeholders via email
and to the public through the Vermont Department of Health webpage; and
• provide outreach and assistance to beach managers, lakeshore property owners and the public
so they can learn to recognize and respond appropriately to the presence of cyanobacteria
blooms.
More than 1750 site-specific reports were submitted during 2017 from more than 135 locations on Lake
Champlain and inland lakes in Vermont. Citizen volunteers trained by the Lake Champlain Committee
reported from 132 locations on Lake Champlain and several other Champlain Basin lakes in Vermont.
Blooms, defined as category 3 of the visual protocol were reported 129 times during the monitoring period
in 2017. Microcystin was detected at several locations on Champlain and Lake Carmi in 2017. No locations
exceeded the Vermont recreational guidance values for microcystin. No anatoxin was detected.
3
Table of Contents Executive Summary ....................................................................................................................................... 2
Introduction .................................................................................................................................................. 5
Geographic Coverage .................................................................................................................................... 5
Methods ........................................................................................................................................................ 6
Sampling Locations ................................................................................................................................... 6
Monitoring Protocols ................................................................................................................................ 7
The Visual Monitoring Protocol ............................................................................................................ 7
The Open Water Protocol ..................................................................................................................... 8
Reports from Other Sources ............................................................................................................... 10
Toxin Analysis .......................................................................................................................................... 10
Toxin Monitoring at Vermont Drinking Water Facilities ......................................................................... 10
Communication and Outreach ................................................................................................................ 10
Notification of the Public .................................................................................................................... 11
Response to Monitoring Reports ........................................................................................................ 11
Outreach ............................................................................................................................................. 11
Results ......................................................................................................................................................... 12
Overall effort ........................................................................................................................................... 12
Assessment Results – Recreational Monitoring ..................................................................................... 13
Drinking Water Supply Monitoring ......................................................................................................... 17
Volunteer training ................................................................................................................................... 19
Outreach and Assistance......................................................................................................................... 19
Regional and National Activities ............................................................................................................. 20
Communication with the Stakeholders and the Public .......................................................................... 20
Effectiveness of the visual monitoring protocol ..................................................................................... 21
Cyanobacteria conditions in 2017 .......................................................................................................... 22
Vermont inland lakes .......................................................................................................................... 22
Cyanobacteria Conditions on Lake Champlain: .................................................................................. 24
Summary ..................................................................................................................................................... 27
Acknowledgements ..................................................................................................................................... 28
Literature Cited ........................................................................................................................................... 28
Appendix A – 2017 Sampling locations ....................................................................................................... 29

4
Appendix B. Visual assessment protocols from the Lake Champlain Committee website ........................ 38
B.1. LCC Guidance for Determining Algae Bloom Intensity ................................................................... 38
B.2. LCC Guidelines for Photographic Documentation .......................................................................... 45
Appendix C – QA/QC Sample Data for 2017 ............................................................................................... 47
Appendix D – Historical Microcystin Data for Lake Champlain .................................................................. 53
5
Introduction Lake Champlain is one of the largest lakes in the United States and an important water resource for the
states of Vermont and New York, and the province of Quebec. It is primarily a recreational lake, but also
serves as an important drinking water source for all three jurisdictions. Cyanobacteria blooms have been
documented in the lake since the 1970s, with some areas experiencing extensive annual blooms. In 1999,
several dog deaths were attributed to cyanobacteria toxins, raising health and safety concerns regarding
drinking water supplies and recreational activities such as swimming, boating and fishing.
An annual cyanobacteria monitoring program has been in place on Lake Champlain since 2002, developed
initially by the University of Vermont (UVM). Since 2012, oversight of the program has been the
responsibility of the State of Vermont. Data are collected by state staff and an extensive network of
trained citizen volunteers. Qualitative observations, photographic documentation, and quantitative
analysis of phytoplankton populations are synthesized into guidance for lake users. Analysis of water -
when warranted - for the presence of microcystin, anatoxin and cylindrospermopsin provided additional
data to inform public health decisions.
Objectives
• monitor cyanobacteria at locations on Lake Champlain and selected Vermont inland lakes through
the established partnership between state staff, the Lake Champlain Committee and citizen
volunteers;
• provide consistent quantitative data at selected locations around Lake Champlain and selected
Vermont lakes;
• test for the presence of cyanotoxins when cyanobacteria density and composition triggers are
reached at selected monitoring locations;
• conduct cyanobacteria toxin testing for drinking water facilities drawing on Lake Champlain in
Vermont;
• facilitate communication about lake conditions through weekly updates to stakeholders via email
and to the public through the Vermont Department of Health webpage; and
• provide outreach and assistance to beach managers, lakeshore property owners and the public
so they can learn to recognize and respond appropriately to the presence of cyanobacteria
blooms.
Geographic Coverage The work described in this report covers cyanobacteria monitoring and response activities in the
Champlain Basin supported by the Champlain Long-Term Water Quality and Biological Monitoring
Program (CLTM) in coordination with the Vermont Department of Health (VDH), Lake Champlain
Committee’s (LCC) Volunteer Cyanobacteria Monitoring Program, and the Vermont Department of
Environmental Conservation (VT DEC). 2017 funding supporting the CLTM, the LCC, and toxin
monitoring for Vermont drinking water facilities was provided by the Lake Champlain Basin Program
(LCBP). Additional funding to support this work was provided by the State of Vermont, LCC private
6
donors, and the CDC funded Vermont Environmental Public Health Tracking program. Lakes in Vermont
monitored by LCC-supported volunteers are included in this project. For information on Vermont lakes
outside of the Champlain Basin, visit the VT DEC’s cyanobacteria webpage. New York maintains their
own cyanobacteria reporting protocols for inland lakes including Lake George – see the New York
Harmful Algal Blooms notification page.
Methods The 2017 cyanobacteria monitoring program was coordinated by the VT DEC and implemented in
conjunction with the VDH and LCC. Qualitative data from Lake Champlain and other Vermont lakes
monitored by LCC volunteers were collected following the protocol developed and maintained by the LCC.
Quantitative samples were collected at selected open water stations historically monitored by the CLTM
on Lake Champlain. Additional water samples for quantitative assessment were collected at selected
shoreline locations on Lake Champlain and Lake Carmi by citizen volunteers and VDH staff. Reports from
the monitoring partners and volunteers were uploaded via a controlled web interface directly to the
Cyanobacteria Tracking map (CyanoTracker) maintained by the VDH.
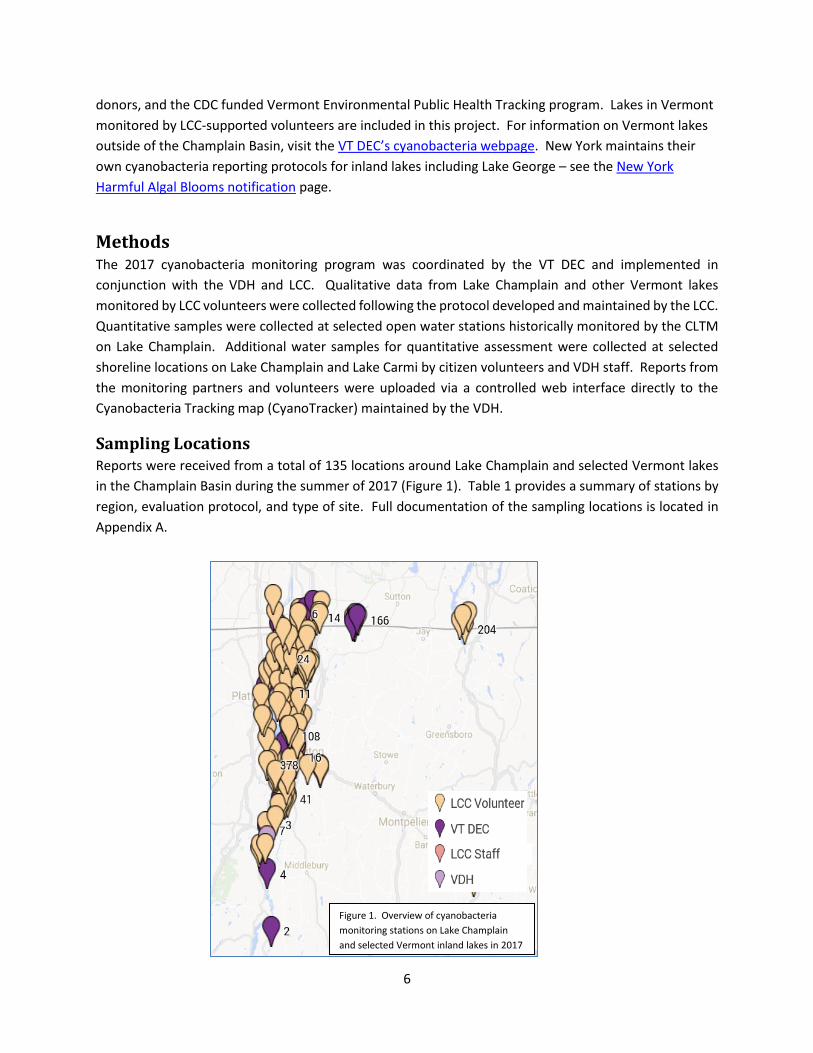
Sampling Locations Reports were received from a total of 135 locations around Lake Champlain and selected Vermont lakes
in the Champlain Basin during the summer of 2017 (Figure 1). Table 1 provides a summary of stations by
region, evaluation protocol, and type of site. Full documentation of the sampling locations is located in
Appendix A.
Figure 1. Overview of cyanobacteria
monitoring stations on Lake Champlain
and selected Vermont inland lakes in 2017
7
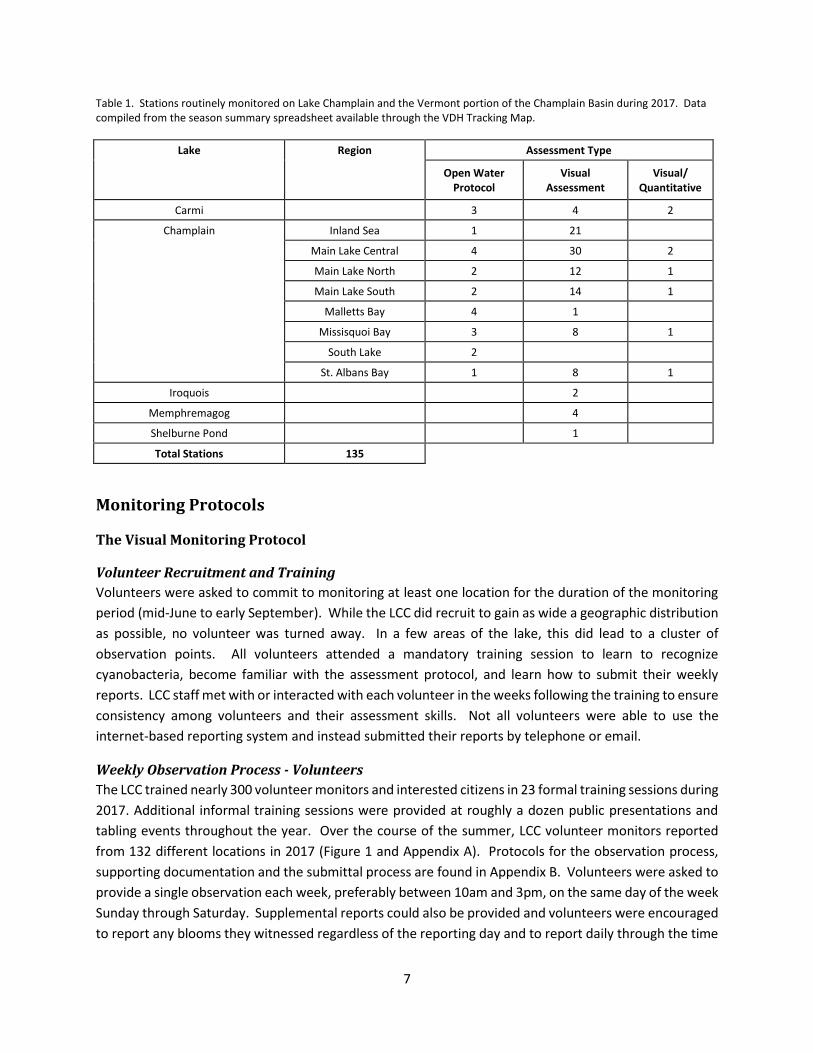
Table 1. Stations routinely monitored on Lake Champlain and the Vermont portion of the Champlain Basin during 2017. Data compiled from the season summary spreadsheet available through the VDH Tracking Map.
Lake Region Assessment Type
Open Water
Protocol Visual
Assessment Visual/
Quantitative
Carmi 3 4 2
Champlain Inland Sea 1 21
Main Lake Central 4 30 2
Main Lake North 2 12 1
Main Lake South 2 14 1
Malletts Bay 4 1
Missisquoi Bay 3 8 1
South Lake 2
St. Albans Bay 1 8 1
Iroquois 2
Memphremagog 4
Shelburne Pond 1
Total Stations 135
Monitoring Protocols
The Visual Monitoring Protocol
Volunteer Recruitment and Training
Volunteers were asked to commit to monitoring at least one location for the duration of the monitoring
period (mid-June to early September). While the LCC did recruit to gain as wide a geographic distribution
as possible, no volunteer was turned away. In a few areas of the lake, this did lead to a cluster of
observation points. All volunteers attended a mandatory training session to learn to recognize
cyanobacteria, become familiar with the assessment protocol, and learn how to submit their weekly
reports. LCC staff met with or interacted with each volunteer in the weeks following the training to ensure
consistency among volunteers and their assessment skills. Not all volunteers were able to use the
internet-based reporting system and instead submitted their reports by telephone or email.
Weekly Observation Process - Volunteers
The LCC trained nearly 300 volunteer monitors and interested citizens in 23 formal training sessions during
2017. Additional informal training sessions were provided at roughly a dozen public presentations and
tabling events throughout the year. Over the course of the summer, LCC volunteer monitors reported
from 132 different locations in 2017 (Figure 1 and Appendix A). Protocols for the observation process,
supporting documentation and the submittal process are found in Appendix B. Volunteers were asked to
provide a single observation each week, preferably between 10am and 3pm, on the same day of the week
Sunday through Saturday. Supplemental reports could also be provided and volunteers were encouraged
to report any blooms they witnessed regardless of the reporting day and to report daily through the time
8
a bloom dissipated. Volunteers evaluated cyanobacteria conditions at their location using the prompts,
photographs, and descriptions provided by the LCC, and assigned it one of the three categories:
• Category 1 – very few or no cyanobacteria observed, recreational enjoyment not impaired by
cyanobacteria. (Category 1 contained multiple subcategories.)
• Category 2 – cyanobacteria present at less than bloom levels
• Category 3 – cyanobacteria bloom in progress
The description ‘bloom’ is not a well-defined scientific defined term. For the purposes of the visual
monitoring protocol, blooms refer to very dense algal accumulations resulting in highly colored water
and/or visible surface scums.
Each volunteer was asked to provide three photographs whenever category 2 or category 3 conditions
were observed. All reports were uploaded to the VDH tracking map via a secured interface or submitted
to the LCC via their online form. Partners reviewed all bloom reports and photos. LCC conferred with
volunteers as needed to verify the presence of cyanobacteria and appropriate status. The LCC approved
reports submitted directly by volunteers to the VDH web interface and uploaded any sent directly to LCC
as quickly as possible. Staff also followed up with volunteers when no reports were received. Category 2
and 3 reports were given priority, shared with partners at the VDH and VT DEC immediately, and posted
immediately after any necessary verification.
In addition to the photos, four sites visited by volunteers were also assessed quantitatively:
North Beach - Burlington VT
Red Rocks Park – South Burlington VT
St. Albans Bay Park – St. Albans VT
The Shipyard - Highgate VT
Each week, these volunteers made a visual assessment and collected water samples from the shore.
These unfiltered samples were analyzed for microcystin, anatoxin and cyanobacteria density.
Weekly VDH Surveillance
The VDH conducted routine weekly monitoring at selected sites on Lake Champlain and Lake Carmi:
Alburgh Dunes State Park – Alburgh VT
Tri-Town Rd – West Addison VT
Lake Carmi State Park – Franklin VT
Lake Carmi North Beach – Franklin VT
These locations were areas with high recreational usage or located in the vicinity of drinking water
facilities. VDH staff made visual assessments and collected water samples for toxin and cyanobacteria
analysis.
The Open Water Protocol
Qualitative and quantitative data on taxonomic distribution, cell density and the presence of toxins were
collected by the VT DEC following the Open Water Protocol. VT DEC staff conducted cyanobacteria
assessments during their biweekly monitoring for the Champlain Long-term Water Quality and Biological
Monitoring Project. At each monitoring site, staff utilized the visual assessment protocol to evaluate
9
cyanobacteria conditions and collected a 3m plankton tow. Cyanobacteria observed during transit were
also assessed using the visual assessment protocol. When category 3 conditions were observed, whole
water surface grabs were collected for the analysis of toxins and cyanobacteria density. At locations
where blooms were uncommon, whole water surface grabs for toxin and cyanobacteria were also
collected during category 2 conditions. Monitoring began the week of June 1st and continued through
early October.
Field Methods
Plankton were collected as integrated 63 µm mesh plankton net for determination of cyanobacteria
density. Net concentrates were obtained by lowering the plankton net opening to 3m and drawing it
steadily back to the surface. When alert level conditions were observed, a single whole water sample was
collected by placing a bucket carefully at the surface and tipping to fill, avoiding dilution of the surface
scum as much as possible. The sample was mixed thoroughly and decanted into sample bottles for
subsequent cyanobacteria enumeration or toxin analysis. All samples were kept on ice in coolers until
they reached the lab.
Plankton Enumeration
Plankton samples were analyzed using an inverted compound microscope at 200x in a Sedgewick Rafter
(SR) cell. One mL aliquots were settled for 10 – 15 minutes before analysis. Estimates of cell density were
obtained for all observed cyanobacteria and selected other taxa using the size categories noted in Table
2. Observed individuals or colonies were assigned to a unit category, or several categories, as needed.
The number of units in each category is then multiplied by the cell factor to obtain an estimate of cell
density/mL in the sample. During the analysis, all cyanobacteria were identified to the lowest possible
taxonomic level while most other algae were identified simply at the division level, e.g. green algae or
diatoms. Identical counting protocols were used for whole water and plankton concentrates. Plankton
samples were counted by VT DEC staff and data were uploaded to the VDH data interface, typically within
24 -48 hours for open water stations. Bloom and alert level samples were analyzed and posted as soon
as possible after samples were received at the laboratory.
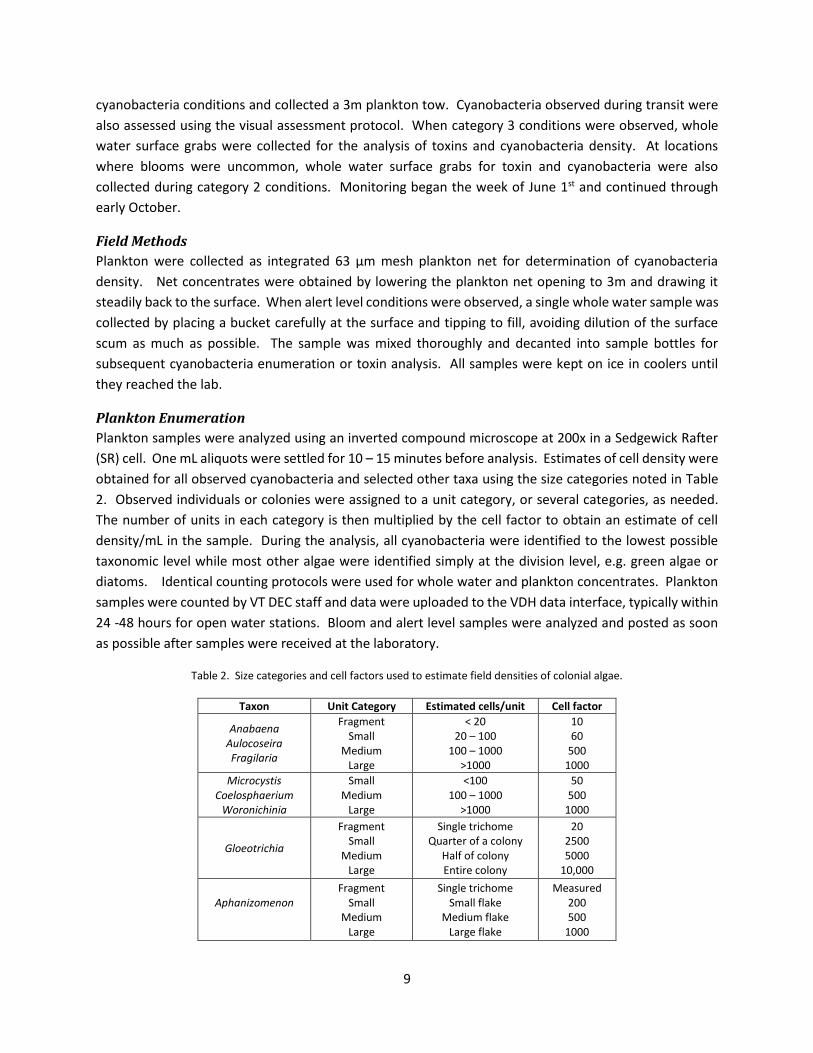
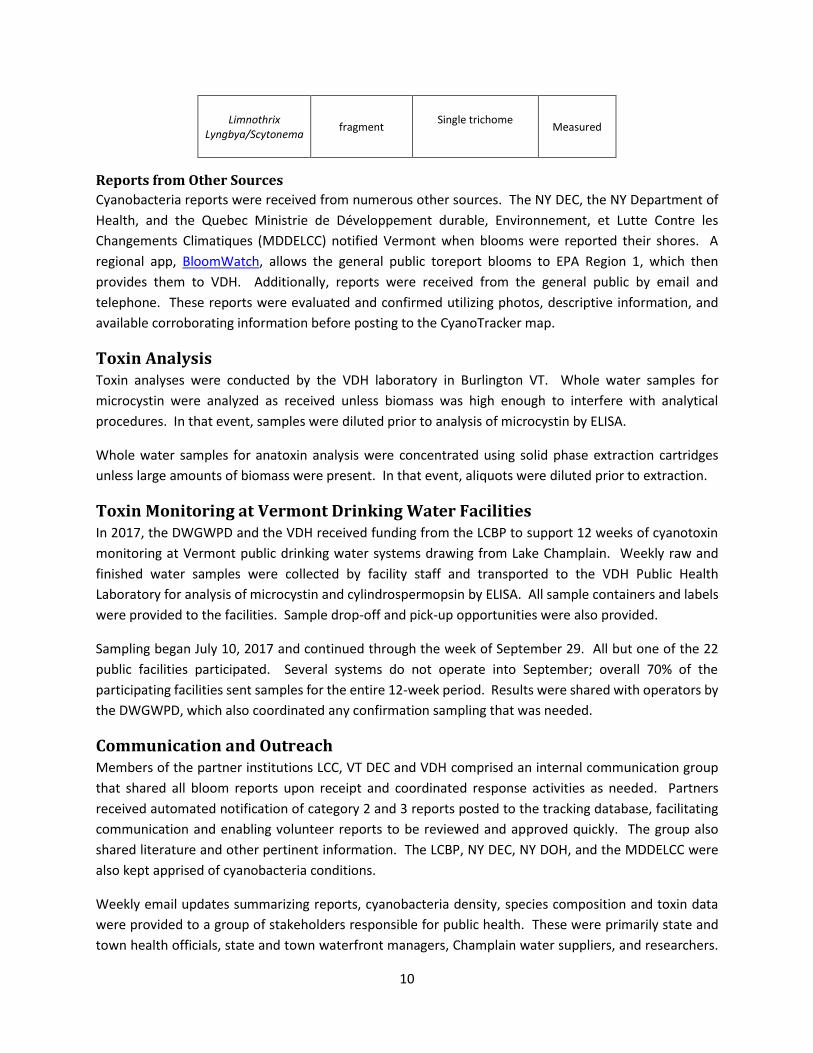
Table 2. Size categories and cell factors used to estimate field densities of colonial algae.
Taxon Unit Category Estimated cells/unit Cell factor
Anabaena Aulocoseira Fragilaria
Fragment Small
Medium Large
< 20 20 – 100
100 – 1000 >1000
10 60
500 1000
Microcystis Coelosphaerium
Woronichinia
Small Medium
Large
<100 100 – 1000
>1000
50 500
1000
Gloeotrichia
Fragment Small
Medium Large
Single trichome Quarter of a colony
Half of colony Entire colony
20 2500 5000
10,000
Aphanizomenon
Fragment Small
Medium Large
Single trichome Small flake
Medium flake Large flake
Measured 200 500
1000
10
Limnothrix Lyngbya/Scytonema
fragment Single trichome
Measured
Reports from Other Sources
Cyanobacteria reports were received from numerous other sources. The NY DEC, the NY Department of
Health, and the Quebec Ministrie de Développement durable, Environnement, et Lutte Contre les
Changements Climatiques (MDDELCC) notified Vermont when blooms were reported their shores. A
regional app, BloomWatch, allows the general public toreport blooms to EPA Region 1, which then
provides them to VDH. Additionally, reports were received from the general public by email and
telephone. These reports were evaluated and confirmed utilizing photos, descriptive information, and
available corroborating information before posting to the CyanoTracker map.
Toxin Analysis Toxin analyses were conducted by the VDH laboratory in Burlington VT. Whole water samples for
microcystin were analyzed as received unless biomass was high enough to interfere with analytical
procedures. In that event, samples were diluted prior to analysis of microcystin by ELISA.
Whole water samples for anatoxin analysis were concentrated using solid phase extraction cartridges
unless large amounts of biomass were present. In that event, aliquots were diluted prior to extraction.
Toxin Monitoring at Vermont Drinking Water Facilities In 2017, the DWGWPD and the VDH received funding from the LCBP to support 12 weeks of cyanotoxin
monitoring at Vermont public drinking water systems drawing from Lake Champlain. Weekly raw and
finished water samples were collected by facility staff and transported to the VDH Public Health
Laboratory for analysis of microcystin and cylindrospermopsin by ELISA. All sample containers and labels
were provided to the facilities. Sample drop-off and pick-up opportunities were also provided.
Sampling began July 10, 2017 and continued through the week of September 29. All but one of the 22
public facilities participated. Several systems do not operate into September; overall 70% of the
participating facilities sent samples for the entire 12-week period. Results were shared with operators by
the DWGWPD, which also coordinated any confirmation sampling that was needed.
Communication and Outreach Members of the partner institutions LCC, VT DEC and VDH comprised an internal communication group
that shared all bloom reports upon receipt and coordinated response activities as needed. Partners
received automated notification of category 2 and 3 reports posted to the tracking database, facilitating
communication and enabling volunteer reports to be reviewed and approved quickly. The group also
shared literature and other pertinent information. The LCBP, NY DEC, NY DOH, and the MDDELCC were
also kept apprised of cyanobacteria conditions.
Weekly email updates summarizing reports, cyanobacteria density, species composition and toxin data
were provided to a group of stakeholders responsible for public health. These were primarily state and
town health officials, state and town waterfront managers, Champlain water suppliers, and researchers.
11
Updates were released typically on Friday mornings, but stakeholders also received email notification of
extensive blooms as they occurred. The Lake Champlain Committee also provided weekly emails to LCC
volunteer monitors and partner agencies and separate emails to a list of interested citizens and agencies
and the media.
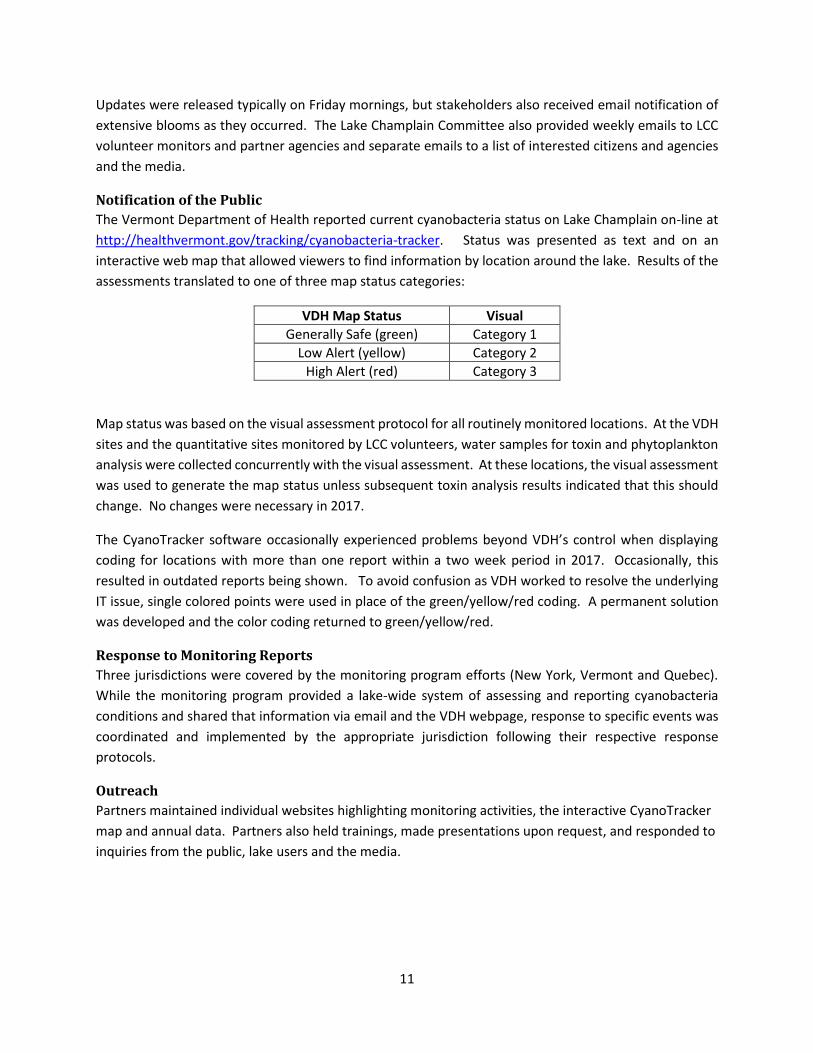
Notification of the Public
The Vermont Department of Health reported current cyanobacteria status on Lake Champlain on-line at
http://healthvermont.gov/tracking/cyanobacteria-tracker. Status was presented as text and on an
interactive web map that allowed viewers to find information by location around the lake. Results of the
assessments translated to one of three map status categories:
VDH Map Status Visual
Generally Safe (green) Category 1
Low Alert (yellow) Category 2
High Alert (red) Category 3
Map status was based on the visual assessment protocol for all routinely monitored locations. At the VDH
sites and the quantitative sites monitored by LCC volunteers, water samples for toxin and phytoplankton
analysis were collected concurrently with the visual assessment. At these locations, the visual assessment
was used to generate the map status unless subsequent toxin analysis results indicated that this should
change. No changes were necessary in 2017.
The CyanoTracker software occasionally experienced problems beyond VDH’s control when displaying
coding for locations with more than one report within a two week period in 2017. Occasionally, this
resulted in outdated reports being shown. To avoid confusion as VDH worked to resolve the underlying
IT issue, single colored points were used in place of the green/yellow/red coding. A permanent solution
was developed and the color coding returned to green/yellow/red.
Response to Monitoring Reports
Three jurisdictions were covered by the monitoring program efforts (New York, Vermont and Quebec).
While the monitoring program provided a lake-wide system of assessing and reporting cyanobacteria
conditions and shared that information via email and the VDH webpage, response to specific events was
coordinated and implemented by the appropriate jurisdiction following their respective response
protocols.
Outreach
Partners maintained individual websites highlighting monitoring activities, the interactive CyanoTracker
map and annual data. Partners also held trainings, made presentations upon request, and responded to
inquiries from the public, lake users and the media.
12
Results
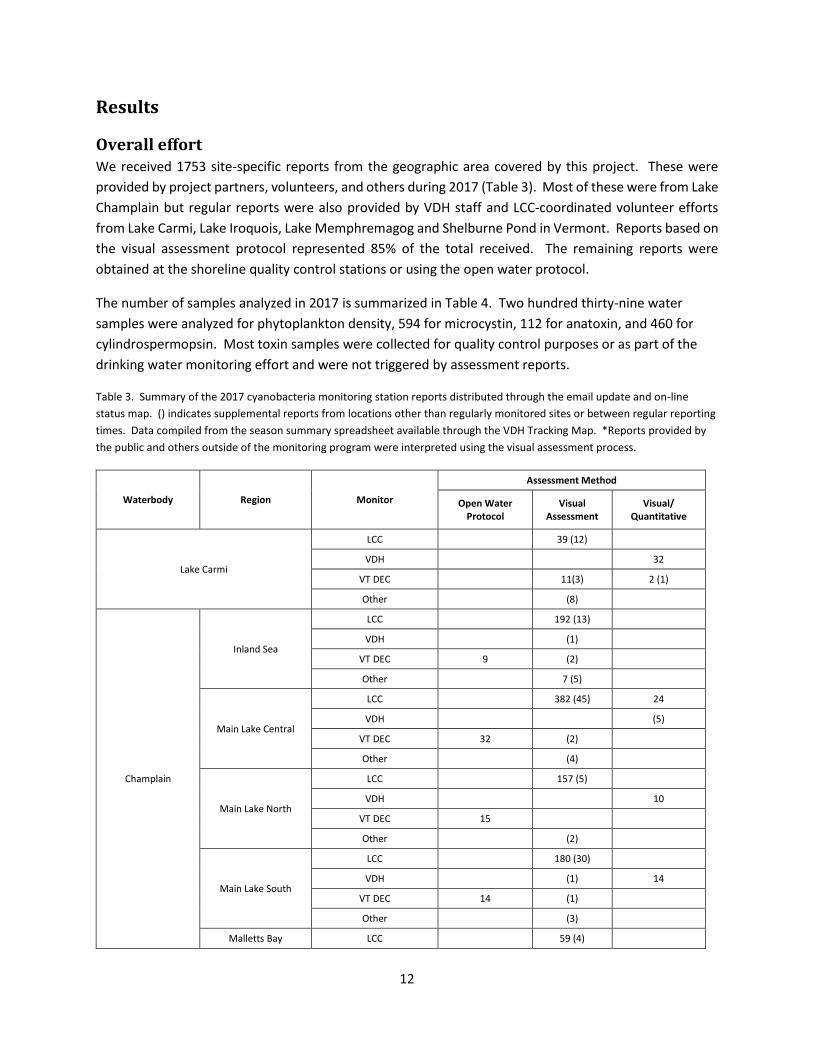
Overall effort We received 1753 site-specific reports from the geographic area covered by this project. These were
provided by project partners, volunteers, and others during 2017 (Table 3). Most of these were from Lake
Champlain but regular reports were also provided by VDH staff and LCC-coordinated volunteer efforts
from Lake Carmi, Lake Iroquois, Lake Memphremagog and Shelburne Pond in Vermont. Reports based on
the visual assessment protocol represented 85% of the total received. The remaining reports were
obtained at the shoreline quality control stations or using the open water protocol.
The number of samples analyzed in 2017 is summarized in Table 4. Two hundred thirty-nine water
samples were analyzed for phytoplankton density, 594 for microcystin, 112 for anatoxin, and 460 for
cylindrospermopsin. Most toxin samples were collected for quality control purposes or as part of the
drinking water monitoring effort and were not triggered by assessment reports.
Table 3. Summary of the 2017 cyanobacteria monitoring station reports distributed through the email update and on-line
status map. () indicates supplemental reports from locations other than regularly monitored sites or between regular reporting
times. Data compiled from the season summary spreadsheet available through the VDH Tracking Map. *Reports provided by
the public and others outside of the monitoring program were interpreted using the visual assessment process.
Waterbody Region Monitor
Assessment Method
Open Water Protocol
Visual Assessment
Visual/ Quantitative
Lake Carmi
LCC 39 (12)
VDH 32
VT DEC 11(3) 2 (1)
Other (8)
Champlain
Inland Sea
LCC 192 (13)
VDH (1)
VT DEC 9 (2)
Other 7 (5)
Main Lake Central
LCC 382 (45) 24
VDH (5)
VT DEC 32 (2)
Other (4)
Main Lake North
LCC 157 (5)
VDH 10
VT DEC 15
Other (2)
Main Lake South
LCC 180 (30)
VDH (1) 14
VT DEC 14 (1)
Other (3)
Malletts Bay LCC 59 (4)
13
Waterbody Region Monitor
Assessment Method
Open Water Protocol
Visual Assessment
Visual/ Quantitative
VT DEC 8
Other
Missisquoi Bay
LCC 67 (4) 16 (4)
VDH (1)
VT DEC 26 (1)
Other (15)
Champlain
South Lake LCC
VDH
VT DEC 14
Other
St. Albans Bay LCC 97 (45) 14 (1)
VDH (3) (3)
VT DEC 9 (1)
Other (2)
Lake Iroquois LCC 26 (8)
Shelburne Pond LCC 12 (1)
Lake Memphremagog LCC 47 (2)
Total Reports 1753 127 1497 129
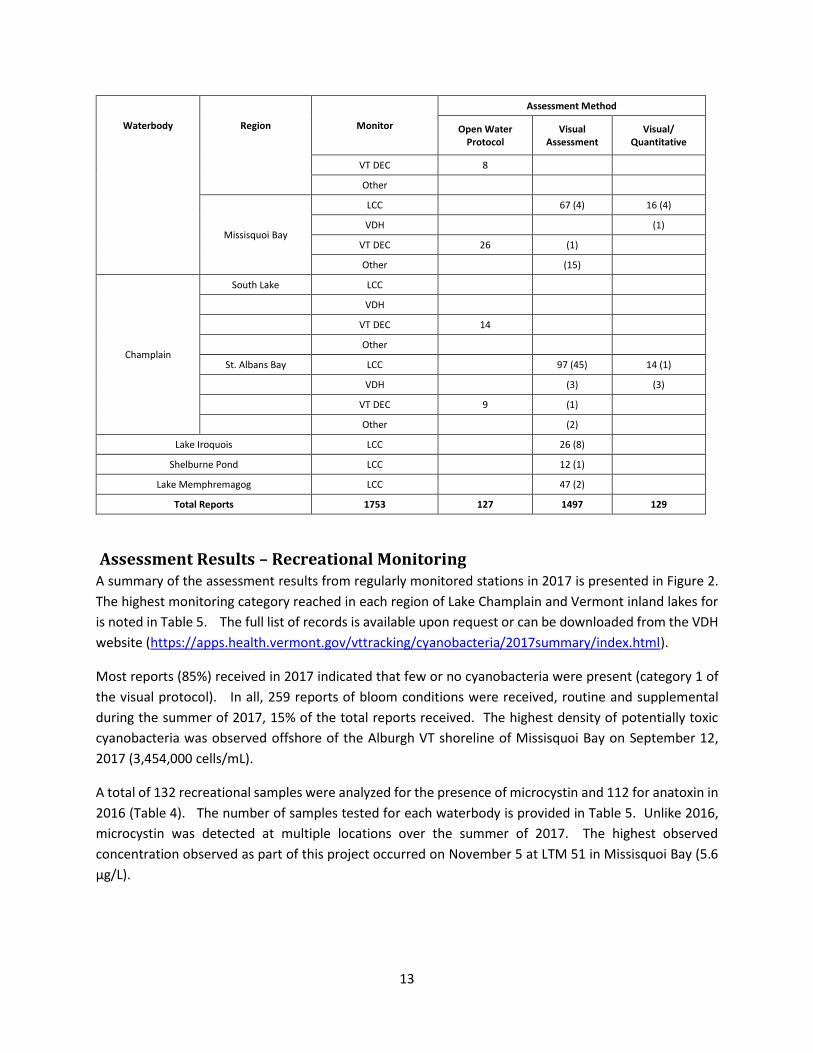
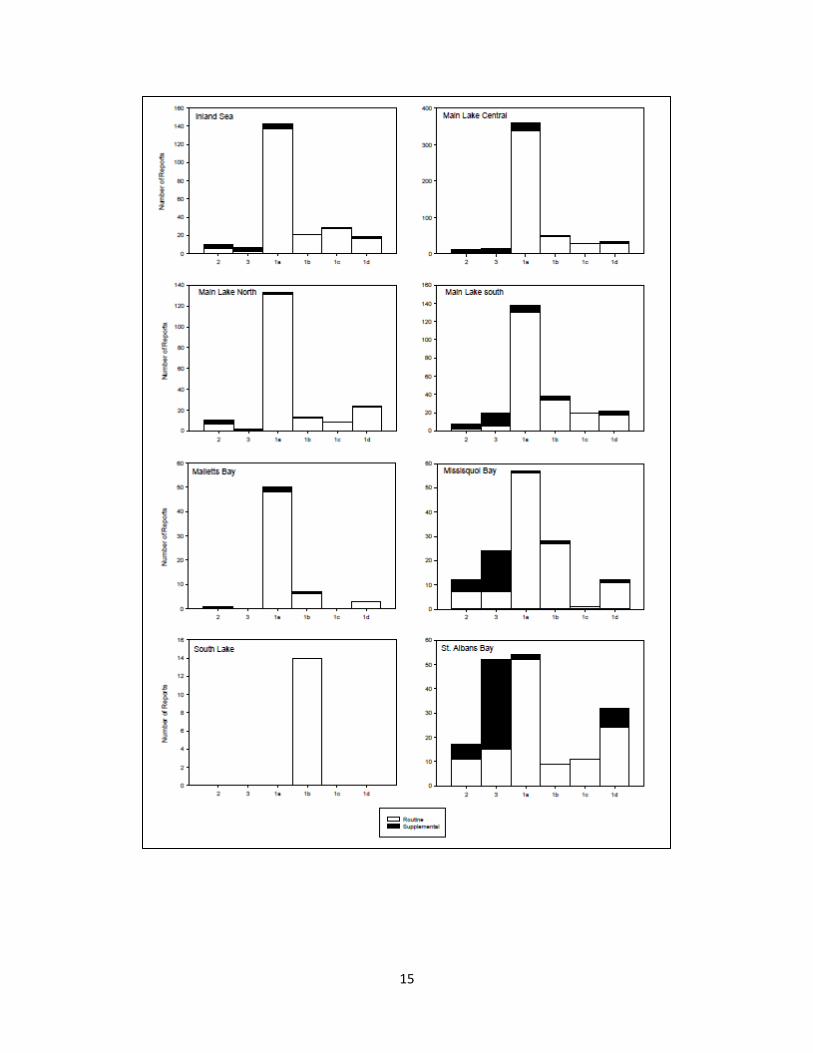
Assessment Results – Recreational Monitoring A summary of the assessment results from regularly monitored stations in 2017 is presented in Figure 2.
The highest monitoring category reached in each region of Lake Champlain and Vermont inland lakes for
is noted in Table 5. The full list of records is available upon request or can be downloaded from the VDH
website (https://apps.health.vermont.gov/vttracking/cyanobacteria/2017summary/index.html).
Most reports (85%) received in 2017 indicated that few or no cyanobacteria were present (category 1 of
the visual protocol). In all, 259 reports of bloom conditions were received, routine and supplemental
during the summer of 2017, 15% of the total reports received. The highest density of potentially toxic
cyanobacteria was observed offshore of the Alburgh VT shoreline of Missisquoi Bay on September 12,
2017 (3,454,000 cells/mL).
A total of 132 recreational samples were analyzed for the presence of microcystin and 112 for anatoxin in
2016 (Table 4). The number of samples tested for each waterbody is provided in Table 5. Unlike 2016,
microcystin was detected at multiple locations over the summer of 2017. The highest observed
concentration observed as part of this project occurred on November 5 at LTM 51 in Missisquoi Bay (5.6
µg/L).
14
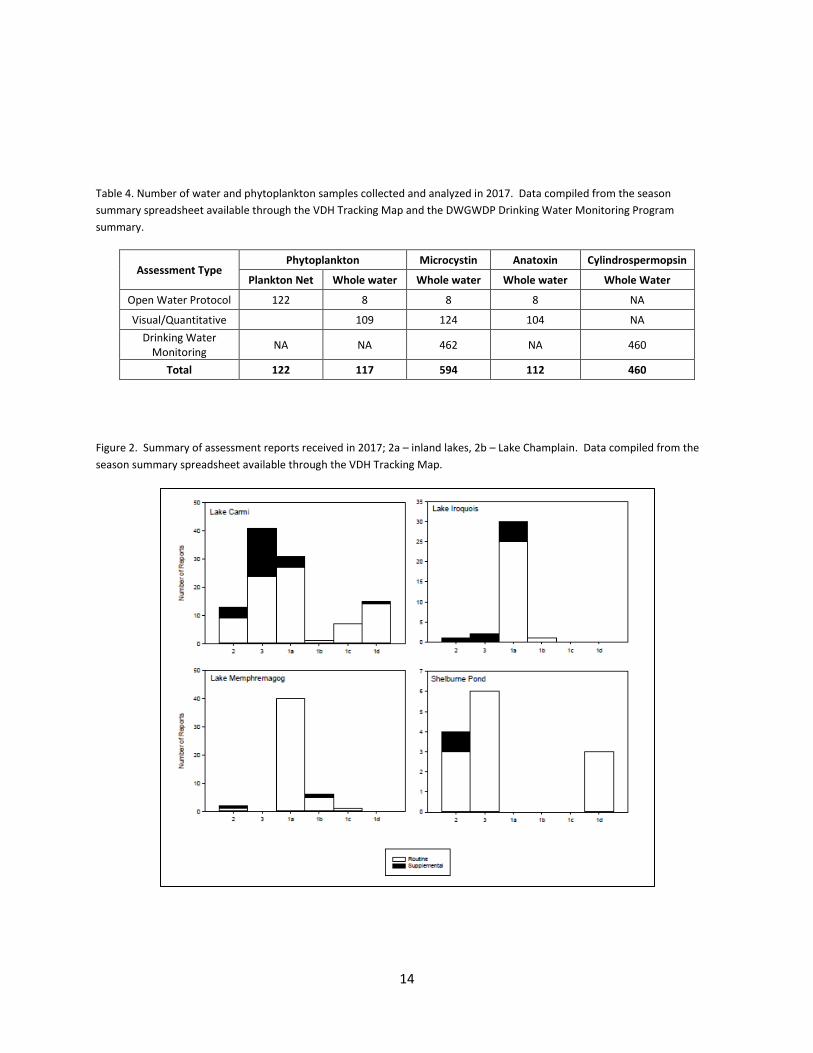
Table 4. Number of water and phytoplankton samples collected and analyzed in 2017. Data compiled from the season
summary spreadsheet available through the VDH Tracking Map and the DWGWDP Drinking Water Monitoring Program
summary.
Assessment Type Phytoplankton Microcystin Anatoxin Cylindrospermopsin
Plankton Net Whole water Whole water Whole water Whole Water
Open Water Protocol 122 8 8 8 NA
Visual/Quantitative 109 124 104 NA
Drinking Water Monitoring
NA NA 462 NA 460
Total 122 117 594 112 460
Figure 2. Summary of assessment reports received in 2017; 2a – inland lakes, 2b – Lake Champlain. Data compiled from the
season summary spreadsheet available through the VDH Tracking Map.
15
16
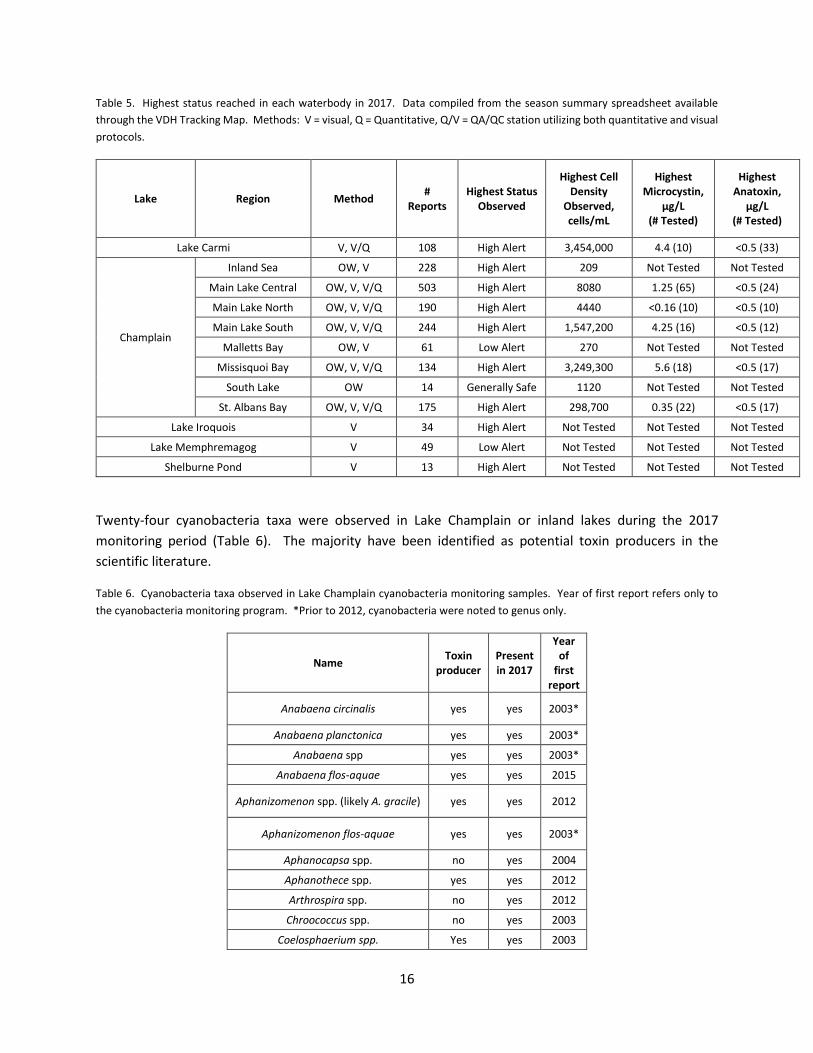
Table 5. Highest status reached in each waterbody in 2017. Data compiled from the season summary spreadsheet available
through the VDH Tracking Map. Methods: V = visual, Q = Quantitative, Q/V = QA/QC station utilizing both quantitative and visual
protocols.
Lake Region Method #
Reports Highest Status
Observed
Highest Cell Density
Observed, cells/mL
Highest Microcystin,
µg/L (# Tested)
Highest Anatoxin,
µg/L (# Tested)
Lake Carmi V, V/Q 108 High Alert 3,454,000 4.4 (10) <0.5 (33)
Champlain
Inland Sea OW, V 228 High Alert 209 Not Tested Not Tested
Main Lake Central OW, V, V/Q 503 High Alert 8080 1.25 (65) <0.5 (24)
Main Lake North OW, V, V/Q 190 High Alert 4440 <0.16 (10) <0.5 (10)
Main Lake South OW, V, V/Q 244 High Alert 1,547,200 4.25 (16) <0.5 (12)
Malletts Bay OW, V 61 Low Alert 270 Not Tested Not Tested
Missisquoi Bay OW, V, V/Q 134 High Alert 3,249,300 5.6 (18) <0.5 (17)
South Lake OW 14 Generally Safe 1120 Not Tested Not Tested
St. Albans Bay OW, V, V/Q 175 High Alert 298,700 0.35 (22) <0.5 (17)
Lake Iroquois V 34 High Alert Not Tested Not Tested Not Tested
Lake Memphremagog V 49 Low Alert Not Tested Not Tested Not Tested
Shelburne Pond V 13 High Alert Not Tested Not Tested Not Tested
Twenty-four cyanobacteria taxa were observed in Lake Champlain or inland lakes during the 2017
monitoring period (Table 6). The majority have been identified as potential toxin producers in the
scientific literature.
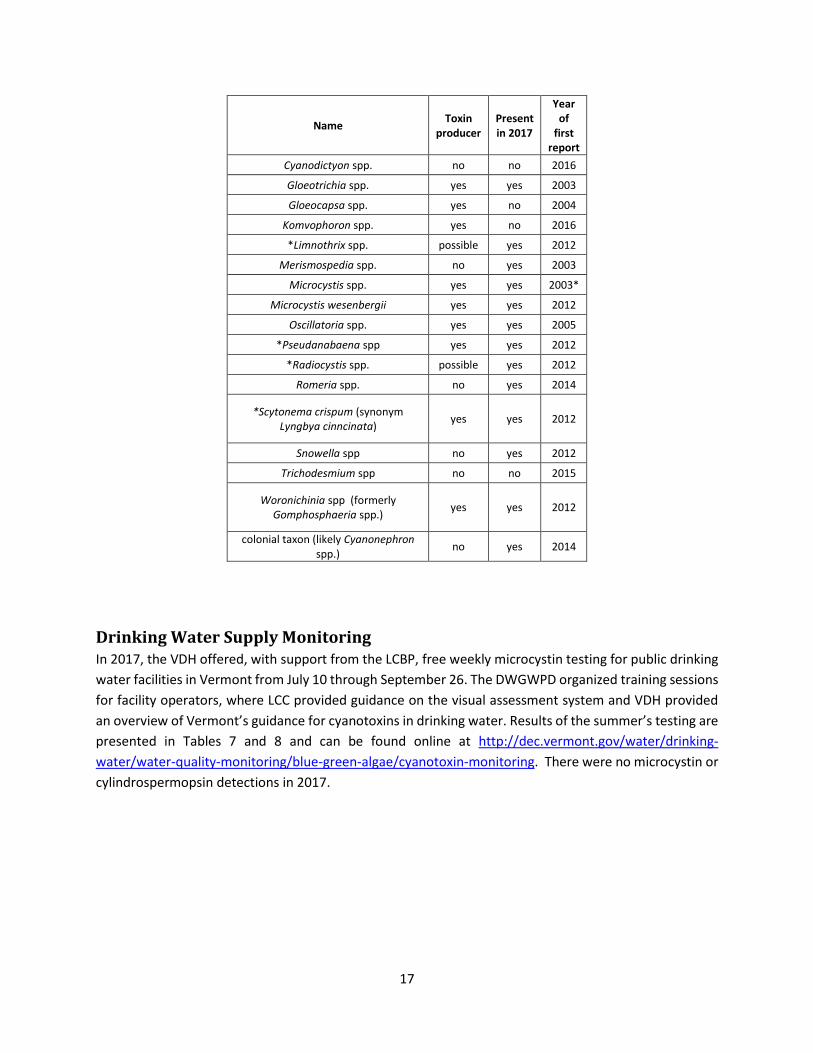
Table 6. Cyanobacteria taxa observed in Lake Champlain cyanobacteria monitoring samples. Year of first report refers only to
the cyanobacteria monitoring program. *Prior to 2012, cyanobacteria were noted to genus only.
Name Toxin
producer Present in 2017
Year of
first report
Anabaena circinalis yes yes 2003*
Anabaena planctonica yes yes 2003*
Anabaena spp yes yes 2003*
Anabaena flos-aquae yes yes 2015
Aphanizomenon spp. (likely A. gracile) yes yes 2012
Aphanizomenon flos-aquae yes yes 2003*
Aphanocapsa spp. no yes 2004
Aphanothece spp. yes yes 2012
Arthrospira spp. no yes 2012
Chroococcus spp. no yes 2003
Coelosphaerium spp. Yes yes 2003
17
Name Toxin
producer Present in 2017
Year of
first report
Cyanodictyon spp. no no 2016
Gloeotrichia spp. yes yes 2003
Gloeocapsa spp. yes no 2004
Komvophoron spp. yes no 2016
*Limnothrix spp. possible yes 2012
Merismospedia spp. no yes 2003
Microcystis spp. yes yes 2003*
Microcystis wesenbergii yes yes 2012
Oscillatoria spp. yes yes 2005
*Pseudanabaena spp yes yes 2012
*Radiocystis spp. possible yes 2012
Romeria spp. no yes 2014
*Scytonema crispum (synonym Lyngbya cinncinata)
yes yes 2012
Snowella spp no yes 2012
Trichodesmium spp no no 2015
Woronichinia spp (formerly Gomphosphaeria spp.)
yes yes 2012
colonial taxon (likely Cyanonephron spp.)
no yes 2014
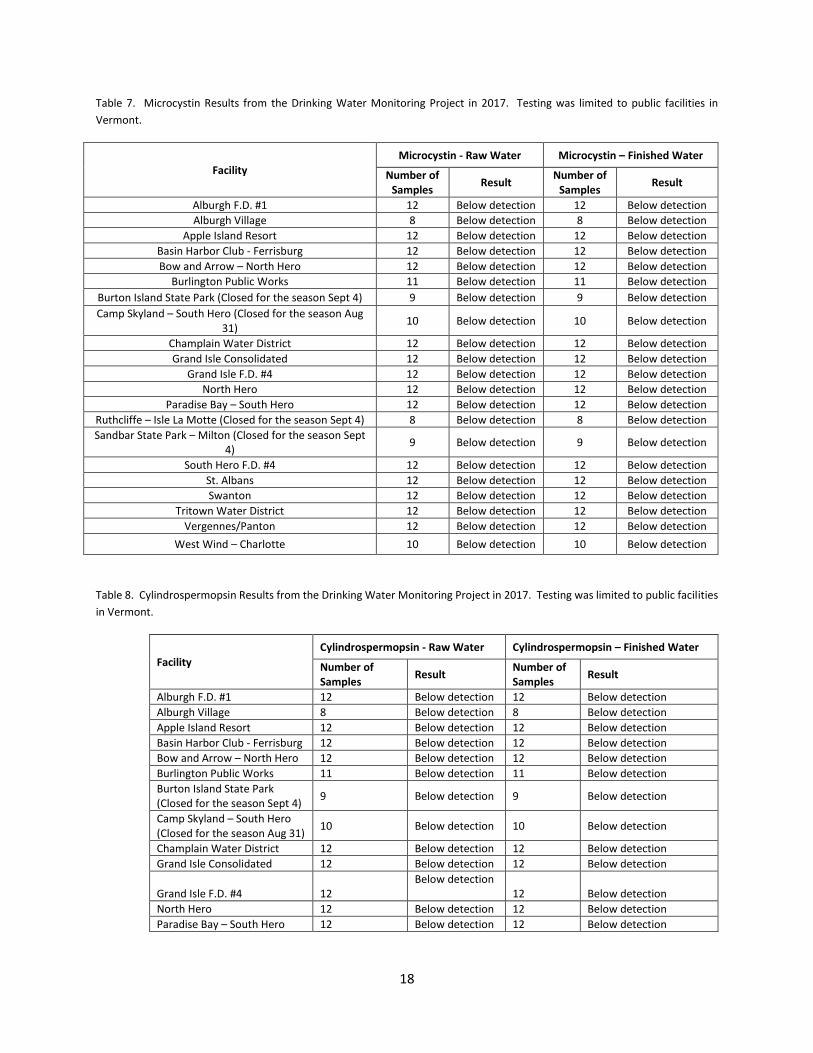
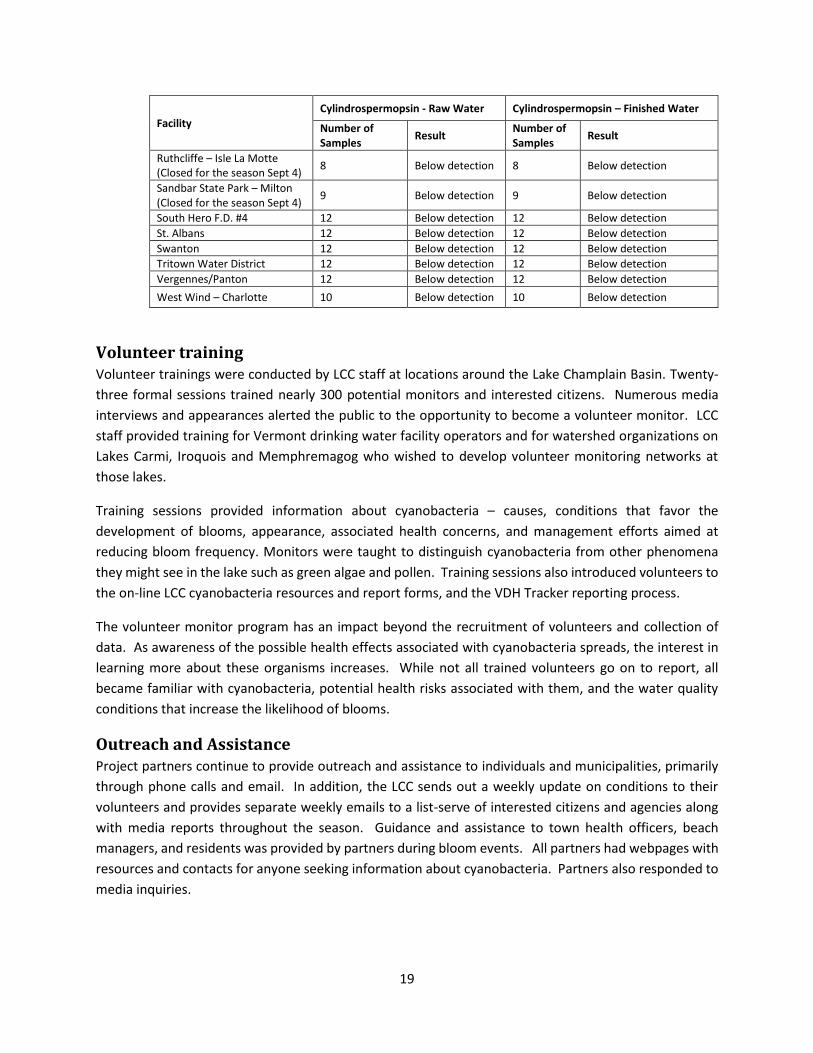
Drinking Water Supply Monitoring In 2017, the VDH offered, with support from the LCBP, free weekly microcystin testing for public drinking
water facilities in Vermont from July 10 through September 26. The DWGWPD organized training sessions
for facility operators, where LCC provided guidance on the visual assessment system and VDH provided
an overview of Vermont’s guidance for cyanotoxins in drinking water. Results of the summer’s testing are
presented in Tables 7 and 8 and can be found online at http://dec.vermont.gov/water/drinking-
water/water-quality-monitoring/blue-green-algae/cyanotoxin-monitoring. There were no microcystin or
cylindrospermopsin detections in 2017.
18
Table 7. Microcystin Results from the Drinking Water Monitoring Project in 2017. Testing was limited to public facilities in
Vermont.
Facility Microcystin - Raw Water Microcystin – Finished Water
Number of Samples
Result Number of
Samples Result
Alburgh F.D. #1 12 Below detection 12 Below detection
Alburgh Village 8 Below detection 8 Below detection
Apple Island Resort 12 Below detection 12 Below detection
Basin Harbor Club - Ferrisburg 12 Below detection 12 Below detection
Bow and Arrow – North Hero 12 Below detection 12 Below detection
Burlington Public Works 11 Below detection 11 Below detection
Burton Island State Park (Closed for the season Sept 4) 9 Below detection 9 Below detection
Camp Skyland – South Hero (Closed for the season Aug 31)
10 Below detection 10 Below detection
Champlain Water District 12 Below detection 12 Below detection
Grand Isle Consolidated 12 Below detection 12 Below detection
Grand Isle F.D. #4 12 Below detection 12 Below detection
North Hero 12 Below detection 12 Below detection
Paradise Bay – South Hero 12 Below detection 12 Below detection
Ruthcliffe – Isle La Motte (Closed for the season Sept 4) 8 Below detection 8 Below detection
Sandbar State Park – Milton (Closed for the season Sept 4)
9 Below detection 9 Below detection
South Hero F.D. #4 12 Below detection 12 Below detection
St. Albans 12 Below detection 12 Below detection
Swanton 12 Below detection 12 Below detection
Tritown Water District 12 Below detection 12 Below detection
Vergennes/Panton 12 Below detection 12 Below detection
West Wind – Charlotte 10 Below detection 10 Below detection
Table 8. Cylindrospermopsin Results from the Drinking Water Monitoring Project in 2017. Testing was limited to public facilities
in Vermont.
Facility
Cylindrospermopsin - Raw Water Cylindrospermopsin – Finished Water
Number of Samples
Result Number of Samples
Result
Alburgh F.D. #1 12 Below detection 12 Below detection
Alburgh Village 8 Below detection 8 Below detection
Apple Island Resort 12 Below detection 12 Below detection
Basin Harbor Club - Ferrisburg 12 Below detection 12 Below detection
Bow and Arrow – North Hero 12 Below detection 12 Below detection
Burlington Public Works 11 Below detection 11 Below detection
Burton Island State Park (Closed for the season Sept 4)
9 Below detection 9 Below detection
Camp Skyland – South Hero (Closed for the season Aug 31)
10 Below detection 10 Below detection
Champlain Water District 12 Below detection 12 Below detection
Grand Isle Consolidated 12 Below detection 12 Below detection
Grand Isle F.D. #4 12 Below detection 12 Below detection
North Hero 12 Below detection 12 Below detection
Paradise Bay – South Hero 12 Below detection 12 Below detection
19
Facility Cylindrospermopsin - Raw Water Cylindrospermopsin – Finished Water
Number of Samples
Result Number of Samples
Result
Ruthcliffe – Isle La Motte (Closed for the season Sept 4)
8 Below detection 8 Below detection
Sandbar State Park – Milton (Closed for the season Sept 4)
9 Below detection 9 Below detection
South Hero F.D. #4 12 Below detection 12 Below detection
St. Albans 12 Below detection 12 Below detection
Swanton 12 Below detection 12 Below detection
Tritown Water District 12 Below detection 12 Below detection
Vergennes/Panton 12 Below detection 12 Below detection
West Wind – Charlotte 10 Below detection 10 Below detection
Volunteer training Volunteer trainings were conducted by LCC staff at locations around the Lake Champlain Basin. Twenty-
three formal sessions trained nearly 300 potential monitors and interested citizens. Numerous media
interviews and appearances alerted the public to the opportunity to become a volunteer monitor. LCC
staff provided training for Vermont drinking water facility operators and for watershed organizations on
Lakes Carmi, Iroquois and Memphremagog who wished to develop volunteer monitoring networks at
those lakes.
Training sessions provided information about cyanobacteria – causes, conditions that favor the
development of blooms, appearance, associated health concerns, and management efforts aimed at
reducing bloom frequency. Monitors were taught to distinguish cyanobacteria from other phenomena
they might see in the lake such as green algae and pollen. Training sessions also introduced volunteers to
the on-line LCC cyanobacteria resources and report forms, and the VDH Tracker reporting process.
The volunteer monitor program has an impact beyond the recruitment of volunteers and collection of
data. As awareness of the possible health effects associated with cyanobacteria spreads, the interest in
learning more about these organisms increases. While not all trained volunteers go on to report, all
became familiar with cyanobacteria, potential health risks associated with them, and the water quality
conditions that increase the likelihood of blooms.
Outreach and Assistance Project partners continue to provide outreach and assistance to individuals and municipalities, primarily
through phone calls and email. In addition, the LCC sends out a weekly update on conditions to their
volunteers and provides separate weekly emails to a list-serve of interested citizens and agencies along
with media reports throughout the season. Guidance and assistance to town health officers, beach
managers, and residents was provided by partners during bloom events. All partners had webpages with
resources and contacts for anyone seeking information about cyanobacteria. Partners also responded to
media inquiries.
20
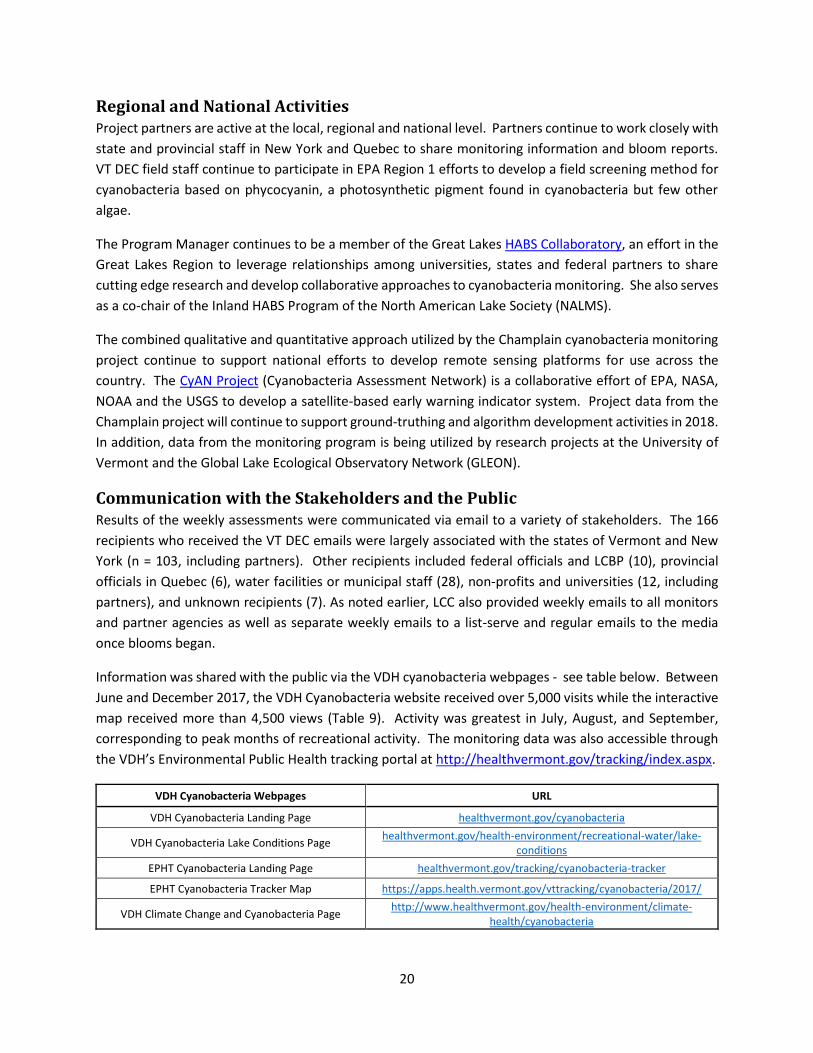
Regional and National Activities Project partners are active at the local, regional and national level. Partners continue to work closely with
state and provincial staff in New York and Quebec to share monitoring information and bloom reports.
VT DEC field staff continue to participate in EPA Region 1 efforts to develop a field screening method for
cyanobacteria based on phycocyanin, a photosynthetic pigment found in cyanobacteria but few other
algae.
The Program Manager continues to be a member of the Great Lakes HABS Collaboratory, an effort in the
Great Lakes Region to leverage relationships among universities, states and federal partners to share
cutting edge research and develop collaborative approaches to cyanobacteria monitoring. She also serves
as a co-chair of the Inland HABS Program of the North American Lake Society (NALMS).
The combined qualitative and quantitative approach utilized by the Champlain cyanobacteria monitoring
project continue to support national efforts to develop remote sensing platforms for use across the
country. The CyAN Project (Cyanobacteria Assessment Network) is a collaborative effort of EPA, NASA,
NOAA and the USGS to develop a satellite-based early warning indicator system. Project data from the
Champlain project will continue to support ground-truthing and algorithm development activities in 2018.
In addition, data from the monitoring program is being utilized by research projects at the University of
Vermont and the Global Lake Ecological Observatory Network (GLEON).
Communication with the Stakeholders and the Public Results of the weekly assessments were communicated via email to a variety of stakeholders. The 166
recipients who received the VT DEC emails were largely associated with the states of Vermont and New
York (n = 103, including partners). Other recipients included federal officials and LCBP (10), provincial
officials in Quebec (6), water facilities or municipal staff (28), non-profits and universities (12, including
partners), and unknown recipients (7). As noted earlier, LCC also provided weekly emails to all monitors
and partner agencies as well as separate weekly emails to a list-serve and regular emails to the media
once blooms began.
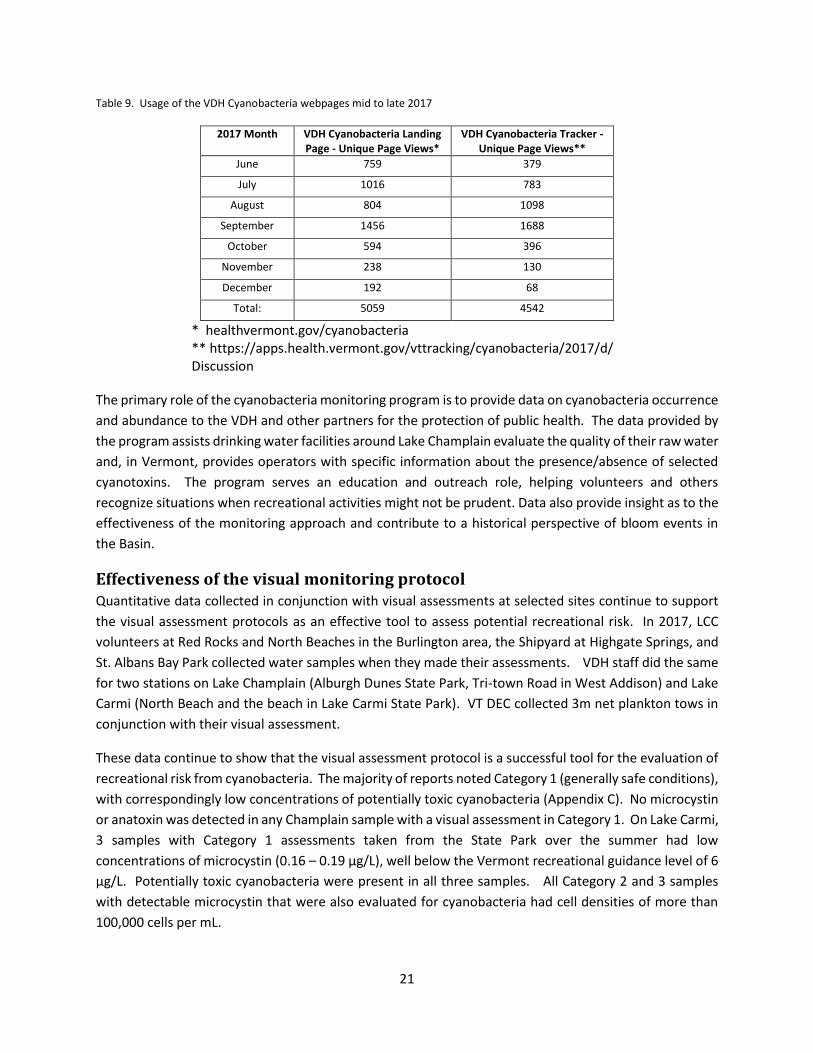
Information was shared with the public via the VDH cyanobacteria webpages - see table below. Between
June and December 2017, the VDH Cyanobacteria website received over 5,000 visits while the interactive
map received more than 4,500 views (Table 9). Activity was greatest in July, August, and September,
corresponding to peak months of recreational activity. The monitoring data was also accessible through
the VDH’s Environmental Public Health tracking portal at http://healthvermont.gov/tracking/index.aspx.
VDH Cyanobacteria Webpages URL
VDH Cyanobacteria Landing Page healthvermont.gov/cyanobacteria
VDH Cyanobacteria Lake Conditions Page healthvermont.gov/health-environment/recreational-water/lake-
conditions
EPHT Cyanobacteria Landing Page healthvermont.gov/tracking/cyanobacteria-tracker
EPHT Cyanobacteria Tracker Map https://apps.health.vermont.gov/vttracking/cyanobacteria/2017/
VDH Climate Change and Cyanobacteria Page http://www.healthvermont.gov/health-environment/climate-
health/cyanobacteria
21
Table 9. Usage of the VDH Cyanobacteria webpages mid to late 2017
2017 Month VDH Cyanobacteria Landing Page - Unique Page Views*
VDH Cyanobacteria Tracker - Unique Page Views**
June 759 379
July 1016 783
August 804 1098
September 1456 1688
October 594 396
November 238 130
December 192 68
Total: 5059 4542
* healthvermont.gov/cyanobacteria ** https://apps.health.vermont.gov/vttracking/cyanobacteria/2017/d/ Discussion
The primary role of the cyanobacteria monitoring program is to provide data on cyanobacteria occurrence
and abundance to the VDH and other partners for the protection of public health. The data provided by
the program assists drinking water facilities around Lake Champlain evaluate the quality of their raw water
and, in Vermont, provides operators with specific information about the presence/absence of selected
cyanotoxins. The program serves an education and outreach role, helping volunteers and others
recognize situations when recreational activities might not be prudent. Data also provide insight as to the
effectiveness of the monitoring approach and contribute to a historical perspective of bloom events in
the Basin.
Effectiveness of the visual monitoring protocol Quantitative data collected in conjunction with visual assessments at selected sites continue to support
the visual assessment protocols as an effective tool to assess potential recreational risk. In 2017, LCC
volunteers at Red Rocks and North Beaches in the Burlington area, the Shipyard at Highgate Springs, and
St. Albans Bay Park collected water samples when they made their assessments. VDH staff did the same
for two stations on Lake Champlain (Alburgh Dunes State Park, Tri-town Road in West Addison) and Lake
Carmi (North Beach and the beach in Lake Carmi State Park). VT DEC collected 3m net plankton tows in
conjunction with their visual assessment.
These data continue to show that the visual assessment protocol is a successful tool for the evaluation of
recreational risk from cyanobacteria. The majority of reports noted Category 1 (generally safe conditions),
with correspondingly low concentrations of potentially toxic cyanobacteria (Appendix C). No microcystin
or anatoxin was detected in any Champlain sample with a visual assessment in Category 1. On Lake Carmi,
3 samples with Category 1 assessments taken from the State Park over the summer had low
concentrations of microcystin (0.16 – 0.19 µg/L), well below the Vermont recreational guidance level of 6
µg/L. Potentially toxic cyanobacteria were present in all three samples. All Category 2 and 3 samples
with detectable microcystin that were also evaluated for cyanobacteria had cell densities of more than
100,000 cells per mL.
22
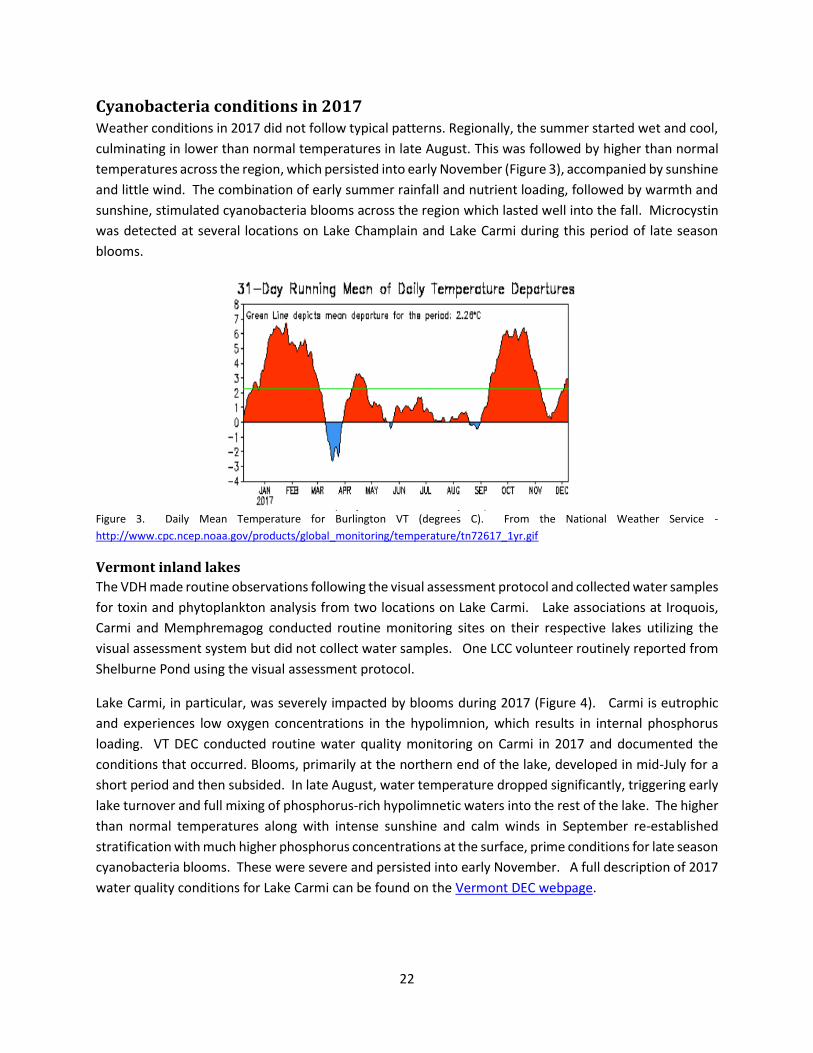
Cyanobacteria conditions in 2017 Weather conditions in 2017 did not follow typical patterns. Regionally, the summer started wet and cool,
culminating in lower than normal temperatures in late August. This was followed by higher than normal
temperatures across the region, which persisted into early November (Figure 3), accompanied by sunshine
and little wind. The combination of early summer rainfall and nutrient loading, followed by warmth and
sunshine, stimulated cyanobacteria blooms across the region which lasted well into the fall. Microcystin
was detected at several locations on Lake Champlain and Lake Carmi during this period of late season
blooms.
Figure 3. Daily Mean Temperature for Burlington VT (degrees C). From the National Weather Service -
http://www.cpc.ncep.noaa.gov/products/global_monitoring/temperature/tn72617_1yr.gif
Vermont inland lakes
The VDH made routine observations following the visual assessment protocol and collected water samples
for toxin and phytoplankton analysis from two locations on Lake Carmi. Lake associations at Iroquois,
Carmi and Memphremagog conducted routine monitoring sites on their respective lakes utilizing the
visual assessment system but did not collect water samples. One LCC volunteer routinely reported from
Shelburne Pond using the visual assessment protocol.
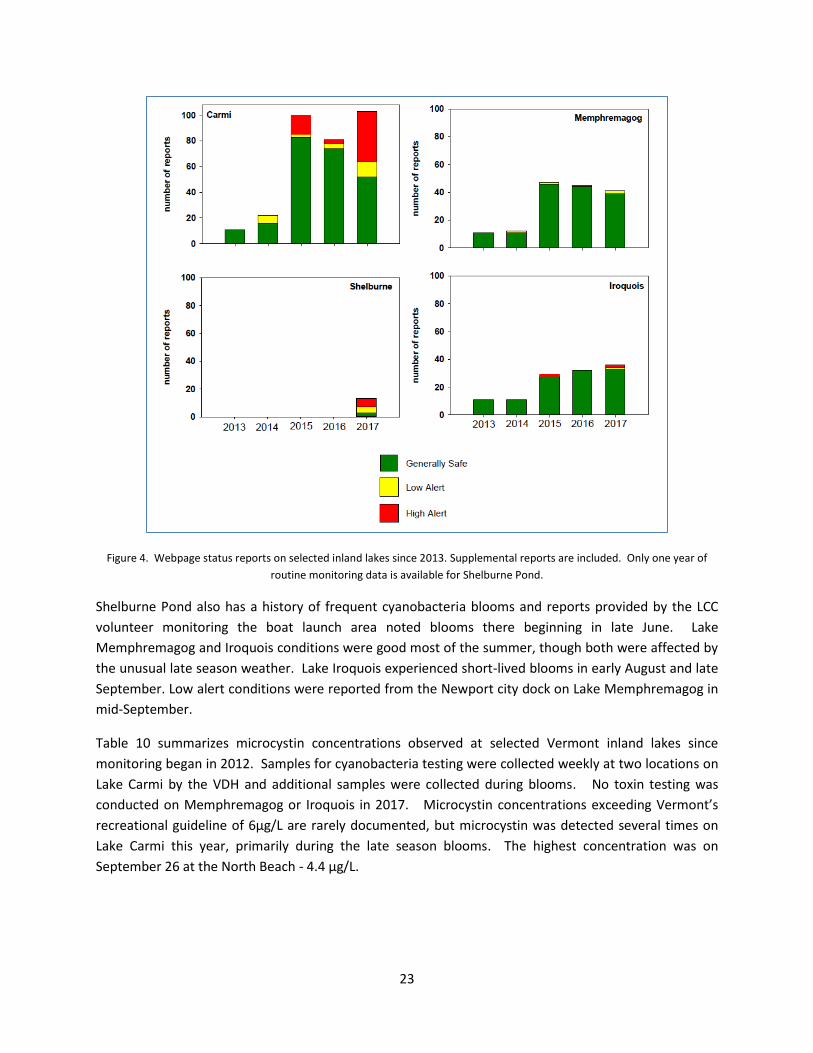
Lake Carmi, in particular, was severely impacted by blooms during 2017 (Figure 4). Carmi is eutrophic
and experiences low oxygen concentrations in the hypolimnion, which results in internal phosphorus
loading. VT DEC conducted routine water quality monitoring on Carmi in 2017 and documented the
conditions that occurred. Blooms, primarily at the northern end of the lake, developed in mid-July for a
short period and then subsided. In late August, water temperature dropped significantly, triggering early
lake turnover and full mixing of phosphorus-rich hypolimnetic waters into the rest of the lake. The higher
than normal temperatures along with intense sunshine and calm winds in September re-established
stratification with much higher phosphorus concentrations at the surface, prime conditions for late season
cyanobacteria blooms. These were severe and persisted into early November. A full description of 2017
water quality conditions for Lake Carmi can be found on the Vermont DEC webpage.
23
Figure 4. Webpage status reports on selected inland lakes since 2013. Supplemental reports are included. Only one year of
routine monitoring data is available for Shelburne Pond.
Shelburne Pond also has a history of frequent cyanobacteria blooms and reports provided by the LCC
volunteer monitoring the boat launch area noted blooms there beginning in late June. Lake
Memphremagog and Iroquois conditions were good most of the summer, though both were affected by
the unusual late season weather. Lake Iroquois experienced short-lived blooms in early August and late
September. Low alert conditions were reported from the Newport city dock on Lake Memphremagog in
mid-September.
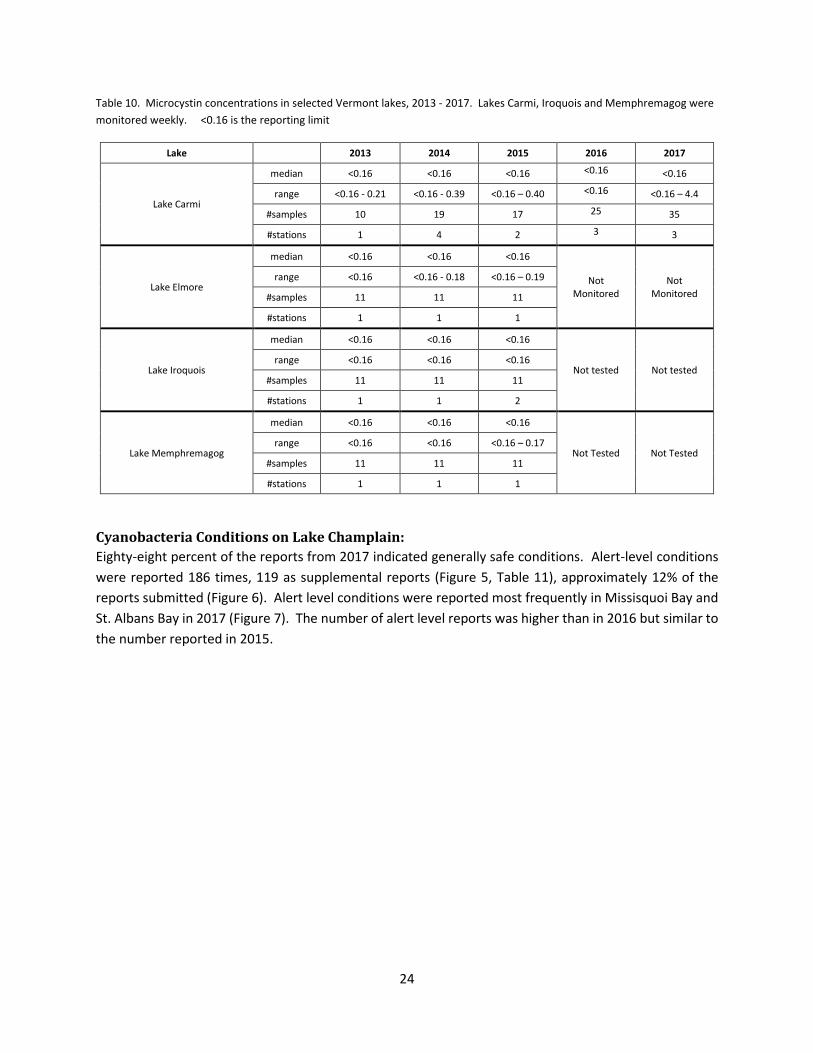
Table 10 summarizes microcystin concentrations observed at selected Vermont inland lakes since
monitoring began in 2012. Samples for cyanobacteria testing were collected weekly at two locations on
Lake Carmi by the VDH and additional samples were collected during blooms. No toxin testing was
conducted on Memphremagog or Iroquois in 2017. Microcystin concentrations exceeding Vermont’s
recreational guideline of 6µg/L are rarely documented, but microcystin was detected several times on
Lake Carmi this year, primarily during the late season blooms. The highest concentration was on
September 26 at the North Beach - 4.4 µg/L.
24
Table 10. Microcystin concentrations in selected Vermont lakes, 2013 - 2017. Lakes Carmi, Iroquois and Memphremagog were
monitored weekly. <0.16 is the reporting limit
Lake 2013 2014 2015 2016 2017
Lake Carmi
median <0.16 <0.16 <0.16 <0.16 <0.16
range <0.16 - 0.21 <0.16 - 0.39 <0.16 – 0.40 <0.16 <0.16 – 4.4
#samples 10 19 17 25 35
#stations 1 4 2 3 3
Lake Elmore
median <0.16 <0.16 <0.16
Not Monitored
Not Monitored
range <0.16 <0.16 - 0.18 <0.16 – 0.19
#samples 11 11 11
#stations 1 1 1
Lake Iroquois
median <0.16 <0.16 <0.16
Not tested Not tested range <0.16 <0.16 <0.16
#samples 11 11 11
#stations 1 1 2
Lake Memphremagog
median <0.16 <0.16 <0.16
Not Tested Not Tested range <0.16 <0.16 <0.16 – 0.17
#samples 11 11 11
#stations 1 1 1
Cyanobacteria Conditions on Lake Champlain:
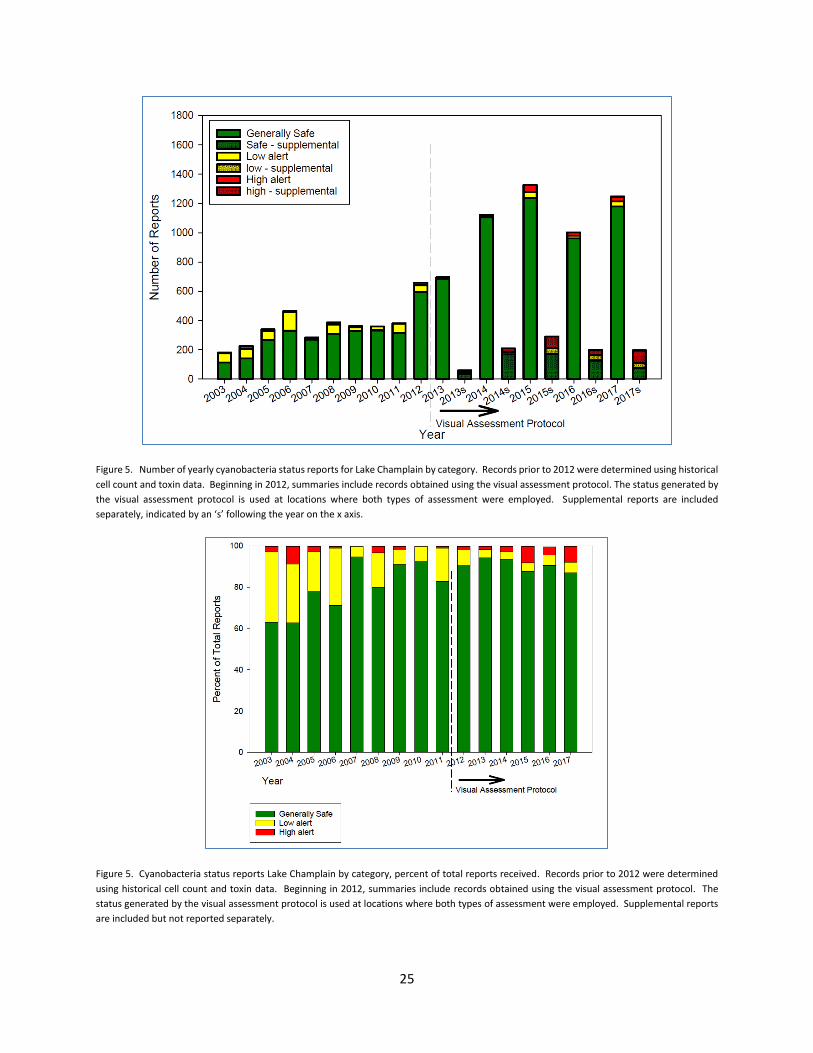
Eighty-eight percent of the reports from 2017 indicated generally safe conditions. Alert-level conditions
were reported 186 times, 119 as supplemental reports (Figure 5, Table 11), approximately 12% of the
reports submitted (Figure 6). Alert level conditions were reported most frequently in Missisquoi Bay and
St. Albans Bay in 2017 (Figure 7). The number of alert level reports was higher than in 2016 but similar to
the number reported in 2015.
25
Figure 5. Number of yearly cyanobacteria status reports for Lake Champlain by category. Records prior to 2012 were determined using historical
cell count and toxin data. Beginning in 2012, summaries include records obtained using the visual assessment protocol. The status generated by
the visual assessment protocol is used at locations where both types of assessment were employed. Supplemental reports are included
separately, indicated by an ‘s’ following the year on the x axis.
Figure 5. Cyanobacteria status reports Lake Champlain by category, percent of total reports received. Records prior to 2012 were determined
using historical cell count and toxin data. Beginning in 2012, summaries include records obtained using the visual assessment protocol. The
status generated by the visual assessment protocol is used at locations where both types of assessment were employed. Supplemental reports
are included but not reported separately.
26
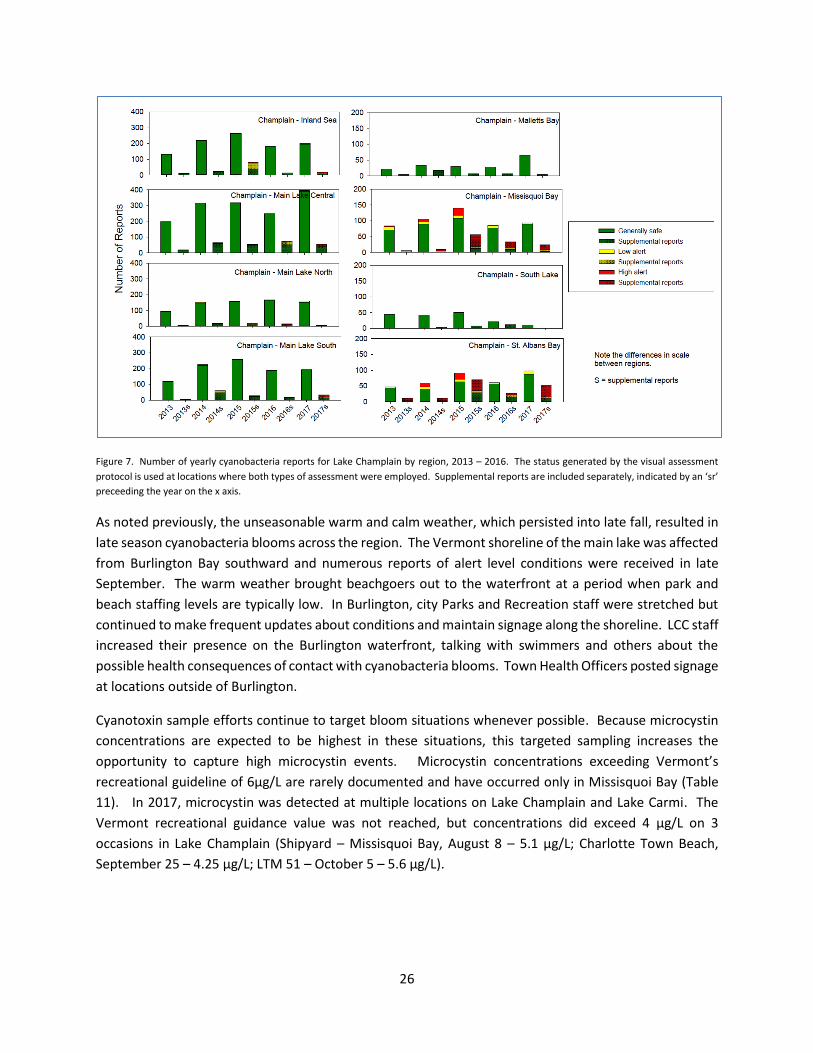
Figure 7. Number of yearly cyanobacteria reports for Lake Champlain by region, 2013 – 2016. The status generated by the visual assessment
protocol is used at locations where both types of assessment were employed. Supplemental reports are included separately, indicated by an ‘sr’
preceeding the year on the x axis.
As noted previously, the unseasonable warm and calm weather, which persisted into late fall, resulted in
late season cyanobacteria blooms across the region. The Vermont shoreline of the main lake was affected
from Burlington Bay southward and numerous reports of alert level conditions were received in late
September. The warm weather brought beachgoers out to the waterfront at a period when park and
beach staffing levels are typically low. In Burlington, city Parks and Recreation staff were stretched but
continued to make frequent updates about conditions and maintain signage along the shoreline. LCC staff
increased their presence on the Burlington waterfront, talking with swimmers and others about the
possible health consequences of contact with cyanobacteria blooms. Town Health Officers posted signage
at locations outside of Burlington.
Cyanotoxin sample efforts continue to target bloom situations whenever possible. Because microcystin
concentrations are expected to be highest in these situations, this targeted sampling increases the
opportunity to capture high microcystin events. Microcystin concentrations exceeding Vermont’s
recreational guideline of 6µg/L are rarely documented and have occurred only in Missisquoi Bay (Table
11). In 2017, microcystin was detected at multiple locations on Lake Champlain and Lake Carmi. The
Vermont recreational guidance value was not reached, but concentrations did exceed 4 µg/L on 3
occasions in Lake Champlain (Shipyard – Missisquoi Bay, August 8 – 5.1 µg/L; Charlotte Town Beach,
September 25 – 4.25 µg/L; LTM 51 – October 5 – 5.6 µg/L).
27
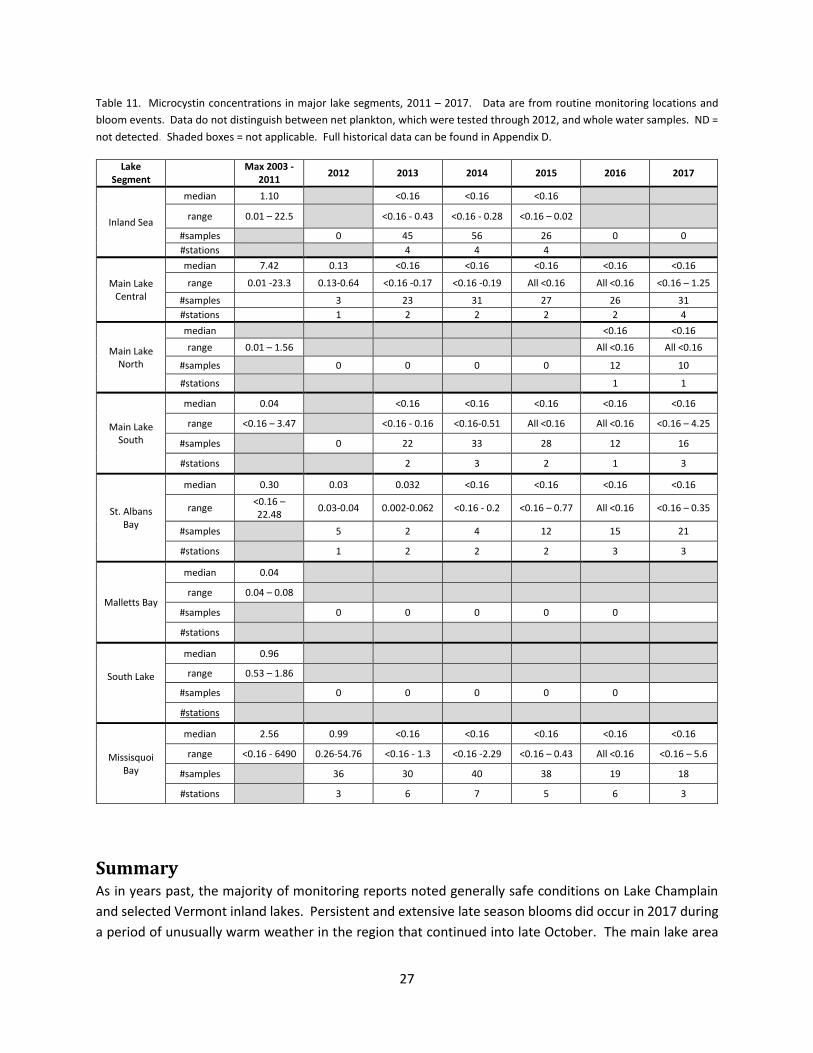
Table 11. Microcystin concentrations in major lake segments, 2011 – 2017. Data are from routine monitoring locations and
bloom events. Data do not distinguish between net plankton, which were tested through 2012, and whole water samples. ND =
not detected. Shaded boxes = not applicable. Full historical data can be found in Appendix D.
Lake Segment
Max 2003 -
2011 2012 2013 2014 2015 2016 2017
Inland Sea
median 1.10 <0.16 <0.16 <0.16
range 0.01 – 22.5 <0.16 - 0.43 <0.16 - 0.28 <0.16 – 0.02
#samples 0 45 56 26 0 0
#stations 4 4 4
Main Lake Central
median 7.42 0.13 <0.16 <0.16 <0.16 <0.16 <0.16
range 0.01 -23.3 0.13-0.64 <0.16 -0.17 <0.16 -0.19 All <0.16 All <0.16 <0.16 – 1.25
#samples 3 23 31 27 26 31
#stations 1 2 2 2 2 4
Main Lake North
median <0.16 <0.16
range 0.01 – 1.56 All <0.16 All <0.16
#samples 0 0 0 0 12 10
#stations 1 1
Main Lake South
median 0.04 <0.16 <0.16 <0.16 <0.16 <0.16
range <0.16 – 3.47 <0.16 - 0.16 <0.16-0.51 All <0.16 All <0.16 <0.16 – 4.25
#samples 0 22 33 28 12 16
#stations 2 3 2 1 3
St. Albans Bay
median 0.30 0.03 0.032 <0.16 <0.16 <0.16 <0.16
range <0.16 – 22.48
0.03-0.04 0.002-0.062 <0.16 - 0.2 <0.16 – 0.77 All <0.16 <0.16 – 0.35
#samples 5 2 4 12 15 21
#stations 1 2 2 2 3 3
Malletts Bay
median 0.04
range 0.04 – 0.08
#samples 0 0 0 0 0
#stations
South Lake
median 0.96
range 0.53 – 1.86
#samples 0 0 0 0 0
#stations
Missisquoi Bay
median 2.56 0.99 <0.16 <0.16 <0.16 <0.16 <0.16
range <0.16 - 6490 0.26-54.76 <0.16 - 1.3 <0.16 -2.29 <0.16 – 0.43 All <0.16 <0.16 – 5.6
#samples 36 30 40 38 19 18
#stations 3 6 7 5 6 3
Summary As in years past, the majority of monitoring reports noted generally safe conditions on Lake Champlain
and selected Vermont inland lakes. Persistent and extensive late season blooms did occur in 2017 during
a period of unusually warm weather in the region that continued into late October. The main lake area
28
of Champlain, St. Albans Bay and Lake Carmi were particularly impacted. The warm weather drew
residents to the beaches and shoreline at a time when parks and beaches typically are closed or operating
with reduced staffing, stretching resources at many levels. Outreach and signage at affected areas were
very important in raising awareness of the potential health consequences of exposure to cyanobacteria.
Climate change is expected to lengthen the cyanobacteria growing season and this year’s late season
blooms highlighted gaps in resources that should be considered in the future.
The monitoring project continues to grow. LCC Volunteers continue to be the backbone of the monitoring
program, providing areal coverage and report frequencies which are difficult to obtain with a traditional
monitoring program. While several federal agencies are cooperating to develop satellite monitoring for
the Northeast, volunteers will continue to be essential to this monitoring program because of their ability
to report more frequently and without interruption by cloud cover. The monitoring partnership continues
to leverage existing resources in the Champlain Basin to support the cyanobacteria program. In 2018, we
will be working in conjunction with the New York DEC and New York Department of Health to raise
awareness of the CyanoTracker and volunteer opportunities along the New York shores of Lake
Champlain.
Acknowledgements Project funding was provided by the Lake Champlain Basin Program, the State of Vermont, CDC grants to
the VDH, and LCBP and private funding to the Lake Champlain Committee. This project is very much a
collaborative effort and we’d like to thank all those who have contributed to its successful implementation
- Pete Stangel and Ali Davis (VT DEC Watershed Management); Lisa Cicchetti and Bennett Truman (VDH);
Kirk Kimball and Marie Sawyer (VDH Laboratory); Pete Young and Jan Leja (VDH developers of the Tracker
map); Dom Brennan and Alexa Hachigian (LCC), and especially the LCC citizen volunteer monitors who
continue to be the backbone of this monitoring effort.
Literature Cited Rogalus, M. and M. Watzin. 2008. Evaluation of Sampling and Screening Techniques for Tiered
Monitoring of Toxic Cyanobacteria in Lakes. Harmful Algae 7(4):504-514.
29
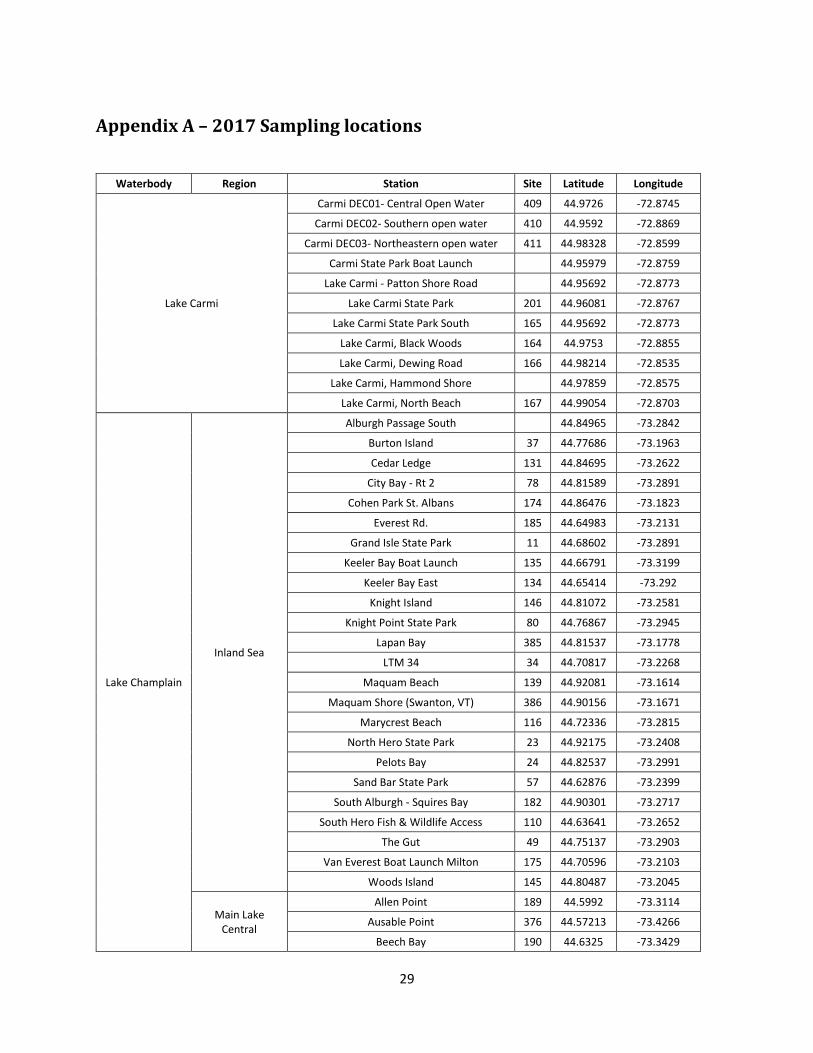
Appendix A – 2017 Sampling locations
Waterbody Region Station Site Latitude Longitude
Lake Carmi
Carmi DEC01- Central Open Water 409 44.9726 -72.8745
Carmi DEC02- Southern open water 410 44.9592 -72.8869
Carmi DEC03- Northeastern open water 411 44.98328 -72.8599
Carmi State Park Boat Launch 44.95979 -72.8759
Lake Carmi - Patton Shore Road 44.95692 -72.8773
Lake Carmi State Park 201 44.96081 -72.8767
Lake Carmi State Park South 165 44.95692 -72.8773
Lake Carmi, Black Woods 164 44.9753 -72.8855
Lake Carmi, Dewing Road 166 44.98214 -72.8535
Lake Carmi, Hammond Shore 44.97859 -72.8575
Lake Carmi, North Beach 167 44.99054 -72.8703
Lake Champlain
Inland Sea
Alburgh Passage South 44.84965 -73.2842
Burton Island 37 44.77686 -73.1963
Cedar Ledge 131 44.84695 -73.2622
City Bay - Rt 2 78 44.81589 -73.2891
Cohen Park St. Albans 174 44.86476 -73.1823
Everest Rd. 185 44.64983 -73.2131
Grand Isle State Park 11 44.68602 -73.2891
Keeler Bay Boat Launch 135 44.66791 -73.3199
Keeler Bay East 134 44.65414 -73.292
Knight Island 146 44.81072 -73.2581
Knight Point State Park 80 44.76867 -73.2945
Lapan Bay 385 44.81537 -73.1778
LTM 34 34 44.70817 -73.2268
Maquam Beach 139 44.92081 -73.1614
Maquam Shore (Swanton, VT) 386 44.90156 -73.1671
Marycrest Beach 116 44.72336 -73.2815
North Hero State Park 23 44.92175 -73.2408
Pelots Bay 24 44.82537 -73.2991
Sand Bar State Park 57 44.62876 -73.2399
South Alburgh - Squires Bay 182 44.90301 -73.2717
South Hero Fish & Wildlife Access 110 44.63641 -73.2652
The Gut 49 44.75137 -73.2903
Van Everest Boat Launch Milton 175 44.70596 -73.2103
Woods Island 145 44.80487 -73.2045
Main Lake Central
Allen Point 189 44.5992 -73.3114
Ausable Point 376 44.57213 -73.4266
Beech Bay 190 44.6325 -73.3429
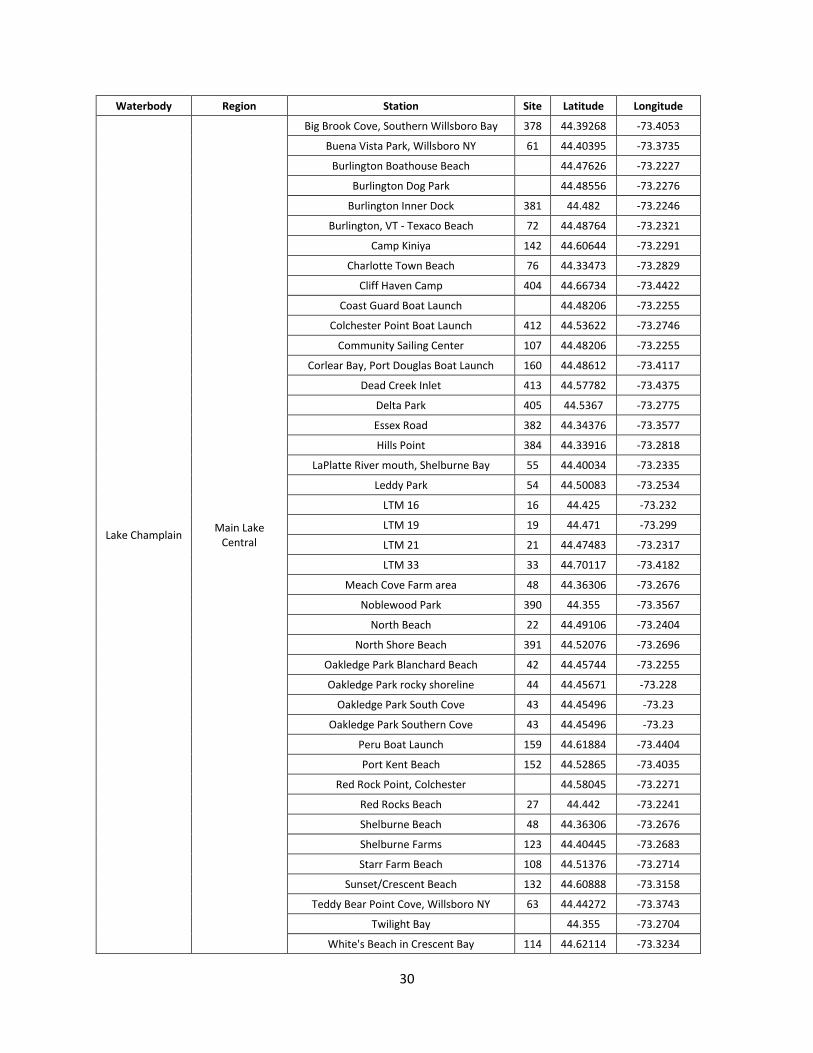
30
Waterbody Region Station Site Latitude Longitude
Lake Champlain Main Lake
Central
Big Brook Cove, Southern Willsboro Bay 378 44.39268 -73.4053
Buena Vista Park, Willsboro NY 61 44.40395 -73.3735
Burlington Boathouse Beach 44.47626 -73.2227
Burlington Dog Park 44.48556 -73.2276
Burlington Inner Dock 381 44.482 -73.2246
Burlington, VT - Texaco Beach 72 44.48764 -73.2321
Camp Kiniya 142 44.60644 -73.2291
Charlotte Town Beach 76 44.33473 -73.2829
Cliff Haven Camp 404 44.66734 -73.4422
Coast Guard Boat Launch 44.48206 -73.2255
Colchester Point Boat Launch 412 44.53622 -73.2746
Community Sailing Center 107 44.48206 -73.2255
Corlear Bay, Port Douglas Boat Launch 160 44.48612 -73.4117
Dead Creek Inlet 413 44.57782 -73.4375
Delta Park 405 44.5367 -73.2775
Essex Road 382 44.34376 -73.3577
Hills Point 384 44.33916 -73.2818
LaPlatte River mouth, Shelburne Bay 55 44.40034 -73.2335
Leddy Park 54 44.50083 -73.2534
LTM 16 16 44.425 -73.232
LTM 19 19 44.471 -73.299
LTM 21 21 44.47483 -73.2317
LTM 33 33 44.70117 -73.4182
Meach Cove Farm area 48 44.36306 -73.2676
Noblewood Park 390 44.355 -73.3567
North Beach 22 44.49106 -73.2404
North Shore Beach 391 44.52076 -73.2696
Oakledge Park Blanchard Beach 42 44.45744 -73.2255
Oakledge Park rocky shoreline 44 44.45671 -73.228
Oakledge Park South Cove 43 44.45496 -73.23
Oakledge Park Southern Cove 43 44.45496 -73.23
Peru Boat Launch 159 44.61884 -73.4404
Port Kent Beach 152 44.52865 -73.4035
Red Rock Point, Colchester 44.58045 -73.2271
Red Rocks Beach 27 44.442 -73.2241
Shelburne Beach 48 44.36306 -73.2676
Shelburne Farms 123 44.40445 -73.2683
Starr Farm Beach 108 44.51376 -73.2714
Sunset/Crescent Beach 132 44.60888 -73.3158
Teddy Bear Point Cove, Willsboro NY 63 44.44272 -73.3743
Twilight Bay 44.355 -73.2704
White's Beach in Crescent Bay 114 44.62114 -73.3234
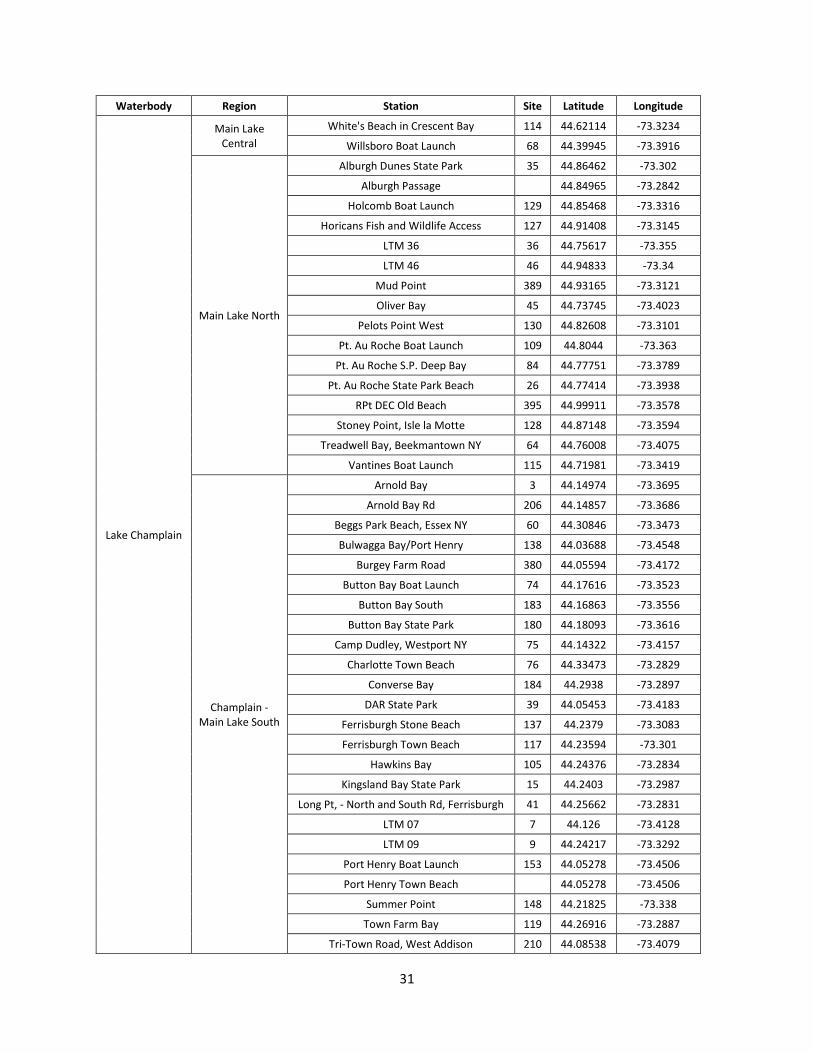
31
Waterbody Region Station Site Latitude Longitude
Lake Champlain
Main Lake Central
White's Beach in Crescent Bay 114 44.62114 -73.3234
Willsboro Boat Launch 68 44.39945 -73.3916
Main Lake North
Alburgh Dunes State Park 35 44.86462 -73.302
Alburgh Passage 44.84965 -73.2842
Holcomb Boat Launch 129 44.85468 -73.3316
Horicans Fish and Wildlife Access 127 44.91408 -73.3145
LTM 36 36 44.75617 -73.355
LTM 46 46 44.94833 -73.34
Mud Point 389 44.93165 -73.3121
Oliver Bay 45 44.73745 -73.4023
Pelots Point West 130 44.82608 -73.3101
Pt. Au Roche Boat Launch 109 44.8044 -73.363
Pt. Au Roche S.P. Deep Bay 84 44.77751 -73.3789
Pt. Au Roche State Park Beach 26 44.77414 -73.3938
RPt DEC Old Beach 395 44.99911 -73.3578
Stoney Point, Isle la Motte 128 44.87148 -73.3594
Treadwell Bay, Beekmantown NY 64 44.76008 -73.4075
Vantines Boat Launch 115 44.71981 -73.3419
Champlain - Main Lake South
Arnold Bay 3 44.14974 -73.3695
Arnold Bay Rd 206 44.14857 -73.3686
Beggs Park Beach, Essex NY 60 44.30846 -73.3473
Bulwagga Bay/Port Henry 138 44.03688 -73.4548
Burgey Farm Road 380 44.05594 -73.4172
Button Bay Boat Launch 74 44.17616 -73.3523
Button Bay South 183 44.16863 -73.3556
Button Bay State Park 180 44.18093 -73.3616
Camp Dudley, Westport NY 75 44.14322 -73.4157
Charlotte Town Beach 76 44.33473 -73.2829
Converse Bay 184 44.2938 -73.2897
DAR State Park 39 44.05453 -73.4183
Ferrisburgh Stone Beach 137 44.2379 -73.3083
Ferrisburgh Town Beach 117 44.23594 -73.301
Hawkins Bay 105 44.24376 -73.2834
Kingsland Bay State Park 15 44.2403 -73.2987
Long Pt, - North and South Rd, Ferrisburgh 41 44.25662 -73.2831
LTM 07 7 44.126 -73.4128
LTM 09 9 44.24217 -73.3292
Port Henry Boat Launch 153 44.05278 -73.4506
Port Henry Town Beach 44.05278 -73.4506
Summer Point 148 44.21825 -73.338
Town Farm Bay 119 44.26916 -73.2887
Tri-Town Road, West Addison 210 44.08538 -73.4079
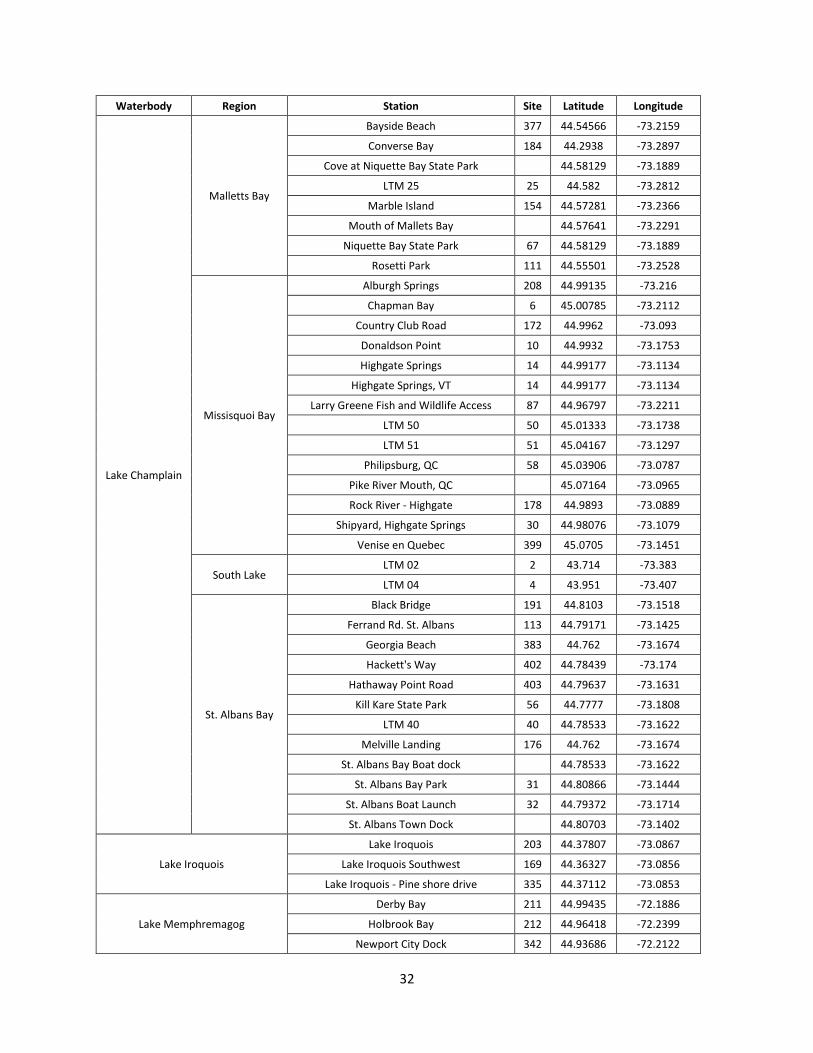
32
Waterbody Region Station Site Latitude Longitude
Lake Champlain
Malletts Bay
Bayside Beach 377 44.54566 -73.2159
Converse Bay 184 44.2938 -73.2897
Cove at Niquette Bay State Park 44.58129 -73.1889
LTM 25 25 44.582 -73.2812
Marble Island 154 44.57281 -73.2366
Mouth of Mallets Bay 44.57641 -73.2291
Niquette Bay State Park 67 44.58129 -73.1889
Rosetti Park 111 44.55501 -73.2528
Missisquoi Bay
Alburgh Springs 208 44.99135 -73.216
Chapman Bay 6 45.00785 -73.2112
Country Club Road 172 44.9962 -73.093
Donaldson Point 10 44.9932 -73.1753
Highgate Springs 14 44.99177 -73.1134
Highgate Springs, VT 14 44.99177 -73.1134
Larry Greene Fish and Wildlife Access 87 44.96797 -73.2211
LTM 50 50 45.01333 -73.1738
LTM 51 51 45.04167 -73.1297
Philipsburg, QC 58 45.03906 -73.0787
Pike River Mouth, QC 45.07164 -73.0965
Rock River - Highgate 178 44.9893 -73.0889
Shipyard, Highgate Springs 30 44.98076 -73.1079
Venise en Quebec 399 45.0705 -73.1451
South Lake LTM 02 2 43.714 -73.383
LTM 04 4 43.951 -73.407
St. Albans Bay
Black Bridge 191 44.8103 -73.1518
Ferrand Rd. St. Albans 113 44.79171 -73.1425
Georgia Beach 383 44.762 -73.1674
Hackett's Way 402 44.78439 -73.174
Hathaway Point Road 403 44.79637 -73.1631
Kill Kare State Park 56 44.7777 -73.1808
LTM 40 40 44.78533 -73.1622
Melville Landing 176 44.762 -73.1674
St. Albans Bay Boat dock 44.78533 -73.1622
St. Albans Bay Park 31 44.80866 -73.1444
St. Albans Boat Launch 32 44.79372 -73.1714
St. Albans Town Dock 44.80703 -73.1402
Lake Iroquois
Lake Iroquois 203 44.37807 -73.0867
Lake Iroquois Southwest 169 44.36327 -73.0856
Lake Iroquois - Pine shore drive 335 44.37112 -73.0853
Lake Memphremagog
Derby Bay 211 44.99435 -72.1886
Holbrook Bay 212 44.96418 -72.2399
Newport City Dock 342 44.93686 -72.2122
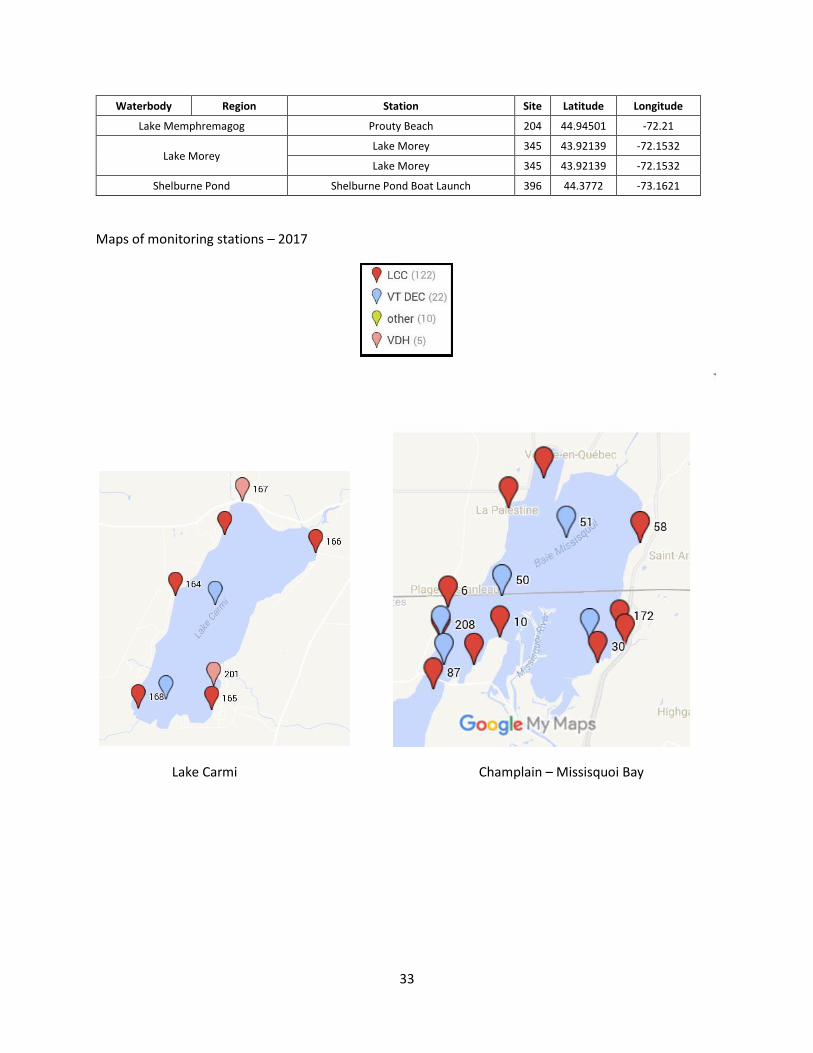
33
Waterbody Region Station Site Latitude Longitude
Lake Memphremagog Prouty Beach 204 44.94501 -72.21
Lake Morey Lake Morey 345 43.92139 -72.1532
Lake Morey 345 43.92139 -72.1532
Shelburne Pond Shelburne Pond Boat Launch 396 44.3772 -73.1621
Maps of monitoring stations – 2017
Lake Carmi Champlain – Missisquoi Bay
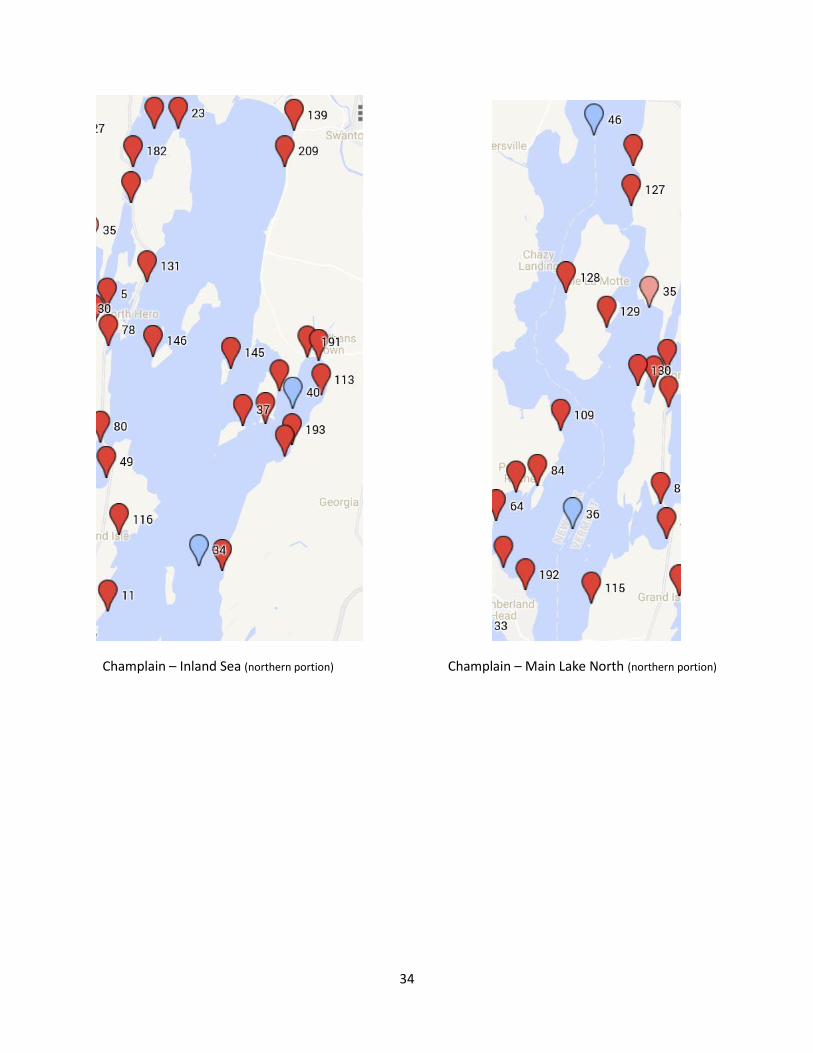
34
Champlain – Inland Sea (northern portion) Champlain – Main Lake North (northern portion)
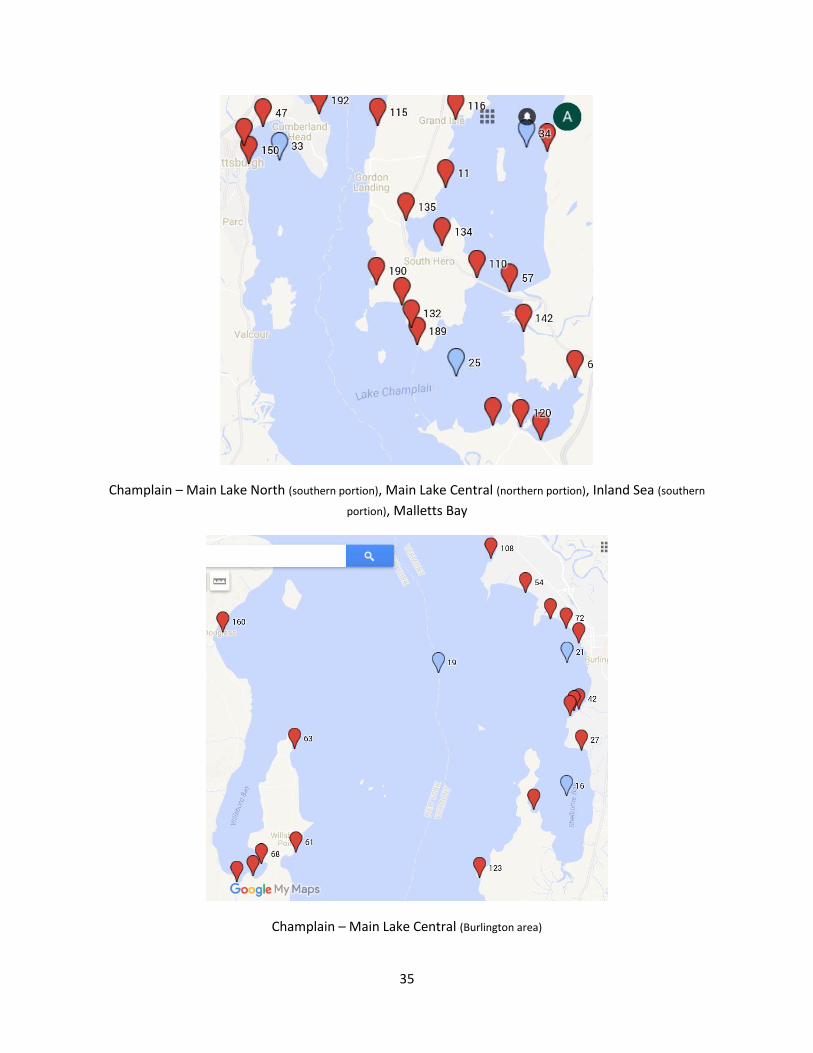
35
Champlain – Main Lake North (southern portion), Main Lake Central (northern portion), Inland Sea (southern
portion), Malletts Bay
Champlain – Main Lake Central (Burlington area)
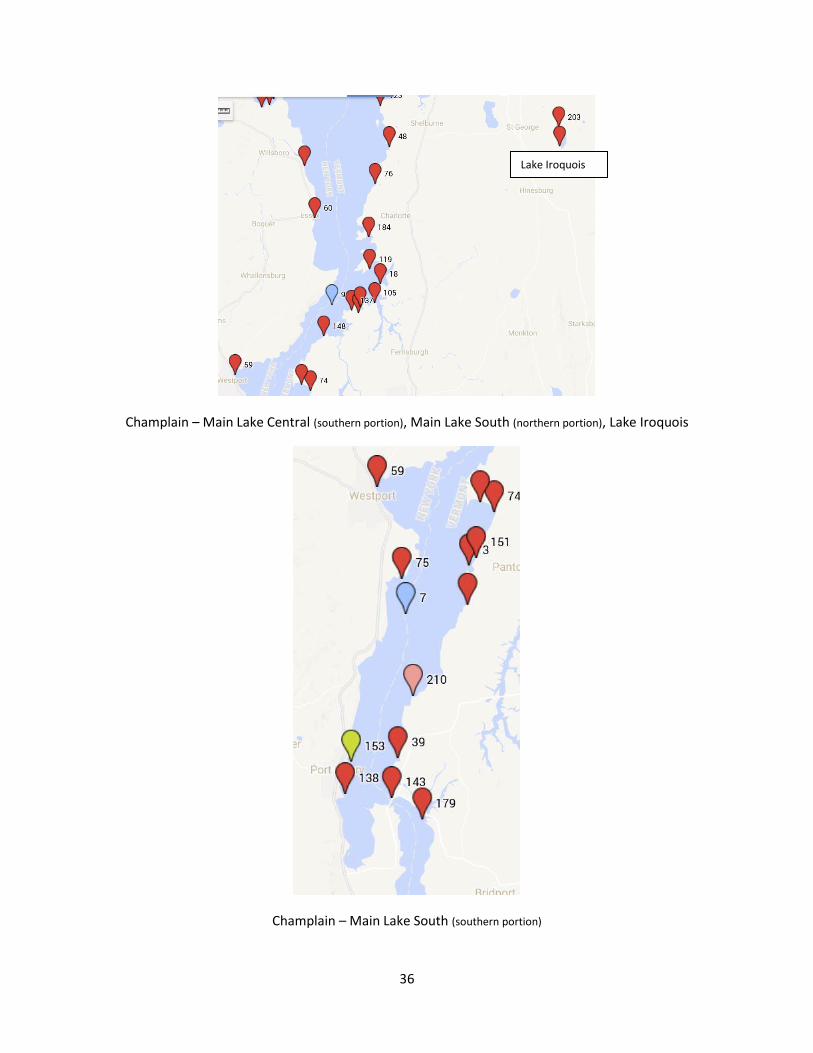
36
Champlain – Main Lake Central (southern portion), Main Lake South (northern portion), Lake Iroquois
Champlain – Main Lake South (southern portion)
Lake Iroquois
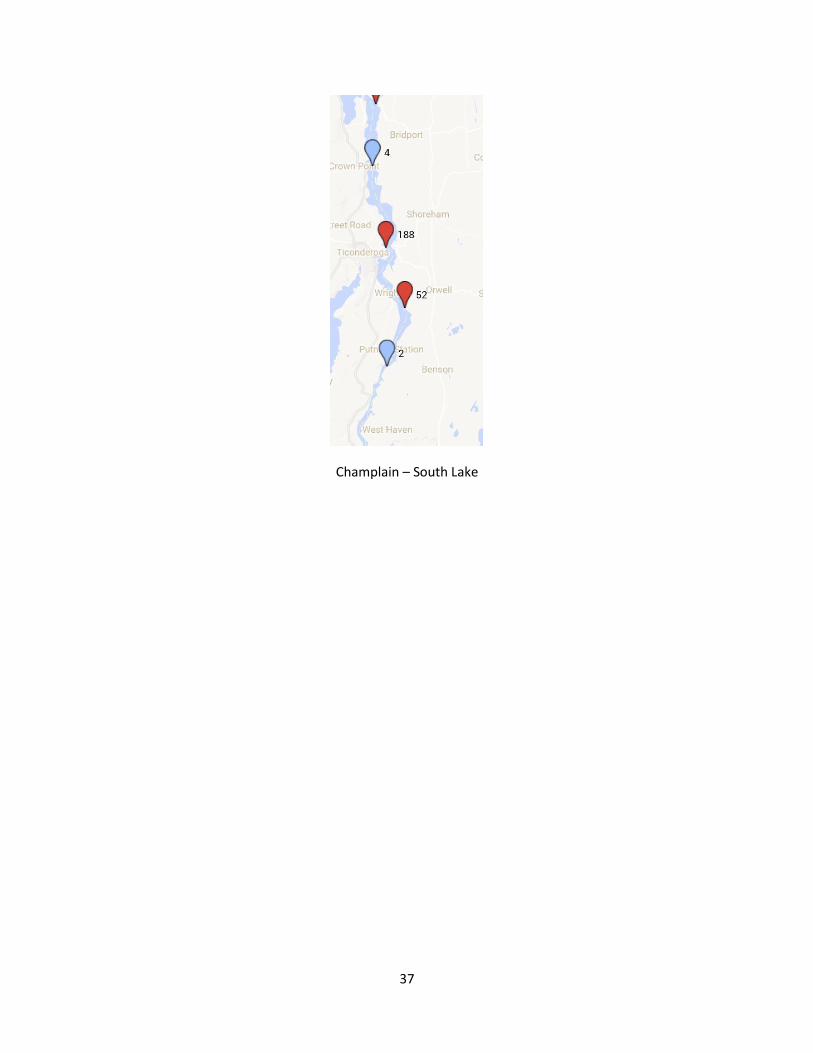
37
Champlain – South Lake
38
Appendix B. Visual assessment protocols from the Lake Champlain
Committee website
B.1. LCC Guidance for Determining Algae Bloom Intensity
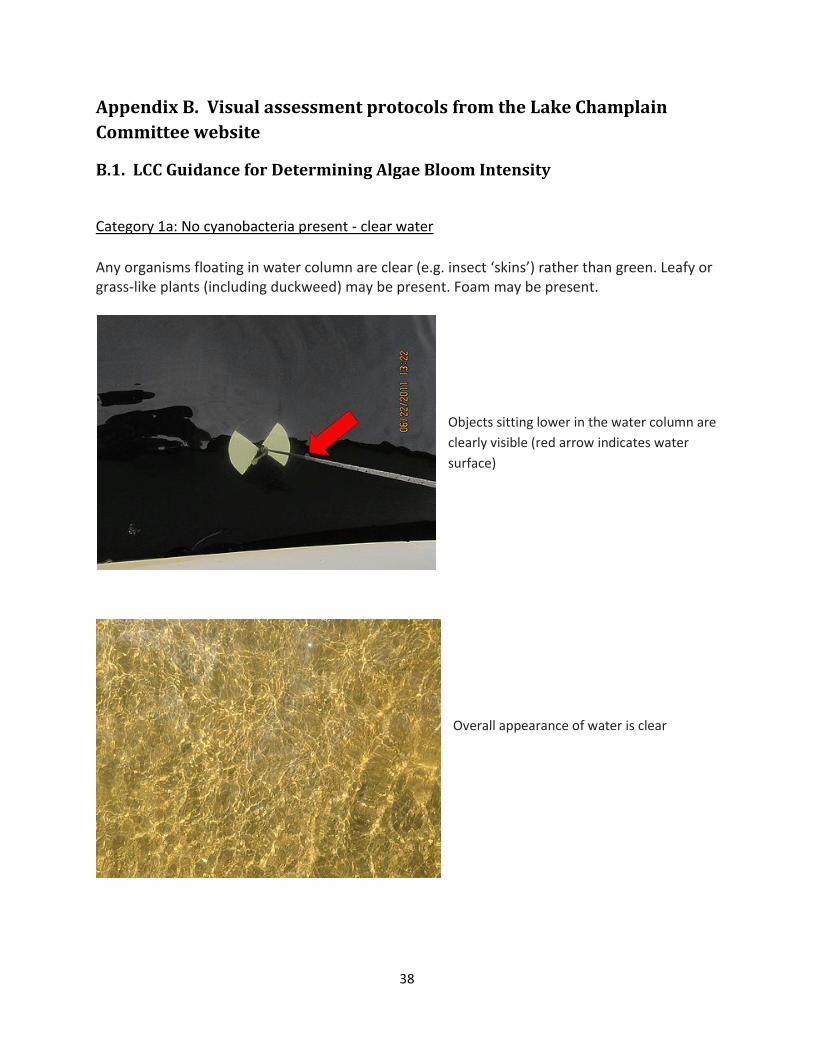
Category 1a: No cyanobacteria present - clear water
Any organisms floating in water column are clear (e.g. insect ‘skins’) rather than green. Leafy or grass-like plants (including duckweed) may be present. Foam may be present.
Objects sitting lower in the water column are
clearly visible (red arrow indicates water
surface)
Overall appearance of water is clear
39
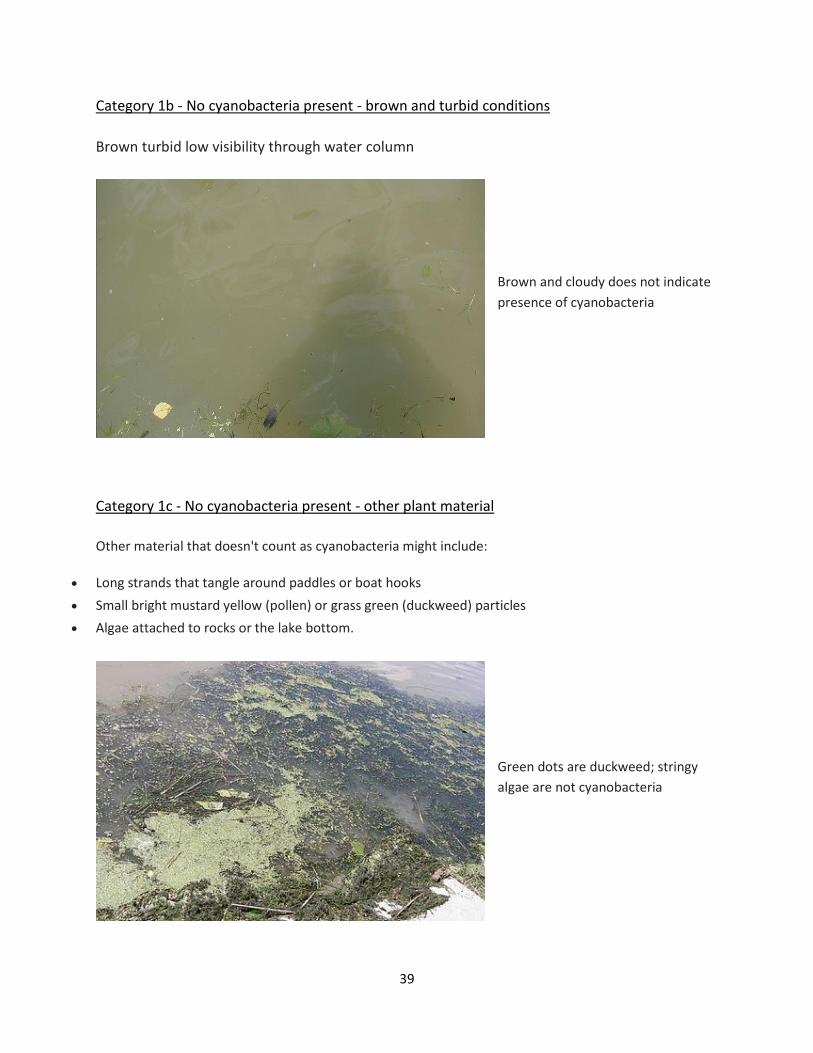
Category 1b - No cyanobacteria present - brown and turbid conditions
Brown turbid low visibility through water column
Brown and cloudy does not indicate
presence of cyanobacteria
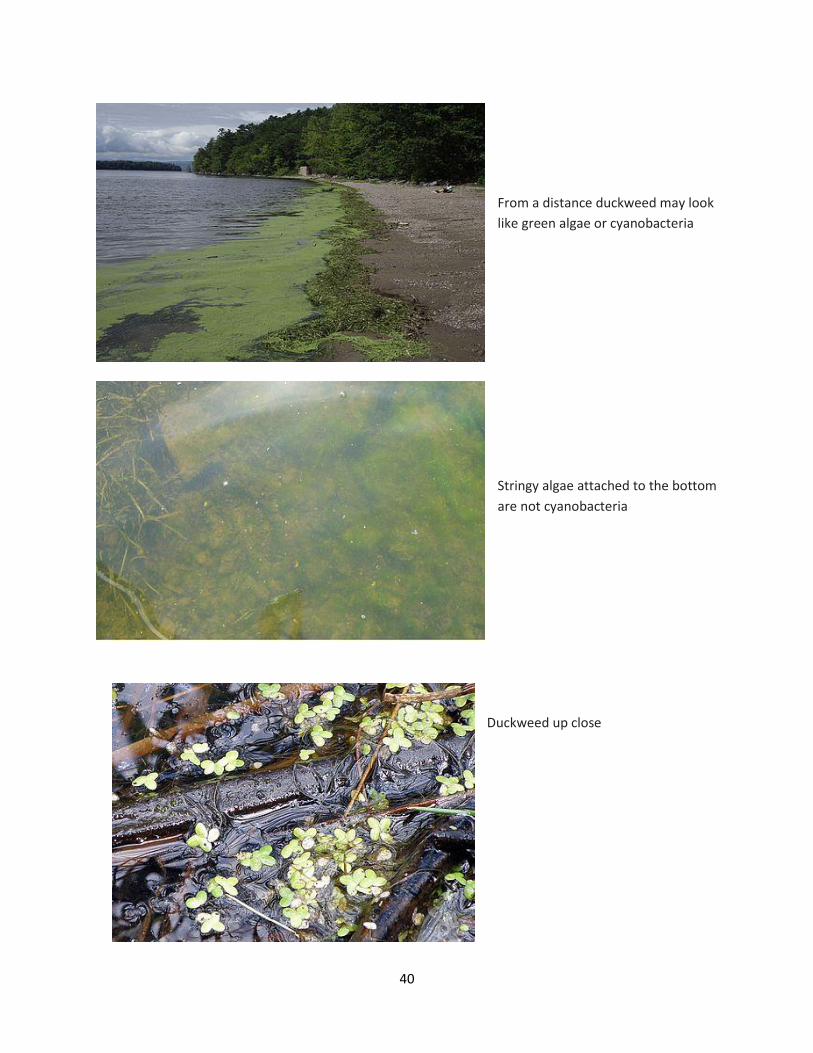
Category 1c - No cyanobacteria present - other plant material
Other material that doesn't count as cyanobacteria might include:
• Long strands that tangle around paddles or boat hooks
• Small bright mustard yellow (pollen) or grass green (duckweed) particles
• Algae attached to rocks or the lake bottom.
Green dots are duckweed; stringy
algae are not cyanobacteria
40
From a distance duckweed may look
like green algae or cyanobacteria
Stringy algae attached to the bottom
are not cyanobacteria
Duckweed up close
41
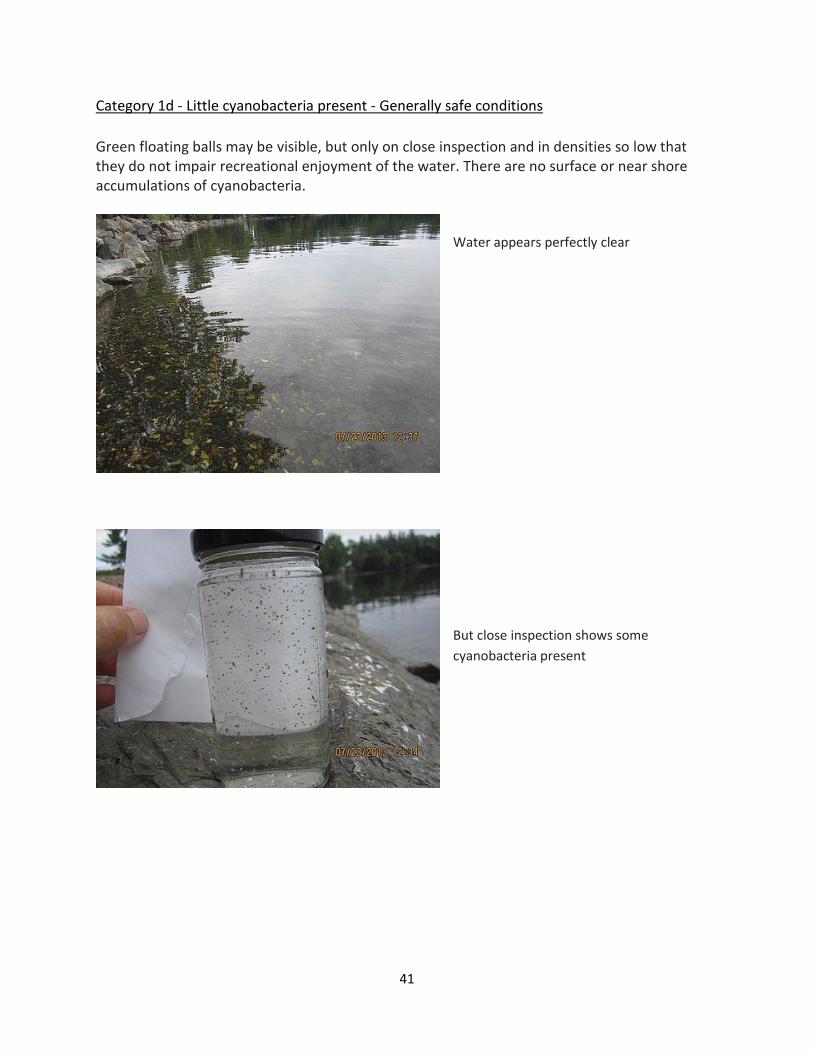
Category 1d - Little cyanobacteria present - Generally safe conditions
Green floating balls may be visible, but only on close inspection and in densities so low that they do not impair recreational enjoyment of the water. There are no surface or near shore accumulations of cyanobacteria.
Water appears perfectly clear
But close inspection shows some
cyanobacteria present
42
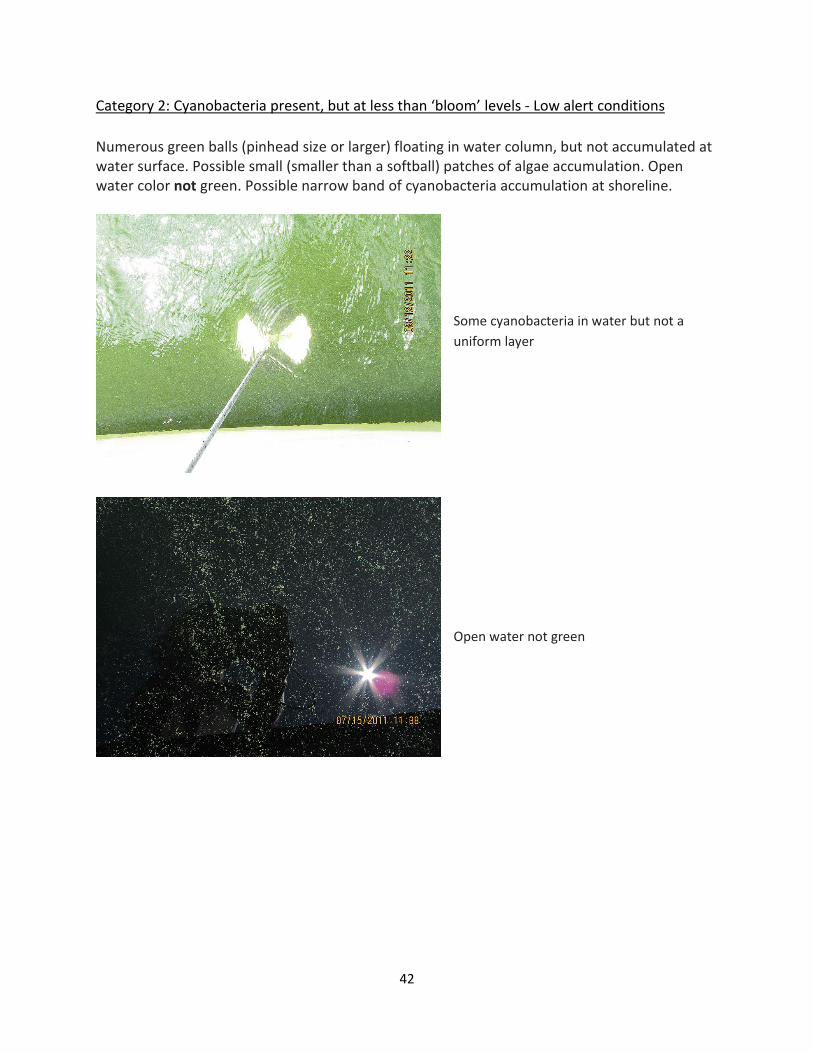
Category 2: Cyanobacteria present, but at less than ‘bloom’ levels - Low alert conditions
Numerous green balls (pinhead size or larger) floating in water column, but not accumulated at water surface. Possible small (smaller than a softball) patches of algae accumulation. Open water color not green. Possible narrow band of cyanobacteria accumulation at shoreline.
Some cyanobacteria in water but not a
uniform layer
Open water not green
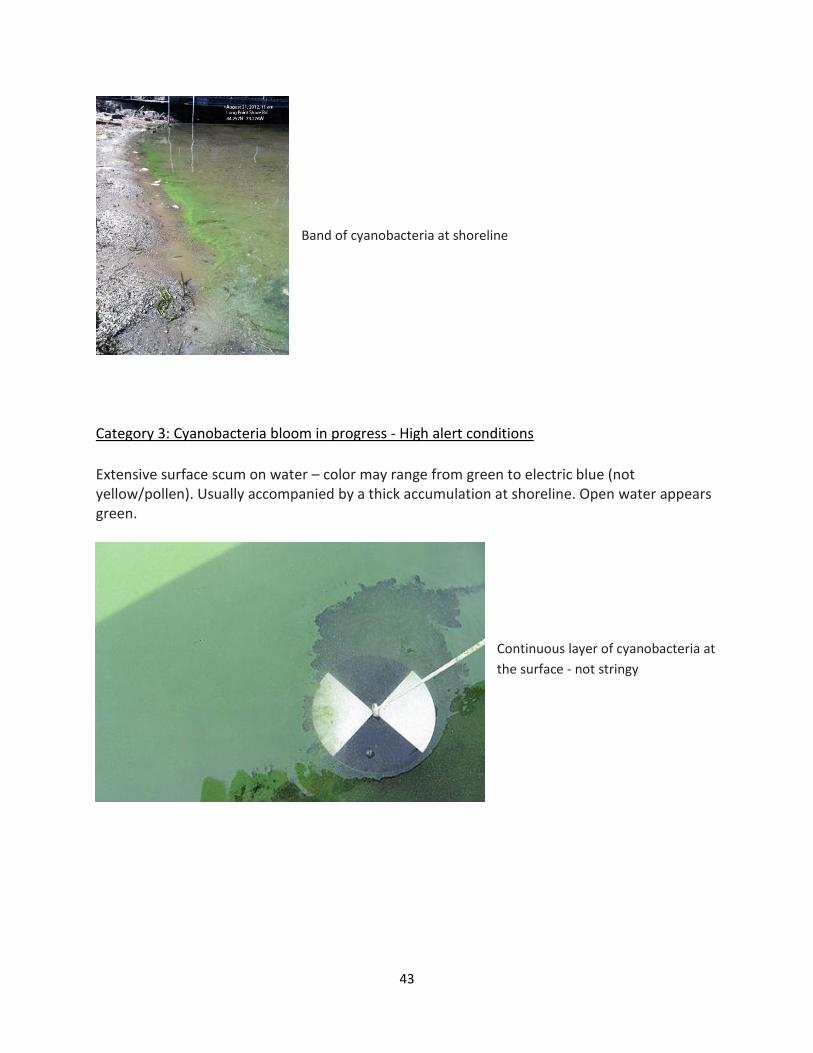
43
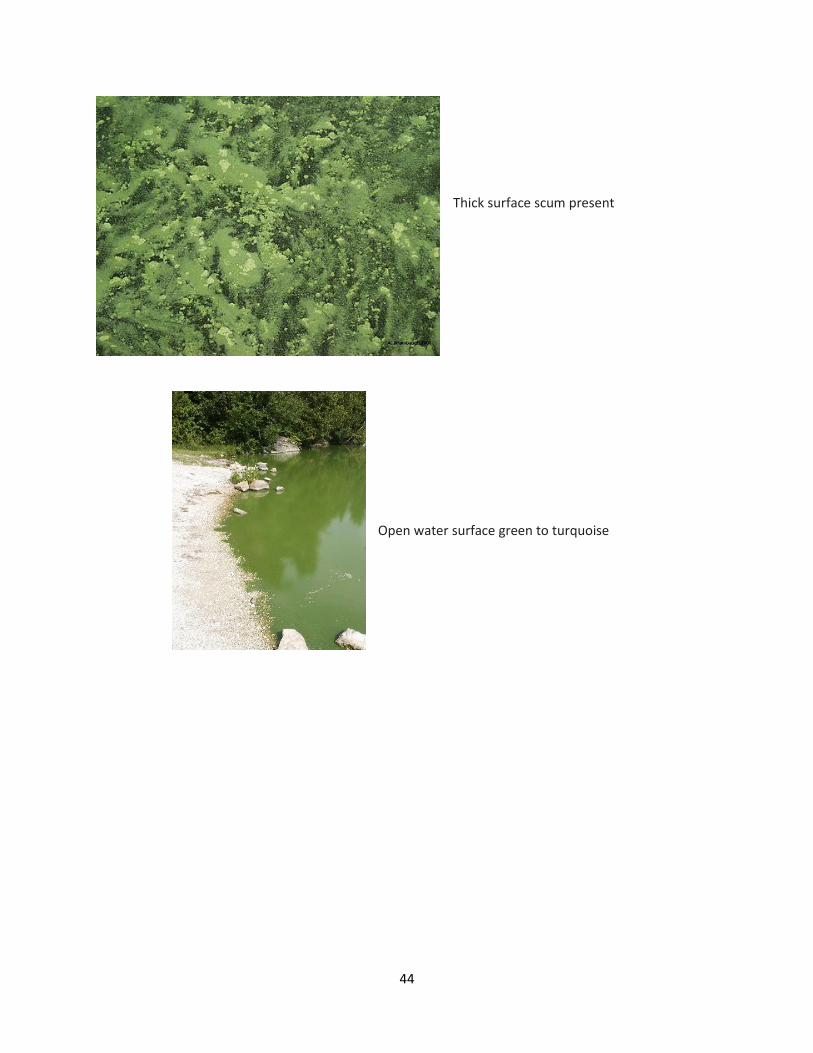
Band of cyanobacteria at shoreline
Category 3: Cyanobacteria bloom in progress - High alert conditions
Extensive surface scum on water – color may range from green to electric blue (not yellow/pollen). Usually accompanied by a thick accumulation at shoreline. Open water appears green.
Continuous layer of cyanobacteria at
the surface - not stringy
44
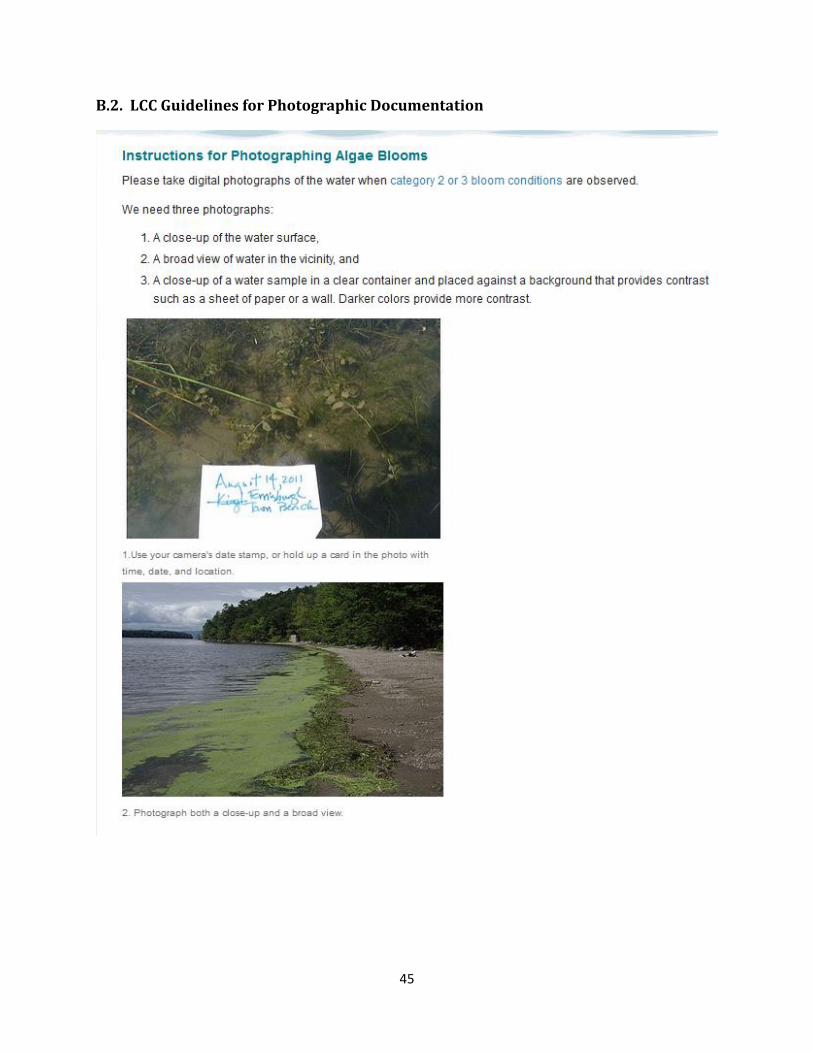
Thick surface scum present
Open water surface green to turquoise
45
B.2. LCC Guidelines for Photographic Documentation
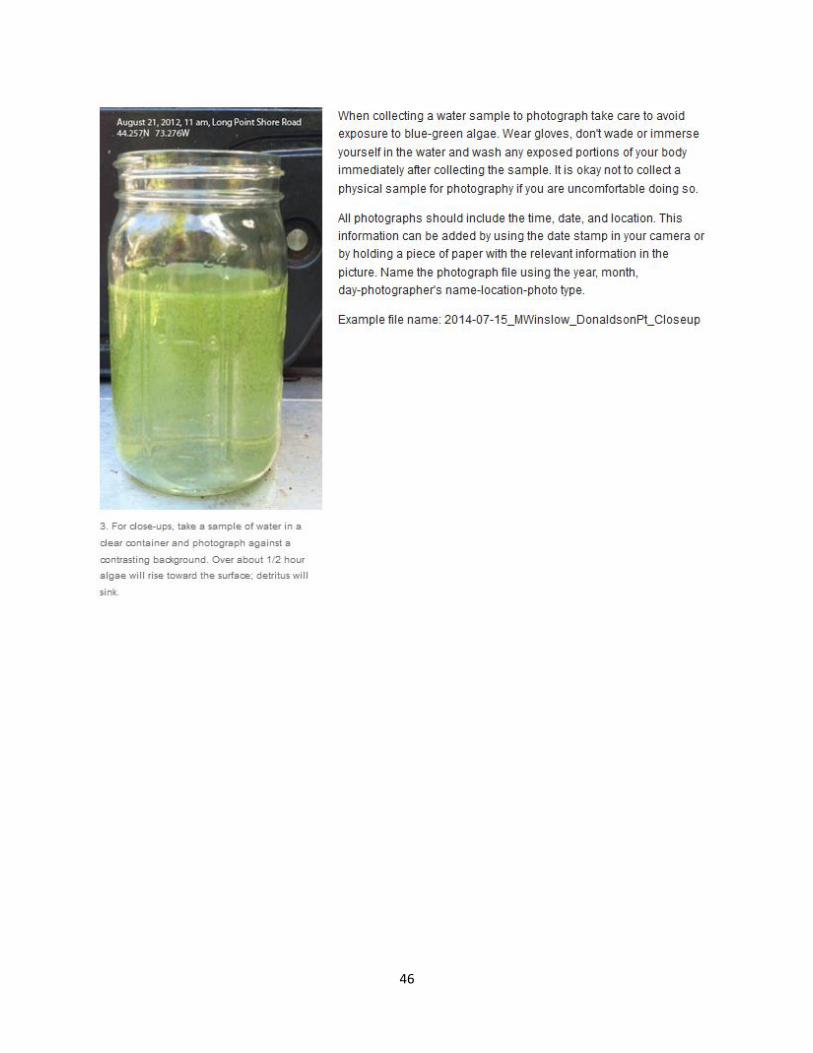
46
47
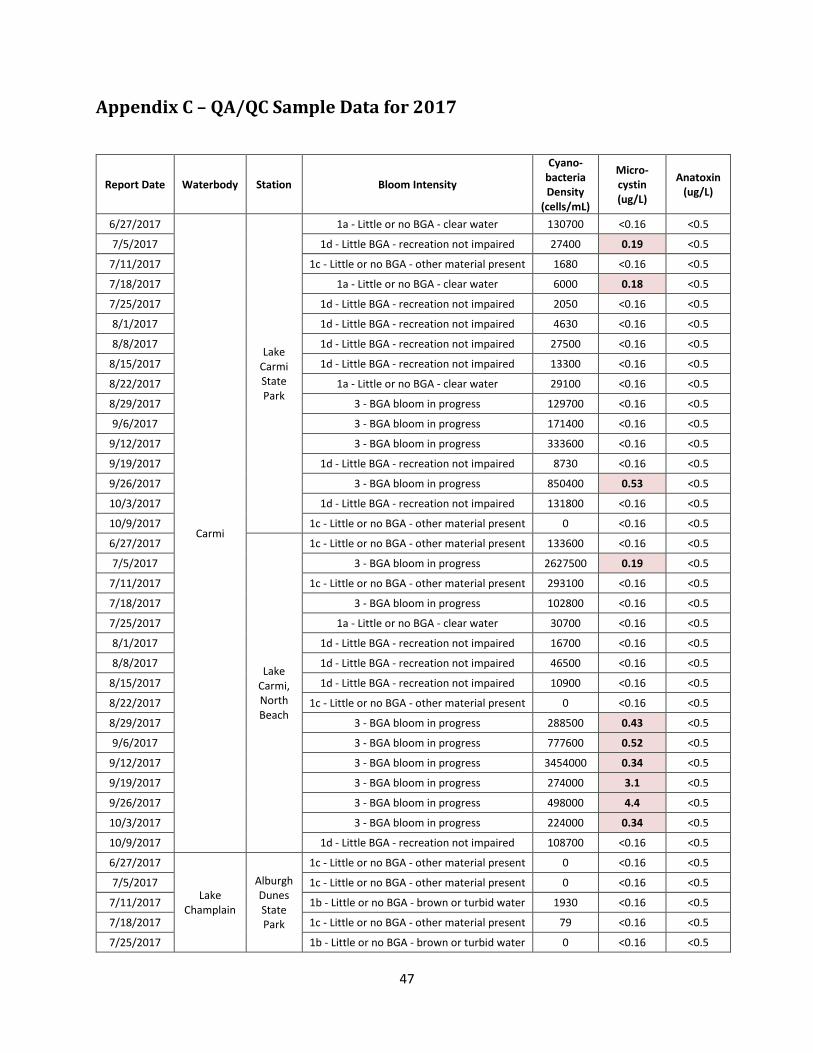
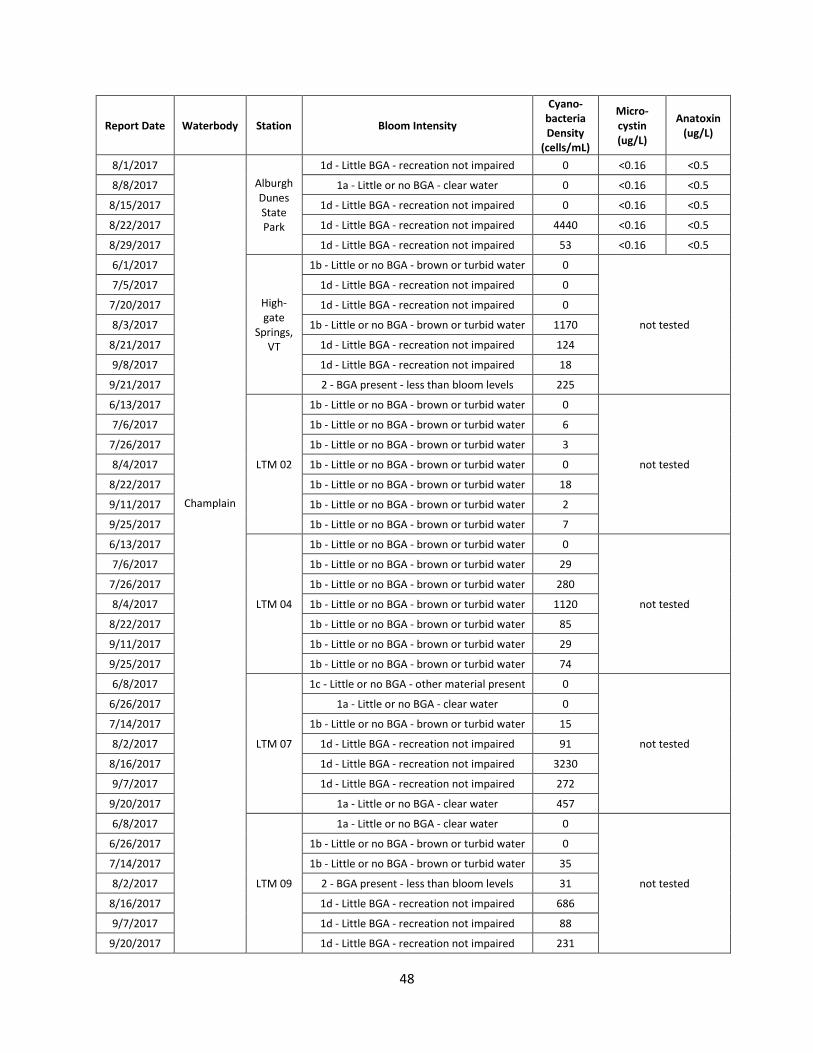
Appendix C – QA/QC Sample Data for 2017
Report Date Waterbody Station Bloom Intensity
Cyano-bacteria Density
(cells/mL)
Micro-cystin (ug/L)
Anatoxin (ug/L)
6/27/2017
Carmi
Lake Carmi State Park
1a - Little or no BGA - clear water 130700 <0.16 <0.5
7/5/2017 1d - Little BGA - recreation not impaired 27400 0.19 <0.5
7/11/2017 1c - Little or no BGA - other material present 1680 <0.16 <0.5
7/18/2017 1a - Little or no BGA - clear water 6000 0.18 <0.5
7/25/2017 1d - Little BGA - recreation not impaired 2050 <0.16 <0.5
8/1/2017 1d - Little BGA - recreation not impaired 4630 <0.16 <0.5
8/8/2017 1d - Little BGA - recreation not impaired 27500 <0.16 <0.5
8/15/2017 1d - Little BGA - recreation not impaired 13300 <0.16 <0.5
8/22/2017 1a - Little or no BGA - clear water 29100 <0.16 <0.5
8/29/2017 3 - BGA bloom in progress 129700 <0.16 <0.5
9/6/2017 3 - BGA bloom in progress 171400 <0.16 <0.5
9/12/2017 3 - BGA bloom in progress 333600 <0.16 <0.5
9/19/2017 1d - Little BGA - recreation not impaired 8730 <0.16 <0.5
9/26/2017 3 - BGA bloom in progress 850400 0.53 <0.5
10/3/2017 1d - Little BGA - recreation not impaired 131800 <0.16 <0.5
10/9/2017 1c - Little or no BGA - other material present 0 <0.16 <0.5
6/27/2017
Lake Carmi, North Beach
1c - Little or no BGA - other material present 133600 <0.16 <0.5
7/5/2017 3 - BGA bloom in progress 2627500 0.19 <0.5
7/11/2017 1c - Little or no BGA - other material present 293100 <0.16 <0.5
7/18/2017 3 - BGA bloom in progress 102800 <0.16 <0.5
7/25/2017 1a - Little or no BGA - clear water 30700 <0.16 <0.5
8/1/2017 1d - Little BGA - recreation not impaired 16700 <0.16 <0.5
8/8/2017 1d - Little BGA - recreation not impaired 46500 <0.16 <0.5
8/15/2017 1d - Little BGA - recreation not impaired 10900 <0.16 <0.5
8/22/2017 1c - Little or no BGA - other material present 0 <0.16 <0.5
8/29/2017 3 - BGA bloom in progress 288500 0.43 <0.5
9/6/2017 3 - BGA bloom in progress 777600 0.52 <0.5
9/12/2017 3 - BGA bloom in progress 3454000 0.34 <0.5
9/19/2017 3 - BGA bloom in progress 274000 3.1 <0.5
9/26/2017 3 - BGA bloom in progress 498000 4.4 <0.5
10/3/2017 3 - BGA bloom in progress 224000 0.34 <0.5
10/9/2017 1d - Little BGA - recreation not impaired 108700 <0.16 <0.5
6/27/2017
Lake Champlain
Alburgh Dunes State Park
1c - Little or no BGA - other material present 0 <0.16 <0.5
7/5/2017 1c - Little or no BGA - other material present 0 <0.16 <0.5
7/11/2017 1b - Little or no BGA - brown or turbid water 1930 <0.16 <0.5
7/18/2017 1c - Little or no BGA - other material present 79 <0.16 <0.5
7/25/2017 1b - Little or no BGA - brown or turbid water 0 <0.16 <0.5
48
Report Date Waterbody Station Bloom Intensity
Cyano-bacteria Density
(cells/mL)
Micro-cystin (ug/L)
Anatoxin (ug/L)
8/1/2017
Champlain
Alburgh Dunes State Park
1d - Little BGA - recreation not impaired 0 <0.16 <0.5
8/8/2017 1a - Little or no BGA - clear water 0 <0.16 <0.5
8/15/2017 1d - Little BGA - recreation not impaired 0 <0.16 <0.5
8/22/2017 1d - Little BGA - recreation not impaired 4440 <0.16 <0.5
8/29/2017 1d - Little BGA - recreation not impaired 53 <0.16 <0.5
6/1/2017
High-gate
Springs, VT
1b - Little or no BGA - brown or turbid water 0
not tested
7/5/2017 1d - Little BGA - recreation not impaired 0
7/20/2017 1d - Little BGA - recreation not impaired 0
8/3/2017 1b - Little or no BGA - brown or turbid water 1170
8/21/2017 1d - Little BGA - recreation not impaired 124
9/8/2017 1d - Little BGA - recreation not impaired 18
9/21/2017 2 - BGA present - less than bloom levels 225
6/13/2017
LTM 02
1b - Little or no BGA - brown or turbid water 0
not tested
7/6/2017 1b - Little or no BGA - brown or turbid water 6
7/26/2017 1b - Little or no BGA - brown or turbid water 3
8/4/2017 1b - Little or no BGA - brown or turbid water 0
8/22/2017 1b - Little or no BGA - brown or turbid water 18
9/11/2017 1b - Little or no BGA - brown or turbid water 2
9/25/2017 1b - Little or no BGA - brown or turbid water 7
6/13/2017
LTM 04
1b - Little or no BGA - brown or turbid water 0
not tested
7/6/2017 1b - Little or no BGA - brown or turbid water 29
7/26/2017 1b - Little or no BGA - brown or turbid water 280
8/4/2017 1b - Little or no BGA - brown or turbid water 1120
8/22/2017 1b - Little or no BGA - brown or turbid water 85
9/11/2017 1b - Little or no BGA - brown or turbid water 29
9/25/2017 1b - Little or no BGA - brown or turbid water 74
6/8/2017
LTM 07
1c - Little or no BGA - other material present 0
not tested
6/26/2017 1a - Little or no BGA - clear water 0
7/14/2017 1b - Little or no BGA - brown or turbid water 15
8/2/2017 1d - Little BGA - recreation not impaired 91
8/16/2017 1d - Little BGA - recreation not impaired 3230
9/7/2017 1d - Little BGA - recreation not impaired 272
9/20/2017 1a - Little or no BGA - clear water 457
6/8/2017
LTM 09
1a - Little or no BGA - clear water 0
not tested
6/26/2017 1b - Little or no BGA - brown or turbid water 0
7/14/2017 1b - Little or no BGA - brown or turbid water 35
8/2/2017 2 - BGA present - less than bloom levels 31
8/16/2017 1d - Little BGA - recreation not impaired 686
9/7/2017 1d - Little BGA - recreation not impaired 88
9/20/2017 1d - Little BGA - recreation not impaired 231
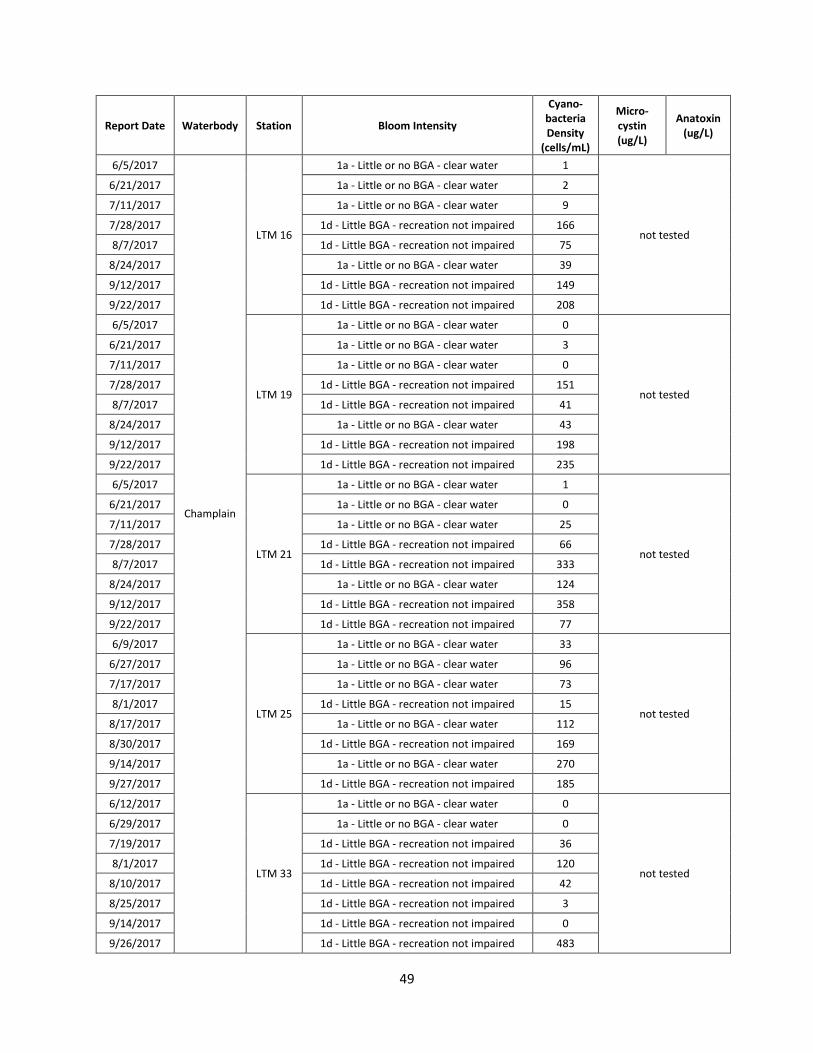
49
Report Date Waterbody Station Bloom Intensity
Cyano-bacteria Density
(cells/mL)
Micro-cystin (ug/L)
Anatoxin (ug/L)
6/5/2017
Champlain
LTM 16
1a - Little or no BGA - clear water 1
not tested
6/21/2017 1a - Little or no BGA - clear water 2
7/11/2017 1a - Little or no BGA - clear water 9
7/28/2017 1d - Little BGA - recreation not impaired 166
8/7/2017 1d - Little BGA - recreation not impaired 75
8/24/2017 1a - Little or no BGA - clear water 39
9/12/2017 1d - Little BGA - recreation not impaired 149
9/22/2017 1d - Little BGA - recreation not impaired 208
6/5/2017
LTM 19
1a - Little or no BGA - clear water 0
not tested
6/21/2017 1a - Little or no BGA - clear water 3
7/11/2017 1a - Little or no BGA - clear water 0
7/28/2017 1d - Little BGA - recreation not impaired 151
8/7/2017 1d - Little BGA - recreation not impaired 41
8/24/2017 1a - Little or no BGA - clear water 43
9/12/2017 1d - Little BGA - recreation not impaired 198
9/22/2017 1d - Little BGA - recreation not impaired 235
6/5/2017
LTM 21
1a - Little or no BGA - clear water 1
not tested
6/21/2017 1a - Little or no BGA - clear water 0
7/11/2017 1a - Little or no BGA - clear water 25
7/28/2017 1d - Little BGA - recreation not impaired 66
8/7/2017 1d - Little BGA - recreation not impaired 333
8/24/2017 1a - Little or no BGA - clear water 124
9/12/2017 1d - Little BGA - recreation not impaired 358
9/22/2017 1d - Little BGA - recreation not impaired 77
6/9/2017
LTM 25
1a - Little or no BGA - clear water 33
not tested
6/27/2017 1a - Little or no BGA - clear water 96
7/17/2017 1a - Little or no BGA - clear water 73
8/1/2017 1d - Little BGA - recreation not impaired 15
8/17/2017 1a - Little or no BGA - clear water 112
8/30/2017 1d - Little BGA - recreation not impaired 169
9/14/2017 1a - Little or no BGA - clear water 270
9/27/2017 1d - Little BGA - recreation not impaired 185
6/12/2017
LTM 33
1a - Little or no BGA - clear water 0
not tested
6/29/2017 1a - Little or no BGA - clear water 0
7/19/2017 1d - Little BGA - recreation not impaired 36
8/1/2017 1d - Little BGA - recreation not impaired 120
8/10/2017 1d - Little BGA - recreation not impaired 42
8/25/2017 1d - Little BGA - recreation not impaired 3
9/14/2017 1d - Little BGA - recreation not impaired 0
9/26/2017 1d - Little BGA - recreation not impaired 483
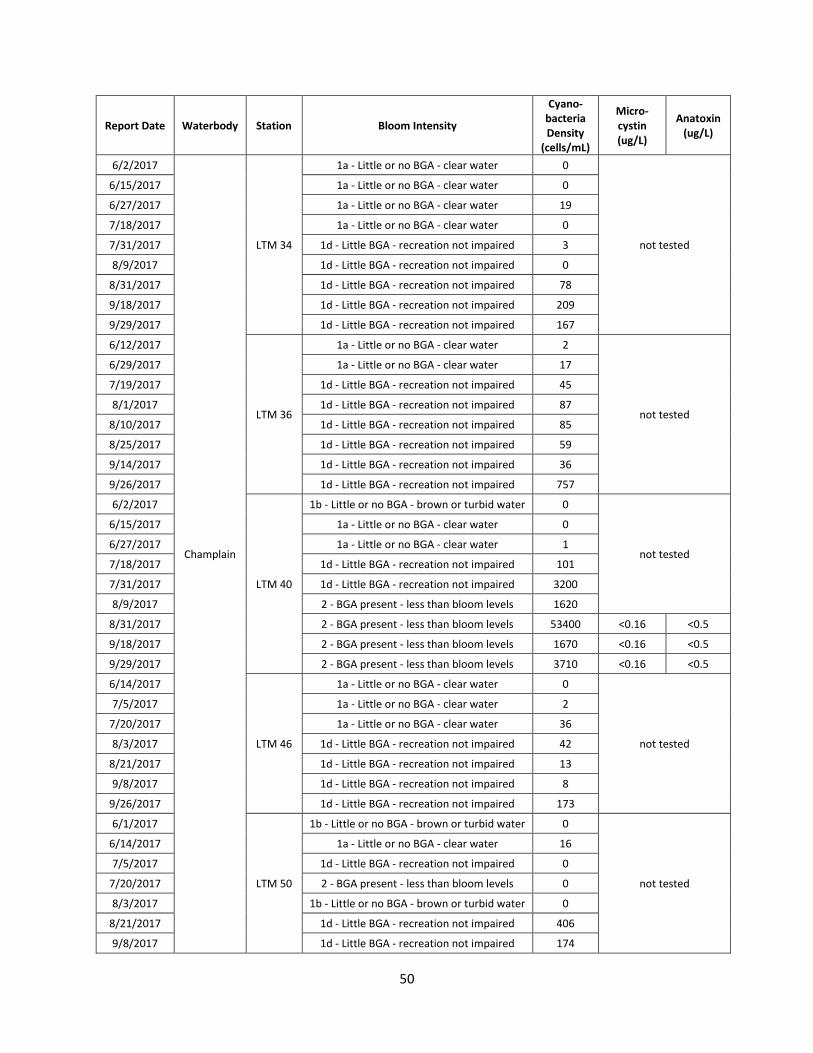
50
Report Date Waterbody Station Bloom Intensity
Cyano-bacteria Density
(cells/mL)
Micro-cystin (ug/L)
Anatoxin (ug/L)
6/2/2017
Champlain
LTM 34
1a - Little or no BGA - clear water 0
not tested
6/15/2017 1a - Little or no BGA - clear water 0
6/27/2017 1a - Little or no BGA - clear water 19
7/18/2017 1a - Little or no BGA - clear water 0
7/31/2017 1d - Little BGA - recreation not impaired 3
8/9/2017 1d - Little BGA - recreation not impaired 0
8/31/2017 1d - Little BGA - recreation not impaired 78
9/18/2017 1d - Little BGA - recreation not impaired 209
9/29/2017 1d - Little BGA - recreation not impaired 167
6/12/2017
LTM 36
1a - Little or no BGA - clear water 2
not tested
6/29/2017 1a - Little or no BGA - clear water 17
7/19/2017 1d - Little BGA - recreation not impaired 45
8/1/2017 1d - Little BGA - recreation not impaired 87
8/10/2017 1d - Little BGA - recreation not impaired 85
8/25/2017 1d - Little BGA - recreation not impaired 59
9/14/2017 1d - Little BGA - recreation not impaired 36
9/26/2017 1d - Little BGA - recreation not impaired 757
6/2/2017
LTM 40
1b - Little or no BGA - brown or turbid water 0
not tested
6/15/2017 1a - Little or no BGA - clear water 0
6/27/2017 1a - Little or no BGA - clear water 1
7/18/2017 1d - Little BGA - recreation not impaired 101
7/31/2017 1d - Little BGA - recreation not impaired 3200
8/9/2017 2 - BGA present - less than bloom levels 1620
8/31/2017 2 - BGA present - less than bloom levels 53400 <0.16 <0.5
9/18/2017 2 - BGA present - less than bloom levels 1670 <0.16 <0.5
9/29/2017 2 - BGA present - less than bloom levels 3710 <0.16 <0.5
6/14/2017
LTM 46
1a - Little or no BGA - clear water 0
not tested
7/5/2017 1a - Little or no BGA - clear water 2
7/20/2017 1a - Little or no BGA - clear water 36
8/3/2017 1d - Little BGA - recreation not impaired 42
8/21/2017 1d - Little BGA - recreation not impaired 13
9/8/2017 1d - Little BGA - recreation not impaired 8
9/26/2017 1d - Little BGA - recreation not impaired 173
6/1/2017
LTM 50
1b - Little or no BGA - brown or turbid water 0
not tested
6/14/2017 1a - Little or no BGA - clear water 16
7/5/2017 1d - Little BGA - recreation not impaired 0
7/20/2017 2 - BGA present - less than bloom levels 0
8/3/2017 1b - Little or no BGA - brown or turbid water 0
8/21/2017 1d - Little BGA - recreation not impaired 406
9/8/2017 1d - Little BGA - recreation not impaired 174
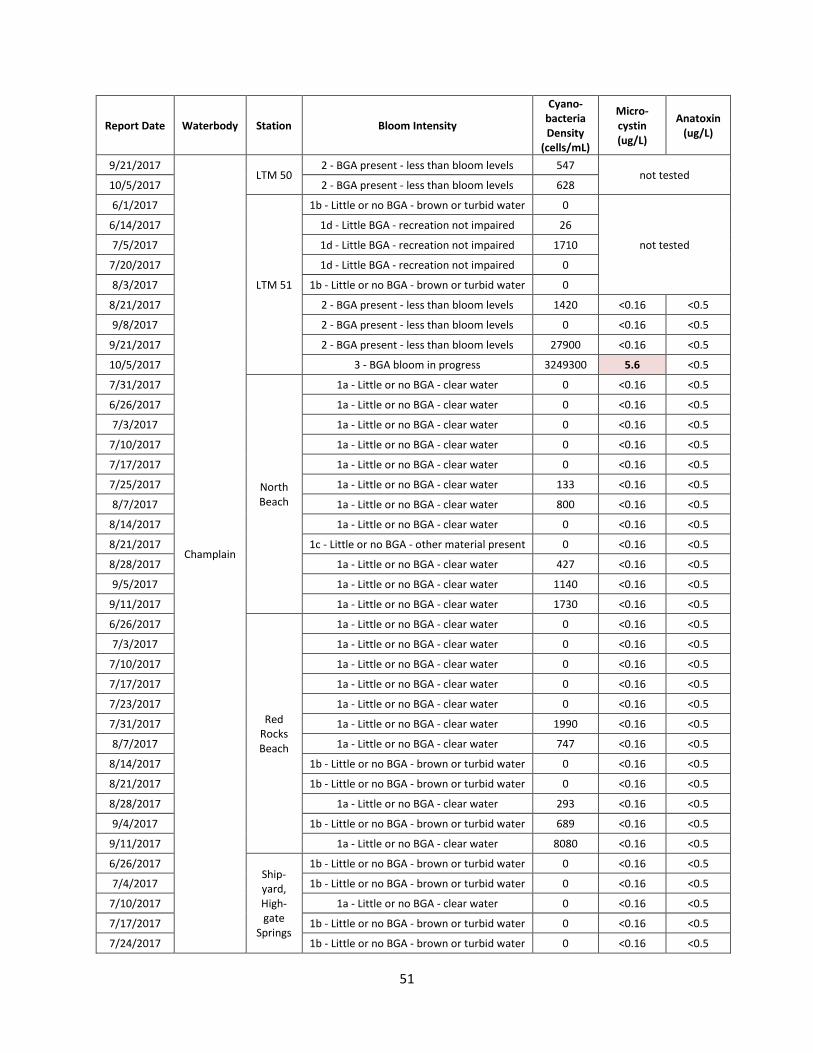
51
Report Date Waterbody Station Bloom Intensity
Cyano-bacteria Density
(cells/mL)
Micro-cystin (ug/L)
Anatoxin (ug/L)
9/21/2017
Champlain
LTM 50 2 - BGA present - less than bloom levels 547
not tested 10/5/2017 2 - BGA present - less than bloom levels 628
6/1/2017
LTM 51
1b - Little or no BGA - brown or turbid water 0
not tested
6/14/2017 1d - Little BGA - recreation not impaired 26
7/5/2017 1d - Little BGA - recreation not impaired 1710
7/20/2017 1d - Little BGA - recreation not impaired 0
8/3/2017 1b - Little or no BGA - brown or turbid water 0
8/21/2017 2 - BGA present - less than bloom levels 1420 <0.16 <0.5
9/8/2017 2 - BGA present - less than bloom levels 0 <0.16 <0.5
9/21/2017 2 - BGA present - less than bloom levels 27900 <0.16 <0.5
10/5/2017 3 - BGA bloom in progress 3249300 5.6 <0.5
7/31/2017
North Beach
1a - Little or no BGA - clear water 0 <0.16 <0.5
6/26/2017 1a - Little or no BGA - clear water 0 <0.16 <0.5
7/3/2017 1a - Little or no BGA - clear water 0 <0.16 <0.5
7/10/2017 1a - Little or no BGA - clear water 0 <0.16 <0.5
7/17/2017 1a - Little or no BGA - clear water 0 <0.16 <0.5
7/25/2017 1a - Little or no BGA - clear water 133 <0.16 <0.5
8/7/2017 1a - Little or no BGA - clear water 800 <0.16 <0.5
8/14/2017 1a - Little or no BGA - clear water 0 <0.16 <0.5
8/21/2017 1c - Little or no BGA - other material present 0 <0.16 <0.5
8/28/2017 1a - Little or no BGA - clear water 427 <0.16 <0.5
9/5/2017 1a - Little or no BGA - clear water 1140 <0.16 <0.5
9/11/2017 1a - Little or no BGA - clear water 1730 <0.16 <0.5
6/26/2017
Red Rocks Beach
1a - Little or no BGA - clear water 0 <0.16 <0.5
7/3/2017 1a - Little or no BGA - clear water 0 <0.16 <0.5
7/10/2017 1a - Little or no BGA - clear water 0 <0.16 <0.5
7/17/2017 1a - Little or no BGA - clear water 0 <0.16 <0.5
7/23/2017 1a - Little or no BGA - clear water 0 <0.16 <0.5
7/31/2017 1a - Little or no BGA - clear water 1990 <0.16 <0.5
8/7/2017 1a - Little or no BGA - clear water 747 <0.16 <0.5
8/14/2017 1b - Little or no BGA - brown or turbid water 0 <0.16 <0.5
8/21/2017 1b - Little or no BGA - brown or turbid water 0 <0.16 <0.5
8/28/2017 1a - Little or no BGA - clear water 293 <0.16 <0.5
9/4/2017 1b - Little or no BGA - brown or turbid water 689 <0.16 <0.5
9/11/2017 1a - Little or no BGA - clear water 8080 <0.16 <0.5
6/26/2017 Ship-yard, High-gate
Springs
1b - Little or no BGA - brown or turbid water 0 <0.16 <0.5
7/4/2017 1b - Little or no BGA - brown or turbid water 0 <0.16 <0.5
7/10/2017 1a - Little or no BGA - clear water 0 <0.16 <0.5
7/17/2017 1b - Little or no BGA - brown or turbid water 0 <0.16 <0.5
7/24/2017 1b - Little or no BGA - brown or turbid water 0 <0.16 <0.5
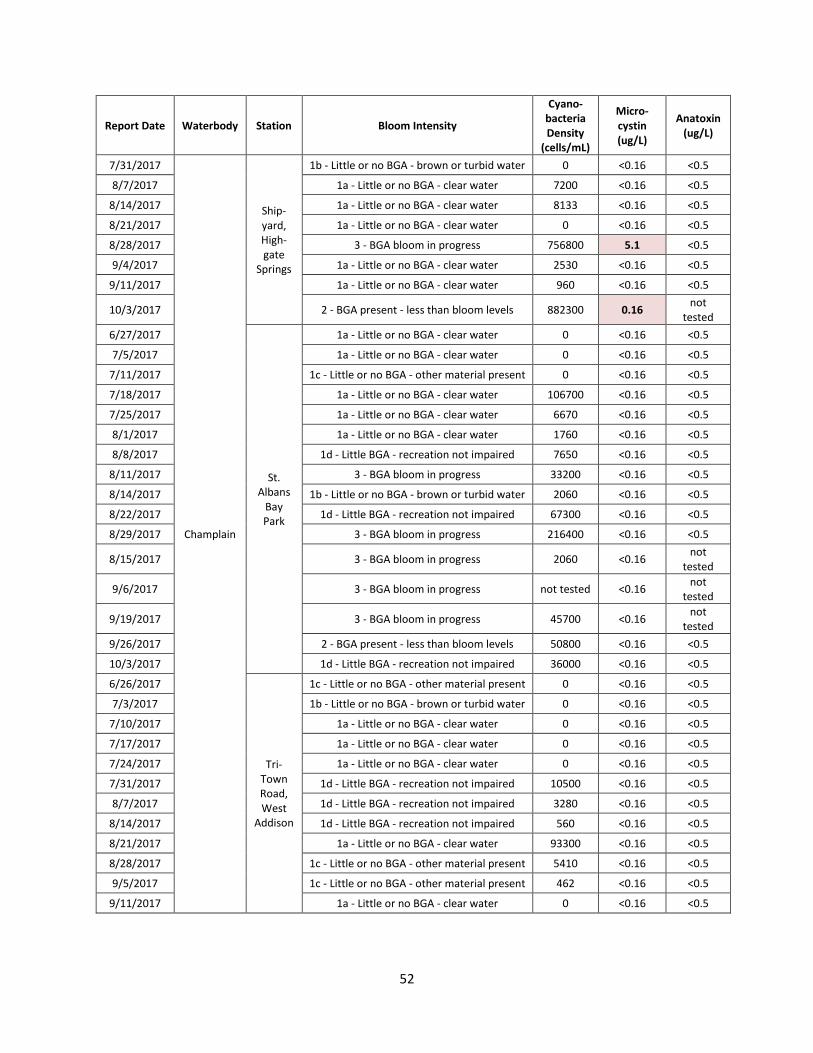
52
Report Date Waterbody Station Bloom Intensity
Cyano-bacteria Density
(cells/mL)
Micro-cystin (ug/L)
Anatoxin (ug/L)
7/31/2017
Champlain
Ship-yard, High-gate
Springs
1b - Little or no BGA - brown or turbid water 0 <0.16 <0.5
8/7/2017 1a - Little or no BGA - clear water 7200 <0.16 <0.5
8/14/2017 1a - Little or no BGA - clear water 8133 <0.16 <0.5
8/21/2017 1a - Little or no BGA - clear water 0 <0.16 <0.5
8/28/2017 3 - BGA bloom in progress 756800 5.1 <0.5
9/4/2017 1a - Little or no BGA - clear water 2530 <0.16 <0.5
9/11/2017 1a - Little or no BGA - clear water 960 <0.16 <0.5
10/3/2017 2 - BGA present - less than bloom levels 882300 0.16 not
tested
6/27/2017
St. Albans
Bay Park
1a - Little or no BGA - clear water 0 <0.16 <0.5
7/5/2017 1a - Little or no BGA - clear water 0 <0.16 <0.5
7/11/2017 1c - Little or no BGA - other material present 0 <0.16 <0.5
7/18/2017 1a - Little or no BGA - clear water 106700 <0.16 <0.5
7/25/2017 1a - Little or no BGA - clear water 6670 <0.16 <0.5
8/1/2017 1a - Little or no BGA - clear water 1760 <0.16 <0.5
8/8/2017 1d - Little BGA - recreation not impaired 7650 <0.16 <0.5
8/11/2017 3 - BGA bloom in progress 33200 <0.16 <0.5
8/14/2017 1b - Little or no BGA - brown or turbid water 2060 <0.16 <0.5
8/22/2017 1d - Little BGA - recreation not impaired 67300 <0.16 <0.5
8/29/2017 3 - BGA bloom in progress 216400 <0.16 <0.5
8/15/2017 3 - BGA bloom in progress 2060 <0.16 not
tested
9/6/2017 3 - BGA bloom in progress not tested <0.16 not
tested
9/19/2017 3 - BGA bloom in progress 45700 <0.16 not
tested
9/26/2017 2 - BGA present - less than bloom levels 50800 <0.16 <0.5
10/3/2017 1d - Little BGA - recreation not impaired 36000 <0.16 <0.5
6/26/2017
Tri-Town Road, West
Addison
1c - Little or no BGA - other material present 0 <0.16 <0.5
7/3/2017 1b - Little or no BGA - brown or turbid water 0 <0.16 <0.5
7/10/2017 1a - Little or no BGA - clear water 0 <0.16 <0.5
7/17/2017 1a - Little or no BGA - clear water 0 <0.16 <0.5
7/24/2017 1a - Little or no BGA - clear water 0 <0.16 <0.5
7/31/2017 1d - Little BGA - recreation not impaired 10500 <0.16 <0.5
8/7/2017 1d - Little BGA - recreation not impaired 3280 <0.16 <0.5
8/14/2017 1d - Little BGA - recreation not impaired 560 <0.16 <0.5
8/21/2017 1a - Little or no BGA - clear water 93300 <0.16 <0.5
8/28/2017 1c - Little or no BGA - other material present 5410 <0.16 <0.5
9/5/2017 1c - Little or no BGA - other material present 462 <0.16 <0.5
9/11/2017 1a - Little or no BGA - clear water 0 <0.16 <0.5
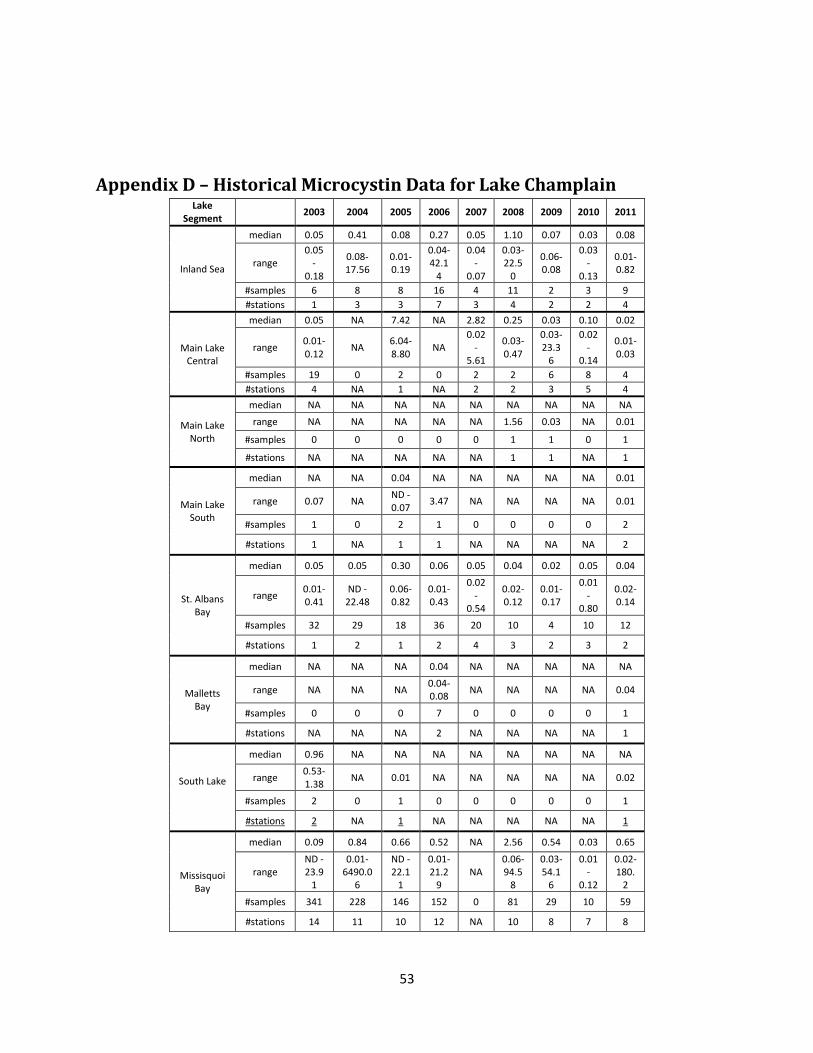
53
Appendix D – Historical Microcystin Data for Lake Champlain Lake
Segment 2003 2004 2005 2006 2007 2008 2009 2010 2011
Inland Sea
median 0.05 0.41 0.08 0.27 0.05 1.10 0.07 0.03 0.08
range 0.05
- 0.18
0.08-17.56
0.01-0.19
0.04-42.1
4
0.04-
0.07
0.03-22.5
0
0.06-0.08
0.03-
0.13
0.01-0.82
#samples 6 8 8 16 4 11 2 3 9
#stations 1 3 3 7 3 4 2 2 4
Main Lake Central
median 0.05 NA 7.42 NA 2.82 0.25 0.03 0.10 0.02
range 0.01-0.12
NA 6.04-8.80
NA 0.02
-5.61
0.03-0.47
0.03-23.3
6
0.02-
0.14
0.01-0.03
#samples 19 0 2 0 2 2 6 8 4
#stations 4 NA 1 NA 2 2 3 5 4
Main Lake North
median NA NA NA NA NA NA NA NA NA
range NA NA NA NA NA 1.56 0.03 NA 0.01
#samples 0 0 0 0 0 1 1 0 1
#stations NA NA NA NA NA 1 1 NA 1
Main Lake South
median NA NA 0.04 NA NA NA NA NA 0.01
range 0.07 NA ND - 0.07
3.47 NA NA NA NA 0.01
#samples 1 0 2 1 0 0 0 0 2
#stations 1 NA 1 1 NA NA NA NA 2
St. Albans Bay
median 0.05 0.05 0.30 0.06 0.05 0.04 0.02 0.05 0.04
range 0.01-0.41
ND -22.48
0.06-0.82
0.01-0.43
0.02-
0.54
0.02-0.12
0.01-0.17
0.01-
0.80
0.02-0.14
#samples 32 29 18 36 20 10 4 10 12
#stations 1 2 1 2 4 3 2 3 2
Malletts Bay
median NA NA NA 0.04 NA NA NA NA NA
range NA NA NA 0.04-0.08
NA NA NA NA 0.04
#samples 0 0 0 7 0 0 0 0 1
#stations NA NA NA 2 NA NA NA NA 1
South Lake
median 0.96 NA NA NA NA NA NA NA NA
range 0.53-1.38
NA 0.01 NA NA NA NA NA 0.02
#samples 2 0 1 0 0 0 0 0 1
#stations 2 NA 1 NA NA NA NA NA 1
Missisquoi Bay
median 0.09 0.84 0.66 0.52 NA 2.56 0.54 0.03 0.65
range ND - 23.9
1
0.01-6490.0
6
ND - 22.1
1
0.01-21.2
9 NA
0.06-94.5
8
0.03-54.1
6
0.01-
0.12
0.02-180.
2
#samples 341 228 146 152 0 81 29 10 59
#stations 14 11 10 12 NA 10 8 7 8