cyanobacteria monitoring program - home- rhode island ...€¦ · cyanobacteria monitoring program...
TRANSCRIPT
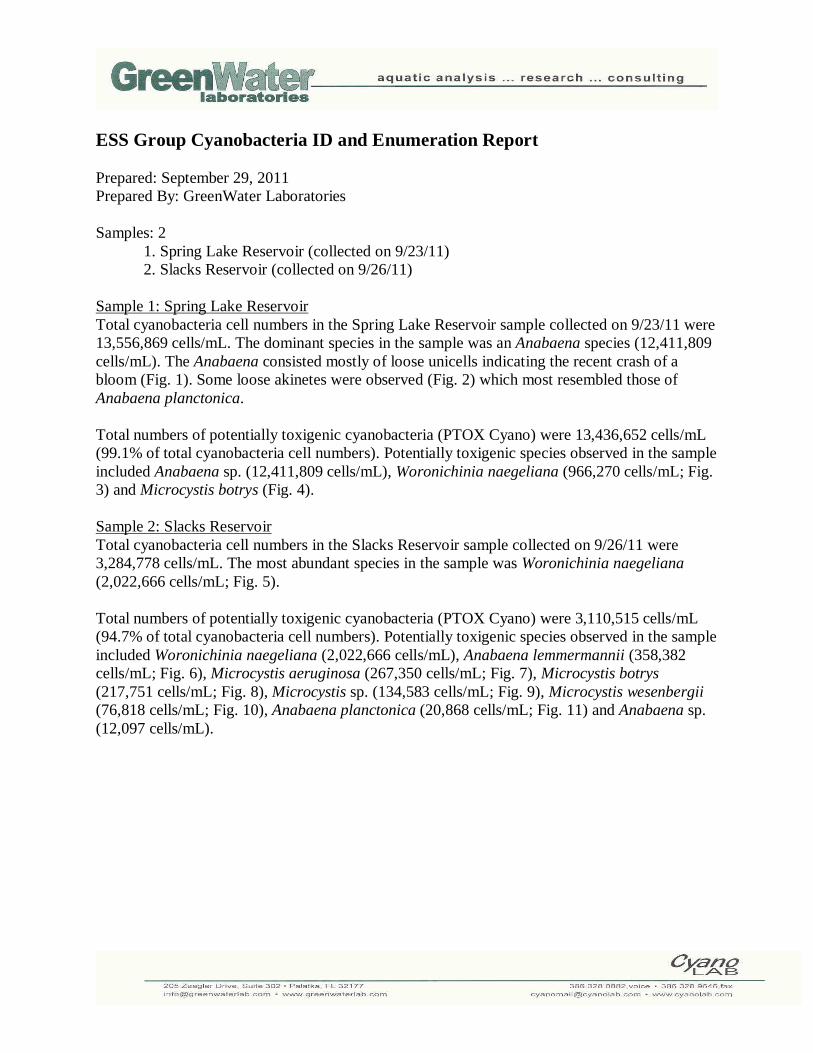
www.essgroup.com
Cyanobacteria Monitoring Program Rhode Island 2011 Report RIDEM REQ. NO. 1180565/1194117 PREPARED FOR:
Rhode Island Department of Environmental Management
Office of Water Resources
Promenade Street
Providence, Rhode Island 02915
PREPARED BY:
ESS Group, Inc.
401 Wampanoag Trail, Suite 400
East Providence, Rhode Island 02915
ESS Project No. R298-010
Revised January 30, 2013
© 2013 ESS Group, Inc. – This document or any part may not be reproduced or transmitted in any form or by any means, electronic, or mechanical, including photocopying, microfilming, and recording without the express written consent of ESS Group, Inc. All rights reserved.
CYANOBACTERIA MONITORING PROGRAM Rhode Island 2011 Report
RIDEM REQ# 1180565/1194117
Prepared For:
Rhode Island Department of Environmental Management Office of Water Resources
235 Promenade Street Providence, Rhode Island 02908
Prepared By:
ESS Group, Inc. 401 Wampanoag Trail, Suite 400
East Providence, Rhode Island 02915
ESS Project No. R298-010
Revised January 30, 2013
© 2013 ESS Group, Inc. j:\r298 ridem - bugs\2011 study\reports-submittals\cyano report\cyano report_2011_rev013013.doc
TABLE OF CONTENTS SECTION PAGE
1.0 INTRODUCTION..................................................................................................................................... 1
2.0 METHODS .............................................................................................................................................. 1
3.0 RESULTS................................................................................................................................................ 2 3.1 Cyanobacteria .................................................................................................................................. 2 3.2 Water Quality .................................................................................................................................... 6 3.3 Quality Assurance/Quality Control ................................................................................................... 7
4.0 DISCUSSION AND CONCLUSIONS...................................................................................................... 8
5.0 REFERENCES........................................................................................................................................ 9 TABLES Table A Water Bodies Sampled by the Cyanobacteria Monitoring Program in 2011 (embedded in
text) Table B Summary of 2011 Cyanobacteria Sampling Program Results (embedded in text) Table C Water Quality Observed during Cyanobacteria Screening (embedded in text) FIGURES Figure 1 Screening Level Sampling Locations Figure 2 Cyanobacteria Cell Density and Microcystin Levels in Samples Exceeding 50,000
Cells/mL APPENDICES Appendix A Cyanobacteria Identification and Enumeration Lab Reports Appendix B Microcystin Lab Reports
© 2013 ESS Group, Inc. j:\r298 ridem - bugs\2011 study\reports-submittals\cyano report\cyano report_2011_rev013013.doc
1.0 INTRODUCTION
ESS Group, Inc. (ESS) was contracted by the Rhode Island Department of Environmental Management (RIDEM) to conduct cyanobacteria monitoring in surface waters of the state of Rhode Island. Cyanobacteria (also known as blue-green algae) are a photosynthetic group of organisms naturally found in surface waters as phytoplankton, floating colonies, or attached to substrate. Under certain conditions, cyanobacteria may grow at high densities (blooms) and release toxins into the water degrading taste and odor and potentially raising public health risks, particularly for contact recreation. The Rhode Island cyanobacteria monitoring program was developed to screen for, respond to, and characterize blooms in the state’s fresh waters. This annual report provides a summary of the cyanobacteria monitoring program methodology and results for 2011.
2.0 METHODS
A summary of the monitoring program methodology is presented in this section. For a full description of methodology used by this program, please refer to the project-specific Quality Assurance Project Plan (QAPP) (ESS, 2011).
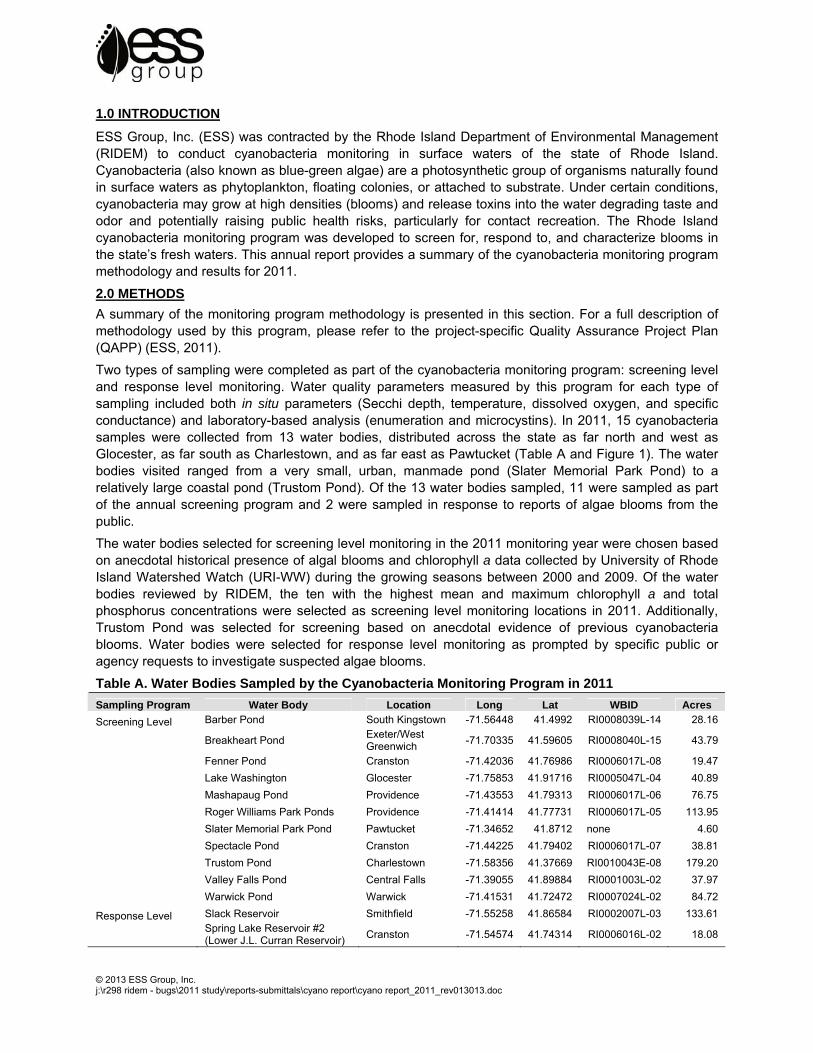
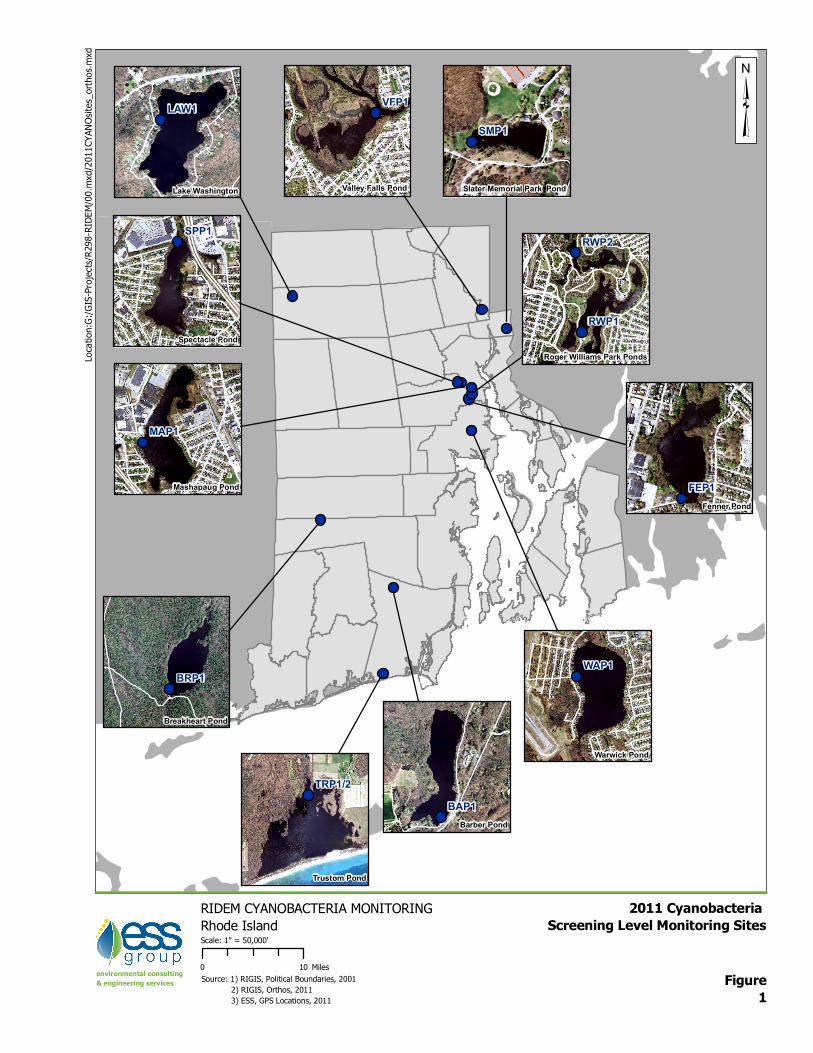
Two types of sampling were completed as part of the cyanobacteria monitoring program: screening level and response level monitoring. Water quality parameters measured by this program for each type of sampling included both in situ parameters (Secchi depth, temperature, dissolved oxygen, and specific conductance) and laboratory-based analysis (enumeration and microcystins). In 2011, 15 cyanobacteria samples were collected from 13 water bodies, distributed across the state as far north and west as Glocester, as far south as Charlestown, and as far east as Pawtucket (Table A and Figure 1). The water bodies visited ranged from a very small, urban, manmade pond (Slater Memorial Park Pond) to a relatively large coastal pond (Trustom Pond). Of the 13 water bodies sampled, 11 were sampled as part of the annual screening program and 2 were sampled in response to reports of algae blooms from the public.
The water bodies selected for screening level monitoring in the 2011 monitoring year were chosen based on anecdotal historical presence of algal blooms and chlorophyll a data collected by University of Rhode Island Watershed Watch (URI-WW) during the growing seasons between 2000 and 2009. Of the water bodies reviewed by RIDEM, the ten with the highest mean and maximum chlorophyll a and total phosphorus concentrations were selected as screening level monitoring locations in 2011. Additionally, Trustom Pond was selected for screening based on anecdotal evidence of previous cyanobacteria blooms. Water bodies were selected for response level monitoring as prompted by specific public or agency requests to investigate suspected algae blooms.
Table A. Water Bodies Sampled by the Cyanobacteria Monitoring Program in 2011
Sampling Program Water Body Location Long Lat WBID Acres
Screening Level Barber Pond South Kingstown -71.56448 41.4992 RI0008039L-14 28.16
Breakheart Pond
Exeter/West Greenwich
-71.70335 41.59605 RI0008040L-15 43.79
Fenner Pond Cranston -71.42036 41.76986 RI0006017L-08 19.47
Lake Washington Glocester -71.75853 41.91716 RI0005047L-04 40.89
Mashapaug Pond Providence -71.43553 41.79313 RI0006017L-06 76.75
Roger Williams Park Ponds Providence -71.41414 41.77731 RI0006017L-05 113.95
Slater Memorial Park Pond Pawtucket -71.34652 41.8712 none 4.60
Spectacle Pond Cranston -71.44225 41.79402 RI0006017L-07 38.81
Trustom Pond Charlestown -71.58356 41.37669 RI0010043E-08 179.20
Valley Falls Pond Central Falls -71.39055 41.89884 RI0001003L-02 37.97
Warwick Pond Warwick -71.41531 41.72472 RI0007024L-02 84.72
Response Level Slack Reservoir Smithfield -71.55258 41.86584 RI0002007L-03 133.61
Spring Lake Reservoir #2 (Lower J.L. Curran Reservoir)
Cranston -71.54574 41.74314 RI0006016L-02 18.08
Rhode Island 2011 Cyanobacteria Monitoring Program Revised January 30, 2013
© 2013 ESS Group, Inc. Page 2 j:\r298 ridem - bugs\2011 study\reports-submittals\cyano report\cyano report_2011_rev013013.doc
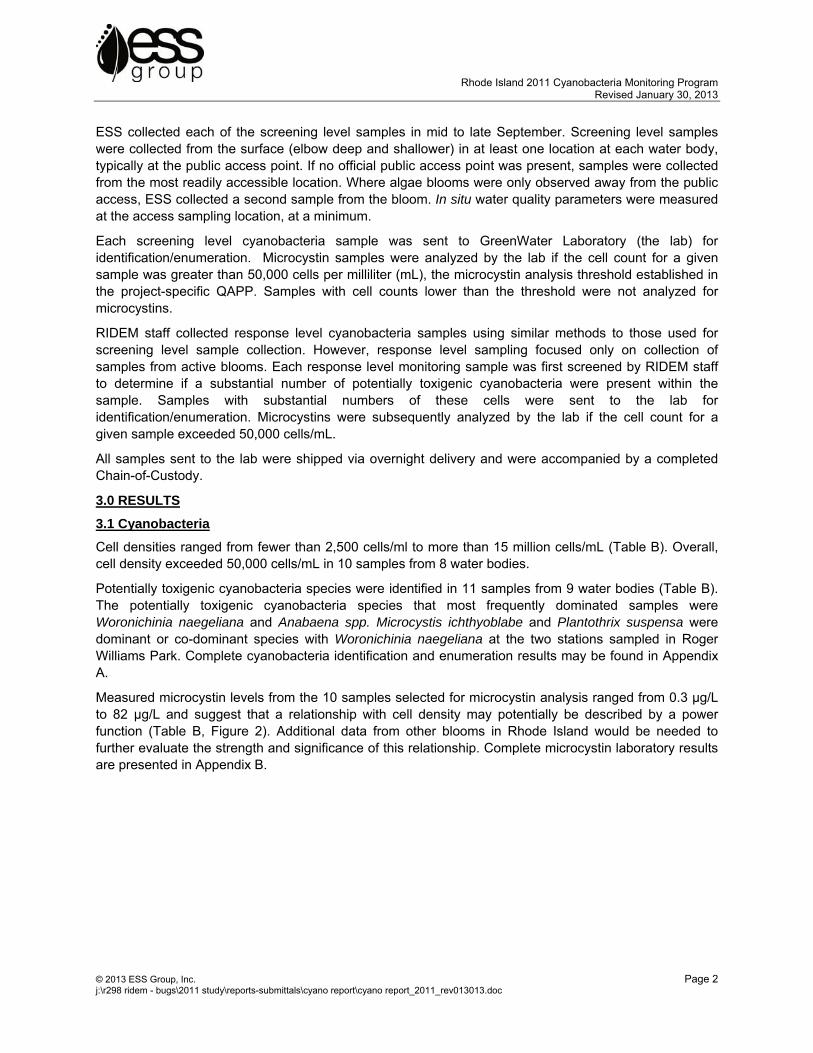
ESS collected each of the screening level samples in mid to late September. Screening level samples were collected from the surface (elbow deep and shallower) in at least one location at each water body, typically at the public access point. If no official public access point was present, samples were collected from the most readily accessible location. Where algae blooms were only observed away from the public access, ESS collected a second sample from the bloom. In situ water quality parameters were measured at the access sampling location, at a minimum.
Each screening level cyanobacteria sample was sent to GreenWater Laboratory (the lab) for identification/enumeration. Microcystin samples were analyzed by the lab if the cell count for a given sample was greater than 50,000 cells per milliliter (mL), the microcystin analysis threshold established in the project-specific QAPP. Samples with cell counts lower than the threshold were not analyzed for microcystins.
RIDEM staff collected response level cyanobacteria samples using similar methods to those used for screening level sample collection. However, response level sampling focused only on collection of samples from active blooms. Each response level monitoring sample was first screened by RIDEM staff to determine if a substantial number of potentially toxigenic cyanobacteria were present within the sample. Samples with substantial numbers of these cells were sent to the lab for identification/enumeration. Microcystins were subsequently analyzed by the lab if the cell count for a given sample exceeded 50,000 cells/mL.
All samples sent to the lab were shipped via overnight delivery and were accompanied by a completed Chain-of-Custody.
3.0 RESULTS
3.1 Cyanobacteria
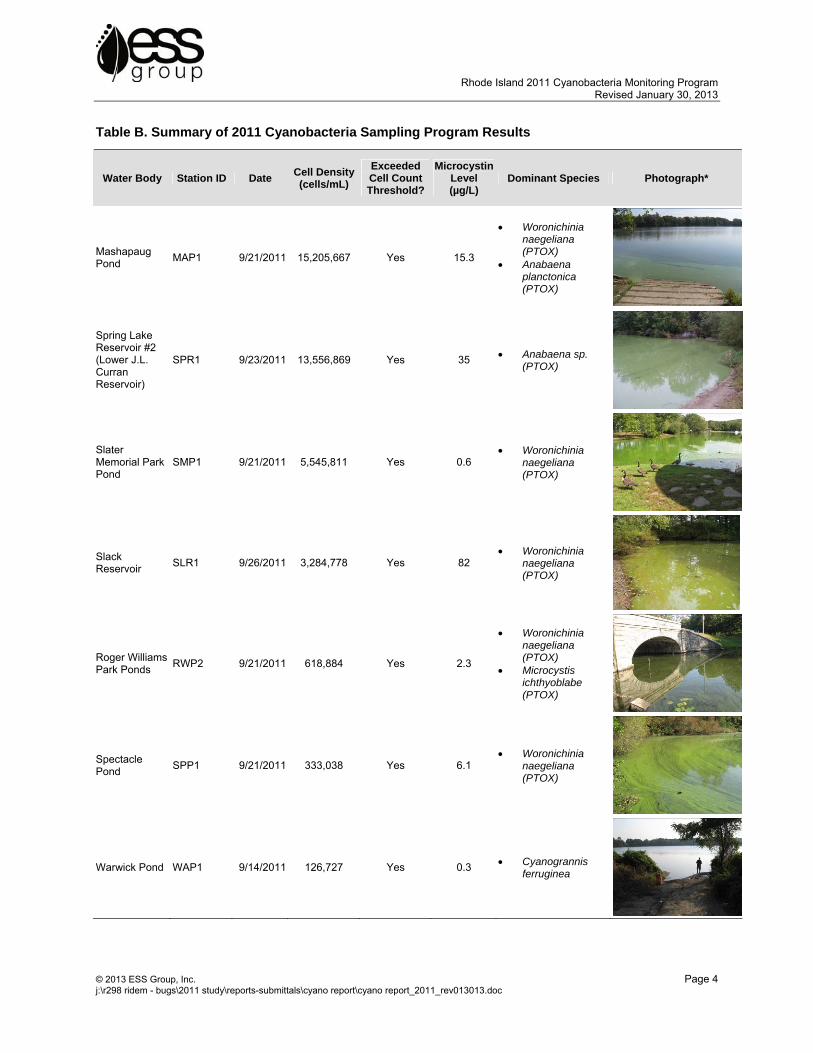
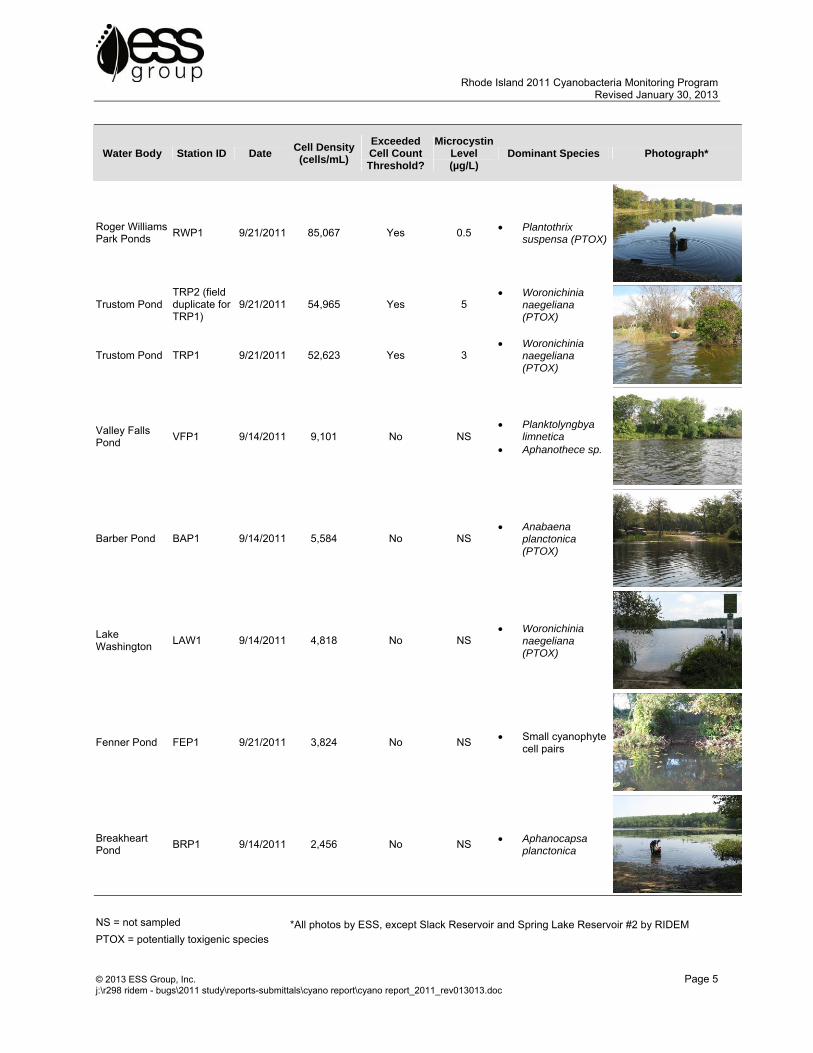
Cell densities ranged from fewer than 2,500 cells/ml to more than 15 million cells/mL (Table B). Overall, cell density exceeded 50,000 cells/mL in 10 samples from 8 water bodies.
Potentially toxigenic cyanobacteria species were identified in 11 samples from 9 water bodies (Table B). The potentially toxigenic cyanobacteria species that most frequently dominated samples were Woronichinia naegeliana and Anabaena spp. Microcystis ichthyoblabe and Plantothrix suspensa were dominant or co-dominant species with Woronichinia naegeliana at the two stations sampled in Roger Williams Park. Complete cyanobacteria identification and enumeration results may be found in Appendix A.
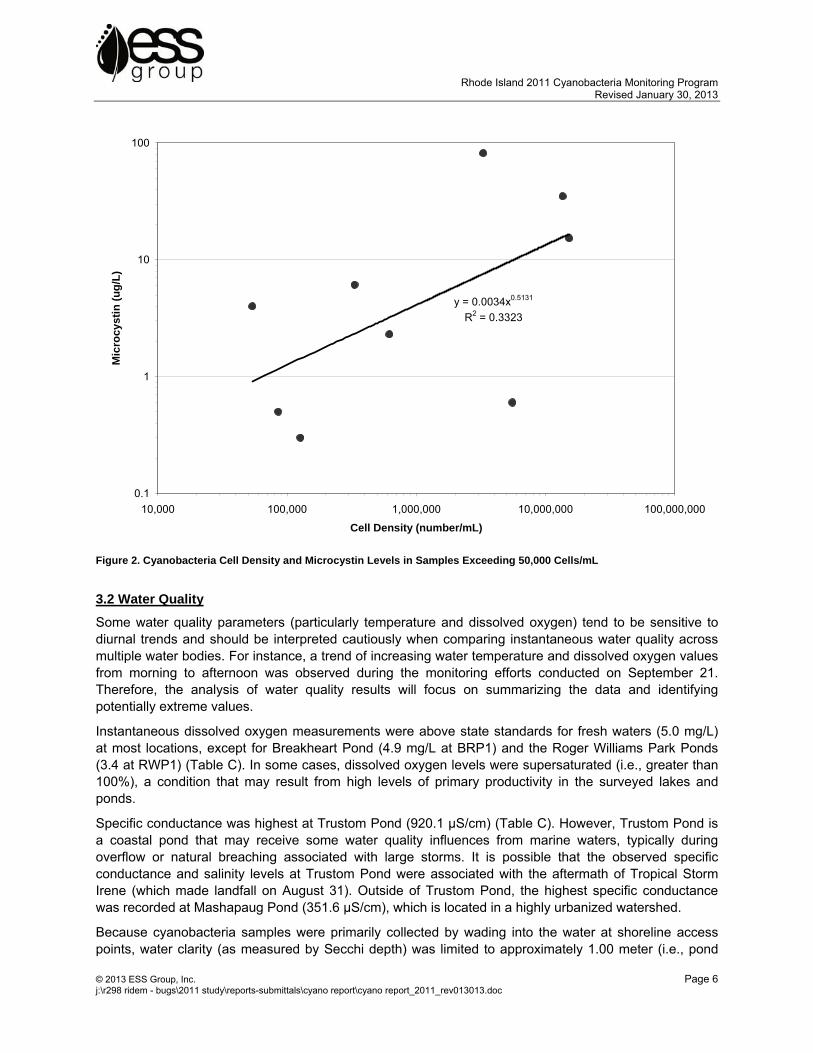
Measured microcystin levels from the 10 samples selected for microcystin analysis ranged from 0.3 µg/L to 82 µg/L and suggest that a relationship with cell density may potentially be described by a power function (Table B, Figure 2). Additional data from other blooms in Rhode Island would be needed to further evaluate the strength and significance of this relationship. Complete microcystin laboratory results are presented in Appendix B.
Loca
tion:G
:/GIS-
Projec
ts/R2
98-R
IDEM
/00.m
xd/20
11CY
ANOs
ites_
ortho
s.mxd
Figure1
2011 Cyanobacteria Screening Level Monitoring Sites
Source: 1) RIGIS, Political Boundaries, 2001 2) RIGIS, Orthos, 2011 3) ESS, GPS Locations, 2011
Scale: 1" = 50,000'
RIDEM CYANOBACTERIA MONITORINGRhode Island
environmental consulting& engineering services
0 10 Miles
Trustom Pond
TRP1/2
Barber PondBAP1
Breakheart Pond
BRP1
Lake Washington
LAW1
Spectacle Pond
SPP1
Mashapaug Pond
MAP1
Valley Falls Pond
VFP1
Roger Williams Park Ponds
RWP2
RWP1
Fenner PondFEP1
WAP1
Slater Memorial Park Pond
SMP1
Warwick Pond
Rhode Island 2011 Cyanobacteria Monitoring Program Revised January 30, 2013
© 2013 ESS Group, Inc. Page 4 j:\r298 ridem - bugs\2011 study\reports-submittals\cyano report\cyano report_2011_rev013013.doc
Table B. Summary of 2011 Cyanobacteria Sampling Program Results
Water Body Station ID Date Cell Density(cells/mL)
Exceeded Cell Count Threshold?
Microcystin Level (µg/L)
Dominant Species Photograph*
Mashapaug Pond
MAP1 9/21/2011 15,205,667 Yes 15.3
Woronichinia naegeliana (PTOX)
Anabaena planctonica (PTOX)
Spring Lake Reservoir #2 (Lower J.L. Curran Reservoir)
SPR1 9/23/2011 13,556,869 Yes 35 Anabaena sp. (PTOX)
Slater Memorial Park Pond
SMP1 9/21/2011 5,545,811 Yes 0.6 Woronichinia
naegeliana (PTOX)
Slack Reservoir
SLR1 9/26/2011 3,284,778 Yes 82 Woronichinia
naegeliana (PTOX)
Roger Williams Park Ponds
RWP2 9/21/2011 618,884 Yes 2.3
Woronichinia naegeliana (PTOX)
Microcystis ichthyoblabe (PTOX)
Spectacle Pond
SPP1 9/21/2011 333,038 Yes 6.1 Woronichinia
naegeliana (PTOX)
Warwick Pond WAP1 9/14/2011 126,727 Yes 0.3 Cyanogrannis ferruginea
Rhode Island 2011 Cyanobacteria Monitoring Program Revised January 30, 2013
© 2013 ESS Group, Inc. Page 5 j:\r298 ridem - bugs\2011 study\reports-submittals\cyano report\cyano report_2011_rev013013.doc
Water Body Station ID Date Cell Density(cells/mL)
Exceeded Cell Count Threshold?
Microcystin Level (µg/L)
Dominant Species Photograph*
Roger Williams Park Ponds
RWP1 9/21/2011 85,067 Yes 0.5 Plantothrix suspensa (PTOX)
Trustom Pond TRP2 (field duplicate for TRP1)
9/21/2011 54,965 Yes 5 Woronichinia
naegeliana (PTOX)
Trustom Pond TRP1 9/21/2011 52,623 Yes 3 Woronichinia
naegeliana (PTOX)
Valley Falls Pond
VFP1 9/14/2011 9,101 No NS Planktolyngbya
limnetica Aphanothece sp.
Barber Pond BAP1 9/14/2011 5,584 No NS Anabaena
planctonica (PTOX)
Lake Washington
LAW1 9/14/2011 4,818 No NS Woronichinia
naegeliana (PTOX)
Fenner Pond FEP1 9/21/2011 3,824 No NS Small cyanophyte cell pairs
Breakheart Pond
BRP1 9/14/2011 2,456 No NS Aphanocapsa planctonica
NS = not sampled *All photos by ESS, except Slack Reservoir and Spring Lake Reservoir #2 by RIDEM PTOX = potentially toxigenic species
Rhode Island 2011 Cyanobacteria Monitoring Program Revised January 30, 2013
© 2013 ESS Group, Inc. Page 6 j:\r298 ridem - bugs\2011 study\reports-submittals\cyano report\cyano report_2011_rev013013.doc
3.2 Water Quality
Some water quality parameters (particularly temperature and dissolved oxygen) tend to be sensitive to diurnal trends and should be interpreted cautiously when comparing instantaneous water quality across multiple water bodies. For instance, a trend of increasing water temperature and dissolved oxygen values from morning to afternoon was observed during the monitoring efforts conducted on September 21. Therefore, the analysis of water quality results will focus on summarizing the data and identifying potentially extreme values.
Instantaneous dissolved oxygen measurements were above state standards for fresh waters (5.0 mg/L) at most locations, except for Breakheart Pond (4.9 mg/L at BRP1) and the Roger Williams Park Ponds (3.4 at RWP1) (Table C). In some cases, dissolved oxygen levels were supersaturated (i.e., greater than 100%), a condition that may result from high levels of primary productivity in the surveyed lakes and ponds.
Specific conductance was highest at Trustom Pond (920.1 μS/cm) (Table C). However, Trustom Pond is a coastal pond that may receive some water quality influences from marine waters, typically during overflow or natural breaching associated with large storms. It is possible that the observed specific conductance and salinity levels at Trustom Pond were associated with the aftermath of Tropical Storm Irene (which made landfall on August 31). Outside of Trustom Pond, the highest specific conductance was recorded at Mashapaug Pond (351.6 μS/cm), which is located in a highly urbanized watershed.
Because cyanobacteria samples were primarily collected by wading into the water at shoreline access points, water clarity (as measured by Secchi depth) was limited to approximately 1.00 meter (i.e., pond
y = 0.0034x0.5131
R2 = 0.3323
0.1
1
10
100
10,000 100,000 1,000,000 10,000,000 100,000,000
Cell Density (number/mL)
Mic
rocy
stin
(u
g/L
)
Figure 2. Cyanobacteria Cell Density and Microcystin Levels in Samples Exceeding 50,000 Cells/mL
Rhode Island 2011 Cyanobacteria Monitoring Program Revised January 30, 2013
© 2013 ESS Group, Inc. Page 7 j:\r298 ridem - bugs\2011 study\reports-submittals\cyano report\cyano report_2011_rev013013.doc
bottom). Additional Secchi depth measurements were collected at ponds where a boat allowed access to deeper water and provide a better indication of actual water clarity at the time of sampling. Water clarity was most impaired at Slater Memorial Park Pond, where the pond-wide bloom reduced Secchi depth to less than 0.25 meters (Table C). Water clarity was also less than 1.00 meter in Fenner Pond, Mashapaug Pond, and at Station RWP2 in the Roger Williams Park Ponds. Since a cyanobacteria bloom was not evident at Fenner Pond, the reduced water clarity observed was likely due to staining (water color was a dark brown) and/or possibly a bloom sustained by another phytoplankton taxonomic group (e.g., green algae).
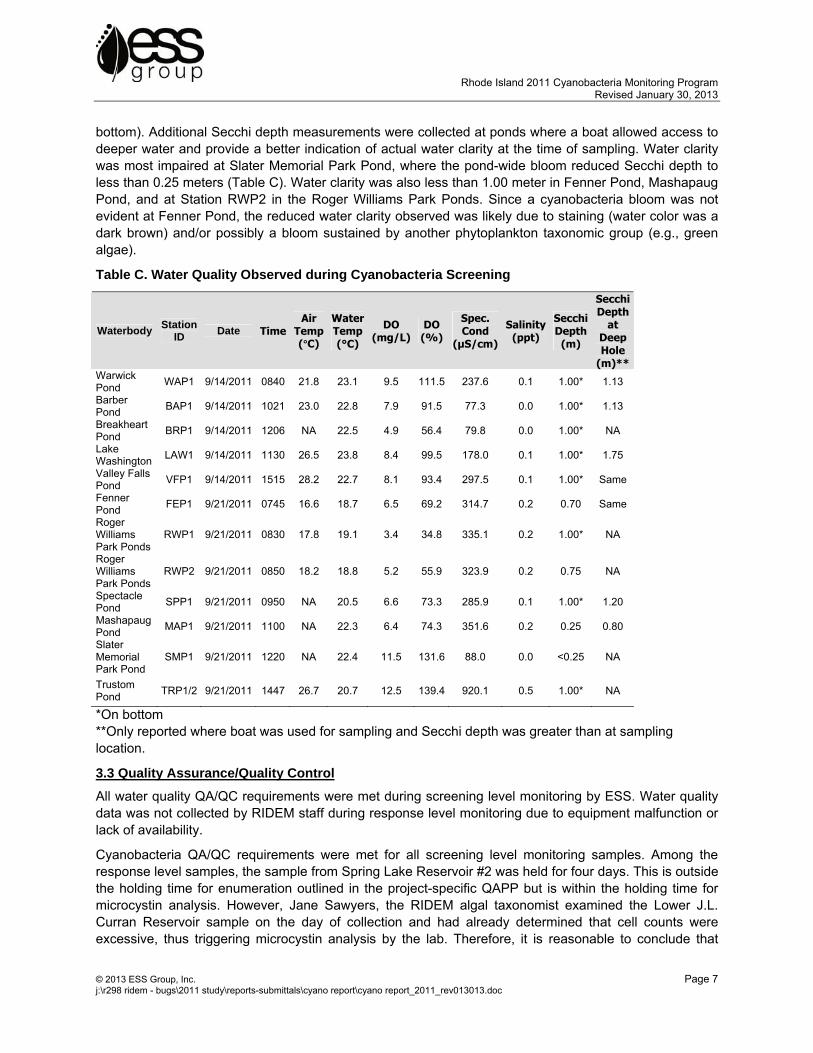
Table C. Water Quality Observed during Cyanobacteria Screening
Waterbody Station
ID Date Time
Air Temp (°C)
Water Temp (°C)
DO (mg/L)
DO (%)
Spec. Cond
(μS/cm)
Salinity(ppt)
Secchi Depth
(m)
Secchi Depth
at Deep Hole
(m)** Warwick Pond
WAP1 9/14/2011 0840 21.8 23.1 9.5 111.5 237.6 0.1 1.00* 1.13
Barber Pond
BAP1 9/14/2011 1021 23.0 22.8 7.9 91.5 77.3 0.0 1.00* 1.13
Breakheart Pond
BRP1 9/14/2011 1206 NA 22.5 4.9 56.4 79.8 0.0 1.00* NA
Lake Washington
LAW1 9/14/2011 1130 26.5 23.8 8.4 99.5 178.0 0.1 1.00* 1.75
Valley Falls Pond
VFP1 9/14/2011 1515 28.2 22.7 8.1 93.4 297.5 0.1 1.00* Same
Fenner Pond
FEP1 9/21/2011 0745 16.6 18.7 6.5 69.2 314.7 0.2 0.70 Same
Roger Williams Park Ponds
RWP1 9/21/2011 0830 17.8 19.1 3.4 34.8 335.1 0.2 1.00* NA
Roger Williams Park Ponds
RWP2 9/21/2011 0850 18.2 18.8 5.2 55.9 323.9 0.2 0.75 NA
Spectacle Pond
SPP1 9/21/2011 0950 NA 20.5 6.6 73.3 285.9 0.1 1.00* 1.20
Mashapaug Pond
MAP1 9/21/2011 1100 NA 22.3 6.4 74.3 351.6 0.2 0.25 0.80
Slater Memorial Park Pond
SMP1 9/21/2011 1220 NA 22.4 11.5 131.6 88.0 0.0 <0.25 NA
Trustom Pond
TRP1/2 9/21/2011 1447 26.7 20.7 12.5 139.4 920.1 0.5 1.00* NA
*On bottom **Only reported where boat was used for sampling and Secchi depth was greater than at sampling location.
3.3 Quality Assurance/Quality Control
All water quality QA/QC requirements were met during screening level monitoring by ESS. Water quality data was not collected by RIDEM staff during response level monitoring due to equipment malfunction or lack of availability.
Cyanobacteria QA/QC requirements were met for all screening level monitoring samples. Among the response level samples, the sample from Spring Lake Reservoir #2 was held for four days. This is outside the holding time for enumeration outlined in the project-specific QAPP but is within the holding time for microcystin analysis. However, Jane Sawyers, the RIDEM algal taxonomist examined the Lower J.L. Curran Reservoir sample on the day of collection and had already determined that cell counts were excessive, thus triggering microcystin analysis by the lab. Therefore, it is reasonable to conclude that
Rhode Island 2011 Cyanobacteria Monitoring Program Revised January 30, 2013
© 2013 ESS Group, Inc. Page 8 j:\r298 ridem - bugs\2011 study\reports-submittals\cyano report\cyano report_2011_rev013013.doc
exceedance of hold time for enumeration/identification analysis did not have a substantive impact on the decision to have the lab analyze the sample for microcystins or the results of the microcystin analysis.
All internal lab QC requirements were met for each sample. Additionally, one field duplicate was collected in accordance with the rate specified by the project-specific QAPP. The duplicate sample was collected from the same location in Trustom Pond (TRP1/TRP2). Cell density and microcystin levels for the field duplicate were within QC limits.
4.0 DISCUSSION AND CONCLUSIONS
ESS visited 11 water bodies statewide and collected 13 cyanobacteria samples as part of the 2011 screening level monitoring program. An additional two samples were collected by RIDEM in response to active blooms.
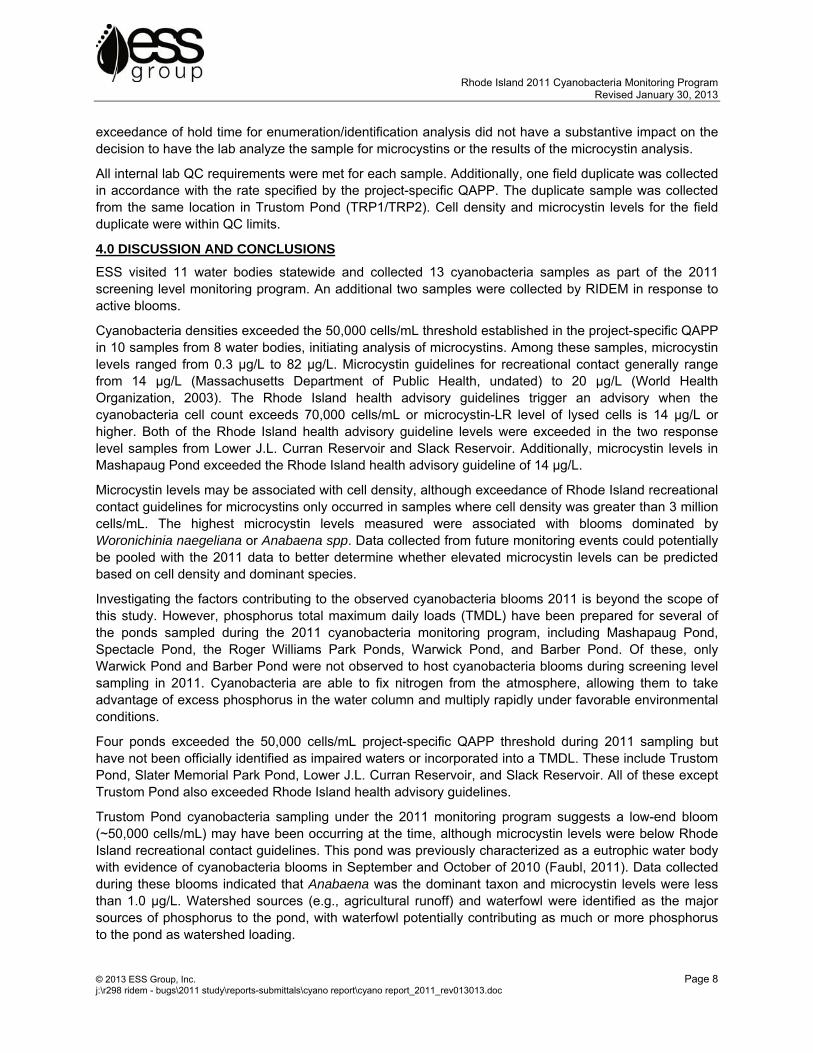
Cyanobacteria densities exceeded the 50,000 cells/mL threshold established in the project-specific QAPP in 10 samples from 8 water bodies, initiating analysis of microcystins. Among these samples, microcystin levels ranged from 0.3 µg/L to 82 µg/L. Microcystin guidelines for recreational contact generally range from 14 µg/L (Massachusetts Department of Public Health, undated) to 20 µg/L (World Health Organization, 2003). The Rhode Island health advisory guidelines trigger an advisory when the cyanobacteria cell count exceeds 70,000 cells/mL or microcystin-LR level of lysed cells is 14 µg/L or higher. Both of the Rhode Island health advisory guideline levels were exceeded in the two response level samples from Lower J.L. Curran Reservoir and Slack Reservoir. Additionally, microcystin levels in Mashapaug Pond exceeded the Rhode Island health advisory guideline of 14 µg/L.
Microcystin levels may be associated with cell density, although exceedance of Rhode Island recreational contact guidelines for microcystins only occurred in samples where cell density was greater than 3 million cells/mL. The highest microcystin levels measured were associated with blooms dominated by Woronichinia naegeliana or Anabaena spp. Data collected from future monitoring events could potentially be pooled with the 2011 data to better determine whether elevated microcystin levels can be predicted based on cell density and dominant species.
Investigating the factors contributing to the observed cyanobacteria blooms 2011 is beyond the scope of this study. However, phosphorus total maximum daily loads (TMDL) have been prepared for several of the ponds sampled during the 2011 cyanobacteria monitoring program, including Mashapaug Pond, Spectacle Pond, the Roger Williams Park Ponds, Warwick Pond, and Barber Pond. Of these, only Warwick Pond and Barber Pond were not observed to host cyanobacteria blooms during screening level sampling in 2011. Cyanobacteria are able to fix nitrogen from the atmosphere, allowing them to take advantage of excess phosphorus in the water column and multiply rapidly under favorable environmental conditions.
Four ponds exceeded the 50,000 cells/mL project-specific QAPP threshold during 2011 sampling but have not been officially identified as impaired waters or incorporated into a TMDL. These include Trustom Pond, Slater Memorial Park Pond, Lower J.L. Curran Reservoir, and Slack Reservoir. All of these except Trustom Pond also exceeded Rhode Island health advisory guidelines.
Trustom Pond cyanobacteria sampling under the 2011 monitoring program suggests a low-end bloom (~50,000 cells/mL) may have been occurring at the time, although microcystin levels were below Rhode Island recreational contact guidelines. This pond was previously characterized as a eutrophic water body with evidence of cyanobacteria blooms in September and October of 2010 (Faubl, 2011). Data collected during these blooms indicated that Anabaena was the dominant taxon and microcystin levels were less than 1.0 µg/L. Watershed sources (e.g., agricultural runoff) and waterfowl were identified as the major sources of phosphorus to the pond, with waterfowl potentially contributing as much or more phosphorus to the pond as watershed loading.
Rhode Island 2011 Cyanobacteria Monitoring Program Revised January 30, 2013
© 2013 ESS Group, Inc. Page 9 j:\r298 ridem - bugs\2011 study\reports-submittals\cyano report\cyano report_2011_rev013013.doc
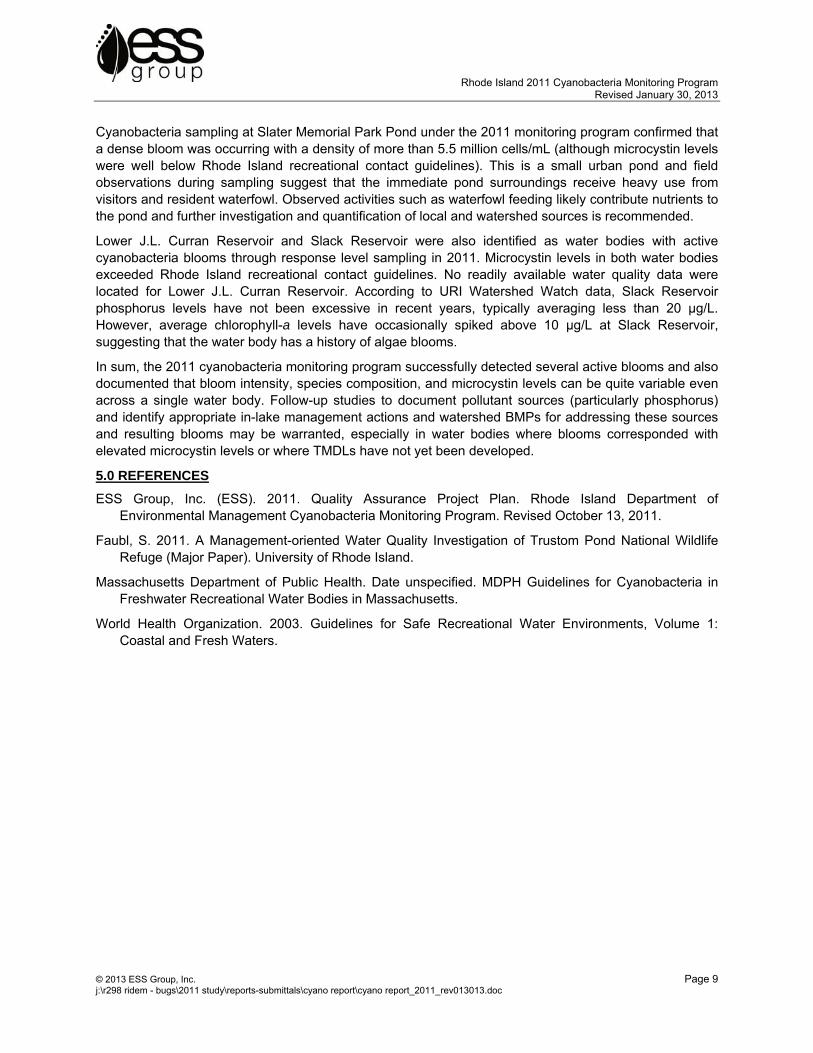
Cyanobacteria sampling at Slater Memorial Park Pond under the 2011 monitoring program confirmed that a dense bloom was occurring with a density of more than 5.5 million cells/mL (although microcystin levels were well below Rhode Island recreational contact guidelines). This is a small urban pond and field observations during sampling suggest that the immediate pond surroundings receive heavy use from visitors and resident waterfowl. Observed activities such as waterfowl feeding likely contribute nutrients to the pond and further investigation and quantification of local and watershed sources is recommended.
Lower J.L. Curran Reservoir and Slack Reservoir were also identified as water bodies with active cyanobacteria blooms through response level sampling in 2011. Microcystin levels in both water bodies exceeded Rhode Island recreational contact guidelines. No readily available water quality data were located for Lower J.L. Curran Reservoir. According to URI Watershed Watch data, Slack Reservoir phosphorus levels have not been excessive in recent years, typically averaging less than 20 µg/L. However, average chlorophyll-a levels have occasionally spiked above 10 µg/L at Slack Reservoir, suggesting that the water body has a history of algae blooms.
In sum, the 2011 cyanobacteria monitoring program successfully detected several active blooms and also documented that bloom intensity, species composition, and microcystin levels can be quite variable even across a single water body. Follow-up studies to document pollutant sources (particularly phosphorus) and identify appropriate in-lake management actions and watershed BMPs for addressing these sources and resulting blooms may be warranted, especially in water bodies where blooms corresponded with elevated microcystin levels or where TMDLs have not yet been developed.
5.0 REFERENCES
ESS Group, Inc. (ESS). 2011. Quality Assurance Project Plan. Rhode Island Department of Environmental Management Cyanobacteria Monitoring Program. Revised October 13, 2011.
Faubl, S. 2011. A Management-oriented Water Quality Investigation of Trustom Pond National Wildlife Refuge (Major Paper). University of Rhode Island.
Massachusetts Department of Public Health. Date unspecified. MDPH Guidelines for Cyanobacteria in Freshwater Recreational Water Bodies in Massachusetts.
World Health Organization. 2003. Guidelines for Safe Recreational Water Environments, Volume 1: Coastal and Fresh Waters.
www.essgroup.com
Appendix A
Cyanobacteria Identification and Enumeration Lab Reports
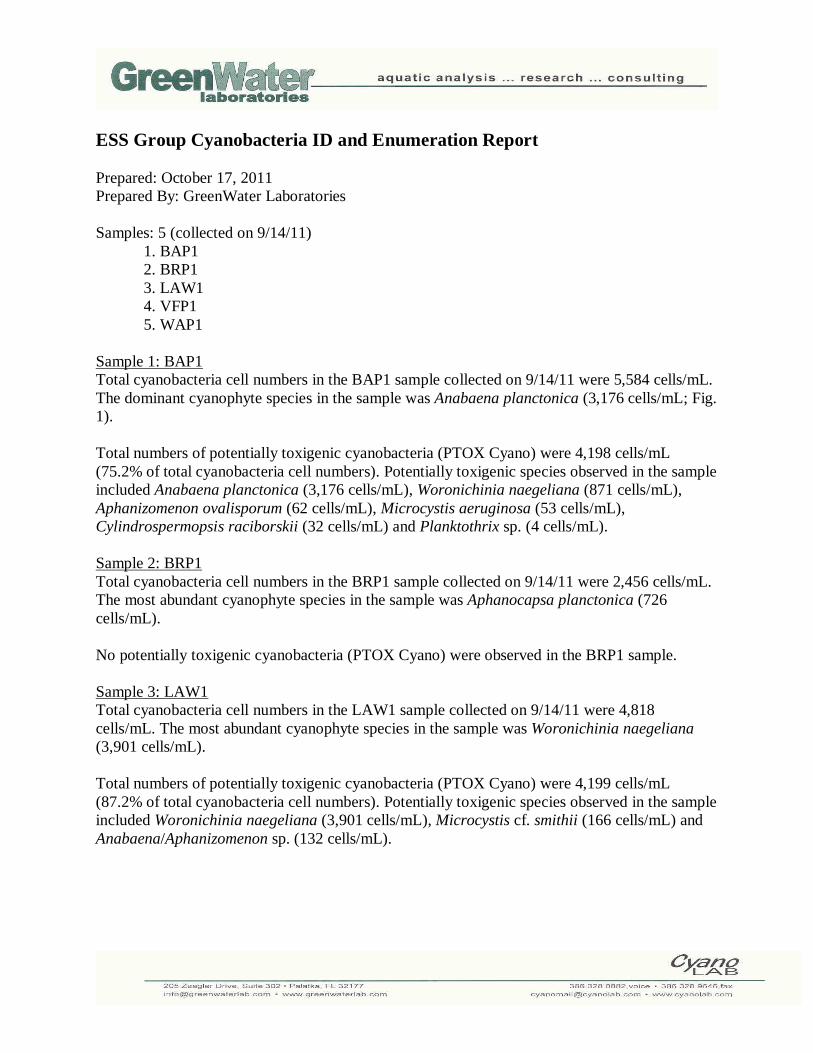
ESS Group Cyanobacteria ID and Enumeration Report Prepared: October 17, 2011 Prepared By: GreenWater Laboratories Samples: 5 (collected on 9/14/11) 1. BAP1 2. BRP1 3. LAW1 4. VFP1 5. WAP1 Sample 1: BAP1 Total cyanobacteria cell numbers in the BAP1 sample collected on 9/14/11 were 5,584 cells/mL. The dominant cyanophyte species in the sample was Anabaena planctonica (3,176 cells/mL; Fig. 1). Total numbers of potentially toxigenic cyanobacteria (PTOX Cyano) were 4,198 cells/mL (75.2% of total cyanobacteria cell numbers). Potentially toxigenic species observed in the sample included Anabaena planctonica (3,176 cells/mL), Woronichinia naegeliana (871 cells/mL), Aphanizomenon ovalisporum (62 cells/mL), Microcystis aeruginosa (53 cells/mL), Cylindrospermopsis raciborskii (32 cells/mL) and Planktothrix sp. (4 cells/mL). Sample 2: BRP1 Total cyanobacteria cell numbers in the BRP1 sample collected on 9/14/11 were 2,456 cells/mL. The most abundant cyanophyte species in the sample was Aphanocapsa planctonica (726 cells/mL). No potentially toxigenic cyanobacteria (PTOX Cyano) were observed in the BRP1 sample. Sample 3: LAW1 Total cyanobacteria cell numbers in the LAW1 sample collected on 9/14/11 were 4,818 cells/mL. The most abundant cyanophyte species in the sample was Woronichinia naegeliana (3,901 cells/mL). Total numbers of potentially toxigenic cyanobacteria (PTOX Cyano) were 4,199 cells/mL (87.2% of total cyanobacteria cell numbers). Potentially toxigenic species observed in the sample included Woronichinia naegeliana (3,901 cells/mL), Microcystis cf. smithii (166 cells/mL) and Anabaena/Aphanizomenon sp. (132 cells/mL).
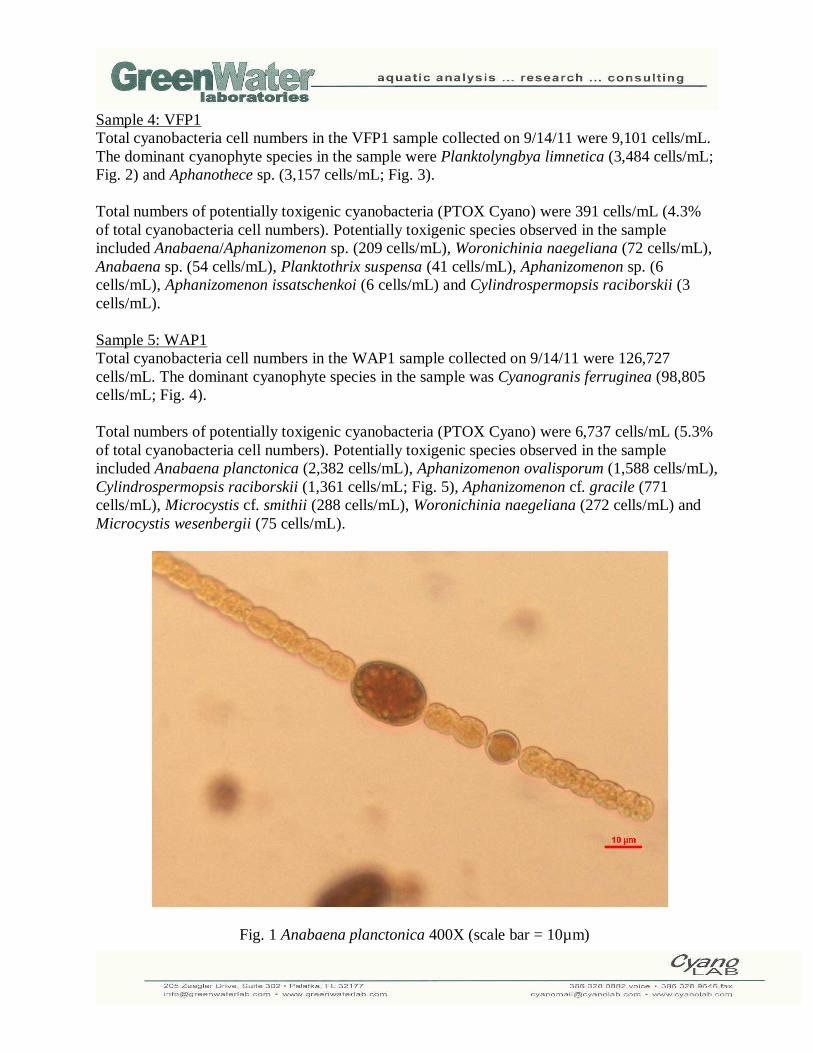
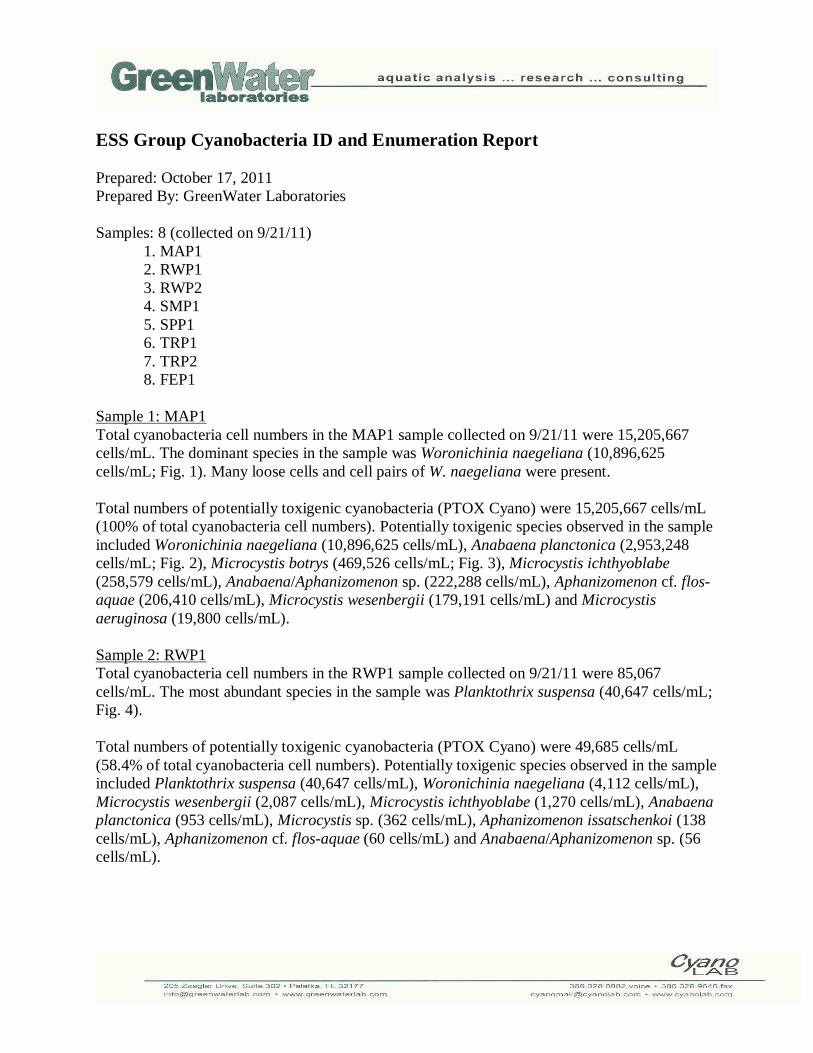
Sample 4: VFP1 Total cyanobacteria cell numbers in the VFP1 sample collected on 9/14/11 were 9,101 cells/mL. The dominant cyanophyte species in the sample were Planktolyngbya limnetica (3,484 cells/mL; Fig. 2) and Aphanothece sp. (3,157 cells/mL; Fig. 3). Total numbers of potentially toxigenic cyanobacteria (PTOX Cyano) were 391 cells/mL (4.3% of total cyanobacteria cell numbers). Potentially toxigenic species observed in the sample included Anabaena/Aphanizomenon sp. (209 cells/mL), Woronichinia naegeliana (72 cells/mL), Anabaena sp. (54 cells/mL), Planktothrix suspensa (41 cells/mL), Aphanizomenon sp. (6 cells/mL), Aphanizomenon issatschenkoi (6 cells/mL) and Cylindrospermopsis raciborskii (3 cells/mL). Sample 5: WAP1 Total cyanobacteria cell numbers in the WAP1 sample collected on 9/14/11 were 126,727 cells/mL. The dominant cyanophyte species in the sample was Cyanogranis ferruginea (98,805 cells/mL; Fig. 4). Total numbers of potentially toxigenic cyanobacteria (PTOX Cyano) were 6,737 cells/mL (5.3% of total cyanobacteria cell numbers). Potentially toxigenic species observed in the sample included Anabaena planctonica (2,382 cells/mL), Aphanizomenon ovalisporum (1,588 cells/mL), Cylindrospermopsis raciborskii (1,361 cells/mL; Fig. 5), Aphanizomenon cf. gracile (771 cells/mL), Microcystis cf. smithii (288 cells/mL), Woronichinia naegeliana (272 cells/mL) and Microcystis wesenbergii (75 cells/mL).
Fig. 1 Anabaena planctonica 400X (scale bar = 10µm)
Fig. 2 Planktolyngbya limnetica 400X (scale bar = 10µm)
Fig. 3 Aphanothece sp. 400X (scale bar = 10µm)
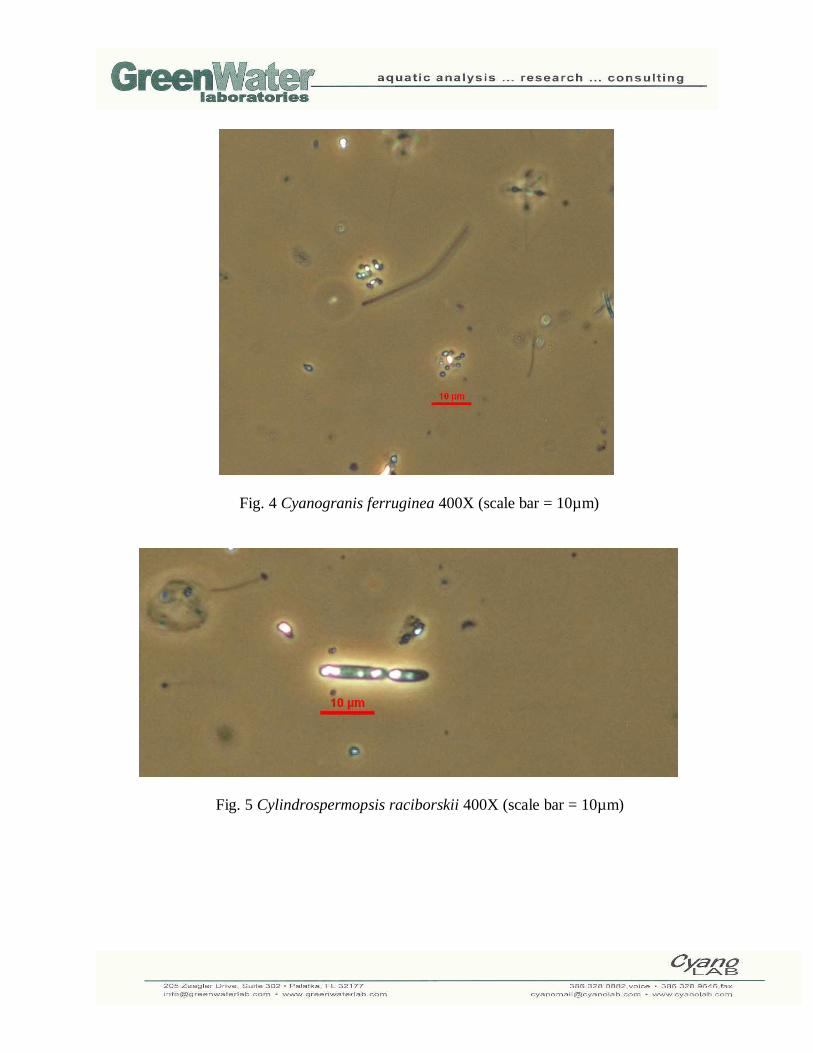
Fig. 4 Cyanogranis ferruginea 400X (scale bar = 10µm)
Fig. 5 Cylindrospermopsis raciborskii 400X (scale bar = 10µm)
ESS Group Cyanobacteria ID and Enumeration Report Prepared: October 17, 2011 Prepared By: GreenWater Laboratories Samples: 8 (collected on 9/21/11) 1. MAP1 2. RWP1 3. RWP2 4. SMP1 5. SPP1 6. TRP1 7. TRP2 8. FEP1 Sample 1: MAP1 Total cyanobacteria cell numbers in the MAP1 sample collected on 9/21/11 were 15,205,667 cells/mL. The dominant species in the sample was Woronichinia naegeliana (10,896,625 cells/mL; Fig. 1). Many loose cells and cell pairs of W. naegeliana were present. Total numbers of potentially toxigenic cyanobacteria (PTOX Cyano) were 15,205,667 cells/mL (100% of total cyanobacteria cell numbers). Potentially toxigenic species observed in the sample included Woronichinia naegeliana (10,896,625 cells/mL), Anabaena planctonica (2,953,248 cells/mL; Fig. 2), Microcystis botrys (469,526 cells/mL; Fig. 3), Microcystis ichthyoblabe (258,579 cells/mL), Anabaena/Aphanizomenon sp. (222,288 cells/mL), Aphanizomenon cf. flos-aquae (206,410 cells/mL), Microcystis wesenbergii (179,191 cells/mL) and Microcystis aeruginosa (19,800 cells/mL). Sample 2: RWP1 Total cyanobacteria cell numbers in the RWP1 sample collected on 9/21/11 were 85,067 cells/mL. The most abundant species in the sample was Planktothrix suspensa (40,647 cells/mL; Fig. 4). Total numbers of potentially toxigenic cyanobacteria (PTOX Cyano) were 49,685 cells/mL (58.4% of total cyanobacteria cell numbers). Potentially toxigenic species observed in the sample included Planktothrix suspensa (40,647 cells/mL), Woronichinia naegeliana (4,112 cells/mL), Microcystis wesenbergii (2,087 cells/mL), Microcystis ichthyoblabe (1,270 cells/mL), Anabaena planctonica (953 cells/mL), Microcystis sp. (362 cells/mL), Aphanizomenon issatschenkoi (138 cells/mL), Aphanizomenon cf. flos-aquae (60 cells/mL) and Anabaena/Aphanizomenon sp. (56 cells/mL).
Sample 3: RWP2 Total cyanobacteria cell numbers in the RWP2 sample collected on 9/21/11 were 618,884 cells/mL. The most abundant species in the sample were Woronichinia naegeliana (254,270 cells/mL) and Microcystis ichthyoblabe (204,142 cells/mL; Fig. 5). Total numbers of potentially toxigenic cyanobacteria (PTOX Cyano) were 593,071 cells/mL (95.8% of total cyanobacteria cell numbers). Potentially toxigenic species observed in the sample included Woronichinia naegeliana (254,270 cells/mL), Microcystis ichthyoblabe (204,142 cells/mL), Anabaena planctonica (58,521 cells/mL), Planktothrix suspensa (32,209 cells/mL), Microcystis cf. smithii (21,889 cells/mL), Anabaena/Aphanizomenon sp. (8,166 cells/mL), Aphanizomenon cf. flos-aquae (5,897 cells/mL), Microcystis spp. unicells and cell pairs (4,310 cells/mL), Microcystis wesenbergii (2,193 cells/mL) and Aphanizomenon issatschenkoi (1,474 cells/mL). Sample 4: SMP1 Total cyanobacteria cell numbers in the SMP1 sample collected on 9/21/11 were 5,545,811 cells/mL. The dominant species in the sample was Woronichinia naegeliana (5,494,811 cells/mL). Many loose cells and cell pairs of W. naegeliana were present. Total numbers of potentially toxigenic cyanobacteria (PTOX Cyano) were 5,545,811 cells/mL (100% of total cyanobacteria cell numbers). Potentially toxigenic species observed in the sample included Woronichinia naegeliana (10,896,625 cells/mL) and Anabaena sp. (51,000 cells/mL; Fig. 6). Sample 5: SPP1 Total cyanobacteria cell numbers in the SPP1 sample collected on 9/21/11 were 333,038 cells/mL. The dominant species in the sample was Woronichinia naegeliana (203,461 cells/mL). Many loose cells and cell pairs of W. naegeliana were present. Total numbers of potentially toxigenic cyanobacteria (PTOX Cyano) were 330,697 cells/mL (99.3% of total cyanobacteria cell numbers). Potentially toxigenic species observed in the sample included Woronichinia naegeliana (203,461 cells/mL), Anabaena planctonica (57,462 cells/mL), Microcystis ichthyoblabe (31,453 cells/mL), Aphanizomenon cf. flos-aquae (15,122 cells/mL), Microcystis spp. unicells and cell pairs (14,819 cells/mL), Microcystis wesenbergii (3,432 cells/mL), Microcystis cf. smithii (2,948 cells/mL) and Microcystis botrys (2,000 cells/mL). Sample 6: TRP1 Total cyanobacteria cell numbers in the TRP1 sample collected on 9/21/11 were 52,623 cells/mL. The dominant species in the sample was Woronichinia naegeliana (34,477 cells/mL). Many loose cells and cell pairs of W. naegeliana were present. Total numbers of potentially toxigenic cyanobacteria (PTOX Cyano) were 40,513 cells/mL (77.0% of total cyanobacteria cell numbers). Potentially toxigenic species observed in the sample included Woronichinia naegeliana (34,477 cells/mL), Microcystis aeruginosa (3,744 cells/mL), Microcystis cf. smithii (715 cells/mL), Microcystis wesenbergii (544 cells/mL), Snowella
lacustris (470 cells/mL), Microcystis spp. (347 cells/mL) and Aphanizomenon sp. (216 cells/mL). Sample 7: TRP2 Total cyanobacteria cell numbers in the TRP2 sample collected on 9/21/11 were 54,965 cells/mL. The dominant species in the sample were Woronichinia naegeliana (24,860 cells/mL) and Microcystis aeruginosa (16,740 cells/mL; Fig. 7). Total numbers of potentially toxigenic cyanobacteria (PTOX Cyano) were 42,378 cells/mL (77.1% of total cyanobacteria cell numbers). Potentially toxigenic species observed in the sample included Woronichinia naegeliana (24,860 cells/mL), Microcystis aeruginosa (16,740 cells/mL), Microcystis sp. (499 cells/mL), Anabaena sp. (96 cells/mL), Aphanizomenon issatschenkoi (95 cells/mL), Aphanizomenon sp. (60 cells/mL), Microcystis wesenbergii (18 cells/mL) and Anabaena sp. (10 cells/mL). Sample 8: FEP1 Total cyanobacteria cell numbers in the FEP1 sample collected on 9/21/11 were 3,824 cells/mL. The dominant species in the sample were pairs of small (<5um) cyanophyte cells. Total numbers of potentially toxigenic cyanobacteria (PTOX Cyano) were 770 cells/mL (20.1% of total cyanobacteria cell numbers). Potentially toxigenic species observed in the sample included Woronichinia naegeliana (588 cells/mL) and Microcystis sp. (182 cells/mL).
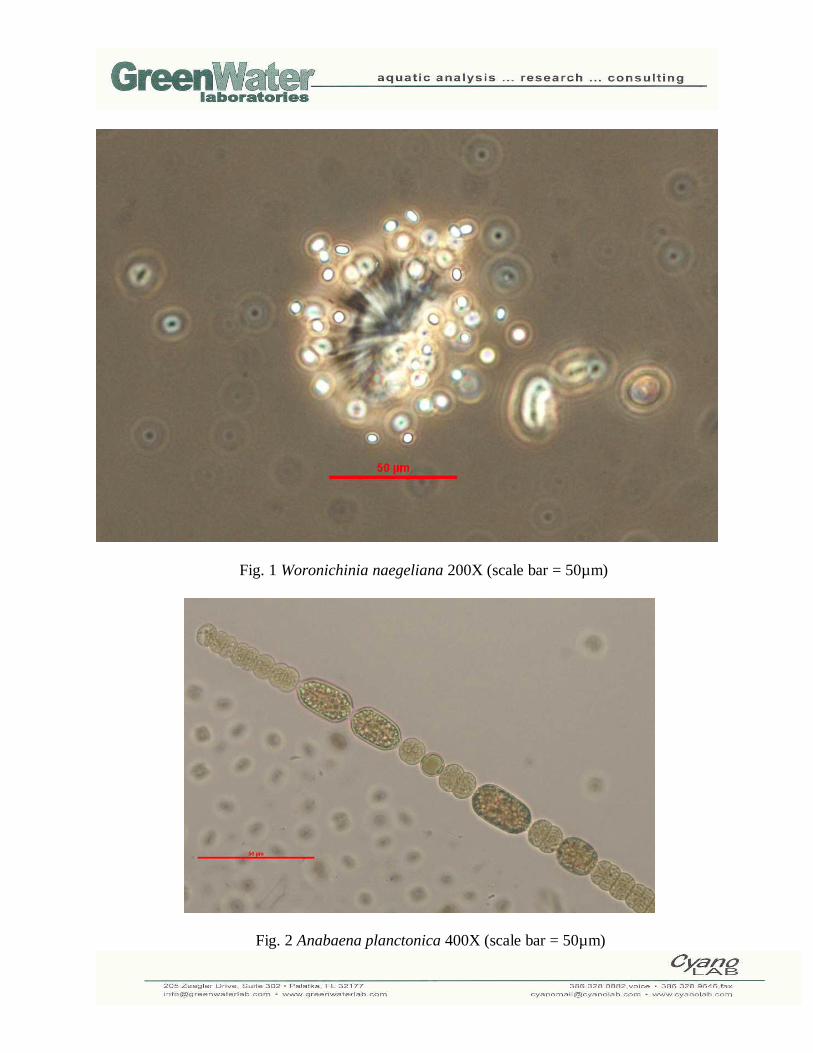
Fig. 1 Woronichinia naegeliana 200X (scale bar = 50µm)
Fig. 2 Anabaena planctonica 400X (scale bar = 50µm)
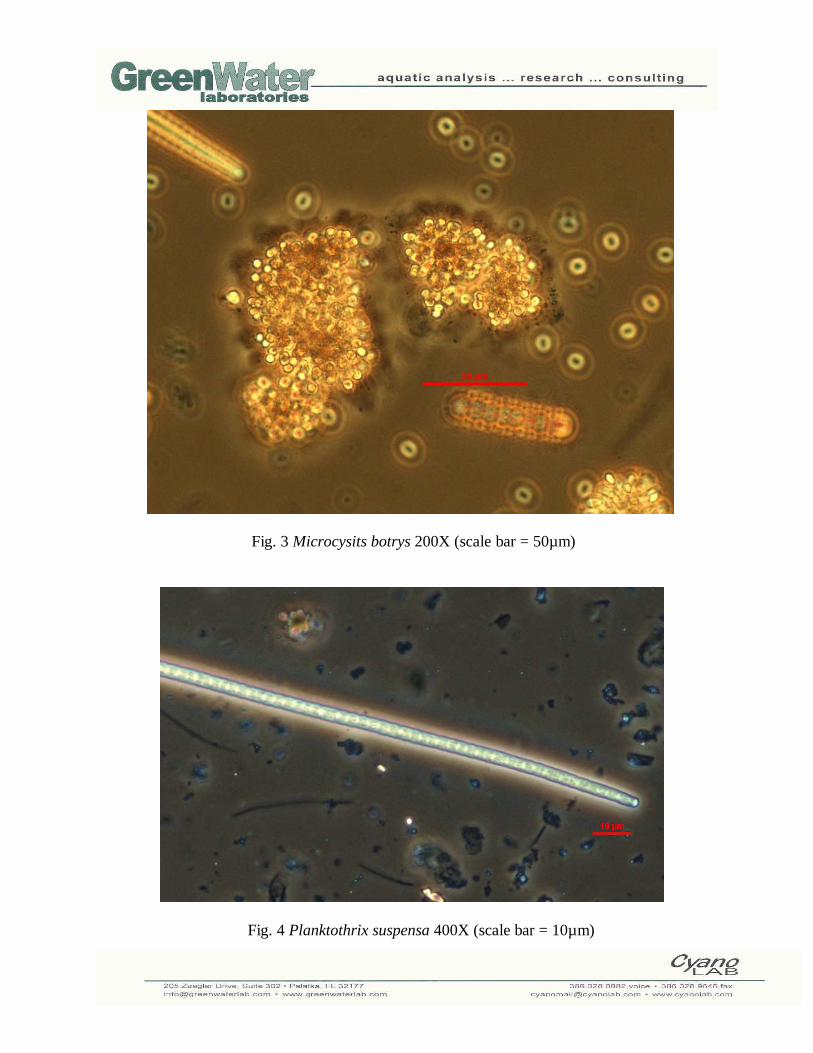
Fig. 3 Microcysits botrys 200X (scale bar = 50µm)
Fig. 4 Planktothrix suspensa 400X (scale bar = 10µm)
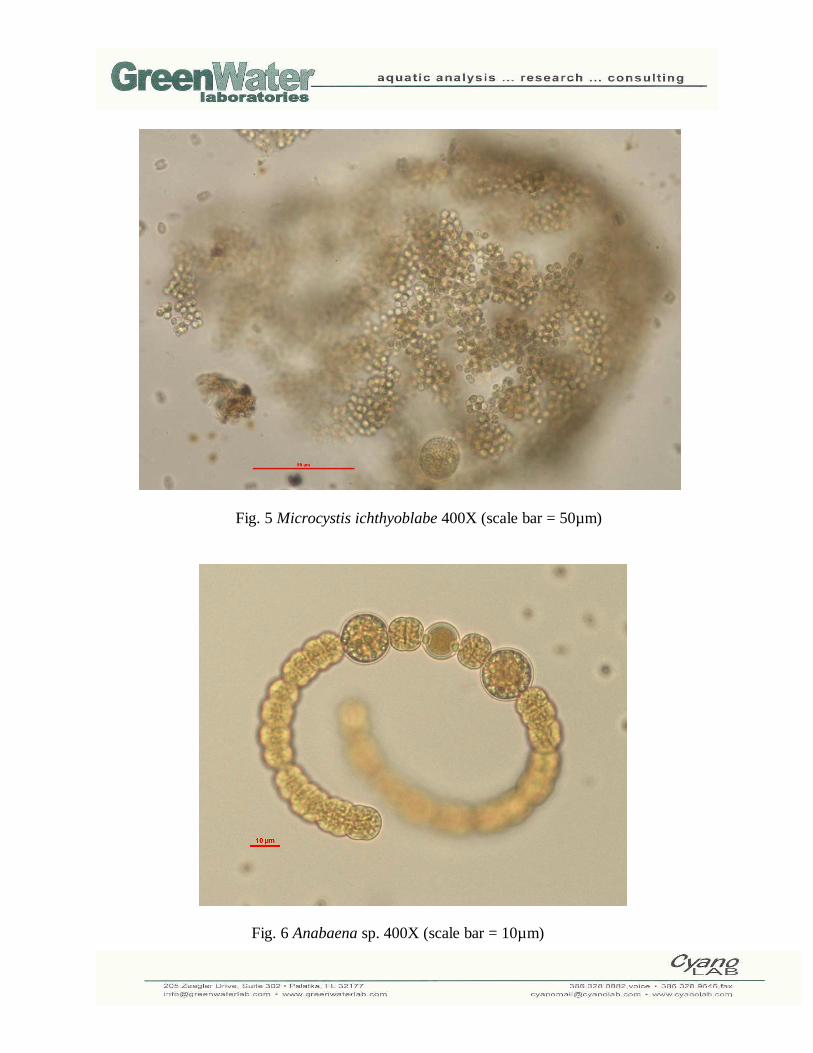
Fig. 5 Microcystis ichthyoblabe 400X (scale bar = 50µm)
Fig. 6 Anabaena sp. 400X (scale bar = 10µm)
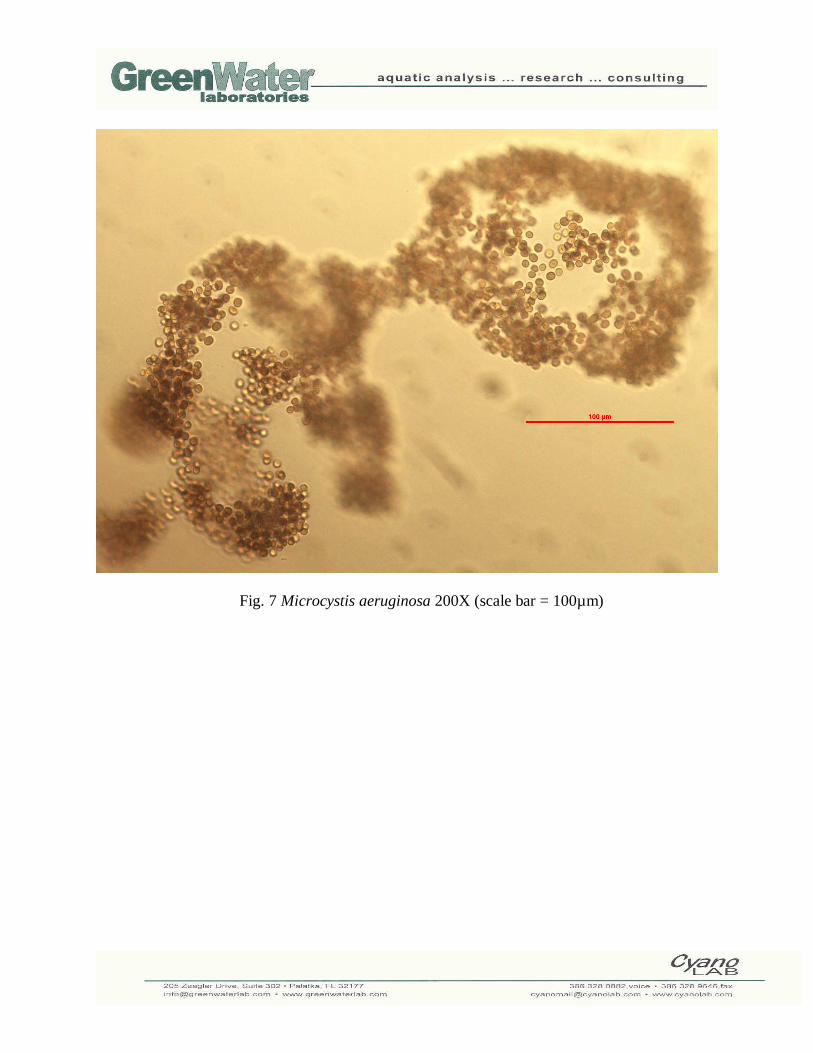
Fig. 7 Microcystis aeruginosa 200X (scale bar = 100µm)
ESS Group Cyanobacteria ID and Enumeration Report Prepared: September 29, 2011 Prepared By: GreenWater Laboratories Samples: 2 1. Spring Lake Reservoir (collected on 9/23/11) 2. Slacks Reservoir (collected on 9/26/11) Sample 1: Spring Lake Reservoir Total cyanobacteria cell numbers in the Spring Lake Reservoir sample collected on 9/23/11 were 13,556,869 cells/mL. The dominant species in the sample was an Anabaena species (12,411,809 cells/mL). The Anabaena consisted mostly of loose unicells indicating the recent crash of a bloom (Fig. 1). Some loose akinetes were observed (Fig. 2) which most resembled those of Anabaena planctonica. Total numbers of potentially toxigenic cyanobacteria (PTOX Cyano) were 13,436,652 cells/mL (99.1% of total cyanobacteria cell numbers). Potentially toxigenic species observed in the sample included Anabaena sp. (12,411,809 cells/mL), Woronichinia naegeliana (966,270 cells/mL; Fig. 3) and Microcystis botrys (Fig. 4). Sample 2: Slacks Reservoir Total cyanobacteria cell numbers in the Slacks Reservoir sample collected on 9/26/11 were 3,284,778 cells/mL. The most abundant species in the sample was Woronichinia naegeliana (2,022,666 cells/mL; Fig. 5). Total numbers of potentially toxigenic cyanobacteria (PTOX Cyano) were 3,110,515 cells/mL (94.7% of total cyanobacteria cell numbers). Potentially toxigenic species observed in the sample included Woronichinia naegeliana (2,022,666 cells/mL), Anabaena lemmermannii (358,382 cells/mL; Fig. 6), Microcystis aeruginosa (267,350 cells/mL; Fig. 7), Microcystis botrys (217,751 cells/mL; Fig. 8), Microcystis sp. (134,583 cells/mL; Fig. 9), Microcystis wesenbergii (76,818 cells/mL; Fig. 10), Anabaena planctonica (20,868 cells/mL; Fig. 11) and Anabaena sp. (12,097 cells/mL).
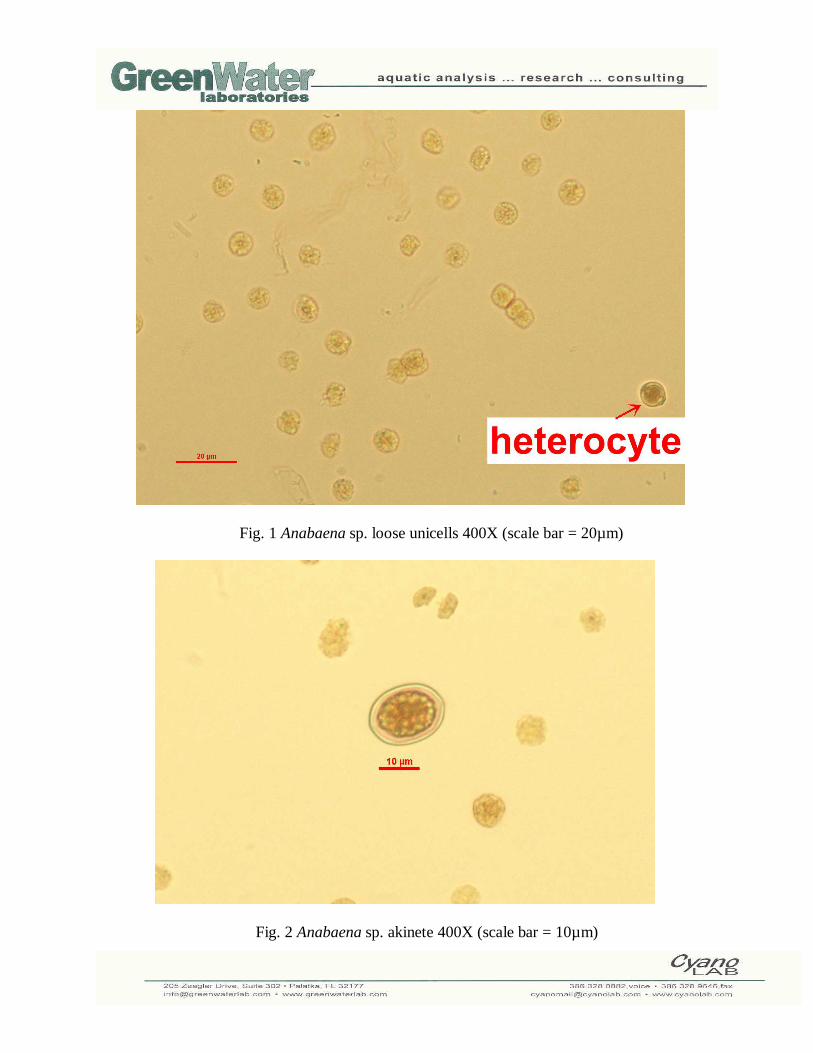
Fig. 1 Anabaena sp. loose unicells 400X (scale bar = 20µm)
Fig. 2 Anabaena sp. akinete 400X (scale bar = 10µm)
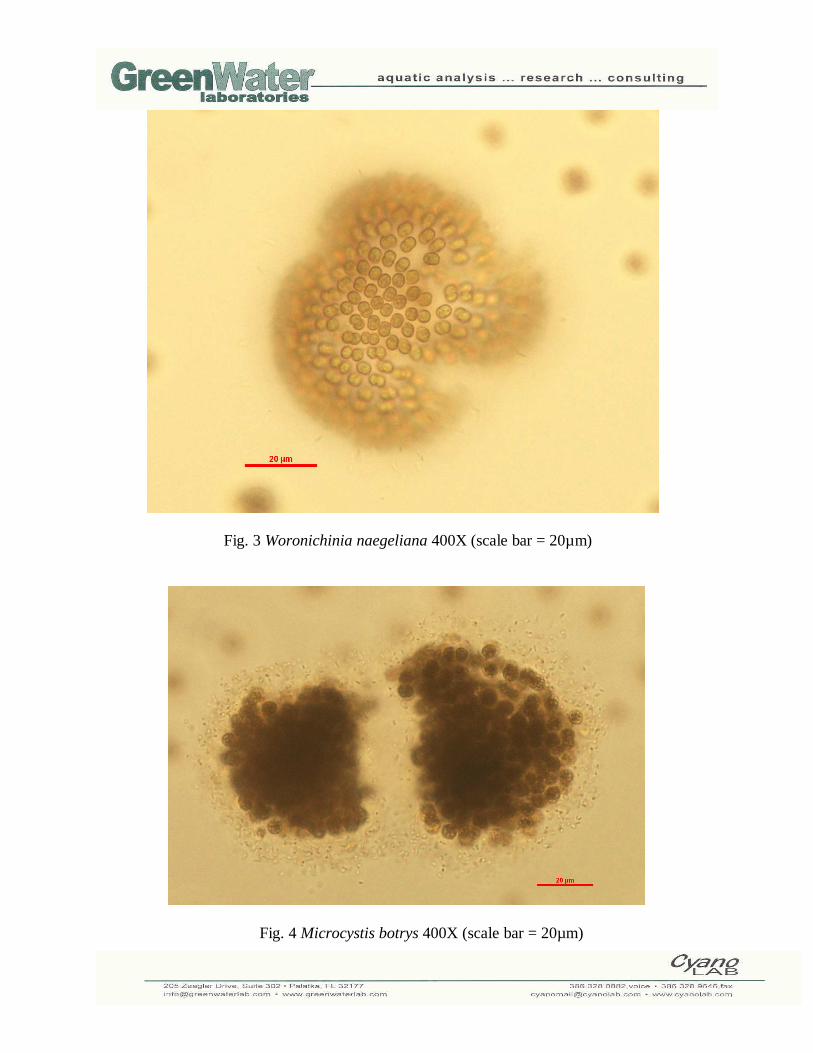
Fig. 3 Woronichinia naegeliana 400X (scale bar = 20µm)
Fig. 4 Microcystis botrys 400X (scale bar = 20µm)
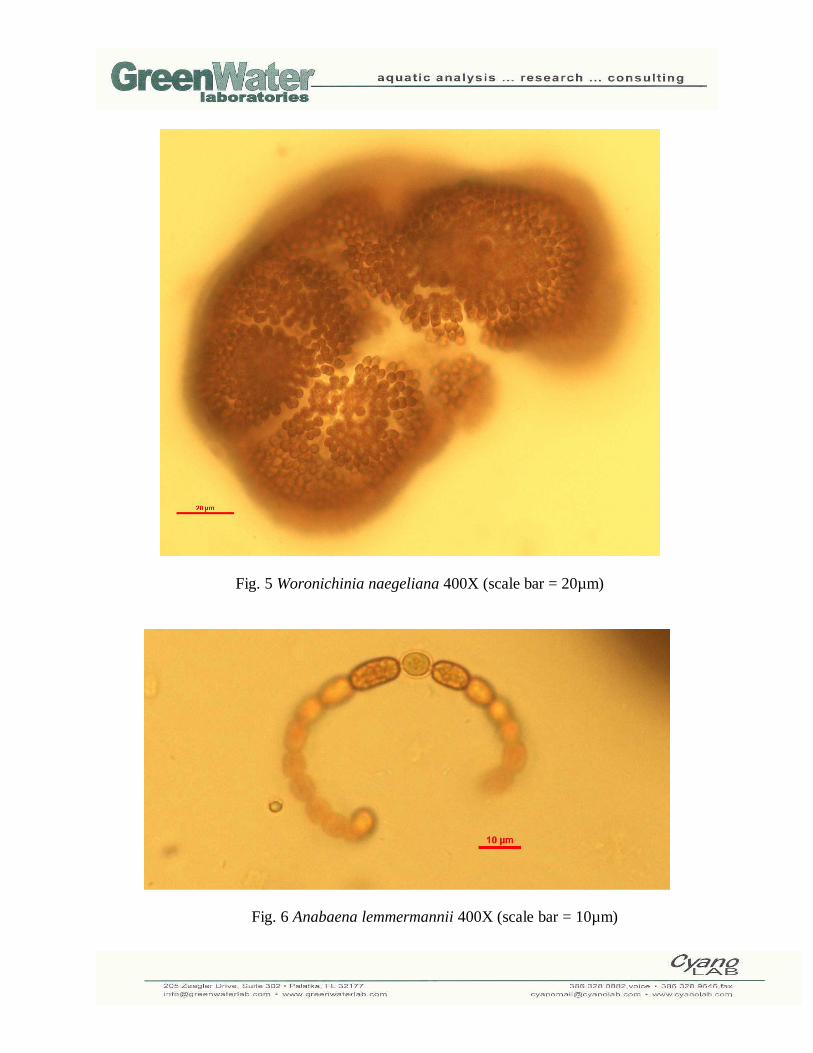
Fig. 5 Woronichinia naegeliana 400X (scale bar = 20µm)
Fig. 6 Anabaena lemmermannii 400X (scale bar = 10µm)
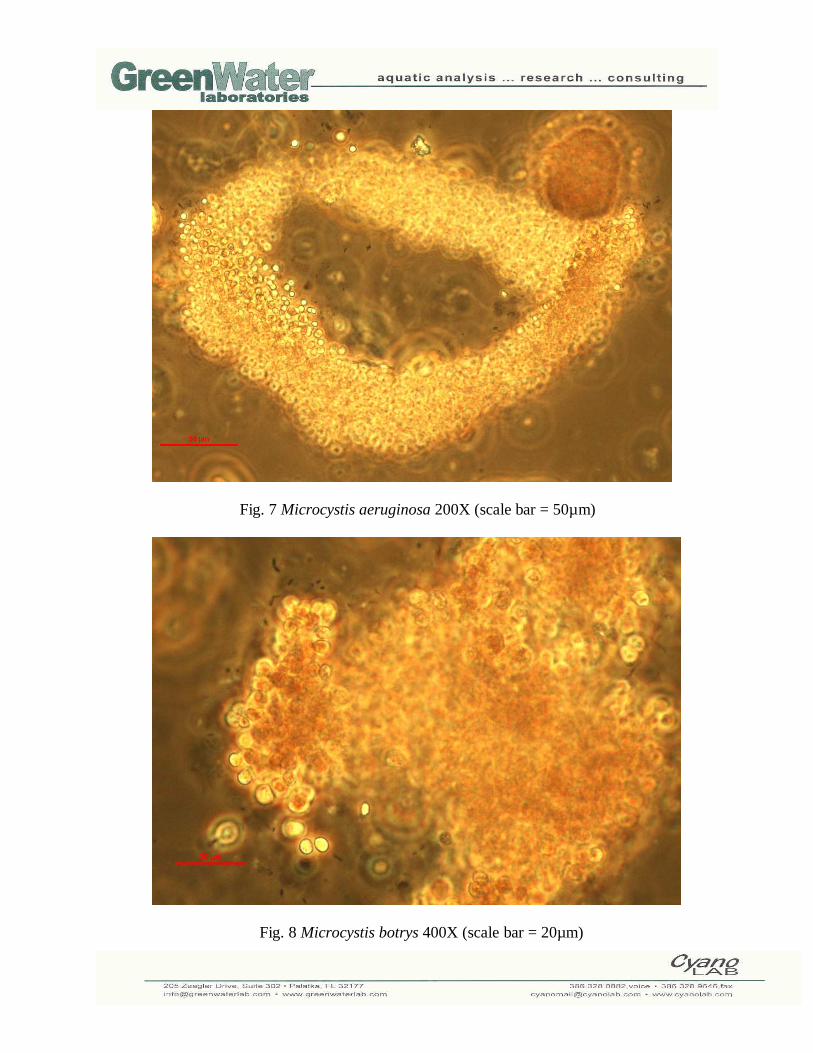
Fig. 7 Microcystis aeruginosa 200X (scale bar = 50µm)
Fig. 8 Microcystis botrys 400X (scale bar = 20µm)
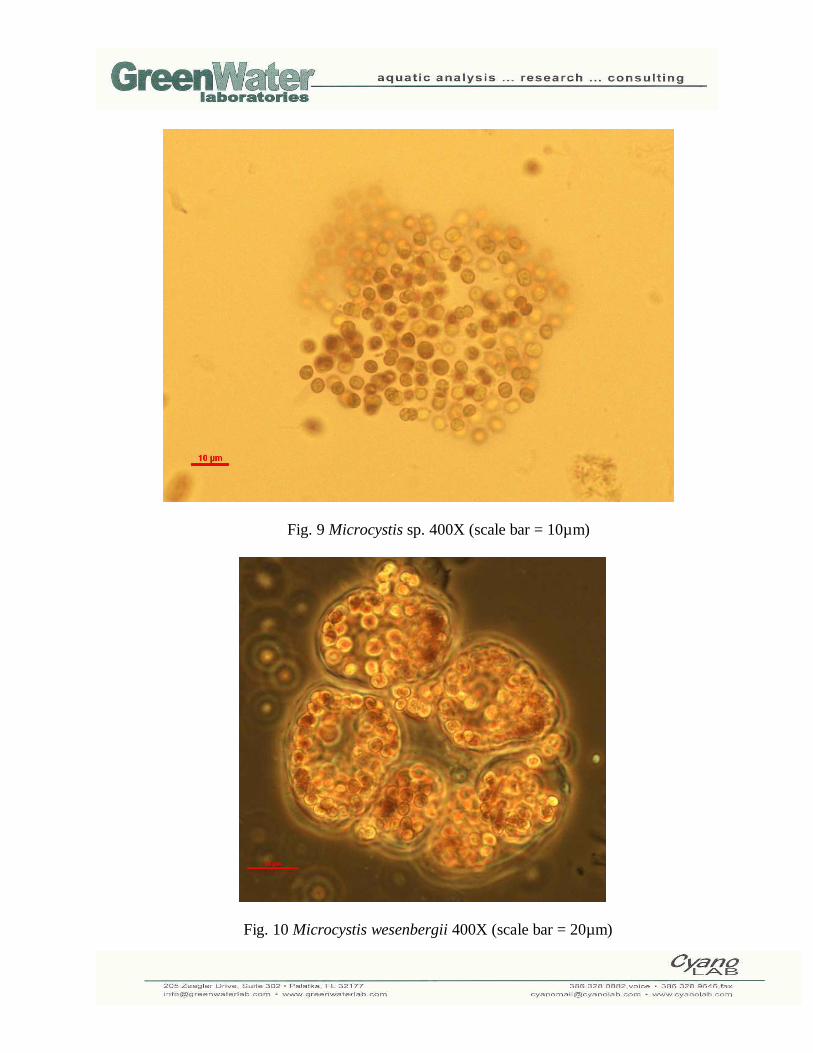
Fig. 9 Microcystis sp. 400X (scale bar = 10µm)
Fig. 10 Microcystis wesenbergii 400X (scale bar = 20µm)
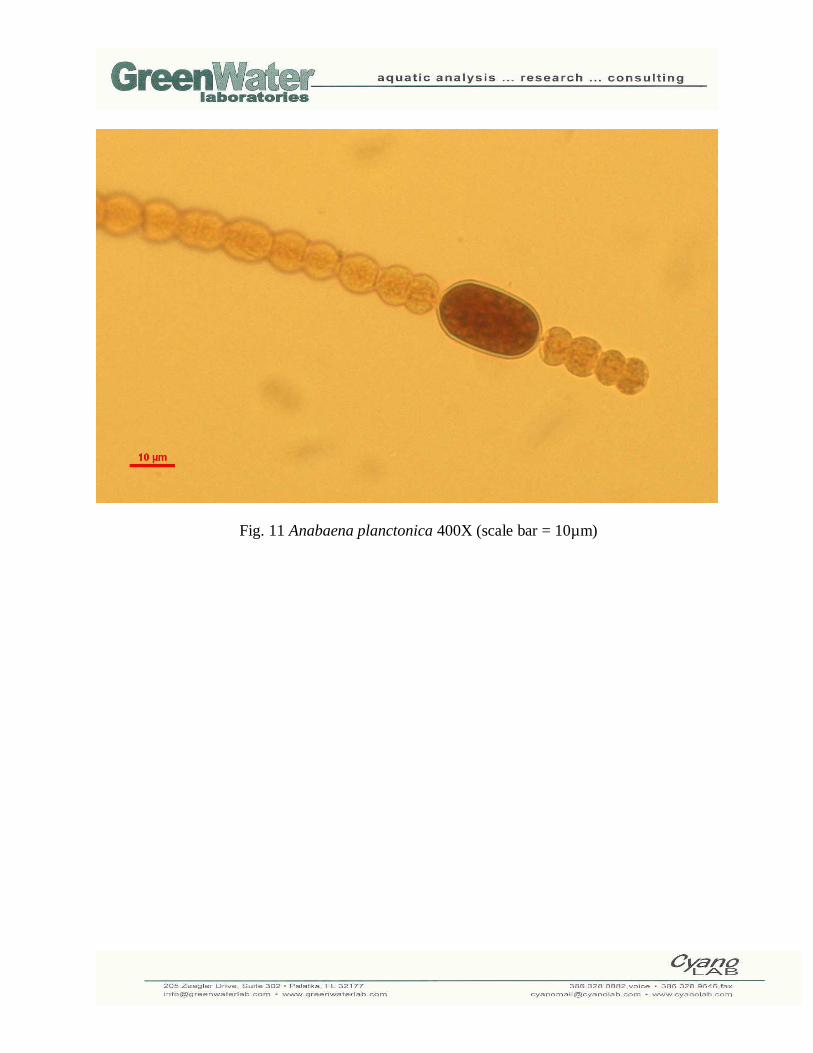
Fig. 11 Anabaena planctonica 400X (scale bar = 10µm)
www.essgroup.com
Appendix B
Microcystin Lab Reports
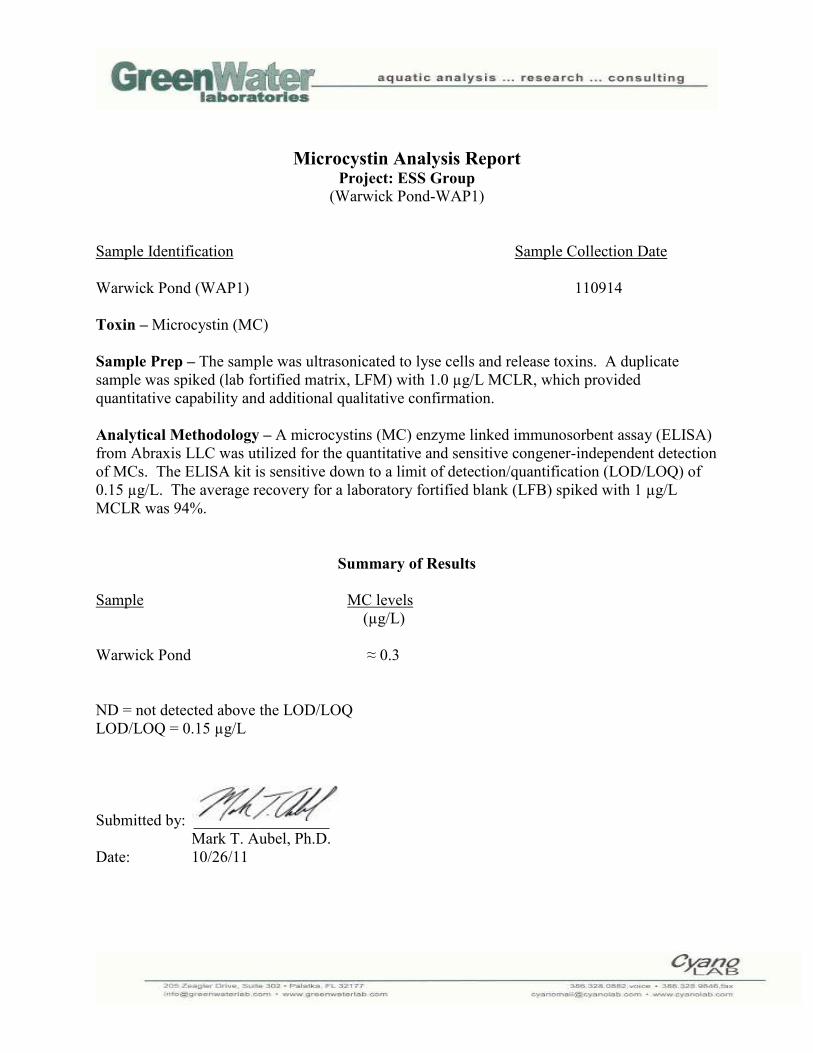
Microcystin Analysis Report Project: ESS Group
(Warwick Pond-WAP1)
Sample Identification Sample Collection Date
Warwick Pond (WAP1) 110914
Toxin – Microcystin (MC)
Sample Prep – The sample was ultrasonicated to lyse cells and release toxins. A duplicate
sample was spiked (lab fortified matrix, LFM) with 1.0 µg/L MCLR, which provided
quantitative capability and additional qualitative confirmation.
Analytical Methodology – A microcystins (MC) enzyme linked immunosorbent assay (ELISA)
from Abraxis LLC was utilized for the quantitative and sensitive congener-independent detection
of MCs. The ELISA kit is sensitive down to a limit of detection/quantification (LOD/LOQ) of
0.15 µg/L. The average recovery for a laboratory fortified blank (LFB) spiked with 1 µg/L
MCLR was 94%.
Summary of Results
Sample MC levels
(µg/L)
Warwick Pond ≈ 0.3
ND = not detected above the LOD/LOQ
LOD/LOQ = 0.15 µg/L
Submitted by: _________________
Mark T. Aubel, Ph.D.
Date: 10/26/11
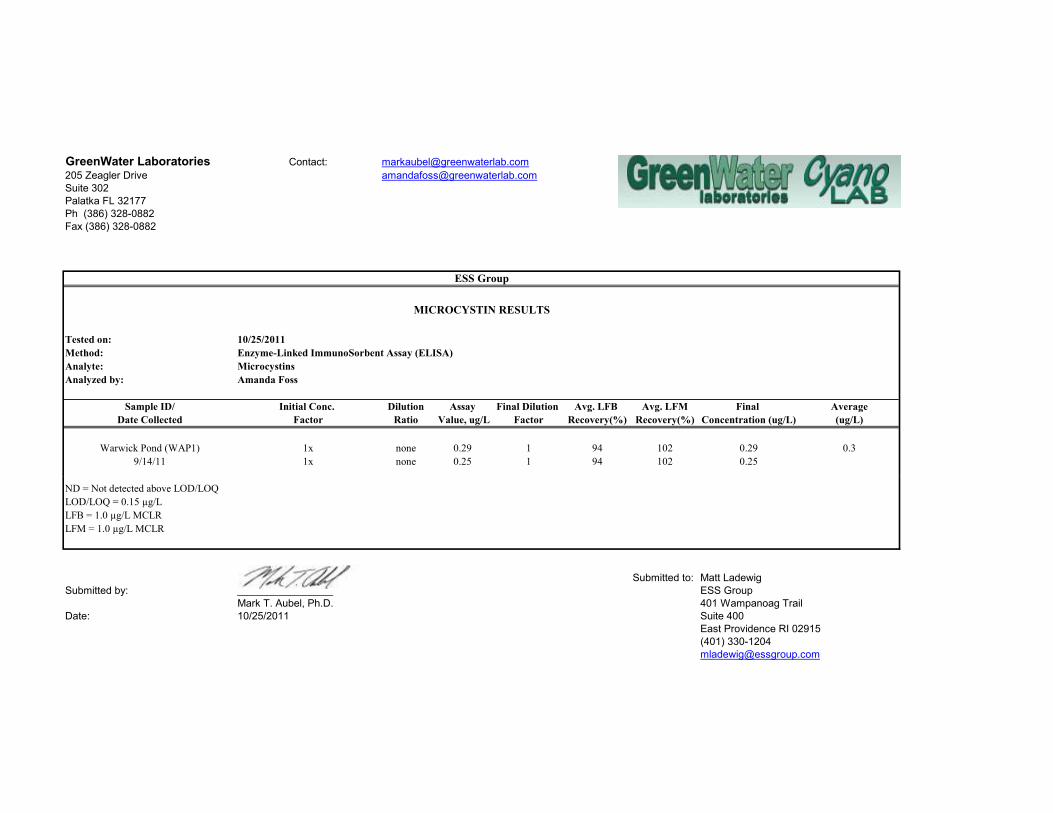
GreenWater Laboratories Contact: [email protected]
205 Zeagler Drive [email protected]
Suite 302
Palatka FL 32177
Ph (386) 328-0882
Fax (386) 328-0882
Tested on: 10/25/2011
Method: Enzyme-Linked ImmunoSorbent Assay (ELISA)
Analyte: Microcystins
Analyzed by: Amanda Foss
Sample ID/ Initial Conc. Dilution Assay Final Dilution Avg. LFB Avg. LFM Final Average
Date Collected Factor Ratio Value, ug/L Factor Recovery(%) Recovery(%) Concentration (ug/L) (ug/L)
Warwick Pond (WAP1) 1x none 0.29 1 94 102 0.29 0.3
9/14/11 1x none 0.25 1 94 102 0.25
ESS Group
MICROCYSTIN RESULTS
ND = Not detected above LOD/LOQ
LOD/LOQ = 0.15 µg/L
LFB = 1.0 µg/L MCLR
LFM = 1.0 µg/L MCLR
Submitted to: Matt Ladewig
Submitted by: ____________________ ESS Group
Mark T. Aubel, Ph.D. 401 Wampanoag Trail
Date: 10/25/2011 Suite 400
East Providence RI 02915
(401) 330-1204
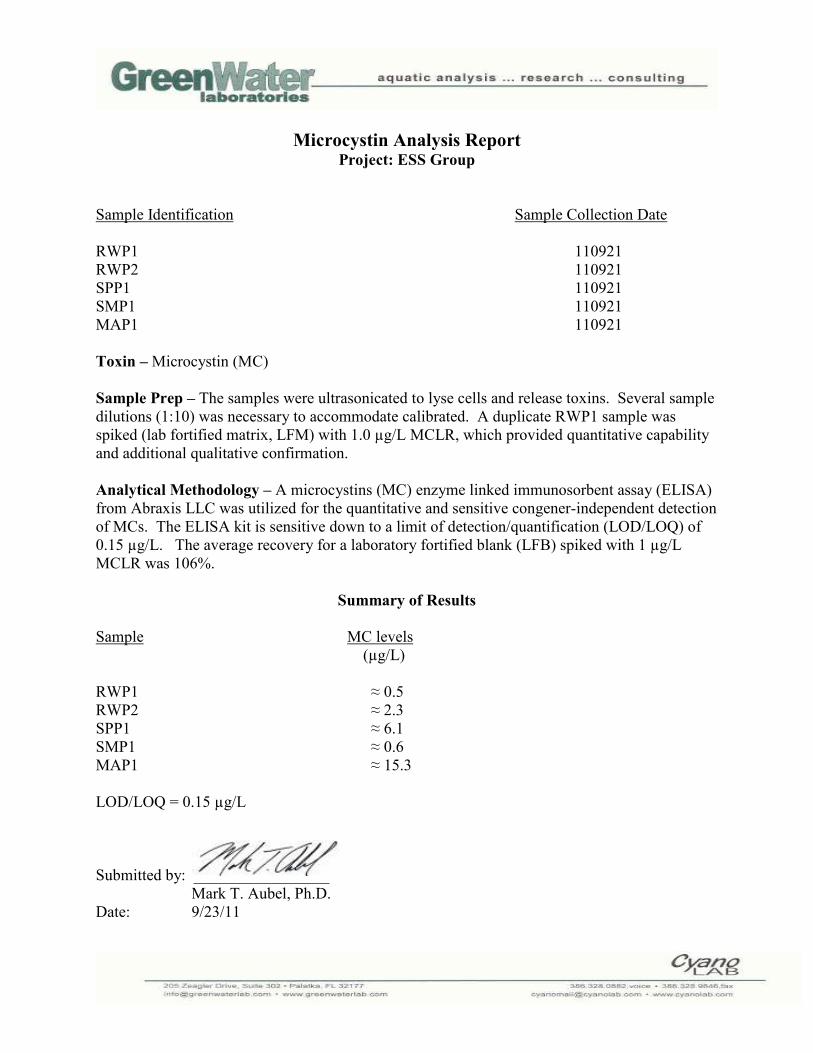
Microcystin Analysis Report Project: ESS Group
Sample Identification Sample Collection Date
RWP1 110921
RWP2 110921
SPP1 110921
SMP1 110921
MAP1 110921
Toxin – Microcystin (MC)
Sample Prep – The samples were ultrasonicated to lyse cells and release toxins. Several sample
dilutions (1:10) was necessary to accommodate calibrated. A duplicate RWP1 sample was
spiked (lab fortified matrix, LFM) with 1.0 µg/L MCLR, which provided quantitative capability
and additional qualitative confirmation.
Analytical Methodology – A microcystins (MC) enzyme linked immunosorbent assay (ELISA)
from Abraxis LLC was utilized for the quantitative and sensitive congener-independent detection
of MCs. The ELISA kit is sensitive down to a limit of detection/quantification (LOD/LOQ) of
0.15 µg/L. The average recovery for a laboratory fortified blank (LFB) spiked with 1 µg/L
MCLR was 106%.
Summary of Results
Sample MC levels
(µg/L)
RWP1 ≈ 0.5
RWP2 ≈ 2.3
SPP1 ≈ 6.1
SMP1 ≈ 0.6
MAP1 ≈ 15.3
LOD/LOQ = 0.15 µg/L
Submitted by: _________________
Mark T. Aubel, Ph.D.
Date: 9/23/11
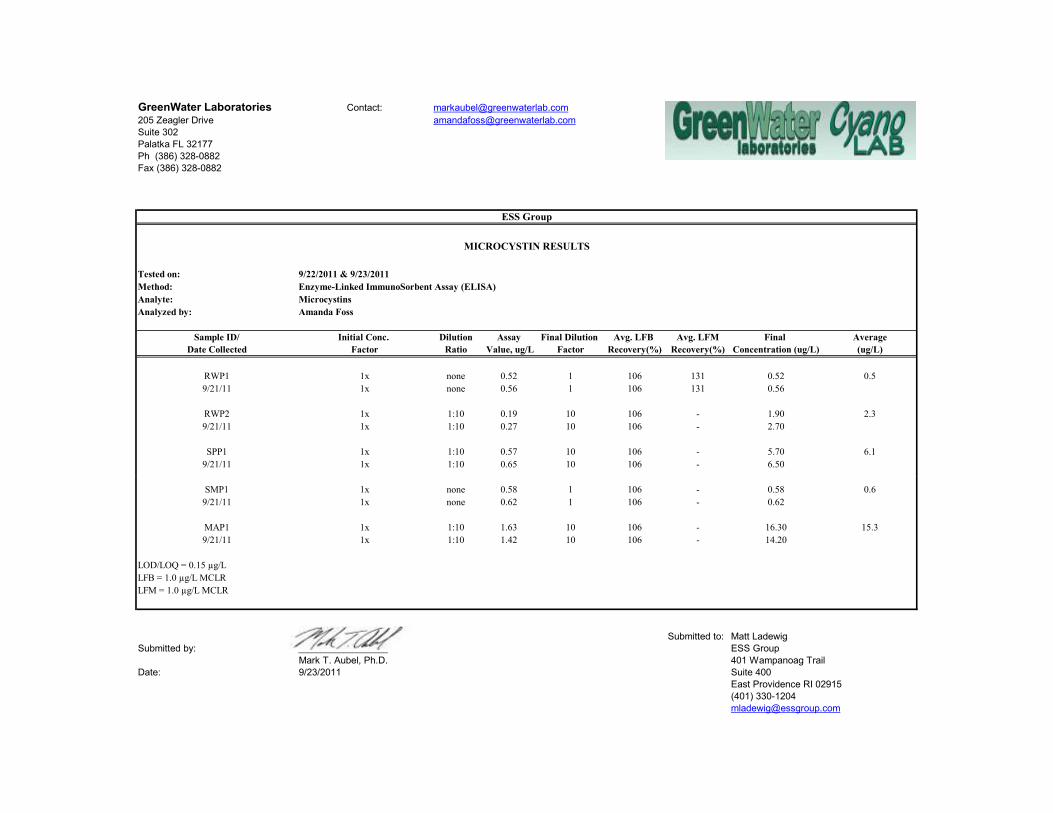
GreenWater Laboratories Contact: [email protected]
205 Zeagler Drive [email protected]
Suite 302
Palatka FL 32177
Ph (386) 328-0882
Fax (386) 328-0882
Tested on: 9/22/2011 & 9/23/2011
Method: Enzyme-Linked ImmunoSorbent Assay (ELISA)
Analyte: Microcystins
Analyzed by: Amanda Foss
Sample ID/ Initial Conc. Dilution Assay Final Dilution Avg. LFB Avg. LFM Final Average
Date Collected Factor Ratio Value, ug/L Factor Recovery(%) Recovery(%) Concentration (ug/L) (ug/L)
RWP1 1x none 0.52 1 106 131 0.52 0.5
9/21/11 1x none 0.56 1 106 131 0.56
RWP2 1x 1:10 0.19 10 106 - 1.90 2.3
9/21/11 1x 1:10 0.27 10 106 - 2.70
SPP1 1x 1:10 0.57 10 106 - 5.70 6.1
9/21/11 1x 1:10 0.65 10 106 - 6.50
ESS Group
MICROCYSTIN RESULTS
SMP1 1x none 0.58 1 106 - 0.58 0.6
9/21/11 1x none 0.62 1 106 - 0.62
MAP1 1x 1:10 1.63 10 106 - 16.30 15.3
9/21/11 1x 1:10 1.42 10 106 - 14.20
LOD/LOQ = 0.15 µg/L
LFB = 1.0 µg/L MCLR
LFM = 1.0 µg/L MCLR
Submitted to: Matt Ladewig
Submitted by: ____________________ ESS Group
Mark T. Aubel, Ph.D. 401 Wampanoag Trail
Date: 9/23/2011 Suite 400
East Providence RI 02915
(401) 330-1204
GreenWater Laboratories Contact: [email protected]
205 Zeagler Drive [email protected]
Suite 302
Palatka FL 32177
Ph (386) 328-0882
Fax (386) 328-0882
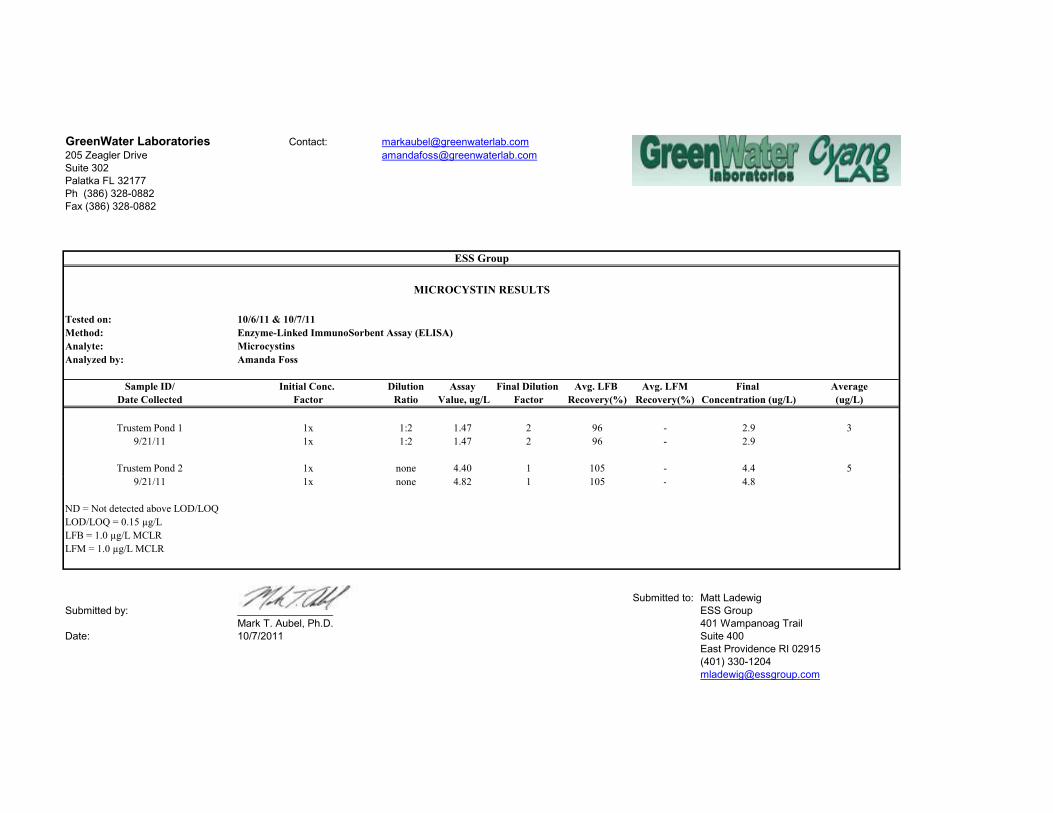
Tested on: 10/6/11 & 10/7/11
Method: Enzyme-Linked ImmunoSorbent Assay (ELISA)
Analyte: Microcystins
Analyzed by: Amanda Foss
Sample ID/ Initial Conc. Dilution Assay Final Dilution Avg. LFB Avg. LFM Final Average
Date Collected Factor Ratio Value, ug/L Factor Recovery(%) Recovery(%) Concentration (ug/L) (ug/L)
Trustem Pond 1 1x 1:2 1.47 2 96 - 2.9 3
9/21/11 1x 1:2 1.47 2 96 - 2.9
Trustem Pond 2 1x none 4.40 1 105 - 4.4 5
9/21/11 1x none 4.82 1 105 - 4.8
ESS Group
MICROCYSTIN RESULTS
9/21/11 1x none 4.82 1 105 - 4.8
ND = Not detected above LOD/LOQ
LOD/LOQ = 0.15 µg/L
LFB = 1.0 µg/L MCLR
LFM = 1.0 µg/L MCLR
Submitted to: Matt Ladewig
Submitted by: ____________________ ESS Group
Mark T. Aubel, Ph.D. 401 Wampanoag Trail
Date: 10/7/2011 Suite 400
East Providence RI 02915
(401) 330-1204
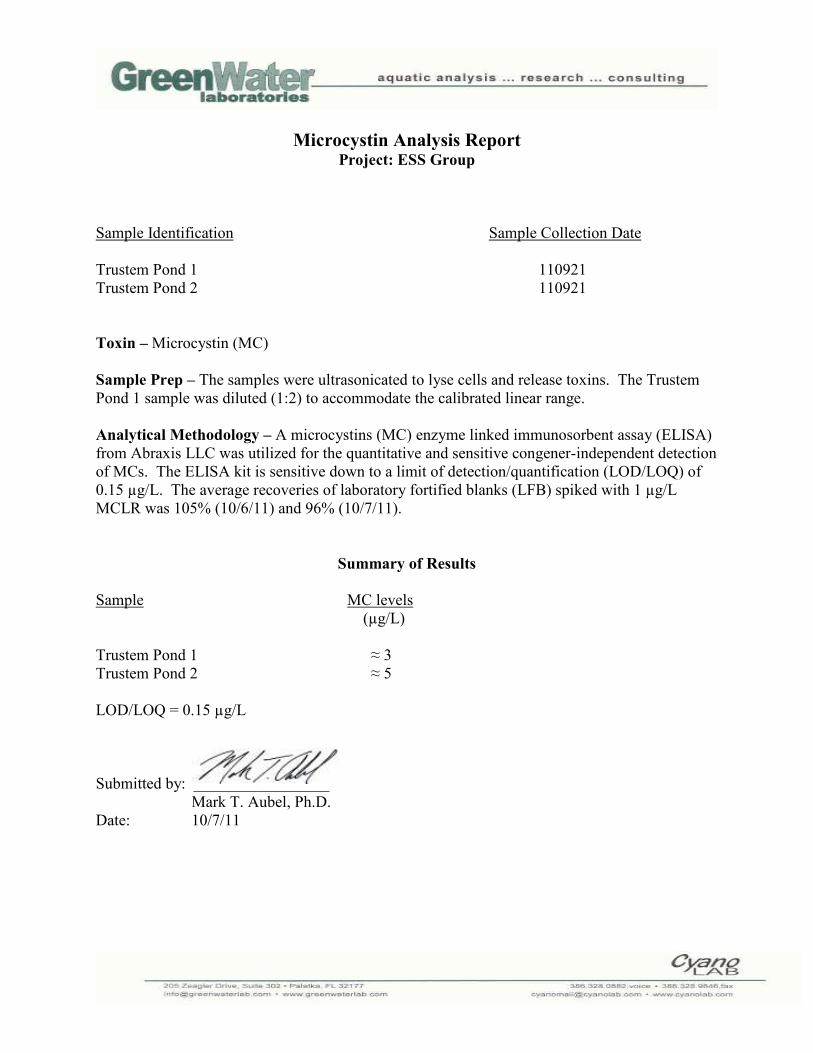
Microcystin Analysis Report Project: ESS Group
Sample Identification Sample Collection Date
Trustem Pond 1 110921
Trustem Pond 2 110921
Toxin – Microcystin (MC)
Sample Prep – The samples were ultrasonicated to lyse cells and release toxins. The Trustem
Pond 1 sample was diluted (1:2) to accommodate the calibrated linear range.
Analytical Methodology – A microcystins (MC) enzyme linked immunosorbent assay (ELISA)
from Abraxis LLC was utilized for the quantitative and sensitive congener-independent detection
of MCs. The ELISA kit is sensitive down to a limit of detection/quantification (LOD/LOQ) of
0.15 µg/L. The average recoveries of laboratory fortified blanks (LFB) spiked with 1 µg/L
MCLR was 105% (10/6/11) and 96% (10/7/11).
Summary of Results
Sample MC levels
(µg/L)
Trustem Pond 1 ≈ 3
Trustem Pond 2 ≈ 5
LOD/LOQ = 0.15 µg/L
Submitted by: _________________
Mark T. Aubel, Ph.D.
Date: 10/7/11
GreenWater Laboratories Contact: [email protected]
205 Zeagler Drive [email protected]
Suite 302
Palatka FL 32177
Ph (386) 328-0882
Fax (386) 328-0882
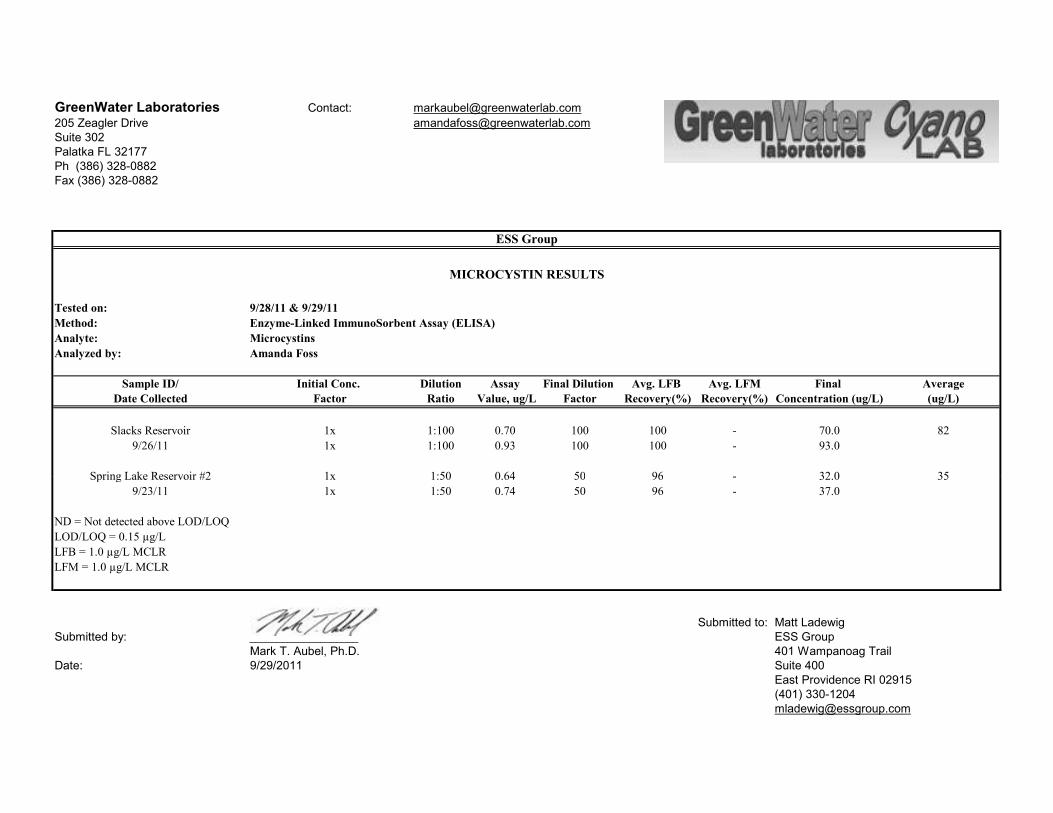
Tested on: 9/28/11 & 9/29/11
Method: Enzyme-Linked ImmunoSorbent Assay (ELISA)
Analyte: Microcystins
Analyzed by: Amanda Foss
Sample ID/ Initial Conc. Dilution Assay Final Dilution Avg. LFB Avg. LFM Final Average
Date Collected Factor Ratio Value, ug/L Factor Recovery(%) Recovery(%) Concentration (ug/L) (ug/L)
Slacks Reservoir 1x 1:100 0.70 100 100 - 70.0 82
9/26/11 1x 1:100 0.93 100 100 - 93.0
Spring Lake Reservoir #2 1x 1:50 0.64 50 96 - 32.0 35
ESS Group
MICROCYSTIN RESULTS
Spring Lake Reservoir #2 1x 1:50 0.64 50 96 - 32.0 35
9/23/11 1x 1:50 0.74 50 96 - 37.0
ND = Not detected above LOD/LOQ
LOD/LOQ = 0.15 µg/L
LFB = 1.0 µg/L MCLR
LFM = 1.0 µg/L MCLR
Submitted to: Matt Ladewig
Submitted by: ____________________ ESS Group
Mark T. Aubel, Ph.D. 401 Wampanoag Trail
Date: 9/29/2011 Suite 400
East Providence RI 02915
(401) 330-1204
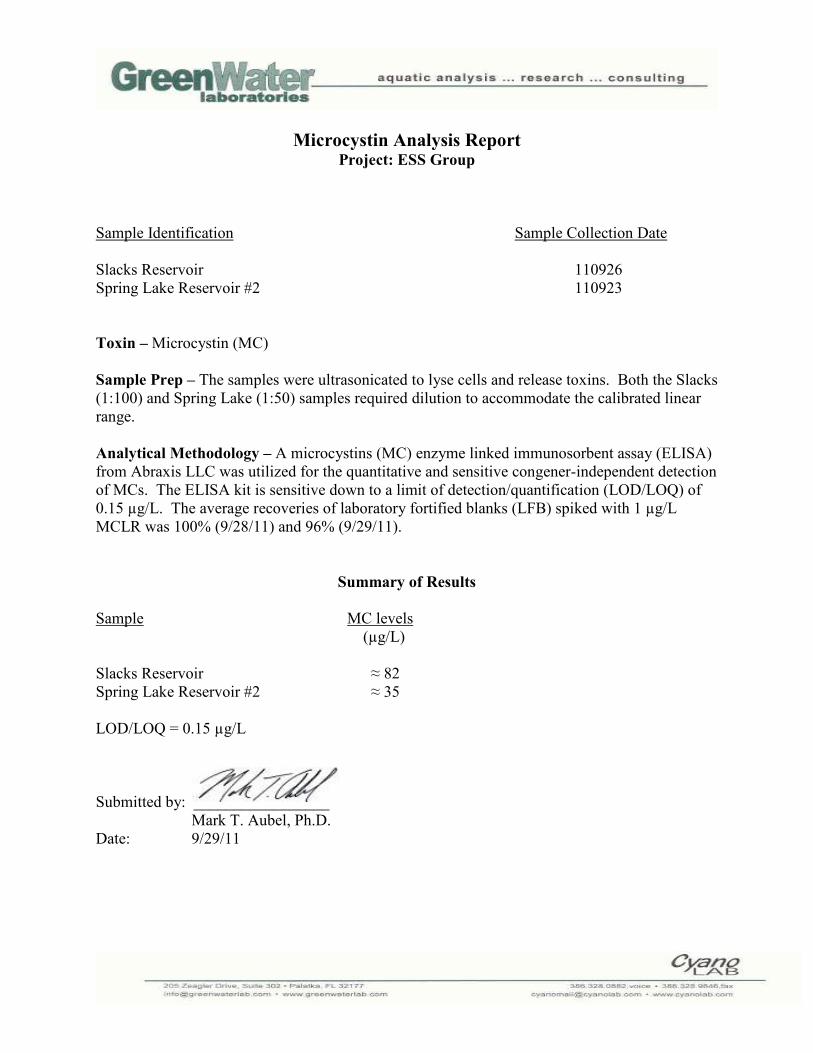
Microcystin Analysis Report Project: ESS Group
Sample Identification Sample Collection Date
Slacks Reservoir 110926
Spring Lake Reservoir #2 110923
Toxin – Microcystin (MC)
Sample Prep – The samples were ultrasonicated to lyse cells and release toxins. Both the Slacks
(1:100) and Spring Lake (1:50) samples required dilution to accommodate the calibrated linear
range.
Analytical Methodology – A microcystins (MC) enzyme linked immunosorbent assay (ELISA)
from Abraxis LLC was utilized for the quantitative and sensitive congener-independent detection
of MCs. The ELISA kit is sensitive down to a limit of detection/quantification (LOD/LOQ) of
0.15 µg/L. The average recoveries of laboratory fortified blanks (LFB) spiked with 1 µg/L
MCLR was 100% (9/28/11) and 96% (9/29/11).
Summary of Results
Sample MC levels
(µg/L)
Slacks Reservoir ≈ 82
Spring Lake Reservoir #2 ≈ 35
LOD/LOQ = 0.15 µg/L
Submitted by: _________________
Mark T. Aubel, Ph.D.
Date: 9/29/11