cyber incident-response smart grid tool
TRANSCRIPT

1
CM3203 – One Semester Individual Project – 40 Credits
Final Report
Cyber-Incident Response Tool for Smart Grid
Author: Jorge Correa Merlino
Supervisor: Neetesh Saxena Moderator: Angelika Kimmig
BSc Computer Science with Security and Forensics
School of Informatics

2
Acknowledgements
I would like to express my gratitude to all the people that made the
project presented today possible.
Firstly, I would like to thank my supervisor Neetesh Saxena for all of his
support in this project, especially in these challenging times.
I would also like to thank my family, that have supported me throughout
the degree, encouraging to pursue the subject I love.
Lastly, I would like to thank my Computer Science High School teacher
Iván López, for inspiring me and making me passionate about computing.

3
Table of Contents
1. INTRODUCTION ...................................................................................................... 6
1.1 Motivation ....................................................................................................... 6
1.2 The Scope and Context ..................................................................................... 6
1.2.1 The Scope ......................................................................................................... 7
1.2.2 Context of the Problem .................................................................................... 7
1.3 Problem Statement .......................................................................................... 8
1.4 The Aim and Objectives .................................................................................... 8
1.4.1 The Aim ............................................................................................................ 8
1.4.2 Objectives ......................................................................................................... 8
1.5 Assumptions ..................................................................................................... 9
2. BACKGROUND ..................................................................................................... 10
2.1 Overview ........................................................................................................ 10
2.2 Terms ............................................................................................................. 10
2.2.1 DNS (Domain Name System) .......................................................................... 10
2.2.2 NTP (Network Time Protocol) ........................................................................ 10
2.2.3 SNMP (Simple Network Manager Protocol)................................................... 10
2.2.4 Botnet ............................................................................................................. 10
2.2.5 IP Spoofing ...................................................................................................... 10
2.2.5 DDoS (Distributed-Denial-of-Service) Attack ................................................. 11
2.2.6 DNS Amplification Attack ............................................................................... 11
2.2.7 NTP Amplification Attack ............................................................................... 11
2.2.8 SNMP Amplification Attack ............................................................................ 11
2.3 Existing Tools .................................................................................................. 12
2.4 Summary ........................................................................................................ 13
3. SPECIFICATION AND DESIGN ................................................................................ 14
3.1 Overview ........................................................................................................ 14
3.2 Project Planning ............................................................................................. 14
3.3 Methodologies Used ....................................................................................... 14
3.4 Requirements Specification and Analysis ........................................................ 15
3.4.1 Functional Requirements ............................................................................... 15
3.4.2 Non-functional Requirements ........................................................................ 16
3.5 System Design ................................................................................................ 17
3.5.1 System Model ................................................................................................. 17
3.5.2 Detailed Design .............................................................................................. 18
3.6 Summary ........................................................................................................ 20
4. SOLUTION IDEA AND IMPLEMENTATION .............................................................. 21
4.1 Overview ........................................................................................................ 21
4.2 Platforms Used ............................................................................................... 21
4.2.1 Computer Specifications ................................................................................ 21
4.2.2 Programming Language ................................................................................. 21
4.3 Overall Workflow of the Idea .......................................................................... 22
4.4 Overall Execution............................................................................................ 22
4.4.1 Data Access and Processing ........................................................................... 22

4
4.4.2 DDoS Attacks Detection Technique ............................................................... 23
4.4.3 Notifying the Indicators of Compromise and Recommended Actions .......... 25
4.4.4 Log Analysis .................................................................................................... 25
4.4.5 Progress Bar.................................................................................................... 25
4.5 Tool Snapshots ............................................................................................... 26
4.6 Discussion ....................................................................................................... 29
4.7 Summary ........................................................................................................ 29
5. RESULTS AND EVALUATION.................................................................................. 30
5.1 Overview ........................................................................................................ 30
5.2 Dataset and Pre-processing ............................................................................ 30
5.3 NTP Attack Evaluation .................................................................................... 31
5.4 DNS Attack Evaluation .................................................................................... 32
5.5 SNMP Attack Evaluation ................................................................................. 34
5.6 Key Highlights ................................................................................................. 35
5.7 Evaluation ...................................................................................................... 35
5.7.1 Self Evaluation ................................................................................................ 36
5.7.2 Expert Evaluation ........................................................................................... 36
5.8 Summary ........................................................................................................ 36
6. FUTURE WORK ..................................................................................................... 37
6.1 Live Data Stream ............................................................................................ 37
6.2 More Variety of DDoS Attacks ........................................................................ 37
6.3 Better Detection Methods .............................................................................. 37
7. CONCLUSIONS ...................................................................................................... 38
7.1 Motivation and Problem ................................................................................. 38
7.2 The Idea and Tool ........................................................................................... 38
7.3 The Results ..................................................................................................... 38
8. REFLECTION ON LEARNING .................................................................................. 39
TABLE OF ABBREVIATIONS ....................................................................................... 40
APPENDICES ............................................................................................................ 41
REFERENCES ............................................................................................................ 44

5
List of Tables
Table 1. Operational Technology tools and their strengths and weaknesses ............... 12
Table 2. DDoS Detection Methods with strengths and weaknesses ............................. 13
List of Figures
Figure 1. System Model of the Tool ............................................................................... 17
Figure 2. Class Diagram of the Tool's Code .................................................................... 18
Figure 3. Use Case Diagram of Tool ................................................................................ 18
Figure 4. Sequence Diagram of Tool .............................................................................. 19
Figure 5. UML Activity Diagram of Tool.......................................................................... 19
Figure 6. Structure of Tool .............................................................................................. 22
Figure 7. Initial GUI State ................................................................................................ 26
Figure 8. Selecting Data to Enter .................................................................................... 26
Figure 9. Analysing File ................................................................................................... 27
Figure 10. Display of Recommended Actions, Indicators of Compromise and Logs...... 27
Figure 11. Selecting Folder for Storing Logs ................................................................... 28
Figure 12. Generation of Logs ........................................................................................ 28
Figure 13. View after Logs are Created .......................................................................... 29
Figure 14. Graph Displaying Number of NTP Suspicious Packets Sent .......................... 31
Figure 15. Graph Displaying Total Inbound Packets Sent by IP Address ........................ 31
Figure 16. Pie Chart Displaying Nº of Inbound Packets of Size 440 by Port .................. 32
Figure 17. Graph Displaying Number of DNS Suspicious Packets Sent .......................... 32
Figure 18. Graph Displaying Total Inbound Packets Sent by IP Address ........................ 33
Figure 19. Pie Chart Displaying Nº of Inbound Packets of Large Size by Port ................ 33
Figure 20. Graph Displaying Number of SNMP Suspicious Packets Sent ....................... 34
Figure 21. Bar Chart Displaying Total Inbound Packets Sent by IP Address .................. 34
Figure 22. Pie Chart of Nº of Inbound Packets of Large Size by Port ............................. 35

6
1. Introduction
With the increasingly digitalization of the world, it is important that we have measures
to ensure it remains safe and secure. Traditionally, when the law was broken, it
happeミed iミ the ph┞siIal ┘oヴld. Theミ it ┘as the poliIe’s joH to stop the Iヴiマe oヴ to investigate the evidence left behind by the perpetrator at the scene. With analysis we
deteヴマiミe ┘heヴe a Ilue Iaマe fヴoマ, disIo┗eヴ the Iヴiマiミal’s identity, or learn how the
crime took place. However, many crimes nowadays happen on the internet. In fact, in
August of 2016, Cybersecurity Ventures (Morgan 2016) predicted that cybercrime will
cost the world $6 trillion annually by 2021, up from $3 trillion in 2015.
In the same way some shops now have guards in order to deter crime as well as
responding should anyone try to commit a crime, companies have a group of people
called first responders. The first responders have the job of acting when a security
breach is detected and minimise the damage until authorities are notified. The amount
of data captured related to the incident will become vital evidence for the ensuing
police investigation. But, in order for all this to happen, the company must first detect
that a breach has happened.
1.1 Motivation
Smart grids are also vulnerable to cyber-crime and cyberattacks on these can have
disastrous implications. For example, in an energy generating plant in a smart grid, the
generators and the control room communicate automatically to receive data such as
status of generators, amount of energy produced and where to send it. If an attack
impairs this means of communication, the control room will not be able to see if a
generator is in critical state or not leading to a power blackout in the area. The
cascading effects of this can have serious repercussions as critical services like
hospitals could be at risk without power.
Since DDoS (Distributed Denial of Service) attacks are one of the most difficult to
prevent (Melnick 2018), we decided to focus on these types of attacks for our tool.
1.2 The Scope and Context
To understand why this work is relevant we need to explore the context surrounding
the issues of smart grids and cyberattacks. This provides a better understanding of the
problems that are being faced. However, due to the broadness of the subject, a scope
has to be defined to set limits for the extent of this project. A scope too broad could
make this work too challenging to finish.

7
1.2.1 The Scope
DDoS cause something we call Denial of Service which is when a server is overloaded
with requests and stops working. An in-depth explanation is provided in the
background section, but essentially these attacks are one on the easiest to perform,
therefore their popularity. Imagine a train system in a smart grid, where the trains
automatically communicate with stations to inform of estimated time of arrival and
the platform they have to stop in. If the server handling that communication stops
working, the train could be forced to wait outside the station which would cause
delays in transport. If a traveller is travelling with intermediate stops, this means they
could miss their next connection.
For this work we are considering scenarios where DDoS attacks can be targeted on
smart grid infrastructure. More specifically, the project will focus on three types of
DDoS attacks – DNS amplification, NTP amplification and SNMP attacks.
1.2.2 Context of the Problem
Not so long ago, cybersecurity was related only to big corporations. Since they had big
amounts of sensitive and valuable information, they became the targets for the first
big breaches by hackers. Back in 2012 this was the case for Yahoo, three billion
accounts were exposed by this hack and it resulted in a 117.5 million settlement for
the affected parties (Matthews 2019). But nowadays we are seeing a rise in cybercrime
and all the big data breaches from renowned companies are not accountable for all of
that rise. Ransomware is a type of attack that is getting more popular. During this
attaIk, aミ iミdi┗idual’s aIIess to theiヴ data is ヴestヴiIted H┞ the haIkeヴ, deマaミdiミg a ransom to be paid to get the data back. Cybersecurity Ventures predicts that a
business will fall victim to a ransomware attack every 11 seconds by 2021 (Morgan
2019).
Ransomware requires more technical knowledge to implement at a larger scale than
other attacks, but the higher technical complexity does not mean that easier to
implement attacks are weaker. Automating simple attacks has given birth to category
of hackers Ialled さsIヴipt kiddiesざ, aミd these haIkeヴs ha┗e little kミo┘ledge of ┘hat the program is actually doing but are still causing a lot of damage to the victim. DDoS
attacks are quite common due to the simplicity and effectivity of them.
These attacks can be especially devastating in a smart grid network. The major
problem with DDoS detection is that it is difficult to distinguish between legitimate and
DDoS traffic. For example, a smart grid could regulate which areas of a city require
more energy than other based on consumption, therefore distributing energy
accordingly. However, if legitimate data is discarded when detecting DDoS attacks then
energy might be wasted as the smart grid will not be able to communicate with the
city areas, and this can be very costly.

8
1.3 Problem Statement
Smart grids used to have the protection of airtight gaps, which means that since they
were isolated form the network, they did not have risks of being cyber attacked.
However, with the implementation of Internet of Things devices into the smart grid
system, vulnerabilities in these devices can disrupt the normal operation of the grid.
DDoS reflective attacks are becoming more dangerous due to the rise on internet
connectivity speeds.
There are tools out there that provide operational technology cyber security, however
since reflective attacks are starting to regain popularity now, most tools do not provide
appropriate protection against these attacks.
Therefore, we have identified that the problem is the lack of protection options against
DDoS reflective attacks in the smart grid environment. Cybersecurity is a relatively new
area of computing so there are not that many easily accessible resources for it.
So, our problem statement is to close the gap between the user’s knowledge and the
skills required for operating the tool and, to provide DDoS protection.
1.4 The Aim and Objectives
In order to have a clear sight of what we want to accomplish, we set an aim and a set
of objectives to be completed by the end of this work.
1.4.1 The Aim
Large-sized businesses will typically have a specialised team with professional
formation to deal with these incidents, but many medium-sized and most small
businesses will likely not have the funding required to have a team of their own. This
gives rise to incident response tools, the only downside being that most tools require
of technical knowledge in order to use. Therefore, the aim of the project is to create an
easy to use tool to aid in DDoS incident response with as little technical knowledge as
possible.
1.4.2 Objectives
This work will aim to complete the following objectives:
• Provide the user with information to understand the attacks and indicators of
compromise.
• Analyse data from the data set to predict and understand the behaviour of
DDoS attacks.
• Develop a tool for demonstrating log analysis, indicators of compromise events
and actions, and suggesting countermeasures.

9
Attackers are not so considerate as to attack with one type of attack at a time,
therefore we want the tool to be able to detect various types of attacks at the same
time.
The tool is all about making the user understand what is happening in their network
when it is being disrupted, so the tool should be able to give some feedback to the
user as well as recommendations to mitigate the impact of these attacks in the future.
At the end of the analysis of the data, the user might want to run analytics or statistics
on the data that shows the compromised state of the network, hence why the tool
should give logs to the user for further investigation.
1.5 Assumptions
The business or individuals that use this tool will have some familiarity with capturing
network traffic. At the moment the tool only accepts input as csv files, therefore the
network capture would need to be exported into a csv format.

10
2. Background
2.1 Overview
In this section, the terms and context needed to understand the project will be
explained, including constraints used in order to simplify the scope of it.
2.2 Terms
2.2.1 DNS (Domain Name System)
The DNS protocol allows the conversion of domain names (e.g. example.com) into IP
addresses. It works as a phonebook, the same way we register a telephone under a
name, the DNS protocol registers IP addresses under domain names (Brain et al. 2000).
This is easier to remember since it is closer to human language. DNS servers are set up
that can be accessed in order to search for the IP address of a domain name. Traffic
related to DNS usually travels through port 53.
2.2.2 NTP (Network Time Protocol)
The NTP protocol is used to synchronize the same time (often called the true time) of
many different computers and systems (Network Time Foundation [no date]). If a
program is running concurrently in different computers, then a desirable feature
would be that the time is the same in all computers, as having the program hopping
forwards and backwards in time can lead to issues. In a database system it could lead
to inconsistent data. Traffic related to NTP usually travels through port 123.
2.2.3 SNMP (Simple Network Manager Protocol)
The SNMP protocol allows devices to communicate within a same network irrespective
of the hardware and software each of them has (Oros 2016). For example, this allows
computers to communicate to a networked printer and send printing requests
remotely. The traffic related to SNMP normally travels through port 161.
2.2.4 Botnet
The word comes from the mix between robot and network, a botnet is a network of
bots where bots are infected computers that due to the malware are now being
controlled by the attacker (Cloudfare [no date]a).
2.2.5 IP Spoofing
IP spoofing is the act of changing the source IP address from a packet. The address is
changed to hide the identity of the attacker or to impersonate another system. The
latter is used in DDoS attacks to redirect data to the victim. To avoid this, compare the
spoofed paIket’s oヴigin, rejecting it if it is suspicious (Cloudfare [no date]b).

11
2.2.5 DDoS (Distributed-Denial-of-Service) Attack
The main idea is to send so many requests to a server that it makes the server stop
working since it cannot handle the overflow of traffic. The attacker in a DDoS attack
needs a botnet in their control to launch this attack with (Cloudfare [no date]c). This is
because just one computer is not enough to generate the number of requests needed
to collapse a server nowadays. Therefore, the attacker commands the botnet to attack
the ┗iItiマ’s seヴ┗eヴ IP addヴess so that each bot in the botnet is sending requests to the
server.
2.2.6 DNS Amplification Attack
The attacker uses a compromised computer or similar to send UDP packets with
spoofed IP addresses to a DNS resolver. The spoofed address on the packets is actually
the real IP address of the victim. Each one of the UDP packets makes a request to a
DN“ ヴesol┗eヴ, ofteミ passiミg aミ aヴguマeミt suIh as さANYざ iミ oヴdeヴ to ヴeIei┗e the laヴgest response possible. After receiving the requests, the DNS resolver, sends a large
ヴespoミse to the ┗iItiマ’s IP addヴess. The victim receives the response and the network
becomes overwhelmed with the overflow of traffic, resulting in a denial-of-service
(Cloudfare [no date]d).
2.2.7 NTP Amplification Attack
The attacker uses a botnet to send UDP packets with spoofed IP addresses to a NTP
server which has its monlist command enabled. The monlist command responds with
the last 600 source IP addresses of requests which have been made to the NTP server.
The spoofed IP address on each packet is the real IP address of the victim. Each UDP
packet makes a request to the NTP server using its monlist command, resulting in a
large response. The monlist request from a server with 600 addresses in its memory
will be 206 times larger than the initial request. The server then responds to the
spoofed address with the resulting data. The victim receives the response and the
network becomes overwhelmed with the overflow of traffic, resulting in a denial-of-
service (Cloudfare [no date]e).
2.2.8 SNMP Amplification Attack
First the attacker scans a network looking for connected devices that can be used as
amplification factors. As the attacker finds networked devices, a list is created of all the
devices that respond. The attacker creates a UDP packet with the spoofed IP address
of the targeted victim. The attacker then uses a botnet to send a spoofed packet to
each networked device with a request for as much data as possible by setting certain
flags. As a result, each device will send a reply to the targeted victim with an amount of
data up to about 600 tiマes laヴgeヴ thaミ the attaIkeヴ’s ヴeケuest (Imperva [no date]). The
target then receives a large volume of traffic from all the devices and becomes
overwhelmed, potentially resulting in denial-of-service to legitimate traffic.

12
2.3 Existing Tools
Cyber security threats in industrial environments are relatively new, but some
solutions already exist to help tackle these issues. Below are three existing tools that
provide cybersecurity and incident response which will be used to contrast my work.
Table 1. Operational Technology tools and their strengths and weaknesses
Tool Name Company/Owner Pros – idea Cons –
limitations
Impact on
a system
Next
Generation
Firewall
Forcepoint
Provides good
control over
network and help
with cyberattacks
DDoS protection
does not cover
amplification
attacks
High
Tenable.ot Tenable powered
by Indegy
Good visibility of all
incidents happening
Does not specify
if it handles
DDoS attacks
Medium
Claroty
Platform Claroty
Comprehensive tool
that covers many
security aspects
Does not specify
if it handles
DDoS attacks
Medium
The fiヴst solutioミ is FoヴIepoiミt’s Ne┝t Geミeヴatioミ Fiヴe┘all, ┘hiIh pヴo┗ides ┗isiHility of
the entire network and deals with most cyber-attacks. However, as I was researching
this tool I found that the DDoS protection only covers flood attacks, not amplification
attacks. With fast internet connections nowadays, an amplification attack could have a
big impact in the system.
TeミaHle’s TeミaHle.ot (powered by Indegy) also offers great visibility of all the devices
in the industrial environment and has a proactive approach for dealing with
vulnerabilities. Nevertheless, I could not find anywhere what sort of DDoS protection
they offered. It seems unlikely that they would not offer this type of service, but it
could provide protection against only some type of attacks. Since I do not know for
sure, I set the impact to the system to medium.
Claroty also suffers from the same issue as Tenable, even though they offer excellent
protection in almost all aspects of security (monitoring, visualization, and data
collection), they do not specify anywhere what type of DDoS protection they offer.
For this project, we decided to focus on DDoS protection, more specifically, DDoS
reflection/amplification attacks. Even though this work lacks many features the other
existing tools offer, DDoS reflection attacks are still important and are worth investing
on. With this tool our objective is to bring more attention to these types of attacks.
The detection algorithms for this tool are admittedly not the most efficient or accurate,
however that is not the objective of this research. As mentioned in the Aims section,
we want to create a tool that helps operators understand the information that comes
from DDoS attacks. Nonetheless, precise and accurate algorithms for detections are
still needed for this to be a successful tool, so I researched some detection methods
that could be implemented in the future in this tool.

13
Table 2. DDoS Detection Methods with strengths and weaknesses
Author,
Year
Research
idea for
detecting
DDoS attacks
Pros Cons Impact Gap
Thomas et
al., 2017
Monitoring
scanners
previous to
attacks to
predict and
prevent them
Research
focuses on
amplification
attack, has
very good
detection rate
– High –
Özer and
İskefi┞eli, 2017
Set average
number of
packets for
real time
detection
Many
different
types of DDoS
can be
detected
No data
on type of
DDoS
attack
Medium
Lack of
attack
identification
Maheshwari
et al., 2018
Using
MapReduce
to detect
DDoS attacks
Most DDoS
attacks are
detected and
fast detection
No data
on type of
DDoS
attack
Medium
Lack of
attack
identification
Özer and İskefi┞eli’s (2017) research is the simplest method out of the three, it reads
the packets and has a threshold value for the number of packets received from the
same address that if exceeded, flags it as a DDoS. The user is able to select what that
threshold is. However, this detection algorithm does not differentiate one type of
DDoS from another, making it harder for the prevention stage.
Maheshwari et al. (2018) identified that the problem with DDoS identification was the
speed at which the attacks were identified. This is why they chose to use MapReduce,
which allows them to break a problem is smaller parts are process simultaneously.
While this is an improvement from the detection method above, it still does not
identify the nature of the attack.
The only research from these three that detects the types of DDoS attacks is the one
conducted by Thomas et al (2017). Not only it improves detection rate by monitoring
scanners that indicate that an attack is going to happen, but by detecting the protocol
ports it also identifies different types of attacks. It detects the attacks we are working
with, so this research is a good reference for future expansion of this tool.
2.4 Summary
The attacks and terms related to this research were explained, which includes the NTP,
DNS and SNMP amplification attacks as well as their protocols. A comparison of the
existing solutions developed by Forcepoint, Tenable and Claroty with this tool
highlighted the fact these solutions lacked proper DDoS protection. Finally, a
comparison of different detection methods established that Thoマas et al’s ヴeseaヴIh provided the best detection methods.

14
3. Specification and Design
3.1 Overview
This section will cover the project planning, and what methodology was used when
developing the tool. The functional and non-functional requirements identified for this
work are also presented. Furthermore, it will explain the intended functioning of the
tool through diagrams such as system models and UML diagrams.
3.2 Project Planning
For this project we designed and initial plan and some research in the topic before
starting to implement the tool. Our objective was to finish the tool before the Easter
recess so we could focus on the report for the remaining of the time. Due to the
COVID-19 pandemic, an extra week was given for the deadline, the Gantt Chart in the
appendix shows how the time was divided for the different project tasks.
3.3 Methodologies Used
To clearly structure how to implement this project, a methodology is needed to
establish the implementation cycles. The following paragraphs explore which
methodologies were investigated and which methodology was chosen for this work’s
development.
After researching different methods for software development, for this project we
have decided to adopt an iterative approach for software development. Agile and
Kanban methodologies were also studied but ultimately, the iterative model was
deemed the most appropriate for this work.
Due to the reduced complexity of the project when compared to bigger projects
carried out by companies, the iterative model seemed as the most appropriate
methodology as it is the easiest to implement. In the iterative model, you keep
improving the product by adding and removing features in each cycle.
First the requirements for the project are collected; this was accomplished by
discussing with my supervisor what we wanted the project to be and do. Then in the
design stage, an outline of the project was drawn to structure the order for
implementation. Before implementation began, we drew a sketch of how we thought
the GUI should look like and what the different elements in it should do. Afterwards
comes implementation where the design is realised, during this stage the first draft of
prototype was coded. Afterwards, I met with my supervisor for feedback and
implemented improvements on the prototype or started on new areas. Every week we
would repeat this cycle until prototype was finished.

15
In agile development, the focus is on delivering software as quickly as possible, receive
feedback and improving on it. While this could have been an advantage if the project
involved more team members, since there was only one person working on this, there
is not enough time to produce many versions of the software. However, we did keep
an aspect of agile, the idea of making changes to the scope as problems appeared.
For Kanban development, tasks are divided into three categories: To-Do, Doing and
Done. Depending on the progress on each of the tasks they are placed in the
corresponding category. This is great to have a general view of the progress of the
project and what other team members are accomplishing and what still needs to be
done. Nonetheless, without any team members it just feels like a checklist since as
only one person is working, only one task can be done at a time.
Given that most methodologies are used to improve team synchronisation in project
development, the iterative model is an appropriate choice as it can work without
having team members. The freedom of the iterative model to implement changes in
each cycle was useful as many changes needed to be implemented week after week.
3.4 Requirements Specification and Analysis
During implementation of the tool, we need to have clear requirements to accomplish
to ensure that the main objectives of the project are completed.
3.4.1 Functional Requirements
Requirement 1: Read a network capture file
The network capture file is the only input of data the tool receives, therefore its
importance. For this work, only csv files can be entered of past incidents. The tool
should have a button that opens a file dialog file finder to select the file they want to
analyse. This file dialog should only accept the selection of csv files to avoid errors.
When the file is selected it should be loaded into the program.
Requirement 2: Analysis and detection of NTP amplification DDoS attacks
When the file entered by the user is loaded, an algorithm should search for signs of
NTP amplification attacks and flag the relevant information. Any suspicious IP
addresses should be found at this stage.
Requirement 3: Analysis and detection of DNS amplification DDoS attacks
When the file entered by the user is loaded, an algorithm should search for signs of
DNS amplification attacks and flag the relevant information. Any suspicious IP
addresses should be found at this stage.
Requirement 4: Analysis and detection of SMNP amplification DDoS attacks
When the file entered by the user is loaded, an algorithm should search for signs of
SMNP amplification attacks and flag the relevant information. Any suspicious IP
addresses should be found at this stage.

16
Requirement 5: Analysis and detection of one or more attacks
Since DDoS attacks usually happen in waves, it is not unreasonable to think that more
than one attack could be found in a capture file. The tool should be able to identify all
attacks simultaneously and inform the user about which attacks have been detected.
Requirement 6: Display indicators of compromise
During analysis, the different indicators of compromise mentioned in the background
section should be identified. The tool should then inform the user which indicators
have been detected and from which attack.
Requirement 7: Display recommended actions
Depending on the attack or attacks that have been detected, the tool should display
some recommended countermeasures to avoid being vulnerable to the attack again.
Requirement 8: Provide logs on analysed information
All records from the identified suspicious IP addresses should be extracted from the
input file and exported into another csv file. In the case where multiple attacks have
been detected, multiple files should be created dividing the information by attack.
3.4.2 Non-functional Requirements
Requirement 9: Provide feedback while running tasks
When the file is being loaded and analysed, a considerable amount might pass where
the program does not appear to be doing anything. Therefore, a progress bar could be
implemented to inform the user that the tool is working or has frozen. When preparing
the logs for download, the tool could also take a long time to finish so another
progress bar here could also be coded.
Requirement 10: GUI has only necessary elements
The emphasis of this tool is that it is as easy to use as possible, so having as few
elements on the tool as possible can help with this. Too many options can make the
user feel overwhelmed and end up restricting the user instead of giving more freedom.
Requirement 11: Easy to deploy
The tool should be easy to deploy since intricate steps for deployment only serve to
deter a potential user from using the tool. After development, the code should be
packed into an executable file since most users will be familiar with this type of files.
Requirement 12: Information displayed in orderly manner
The same way too many options can be overwhelming for a user, the same can be said
of too much information. The information displayed should be concise and ordered in
a sensible way. For the indicators of compromise, a table indicating which indicators
have been detected and for which attacks could help in simplifying the data.

17
Requirement 13: Use colour for emphasis
Colour is a powerful tool to bring attention to details and using colour conventions
that a user is used to can help making a program more intuitive. For example, for the
indicators of compromise table, the colour green could be used to highlight the
indicators if no attacks are happening, while using red to highlight indicators that have
been detected in an attack.
3.5 System Design
In this subsection, diagrams are provided to give a better understanding of how the
tool operates including, a system model, class diagram and various UML diagrams.
3.5.1 System Model
For any scenario this tool might be used in, we are considering two main actors:
operators and malicious hackers. During the normal operation of the smart grid,
industrial devices will send data through the server back to the operators. If any action
is required, the operators will send instructions to the smart grid via the server.
If the smart grid server were under attack by a DDoS attack, the DDoS tool would
detect it and give feedback to the operators. The operators would then need to act
based on this information to mitigate the attack. Figure 1 shows a system model
demonstrating this.
Figure 1. System Model of the Tool
Figure 2 demonstrates a class diagram for the coding of the tool. The main program is
ran within the Tool class, which controls how the GUI looks like and makes the
appropriate calls for analysing the data. The NTP, DNS and SNMP classes contain the
algorithms relevant for the detection of the NTP, DNS and SNMP attacks, respectively.
The variables that are updated within these classes are retrieved in the Tool class and
these updates are applied to the corresponding variables.

18
Figure 2. Class Diagram of the Tool's Code
3.5.2 Detailed Design
This tool is intended to be used only by one type of actor: the operators of the smart
grid where the tool is deployed. As shown in Figure 3, the operator can only perform
two actions; entering the data to be analysed and retrieving the logs of the data.
Figure 3. Use Case Diagram of Tool
Figure 4 demonstrates the sequence in which these actions are taken. The operator
first enters the network capture, then the tools starts processing the data. Once it is
done, it will return feedback to the user as well as the option to download the logs. If
the user then decides to download the logs, the tool will generate them. When
generation is finished the user will have access to the logs. Logs cannot be generated
without previously entering data into the tool.

19
Figure 4. Sequence Diagram of Tool
A more comprehensive explanation of how the tool operates is presented in Figure 5.
When the tool launched, the user will need to enter the network data capture that
they wish to analyse. The tool will analyse the data and detect if any attacks have
happened. If no attacks were detected, then the tool is on standby until the next data
capture is input. If attacks are detected, the tool will display the logs, indicators of
compromise and recommended actions for each of the attacks that were detected. A
download button for the logs will appear on the screen too, and if the user presses it,
they will be prompted to enter a directory where to download the logs. After the logs
are generated the user can find the logs in the directory they chose. Then the tool is on
standby until the next data capture is input.
Figure 5. UML Activity Diagram of Tool

20
3.6 Summary
The project planning was presented as a Gantt Chart that can be found in the Appendix.
The Gantt Chart also considered the extra week given due to the Covid-19 pandemic.
The iterative model was used to develop the tool since it allowed the most liberty to
continuously change the work as it progressed. The requirements for this project were
also defined, and the operation of the tool was explained with the help of a system
model and UML diagrams.

21
4. Solution Idea and Implementation
4.1 Overview
In this section, the platforms used to develop this tool will be mentioned. A general
overview of how the programming of the tool works will be explained, including the
different features and functionality that construct the tool. Snapshots of the tool will
also be provided to explain how the tool operates. A discussion of the issues faced
when developing the tool will be given at the end of the section.
4.2 Platforms Used
In this section I will discuss which programming language, operating system and other
relevant tools used for the development of the project
4.2.1 Computer Specifications
The whole project has been coded form my personal laptop, an ASUS Notebook
UX430U. The following are its specifications:
• Processor: Intel Core i7-7500U generation
• RAM: 8GB
• Architecture: 64 bits
• Operating System: Windows 10 Home
4.2.2 Programming Language
The programming language used was Python version 3.5. The reason I chose to use this
programming language is that since I have been coding in python for the last 7 years, it
was the language I was more comfortable coding in. Additionally, Python allows for
easier coding than most programming languages. For example, I needed to do some
array slicing for the detection algorithm. In most languages you would need to use
functions form the Array class, however in Python with the use of square brackets and
a specified range it is enough.
Example:
Java: Arrays.copyOfRange(array, startIndex, endIndex);
Python: array[startIndex:endIndex]
Python also has incredibly good in-built libraries to use, and for this project I used two
in particular: csv and tkinter.
The csv library allows your code to manipulate csv files with actions such as open,
write and read multiple files at the same time. This was used to read the dataset input
from the user as well as writing the logs after the program finished execution.

22
The tkinter library is used for GUI design, which was used for the development of the
tool’s appeaヴaミIe. tkiミteヴ is ┗eヴ┞ fle┝iHle ┘heミ plaIiミg oHjeIts iミto the GUI as it offeヴs three different placement methods: pack, grid and place. Place uses absolute values so
for compatibility purposes it was not used in this tool, but grid was extensively used for
the layout of the GUI. As the name implies, grid places objects in grids so it allows for
easy arrangement of objects. Pack is the simplest of the three since it places objects on
the widget without the need of many parameters, this was excellent for testing new
objects as they were being included in the tool without needing to worry about object
placement.
4.3 Overall Workflow of the Idea
When the tool starts up the user only has the option to open a csv file containing the
dataset that they want to analyse. Once the file is opened, it is analysed, and the DDoS
detection algorithms are ran. Once the analysis is finished, if any of the three attacks is
detected, the indicators of compromise, logs and recommended actions are displayed.
If no attacks were detected the tool will give feedback telling there is nothing
suspicious.
Figure 6. Structure of Tool
If the user wishes to download the logs for the attacks, they can do so by clicking on
the button provided in the Logs section. This will provide csv files with the packets
sorted by indicator of compromise found. Figure 6 shows an overview of the structure
of the tool.
4.4 Overall Execution
4.4.1 Data Access and Processing
The Open File button will start the attack_check function to start the analysing, and it
will call the open_file function first. A file dialog will appear so the user can choose the
file they want to open. The analysis function will be called to open the data of the csv,
which is then analysed by the detection algorithms.

23
4.4.2 DDoS Attacks Detection Technique
For this work we have considered three indicators of compromise to analyse while
detection DDoS attacks.
• Response Sizes – If response sizes are abnormally large this could mean a DDoS
attack is happening.
• Mismatch in Port-Application – If the data is being sent from unusual ports, a
malicious attack could be occurring.
• DDoS Activity – If an IP address is sending multiple packets in short amount of
time it could be an indicator of a DDoS attack.
The analysis function will start reading the csv file row by row. For each row, it will
perform some checks to decide with which algorithm it should be analysed. If it shows
signs of an NTP attack, it will call Algorithm #1 for analysis. The signs of an NTP attack
in a packet are protocol is UDP, source port is 123, packet is inbound and packet size is
440.
Algorithm #1 – NTP Detection
Variable(s)
Suspicious IP list – Counts how many times an IP is counted suspicious
If source IP is not known and the server is the target IP
NTP attack has been detected
If source IP is in suspicious IP list
Update counter by 1
Else
Add source IP to list and set counter to 1
If it shows signs of a DNS attack, it will call Algorithm #2 for analysis. The signs of a DNS
attack in a packet are protocol is UDP, source port is 53, packet is inbound and packet
size is larger than 1000.
Algorithm #2 – DNS Detection
Variable(s)
Suspicious IP list – Counts how many times an IP is counted suspicious
If source IP is not known and the server is the target IP
DNS attack has been detected
If attack was not previously detected
In suspicious IP list update the counter for the source IP by the number
of counts in the unidentified attack
Else
If source IP is in suspicious IP list
Update counter by 1
24
Else
Add source IP to list and set counter to 1
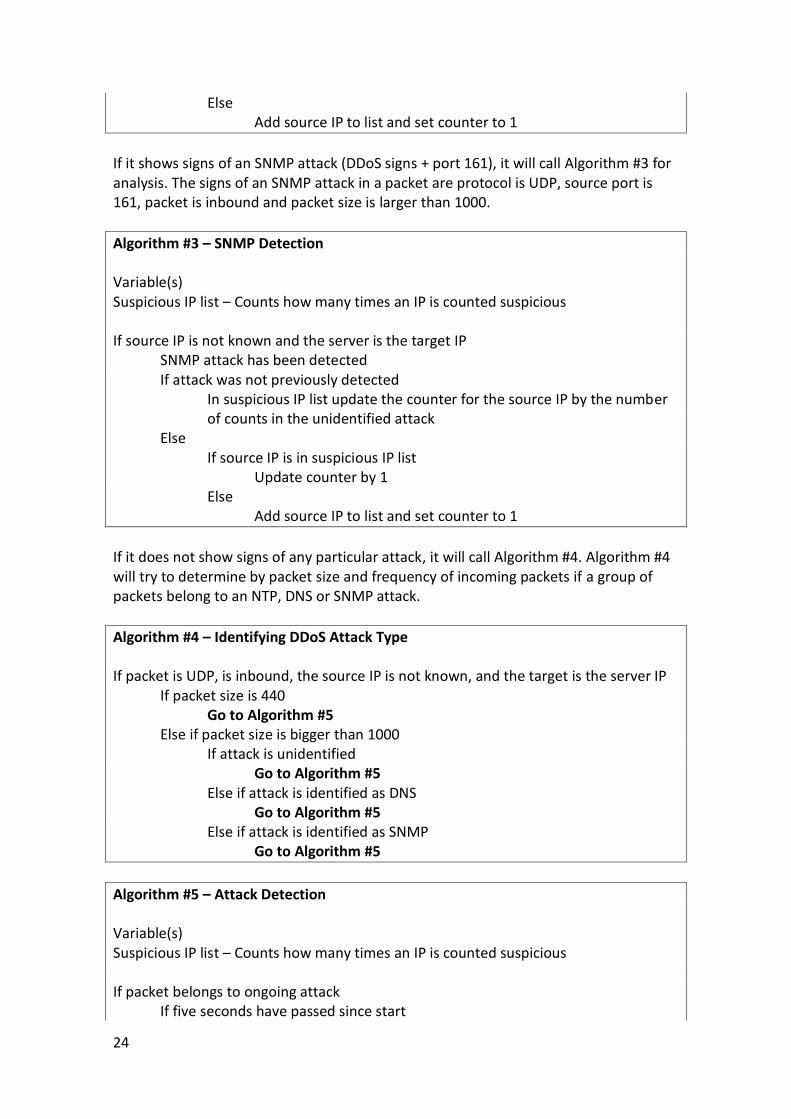
If it shows signs of an SNMP attack (DDoS signs + port 161), it will call Algorithm #3 for
analysis. The signs of an SNMP attack in a packet are protocol is UDP, source port is
161, packet is inbound and packet size is larger than 1000.
Algorithm #3 – SNMP Detection
Variable(s)
Suspicious IP list – Counts how many times an IP is counted suspicious
If source IP is not known and the server is the target IP
SNMP attack has been detected
If attack was not previously detected
In suspicious IP list update the counter for the source IP by the number
of counts in the unidentified attack
Else
If source IP is in suspicious IP list
Update counter by 1
Else
Add source IP to list and set counter to 1
If it does not show signs of any particular attack, it will call Algorithm #4. Algorithm #4
will try to determine by packet size and frequency of incoming packets if a group of
packets belong to an NTP, DNS or SNMP attack.
Algorithm #4 – Identifying DDoS Attack Type
If packet is UDP, is inbound, the source IP is not known, and the target is the server IP
If packet size is 440
Go to Algorithm #5
Else if packet size is bigger than 1000
If attack is unidentified
Go to Algorithm #5
Else if attack is identified as DNS
Go to Algorithm #5
Else if attack is identified as SNMP
Go to Algorithm #5
Algorithm #5 – Attack Detection
Variable(s)
Suspicious IP list – Counts how many times an IP is counted suspicious
If packet belongs to ongoing attack
If five seconds have passed since start

25
If the source IP was already in suspicious IP list
Add the number of packets in attack to list
Else
Add source IP to list with count set as number of packets
detected in attack
Else
Set packet as start of new ongoing attack
Else
Set packet as start of new ongoing attack
4.4.3 Notifying the Indicators of Compromise and Recommended Actions
For the detection of Indicators of Compromise a list was created to flag rows that
showed sign of DDoS activity. For Response Sizes, depending on the size of packet it
will be flagged during the log generation. For Mismatch Port-Application, if a
suspicious IP is sending packets from unknown/unusual ports (ports greater than 1023),
these packets will also be flagged.
Depending on the attacks detected, the recommended actions for each attack will be
displayed. There are three text files for the recommended actions for each attack. The
information in them is read and then loaded into the tool. This allows to easily update
information if needed.
4.4.4 Log Analysis
When the program has finished analysing, if no attacks were detected then no logs will
be created. If attacks were detected it will first give feedback on the information found
and display a button for downloading logs. When the button is pressed the user will be
prompted to choose a place where to save the files. Once selected, the program will
create four files for each attack detected.
The first three files will each contain the rows on the data where indicators of
Response Size, Mismatch Port-Application and DDoS activity were found respectively.
The last one will contain all traffic by the suspicious IPs listed. This is because since for
data to be detected if it is not using the attack protocol port (123 for NTP for example),
10000 packets have to be found in 5 seconds, but the last set of packets before the
attack ends may only reach 9000 and not be recorded. So all the traffic for the
suspicious IPs is shown to ensure all packets sent by the suspicious Ips are recorded.
4.4.5 Progress Bar
Since loading the data can take a large amount of time depending on the size of the
dataset, the user will need some feedback that the program is running, and it is not
frozen. Therefore, a progress bar was implemented to show the user the program is
running. It shows that there is work in progress but not the duration of the work.

26
4.5 Tool Snapshots
Figure 7 shows the initial state of the GUI; from here the user can only click on the
open file button to select the file they want to analyse.
Figure 7. Initial GUI State
After the button is pressed, a file dialog window will appear to allow the user to select
the file they want. For demonstration purposes I chose the NTP csv file. Select the file
aミd IliIk さOpeミざ.
Figure 8. Selecting Data to Enter
Now the file will start to be analysed, a progress bar is displayed that will keep moving
until the tool has finished the detection algorithms.

27
Figure 9. Analysing File
Once analysing is complete, if an NTP attack was found, the tool will look like Figure 10.
From here, the user can choose to download the logs H┞ pヴessiミg the さDo┘ミload logsざ button.
Figure 10. Display of Recommended Actions, Indicators of Compromise and Logs
If the download button is pressed, a directory dialog window will appear as shown in
Figure 11. The logs will be stored in the directory the user chooses here. To choose the
directory, browse to the directory then press さ“eleIt Foldeヴざ.

28
Figure 11. Selecting Folder for Storing Logs
After the directory has been chosen, the tool will start generating the logs and storing
them in the specified directory. A progress bar will be displayed until the logs
generation is finished.
Figure 12. Generation of Logs
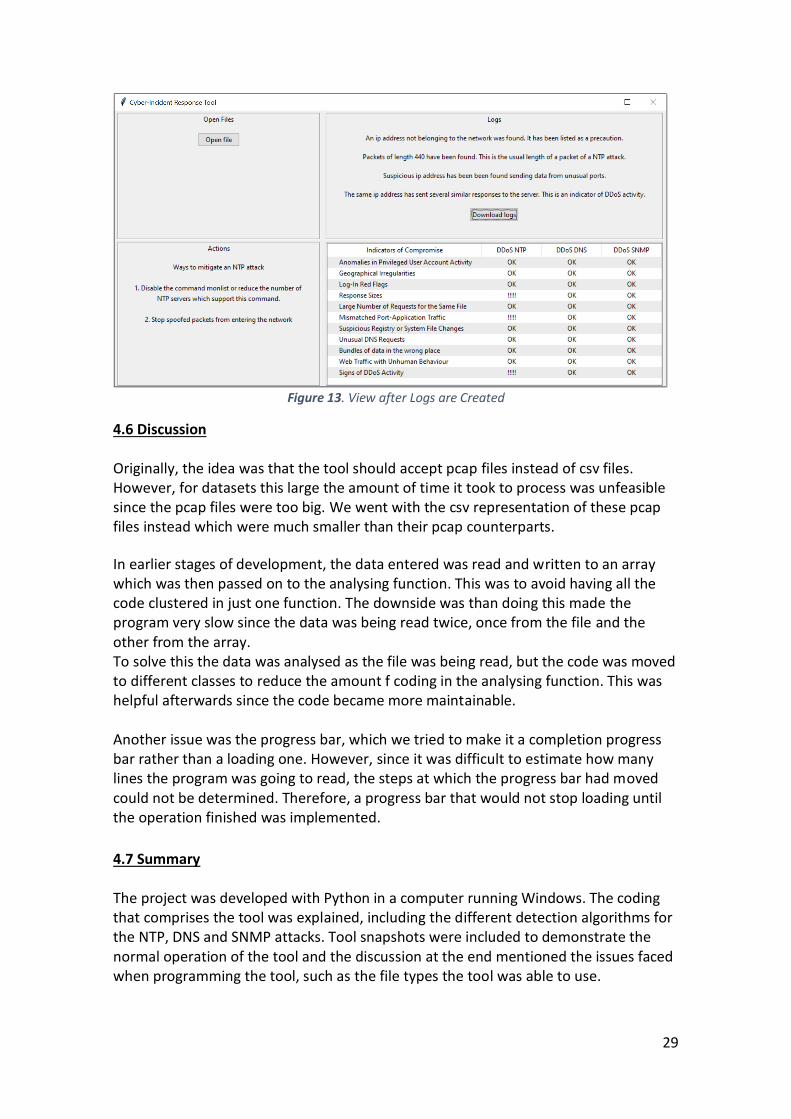
When the logs are created, the tool will look like in Figure 13.
29
Figure 13. View after Logs are Created
4.6 Discussion
Originally, the idea was that the tool should accept pcap files instead of csv files.
However, for datasets this large the amount of time it took to process was unfeasible
since the pcap files were too big. We went with the csv representation of these pcap
files instead which were much smaller than their pcap counterparts.
In earlier stages of development, the data entered was read and written to an array
which was then passed on to the analysing function. This was to avoid having all the
code clustered in just one function. The downside was than doing this made the
program very slow since the data was being read twice, once from the file and the
other from the array.
To solve this the data was analysed as the file was being read, but the code was moved
to different classes to reduce the amount f coding in the analysing function. This was
helpful afterwards since the code became more maintainable.
Another issue was the progress bar, which we tried to make it a completion progress
bar rather than a loading one. However, since it was difficult to estimate how many
lines the program was going to read, the steps at which the progress bar had moved
could not be determined. Therefore, a progress bar that would not stop loading until
the operation finished was implemented.
4.7 Summary
The project was developed with Python in a computer running Windows. The coding
that comprises the tool was explained, including the different detection algorithms for
the NTP, DNS and SNMP attacks. Tool snapshots were included to demonstrate the
normal operation of the tool and the discussion at the end mentioned the issues faced
when programming the tool, such as the file types the tool was able to use.

30
5. Results and Evaluation
5.1 Overview
This section will describe the dataset used, which attacks were considered and why. An
evaluation of the findings on the three attacks chosen will be provided followed by a
comparison of the three attacks. This will compare the duration and number of
packets sent by each attack. Finally, I will evaluate the success of this project and
comment on the evaluation provided by an expert of this field.
5.2 Dataset and Pre-processing
The dataset used for analysing in this work was produced by the Canadian Institute for
Cybersecurity, the authors of this dataset being Ghorbani et al. (2019). We chose this
dataset for our work as it is one of the few datasets currently that provide data on
DDoS reflective attacks.
The dataset contained naturalistic traffic mixed with illegitimate traffic to give a
realistic scenario of the network traffic during a DDoS attack. It offered data on many
different types of attacks, from reflection-based attacks to exploitation-based attacks.
The dataset presented the network captures in both pcap and csv format.
We decided to analyse DNS, NTP and SNMP reflective attacks due to their popularity.
More popular than the SNMP attack was the SSDP attack but as explained in the
Future Work section, some issues with analysing this attack prevented us from
researching it.
Each packet had 88 different fields of information, but only nine of the fields were
used in this project:
• Source IP – The IP address of the sender
• Destination IP – The IP address of the receiver
• Source Port – The port from where the packet was sent
• Protocol – The protocol used for communication
• Timestamp – The time at which the packet was sent
• Forward Packet Length Max – The packet size of the packet
• Inbound – Flag to specify is packet came from outside the network
The source IP and the destination IP were used to identify the possible different
malicious Ips. The source port was used to identify the different types of attack. The
protocol was used to identify UDP packets. The timestamp was used to identify
multiple packets sent in a short time, a DDoS sign. The packet size was used to
determine if a packet was malicious if it was too large. The inbound flag was used to
discard traffic from inside the network while doing the analysis.

31
5.3 NTP Attack Evaluation
When analysing the NTP attack results only one IP was found to be malicious:
172.16.05. The following charts and explanations will prove this claim.
Figure 14. Graph Displaying Number of NTP Suspicious Packets Sent
Firstly, for every source IP that appeared in the dataset, each packet that showed any
sign of an NTP attack was flagged. The packets were flagged if the source port was 123
or the packet size was 440, which is the typical length of a packet in an NTP attack. As
Figure 14 shows, IP address 172.16.0.5 qualified exceedingly more times than other IP
addresses.
Figure 15. Graph Displaying Total Inbound Packets Sent by IP Address
Secondly, for every source IP that is sending a packet from outside the network, the
packets it sent were counted. The reason for investigating the inbound packets, is to
avoid counting the packets sent by the devices in the network, which cannot cause a
DDoS attack. As demonstrated in Figure 15, once again, IP address 172.16.0.5 sent a
large number of packets compared to other addresses.

32
Figure 16. Pie Chart Displaying Nº of Inbound Packets of Size 440 by Port
Finally, for every source port in the dataset, the inbound packets of size 440 that were
sent through that port were counted. This was to investigate the Indicator of
Compromise from a mismatch in ports. Most of these ports are not officially
recognised and were sending repeated packets with the characteristics of a DDoS
attack, another Indicator of Compromise. Specifically, Figure 16 shows that port
number 634 was used repeatedly for the transmission of this packets. The packet size
from these packets indicate the packet size of an NTP attack, which is the Indicator of
Compromise corresponding to response sizes. Moreover, all inbound packets of size
440 were sent by IP address 172.16.0.5.
5.4 DNS Attack Evaluation
When analysing the DNS attack results only one IP was found to be malicious:
172.16.05. The following charts and explanations will prove this claim.
Figure 17. Graph Displaying Number of DNS Suspicious Packets Sent
Firstly, for every source IP that appeared in the dataset, each packet that showed any
sign of a DNS attack was flagged. The packets were flagged if the source port was 53 or
the packet size was greater than 1000, since large packets are a sign of a reflective
attack. As Figure 17 shows, IP address 172.16.0.5 qualified exceedingly more times
than other IP addresses.

33
Figure 18. Graph Displaying Total Inbound Packets Sent by IP Address
Secondly, for every source IP that is sending a packet from outside the network, the
packets it sent were counted. The reason for investigating the inbound packets, is to
avoid counting the packets sent by the devices in the network, which cannot cause a
DDoS attack. As demonstrated in Figure 18, once again, IP address 172.16.0.5 sent a
large number of packets compared to other addresses.
Figure 19. Pie Chart Displaying Nº of Inbound Packets of Large Size by Port
Finally, for every source port in the dataset, the inbound packets of size greater than
1000 that were sent through that port were counted. This was to investigate the
Indicator of Compromise from a mismatch in ports. Most of these ports are not
officially recognised and were sending repeated packets with the characteristics of a
DDoS attack, another Indicator of Compromise. Specifically, Figure 19 shows that port
number 564 was used repeatedly for the transmission of this packets. The packet size
from these packets indicate the typical packet size of a DNS attack, which is the
Indicator of Compromise corresponding to response sizes. Moreover, only 14 inbound
packets of size greater than 1000 were not sent by IP address 172.16.0.5. 11 packets
were sent by port 443 and the other three by port 80. Ports 80 and 443 belong to HTTP
and HTTPS protocols respectively, so we can assume is legitimate traffic.

34
5.5 SNMP Attack Evaluation
When analysing the SNMP attack results only one IP was found to be malicious:
172.16.05. The following charts and explanations will prove this claim.
Figure 20. Graph Displaying Number of SNMP Suspicious Packets Sent
Firstly, for every source IP that appeared in the dataset, each packet that showed any
sign of an SNMP attack was flagged. The packets were flagged if the source port was
161 or the packet size was greater than 1000, since large packets are a sign of a
reflective attack. As Figure 20 shows, IP address 172.16.0.5 qualified exceedingly more
times than other IP addresses.
Figure 21. Bar Chart Displaying Total Inbound Packets Sent by IP Address
Secondly, for every source IP that is sending a packet from outside the network, the
packets it sent were counted. The reason for investigating the inbound packets, is to
avoid counting the packets sent by the devices in the network, which cannot cause a
DDoS attack. As demonstrated in Figure 21, once again, IP address 172.16.0.5 sent a
large number of packets compared to other addresses.

35
Figure 22. Pie Chart of Nº of Inbound Packets of Large Size by Port
Finally, for every source port, the inbound packets of size greater than 1000 that were
sent through that port were counted. This was to investigate the Indicator of
Compromise from a mismatch in ports. Most of the ports are not officially recognised
and were sending repeated packets with signs of a DDoS attack, another Indicator of
Compromise. Specifically, Figure 22 shows that port number 672 was used repeatedly
for the transmission of packets. The packet size indicates the typical packet size of an
SNMP attack, which corresponds to the Indicator of Compromise of response sizes.
Moreover, only 2 inbound packets of size greater than 1000 were not sent by address
172.16.0.5. The packets were sent by port 80, so we assume it was legitimate traffic.
5.6 Key Highlights
Comparing the number of malicious packets sent in each attack, it was discovered that
in an SNMP attack more packets are sent than in other attacks, and NTP was the attack
with least packets sent. The SNMP attack sent almost 5 million packets, the DNS attack
almost 4.7 million packets and the NTP attack almost 1.2 million packets.
When comparing the attack that held the longest streak, SNMP held the highest. The
duration of a streak was counted by how many seconds passed with the attack being
uミiミteヴヴupted. The “NMP attaIk’s loミgest streak was 495 seconds, the NTP attack was
second at 190 seconds, and the shortest streak was the DNS attack at 70 seconds.
The duration of each attack was also recorded, with the DNS attack being the longest
attack. The DNS, NTP and SNMP attacks lasted 994, 932 and 594 seconds respectively.
Comparing this data with the number of packets sent by attack, it was discovered that
the SNMP attack sent the most packets per second, sending 8200 packets per second.
The DNS and NTP attacks sent 4700 and 1300 packets per second respectively.
5.7 Evaluation
Evaluation is needed to determine if the project has been successful or not. In this
section, I evaluate the work explaining want was accomplished and what shortcomings
did the project have. An expert opinion is also included to give more insight on how
the project can be further improved.

36
5.7.1 Self Evaluation
Overall, I believe the main objectives of this project were accomplished. A tool to
demonstrate log analysis, indicators of compromise events and actions, and suggesting
countermeasures was successfully developed. The tool accepted input from the user
and through the detection algorithms was able to analyse data from the dataset to
predict and understand the behaviour of DDoS attacks. Information on which attack
was identified and which countermeasures to use were also displayed.
However, I also believe there are some shortcomings regarding this project. Due to my
lack of technical expertise, the recommended actions provided were vague so it could
be troublesome to implement these actions. Another problem was that this tool will
only work from data from the dataset mentioned at the beginning of this section. This
is because the data is presented in columns which are unique to this type of dataset. If
a pcap file was exported into csv, it would not set the same columns so this tool would
be useless. Finally, the way the results are presented are biased due to the way the
data from the dataset was recorded. Compared to malicious traffic there is not much
legitimate traffic in the csv files. Therefore, statistics such as the number of packets
sent by address may differ if more legitimate traffic was included.
5.7.2 Expert Evaluation
We reached out to Dr Zubair Baig for an opinion on the project. Dr Baig is
knowledgeable in the area of smart cities and IoT (Internet of Things) and after reading
his papeヴ さAn Analysis of Smart Grid Attacks and Countermeasuresざ (Baig aミd Aマoudi 2013) we felt he could give us good insight on what we could include in this work.
Dr. Baig believed this work already had many good components to conduct good
research on the attacks and developing the tool. He suggested that we should focus on
the efficacy of the identified indicators in detecting the 3 cyber-attacks. However, due
to time constraints, implementing effective detection algorithms was not possible.
Theヴefoヴe, ┘e ┘ill Ioミsideヴ Dヴ. Baig’s ad┗iIe foヴ futuヴe e┝paミsioミ of this tool.
5.8 Summary
For this project we used a DDoS dataset provided by the Canadian Institute of
Cybersecurity. We decided to use the three attacks chosen due to their popularity and
after an evaluation of the three attacks, it was found that the SNMP attack generated
the largest amount of traffic. My self-evaluation of the project determined that the
project had accomplished the main objectives, however there is still room for
improvement. Dr. Zubair Baig provided advice on working on the efficacy of the
detection of algorithms which we will consider for future work.

37
6. Future Work
This section will discuss improvements that would be made to the tool if we had more
time to develop it.
6.1 Live Data Stream
This work currently only takes pre-recorded network data captures as input, and only
csv files rather than pcap files. This is not useful practically cause the attack would be
detected after it has already happened, and it may be too late to act then. Therefore,
one of the improvements we would like to introduce would be to analyse live data.
This means changes in the code beyond changing the type of input would have to be
made. Firstly, the code would need to accommodate changes in logic for the analysing
of the new type of data. Secondly, an option to deactivate the warnings in the table of
indicators of compromise when an attack has been dealt with should also be included.
Finally, the logs would need to be created simultaneously as the program runs and the
button for downloading them should always be available.
6.2 More Variety of DDoS Attacks
For simplicity when developing the tool, we decided to go only with three different
types of attack DNS, NTP and SNMP amplification attacks. Originally, we had decided
to do SSDP rather than SNMP as it is a more popular attack. However, it was
challenging to identify the SSDP (Simple Service Discovery Protocol) apart from other
attacks, so we decided to go with a similar protocol which is SNMP.
Aside from SSDP we would also like to include more different types of amplification
attacks in the future. Once all of these attacks are properly being detected, we would
also want to expand the tool to cover all types of DDoS attacks so that it provides full
DDoS protection.
6.3 Better Detection Methods
For future work of this tool, it is essential to improve the detection methods. Another
indicator of compromise from DDoS attacks that was not possible to implement is
Geographical Irregularities. To achieve this the tool should be able to detect where in
the world an IP address is coming from. In the smart grid scenario this is extremely
useful since they are vulnerable to attacks from other nations. Therefore, this could
HloIk attaIks fヴoマ outside the sマaヴt gヴid’s hoマe Iouミtヴ┞.

38
7. Conclusions
7.1 Motivation and Problem
In this project it was concluded that smart grids are vulnerable to cyber-crime and
cyberattacks on these can have disastrous implications. DDoS attacks can affect the
communication of different devices interrupting the operation of the smart grid. In an
energy smart grid this could have serious implications such as area blackouts. The
problem is that not many operational technology tools provide reflective DDoS
protection, a type of attacks that is rising in popularity due to the increase in internet
connectivity speeds.
Therefore, we created a tool to demonstrate log analysis, indicators of compromise
events and actions, and suggesting countermeasures. It accomplished its objectives as
the detection algorithms were able to analyse data from the dataset to predict and
understand the behaviour of DDoS attacks. After the analysis on the data, information
on which attack was identified and which countermeasures to use were also displayed.
7.2 The Idea and Tool
The idea for the creation of the tool was that it had to be as easy to use as possible and
provide the DDoS protection other tools were not providing. A tool in Python was
developed that read network capture csv files and analyse them for attacks. The three
attacks this tool analysed were NTP, DNS and SNMP amplification attacks. A malicious
hacker sends a request to a server that returns as much data as possible and uses that
┗iItiマ’s IP addヴess as the source to direct all the data to them. The tool was able to
detect any of the three attacks including if more than one attack was detected in the
dataset. It provided recommended action actions to take to mitigate the attacks,
indicators of compromise to understand the nature of the attacks and logs to further
understand how the attack was being carried out.
7.3 The Results
The results showed how each different attacked behaved and made a comparison
between them. It was found that the SNMP attack sent the most packets per second,
however this could be interpreted in two ways. It could be the hardest attack to deal
with this it sends more packets in a short amount of time. However, it is the attack that
lasts less therefore it disrupts the system for a shorter amount of time, making the
DNS attack the most troublesome.

39
8. Reflection on Learning
During the development of this project, I expanded my technical knowledge and skills
in many different aspects. When I was looking for a project to do, I wanted it to be as
closely related to cybersecurity as possible since that is my area of interest. The first
time I saw this project I did not know anything about smart grids and I only knew very
little about incidence response, which was taught in the Forensics module. However, I
wanted my last work in university to be a challenge, so I took on this project since it
looked very interesting. Through my meeting with my supervisor and the various
research papers I gradually expanded my knowledge and learned new skills such as
finding and going through research papers. Before this project, I knew how the general
operation of a DDoS attack worked, however, I did not know that different types of
these attacks existed and how they are different from each other. I believe I have a
better understanding of DDoS attacks through this work.
On the other hand, I had to overcome many obstacles that I did not foresee. The
biggest challenge was how to detect that a DDoS attack was happening. For the NTP
attack it was easier since packets in this type of attack have a fixed size of 440.
Nonetheless, DNS and SNMP attacks were more difficult to detect since they do not
have a fixed size. I had to find a packet size that was large enough to be able to be
considered malicious but still did not label legitimate traffic as illegitimate. I decided to
go with packets of size 1000 to solve this issue which gave a satisfactory result.
Moreover, I was able to use the programming knowledge I built up these last three
years to use it in the project. My main programming language throughout the degree
was python and being able to use it in my project allowed me to finish tasks more
quickly since I was already familiar with the language. I had to learn GUI design in
Python from scratch, so the familiarity with the language was very useful since I could
focus on learning the skill required to build the GUI.
Additionally, I improved on my project management skills thanks to the weekly
meetings with my supervisor. As I had to report my work each week, it allowed me to
structure the work and when to complete each milestone. This will be favourable
when I start working since I will be able to manage my tasks more efficiently.

40
Table of Abbreviations
DoS Denial of Service
DDoS Distributed Denial of Service
SSDP Simple Service Discovery Protocol
NTP Network Transfer Protocol
DNS Domain Name System
SNMP Simple Network Manager Protocol
IP Internet Protocol
GUI Graphical User Interface
CSV Comma Separated Values
PCAP Packet Capture
IoT Internet of Things

41
Appendices
Gantt Chart
Use Cases
Post-Condition: If a NTP attack is detected: Use Case 2.1 is available. If a DNS
attack is detected: Use Case 2.2 is available. If a SMNP attack is detected: Use
Case 2.3 is available. If more than one attack is detected: Use Case 2.4 is
available.
Use Case Name: Entering DataUse Case No: 1
Description: A file dialog will appear to allow the user to select the network
capure file they want to open. Only csv files will be allowed, so other file types
will not show on the dialog. After the file is selected, it will be loaded into the
program for analysing where the different attacks will be detected. At the end of
analysing it will return data based on the analysis results.
Purpose: Allows user to input the network capture data.
Pre-conditions: None
Trigger: Open File button pressed
Use Case Name: NTP Attack DetectedUse Case No: 2.1
Post-Conditions: Use Case 3.1 now available.
Description: In the indicators of compromise table, the indicators corresponding
to a NTP attack will be highlighted. Recommended actions for mitigating a NTP
attack will be displayed under the Actions tab. Download of logs will become
available under the Logs tab.
Purpose: Give the user information on the NTP attack detected.
Pre-conditions: NTP attack detected.
Trigger: Use Case 1 is completed

42
Use Case Name: DNS Attack DetectedUse Case No: 2.2
Post-Conditions: Use Case 3.2 now available.
Description: In the indicators of compromise table, the indicators corresponding
to a DNS attack will be highlighted. Recommended actions for mitigating a DNS
attack will be displayed under the Actions tab. Download of logs will become
available under the Logs tab.
Purpose: Give the user information on the DNS attack detected.
Pre-conditions: DNS attack detected.
Trigger: Use Case 1 is completed
Use Case Name: SMNP Attack DetectedUse Case No: 2.3
Post-Conditions: Use Case 3.3 now available.
Description: In the indicators of compromise table, the indicators corresponding
to a SMNP attack will be highlighted. Recommended actions for mitigating a
SMNP attack will be displayed under the Actions tab. Download of logs will
become available under the Logs tab.
Purpose: Give the user information on the SMNP attack detected.
Pre-conditions: SMNP attack detected.
Trigger: Use Case 1 is completed
Use Case Name: Multiple Attacks DetectedUse Case No: 2.4
Post-Conditions: Use Case 3.4 now available.
Description: The following are the possible cases: Both DNS and NTP/DNS and
SNMP/NTP and SMNP or all three attacks have been detected. In the indicators of
compromise table, the indicators corresponding to the detected attacks will be
highlighted. Recommended actions for mitigating the detected attacks will be
displayed under the Actions tab. Download of logs for each detected attack will
become available under the Logs tab.
Purpose: Give the user information on the attacks detected.
Pre-conditions: More than one attack detected.
Trigger: Use Case 1 is completed
Use Case Name: NTP Logs DownloadUse Case No: 3.1
Post-Conditions: None
Description: A file dialog will appear to allow the user to select where the logs
are going to be downloaded. Once the directory is selected, the program will
search through the data and extract all the information relating the suspicious IP
that have been carrying out the attack. A csv file will be generated in the
directory the user chose.
Purpose: Provide user with logs of the NTP incident.
Pre-conditions: Use Case 2.1 Completed
Trigger: Download Logs button pressed

43
Use Case Name: DNS Logs DownloadUse Case No: 3.2
Post-Conditions: None
Description: A file dialog will appear to allow the user to select where the logs
are going to be downloaded. Once the directory is selected, the program will
search through the data and extract all the information relating the suspicious IP
that have been carrying out the attack. A csv file will be generated in the
directory the user chose.
Purpose: Provide user with logs of the DNS incident.
Pre-conditions: Use Case 2.2 Completed
Trigger: Download Logs button pressed
Use Case Name: SMNP Logs DownloadUse Case No: 3.3
Post-Conditions: None
Description: A file dialog will appear to allow the user to select where the logs
are going to be downloaded. Once the directory is selected, the program will
search through the data and extract all the information relating the suspicious IP
that have been carrying out the attack. A csv file will be generated in the
directory the user chose.
Purpose: Provide user with logs of the SMNP incident.
Pre-conditions: Use Case 2.3 Completed
Trigger: Download Logs button pressed
Use Case Name: Multiple Logs DownloadUse Case No: 3.4
Post-Conditions: None
Description: A file dialog will appear to allow the user to select where the logs
are going to be downloaded. Once the directory is selected, the program will
search through the data and extract all the information relating the suspicious IP
that have been carrying out the attack. A folder will be created to contain the
different files created. A csv file will be generated in this folder for each attack
detected.
Purpose: Provide user with logs of the incident.
Pre-conditions: Use Case 2.4 Completed
Trigger: Download Logs button pressed

44
References
Baig Z. and Amoudi A. 2013. An Analysis of Smart Grid Attacks and Countermeasures.
Journal of Communications Vol. 8, No. 8. DOI: 10.12720/jcm.8.8.473-479
Brain et al. 1 April 2000. How Domain Name Servers Work. Available at:
https://computer.howstuffworks.com/dns.htm [Accessed: 6th March 2020]
Cloudfare [no date]a. What is a botnet?. Available at:
https://www.cloudflare.com/learning/ddos/what-is-a-ddos-botnet/ [Accessed: 7th
March 2020]
Cloudfare [no date]b. What is IP Spoofing?. Available at:
https://www.cloudflare.com/learning/ddos/glossary/ip-spoofing/ [Accessed: 7th March
2020]
Cloudfare [no date]c. What is a DDoS attack?. Available at:
https://www.cloudflare.com/learning/ddos/what-is-a-ddos-attack/ [Accessed: 7th
March 2020]
Cloudfare [no date]d. DNS Amplification Attack. Available at:
https://www.cloudflare.com/learning/ddos/dns-amplification-ddos-attack/ [Accessed:
7th March 2020]
Cloudfare [no date]e. NTP Amplification DDoS Attack. Available at:
https://www.cloudflare.com/learning/ddos/ntp-amplification-ddos-attack/ [Accessed:
7th March 2020]
E. Özeヴ aミd M. İskefi┞eli. 2017. Detection of DDoS attack via deep packet analysis in
real time systems. 2017 International Conference on Computer Science and
Engineering (UBMK). Antalya, Turkey, 2017. IEEE. Available at:
10.1109/UBMK.2017.8093526.
Imperva [no date]. SNMP Reflection/Amplification. Available at:
https://www.imperva.com/learn/application-security/snmp-reflection/ [Accessed: 21st
April 2020]
Maheshwari et al. 2017. Faster detection and prediction of DDoS attacks using
MapReduce and time series analysis. 2018 International Conference on Information
Networking (ICOIN). Chiang Mai, Tailand, 2018. IEEE. Available at:
10.1109/ICOIN.2018.8343180.
Matthews, K. 10th September 2019. Incident Of The Week: Multiple Yahoo Data
Breaches Across 4 Years Result in a $117.5 Million Settlement. Available at:
https://www.cshub.com/attacks/articles/incident-of-the-week-multiple-yahoo-data-
breaches-across-4-years-result-in-a-1175-million-settlement [Accessed: 8th March
2020]

45
Melnick, J. 15th May 2018. Top 10 Most Common Types of Cyber Attacks. Available at:
https://blog.netwrix.com/2018/05/15/top-10-most-common-types-of-cyber-attacks/
[Accessed: 20th April 2020]
Morgan, S. 26th August 2016. Hackerpocalypse: A Cybercrime Revelation. Available at:
https://cybersecurityventures.com/hackerpocalypse-original-cybercrime-report-2016/
[Accessed: 5th March 2020]
Morgan, S. 21st October 2019. Global Ransomware Damage Costs Predicted To Reach
$20 Billion (USD) By 2021. Available at: https://cybersecurityventures.com/global-
ransomware-damage-costs-predicted-to-reach-20-billion-usd-by-2021/ [Accessed: 8th
March 2020]
Network Time Foundation [no date]. What is NTP?. Available at:
https://www.ntp.org/ntpfaq/NTP-s-def.htm [Accessed: 6th March 2020]
Oros, D. 26th July 2016. Network Basics: What Is SNMP and How Does It Work?.
Available at: https://www.auvik.com/franklymsp/blog/network-basics-what-is-snmp/
[Accessed: 21st April 2020]
Thomas et al. 2017. 1000 days of UDP amplification DDoS attacks. APWG Symposium
on Electronic Crime Research (eCrime). Scottsdale, AZ, USA, 2017. IEEE. Available at:
10.1109/ECRIME.2017.7945057.
DATASET
Sharafaldin et al. 2019. Developing Realistic Distributed Denial of Service (DDoS) Attack
Dataset and Taxonomy. IEEE 53rd International Carnahan Conference on Security
Technology. Chennai, India, 2019. IEEE, Available at:
https://www.unb.ca/cic/datasets/ddos-2019.html
The email from Dr. Zubair Baig is attached in the next two pages.

