cyclic voltammetry - ohio.edu · solid lines correspond to reducing species ... a = electrode area...
TRANSCRIPT

Center for Electrochemical Engineering Research
Department of Chemical and Biomolecular
Engineering
CYCLIC
VOLTAMMETRY
GEETHA KRISHNAN
05/24/11

Center for Electrochemical Engineering Research2
Controlled Potential
(1) Potential sweep methods: Cyclic Voltammetry (CV) and linear sweep voltammetry (LSV).
(2) Cyclic voltammetry is a very popular technique for electrochemical studies, useful for obtaining information about fairly complicated electrode reactions.
(3) Signal Response
Potential Sweep Methods

Center for Electrochemical Engineering Research3
UNDERSTANDING CYCLIC VOLTAMMETRY BEHAVIOR

Center for Electrochemical Engineering Research4
Cyclic voltammetry
Cyclic potential sweep
Resulting cyclic
voltammogram
(initial potential and
switching potential)

Center for Electrochemical Engineering Research5
The Nernst equation:
Ecell = E0 - (RT/nF) ln (cR*/co
*)
• Ecell is related directly to [O] and [R].
• Limitations: Applies only when there is no net current
flow through the electrode. The activity of ions at the
electrode surface changes when there is current flow,
and there are additional over potential and resistive loss
terms which contribute to the measured potential.
Equilibrium for Reaction

Concentration-Distance profiles
Solid Lines correspond to reducing species
and dotted lines the oxidizing species.
At various stages of Cyclic Voltammogram
6

Center for Electrochemical Engineering Research7
Close-up of CV experiment

Center for Electrochemical Engineering Research8
Understanding Response
• At a potential well positive of E0´, only nonfaradaic
currents flow for awhile.
• When the potential reaches the vicinity of E0´, the
reduction begins and current starts to flow.
• As the potential continues to grow more negative, the
surface concentration of the reactant must drop,
hence the flux to the surface and the current
increase.
• As the potential moves past , the surface
concentration drops to near zero and mass transfer
of reactant to the surface reaches a maximum rate.
• Then it declines as the depletion effect sets in.
Cyclic Voltammetry

9
Cyclic VoltammetryWhat these notations mean?
The current is first observed to peak at Epc
(with value ipc) indicating reduction of
species and then drops due to depletion of
the reducing species from the diffusion
layer.
b: onset potential
d,j: Peak Potential
F: Switching Potential

10
Cyclic Voltammetry
• E0 = (Epa + Epc ) /2 .
• Separation of peaks for a reversible
couple is 0.059V/n volts.
• A one electron transfer fast reaction
thus gives 59mV separation.
• Half-peak potential Ep/2 = E1/2 + 0.028/n
• This potential is attained in the interval in
which the rate of the charge-transfer process,
and hence the current, increase
monotonically with time.

11
Cyclic VoltammetryEffect of Scan Rate
• In a slow voltage scan rate
the diffusion layer will grow
much farther from the
electrode in comparison to a
fast scan.
• Flux to the electrode is
smaller at slow scan rates vs.
faster rates.
• The current is proportional
to flux towards the electrode.

Center for Electrochemical Engineering Research12
Randles-Sevcik equation
n = Number of electrons
F = Faraday’s Constant 96,485 C/mole
A = Electrode Area cm2
D = Analyte Diffusion Coefficient cm2 s-1
Ratio of ipa to ipc should be close to one, but vary with chemicalreactions coupled to electrode process.
21
p RTnFvDnFAC4463.0i
Reversible systems (Effect of scan rate on peak current)

Center for Electrochemical Engineering Research13
Randles-Sevcik equation
If the plot of peak height vs. the square root of the scan rate produces a
linear plot, the diffusion coefficient can be obtained from the slope of the
plot.
Reversible systems

Center for Electrochemical Engineering Research14
UNDERSTANDING REACTION MECHANISMS

Center for Electrochemical Engineering Research15
In general, the electrode reaction rate is governed by rates of processes such as:
(1) Mass transfer (e.g., from the bulk solution to the electrode surface).
(2) Electron transfer at the electrode surface.
(3) Chemical reactions preceding or following the electron transfer.
(4) Other surface reactions.
◆ The magnitude of this current is often limited by the inherent sluggishness of one or more reactions called rate-determining steps.
Factors affecting electrode reaction rate

Center for Electrochemical Engineering Research16
• If E represents an electron transfer at the
electrode surface, and C represents a
homogeneous chemical reaction.
• Classification of reactions: CE reaction,
EC reaction, Catalytic (EC′) reaction, ECE
reaction.
Electrode reactions with coupled
homogeneous chemical reactions

Center for Electrochemical Engineering Research17
EC mechanism
• In the KP region, Ep is given by
• kf: heterogeneous rate constant for oxidation• kb: heterogeous rate constant for reduction• K: equilibrium constant• λ: dimensionless homogeneous kinetic parameter,
specific to mechanism• DP: diffusion zone KP: pure kinetic region
1/ 2 0.780 ln2
p
RT RTE E
nF nF ( )
knF
RT

Center for Electrochemical Engineering Research18
• At small values of “λ”,
reversible behavior is
found.
• For large “λ” no current is
observed on scan reversal
and shape of the curve is
similar to that of a totally
irreversible charge
transfer.
EC mechanism

Center for Electrochemical Engineering Research19
Types of EC mechanisms
1. ErCi mechanism
1. ErCi mechanism
2. ErCr mechanism
3. ErCi’ mechanism
4.ErCiEr mechanism
r : Reversible I : Irreversible

20
1. ErCi mechanism
c
r
k
i
E : Ox ne Red
C : Red Z
• Z : Electrochemically inactive in
the scanned potential range, no
equilibrium exists.
• Slow scan rates enough time
elapse between initiation of “Ox”
reduction and its reoxidation.
• Complete conversion to Z.
Oxidation
Reduction
21
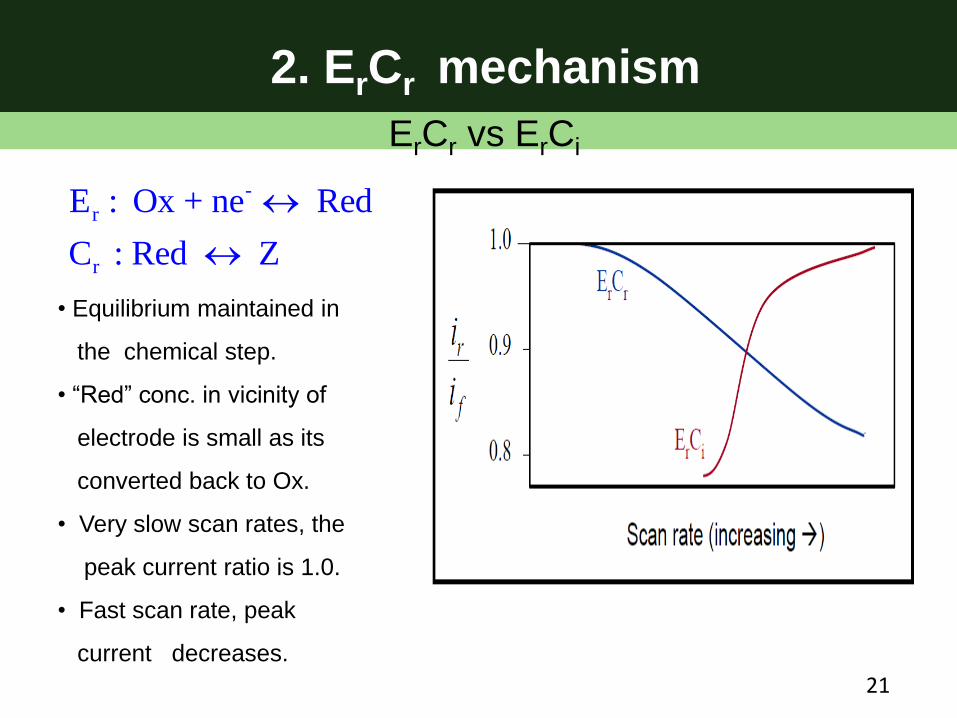
2. ErCr mechanism
-
r
r
E : Ox + ne Red
C : Red Z
ErCr vs ErCi
• Equilibrium maintained in
the chemical step.
• “Red” conc. in vicinity of
electrode is small as its
converted back to Ox.
• Very slow scan rates, the
peak current ratio is 1.0.
• Fast scan rate, peak
current decreases.

22
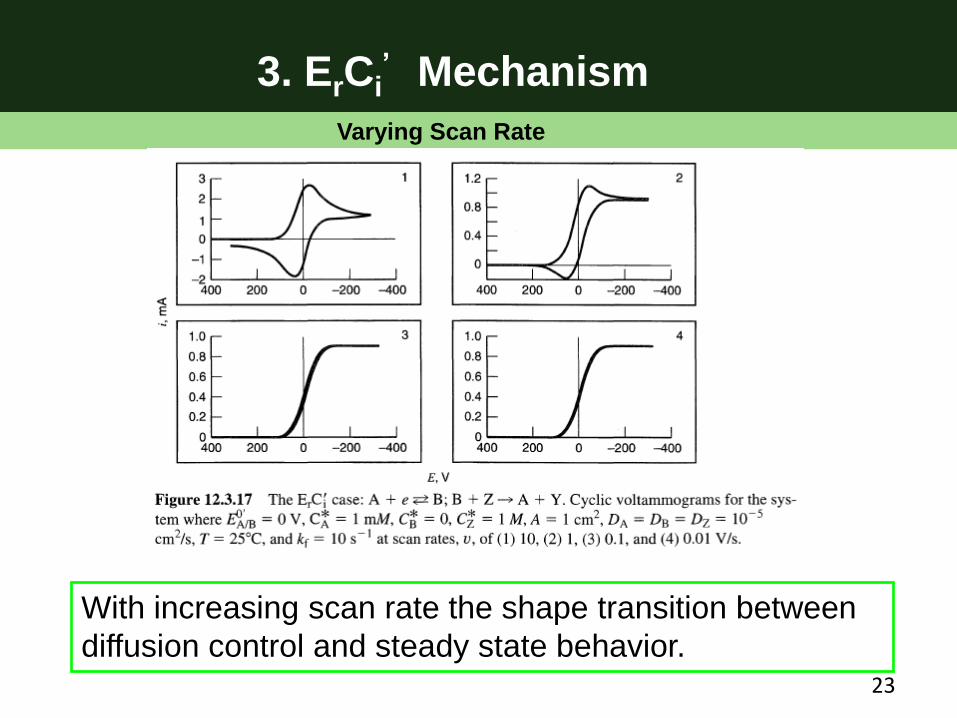
3. ErCi’ Mechanism
c
r
k
i
E : Ox ne Red
C ' : Red + Z Ox + Y
• Z is present in large
• If kc is small vs. “ʋ”, the voltammetry appears reversible and peak current ratios approach unity.
• As kc increases, so does catalytically revived “Ox”.
In presence of catalyst
23
With increasing scan rate the shape transition between
diffusion control and steady state behavior.
3. ErCi’ Mechanism
Varying Scan Rate

24
CrEr mechanism
Red neOx : E
Ox Z:C
-
r
k
rf
• For small rates “Ox” is less.
• “Red” reaches electrode due
to diffusion.
• For faster scan rates a
reversible behavior is noted as only initial “Ox”contributes to current.

25
c
0
1
0 0
2 1
r
k
i
-
r
E : Ox ne Red
C : Red A
E : A + ne B
E
E <
E
4. ErCiEr Mechanism
Increasing scan rates fixed kc
Cathodic
Anodic • Cathodic peak increases with
kc.
• Peak w.r.t oxidation of Red to
Ox diminishes relative to A
formed.
• Shown is a 2e- transfer
process, with oxidation of B to
A following Red to Ox.
B-A
A

26
As E2o < E1
o any A produced in Ci step following reduction of Ox is immediately reduced to B.
E0 values for 2e- transfer is well separated.
4. ErCiEr Mechanism

Center for Electrochemical Engineering Research27
The Legendary Butler-Volmer Equation

28
Butler-Volmer Equation
• Describes how the electrical current on an
electrode depends on the electrode potential,
considering that both a cathodic and an
anodic reaction occur on the same electrode
o eq eq
(1-α)×n×F α×n×FI=A×i × exp × E-E -exp × E-E
R×T R×T

Center for Electrochemical Engineering Research29
Butler-Volmer Equation
ia and ic are the exchange current densities for the
anodic and cathodic reactions
ialoverpotent cathodichigh at
RT
nFexpii
ialoverpotent anodichigh at
RT
nF1expii
c0`c
a0`a
(a)
(b)
Limitations

30
• At high overpotential the Butler-Volmer equation
simplifies to the Tafel equation
E − Eeq = a − blog(ic) for a cathodic reaction
E − Eeq = a + blog(ia) for an anodic reaction
a and b are constants (for a given reaction and
temperature) called Tafel equation constants.
• At low over potential the Stern Geary equation applies.
• Valid when the electrode reaction is controlled by
electrical charge transfer at the electrode and not by
the mass transfer.
Butler-Volmer Equation (Limitations)

Center for Electrochemical Engineering Research31
(a) Tafel Equations – high
• Relates the rate of an electrochemical reaction to the
over potential. Plots of ln i vs. are called Tafel plots,
can calculate from slope and Io from y-intercept.
• Cathodic: ln I = lnIo + (-CnF/RT)
ii
nF
RTb
iibiinF
RT
log303.2ln
slope Tafel the303.2
where
lnor ln 00

Center for Electrochemical Engineering Research32
Tafel Plots
In real systems often there is large negative deviations from
linearity at high due to mass transfer limitations
, VEeqbm
ln |i|
_+
Cathodic Anodic
ln Io
High overpotential:
ln I = lnIo + (AnF/RT)
Mass transport
limited current
Low overpotential:
I = (Io nF/RT)

Center for Electrochemical Engineering Research33
(b) Stern Geary Equation - low
• Applicable in the linear region of the Butler Volmer Equation at low over-potentials
corr
p
p
Bi
R
B the Tafel constant
R the measured polarisation resistance
E i

Center for Electrochemical Engineering Research34
Synopsis
• Nernst equation
• Randles-Sevcik equation
• Electrode reactions with coupled
homogeneous chemical reactions
• Butler Volmer Equation
• Tafel Behavior
• Stern Geary Equation

Center for Electrochemical Engineering Research3535
THANK YOU