cyclical unemployment, structural unemployment...unemployment, and not in the labor force, january...
TRANSCRIPT

Cyclical Unemployment, Structural Unemployment
Peter Diamond Massachusetts Institute of Technology
Paper presented at the 13th Jacques Polak Annual Research Conference Hosted by the International Monetary Fund Washington, DC─November 8–9, 2012 The views expressed in this paper are those of the author(s) only, and the presence
of them, or of links to them, on the IMF website does not imply that the IMF, its Executive Board, or its management endorses or shares the views expressed in the paper.
1133TTHH JJAACCQQUUEESS PPOOLLAAKK AANNNNUUAALL RREESSEEAARRCCHH CCOONNFFEERREENNCCEE NNOOVVEEMMBBEERR 88––99,, 22001122

Mundell-Fleming Lecture
“Cyclical Unemployment, Structural Unemployment”
Peter Diamond
November 8, 2012
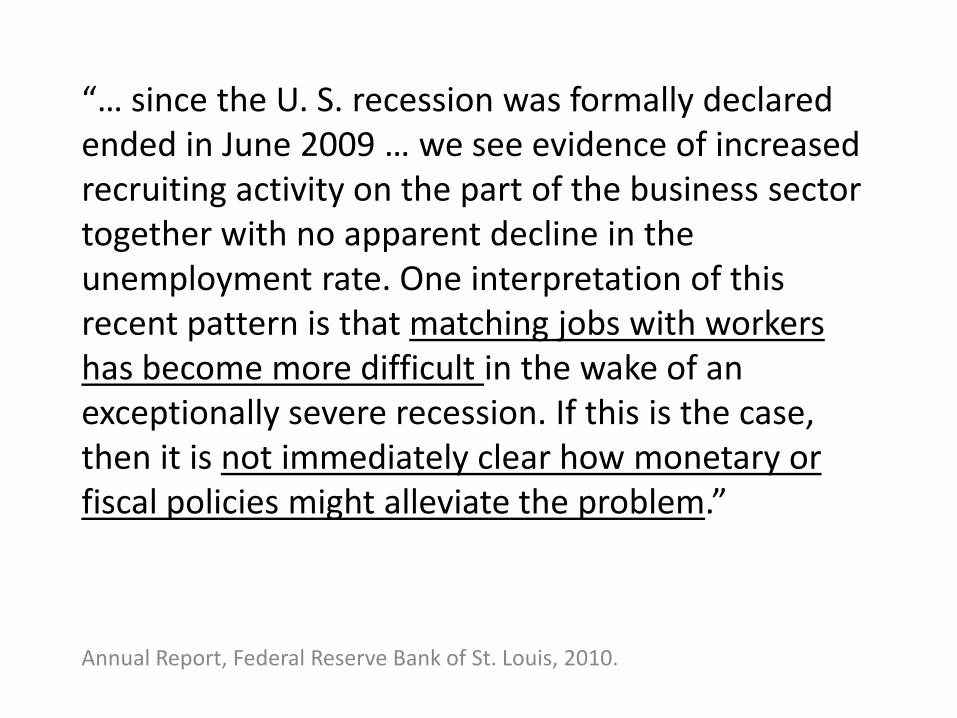
“… since the U. S. recession was formally declared ended in June 2009 … we see evidence of increased recruiting activity on the part of the business sector together with no apparent decline in the unemployment rate. One interpretation of this recent pattern is that matching jobs with workers has become more difficult in the wake of an exceptionally severe recession. If this is the case, then it is not immediately clear how monetary or fiscal policies might alleviate the problem.”
Annual Report, Federal Reserve Bank of St. Louis, 2010.
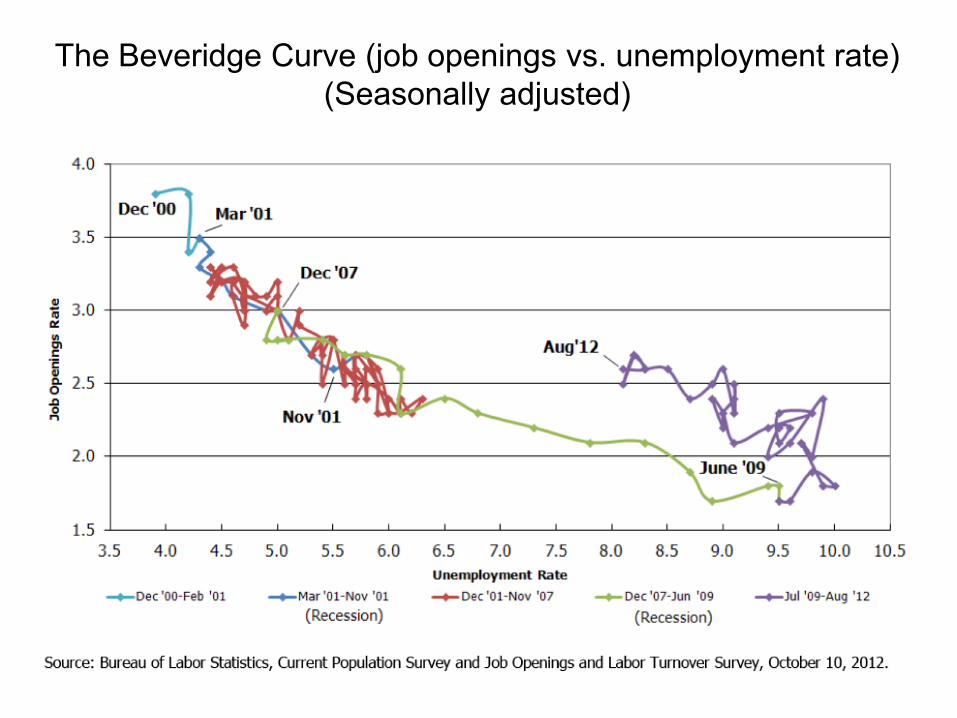
The Beveridge Curve (job openings vs. unemployment rate) (Seasonally adjusted)
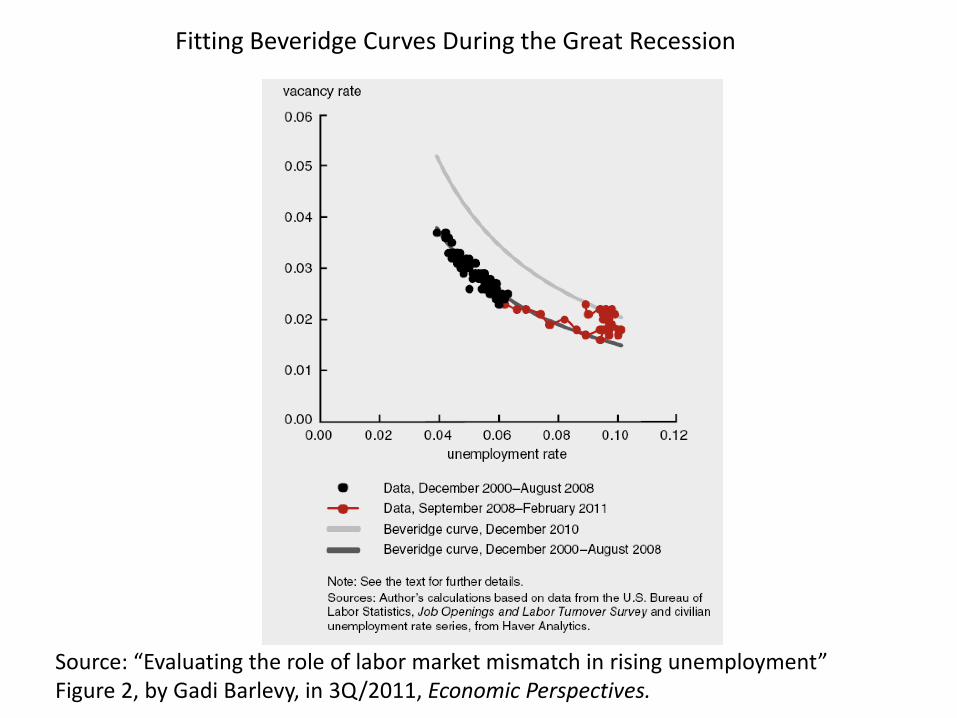
Fitting Beveridge Curves During the Great Recession
Source: “Evaluating the role of labor market mismatch in rising unemployment” Figure 2, by Gadi Barlevy, in 3Q/2011, Economic Perspectives.
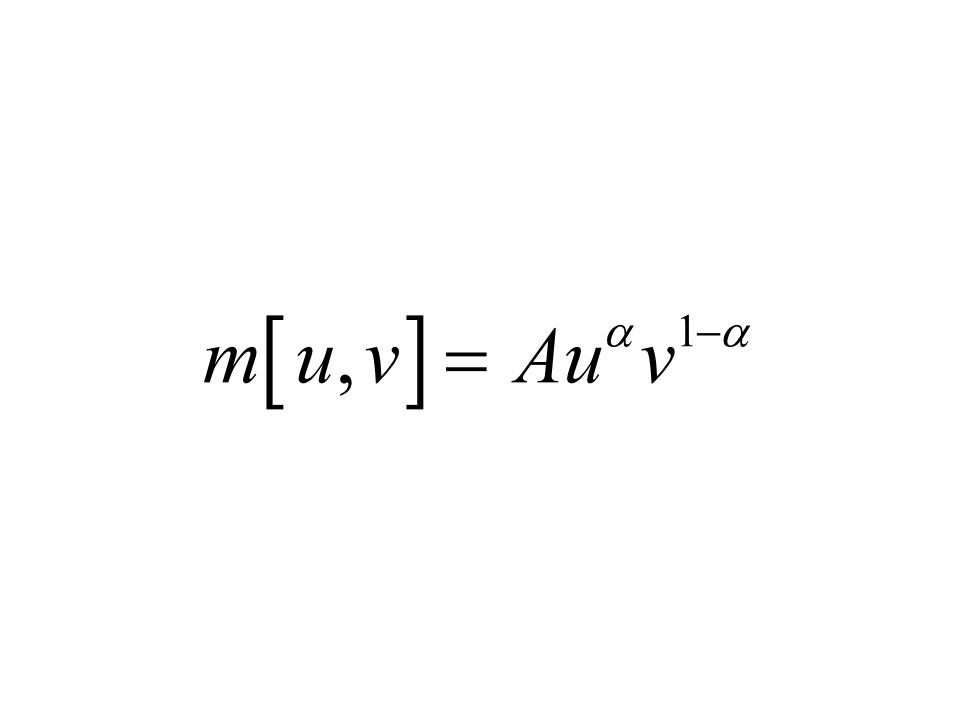
[ ] 1,m u v Au vα α−=
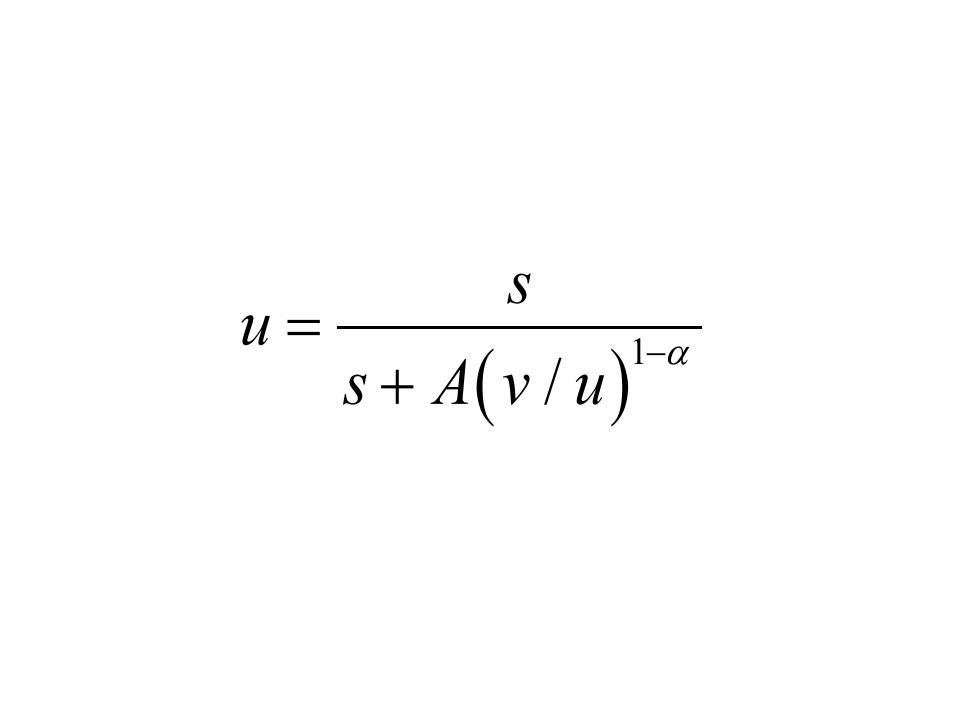
( )1/su
s A v u α−=+
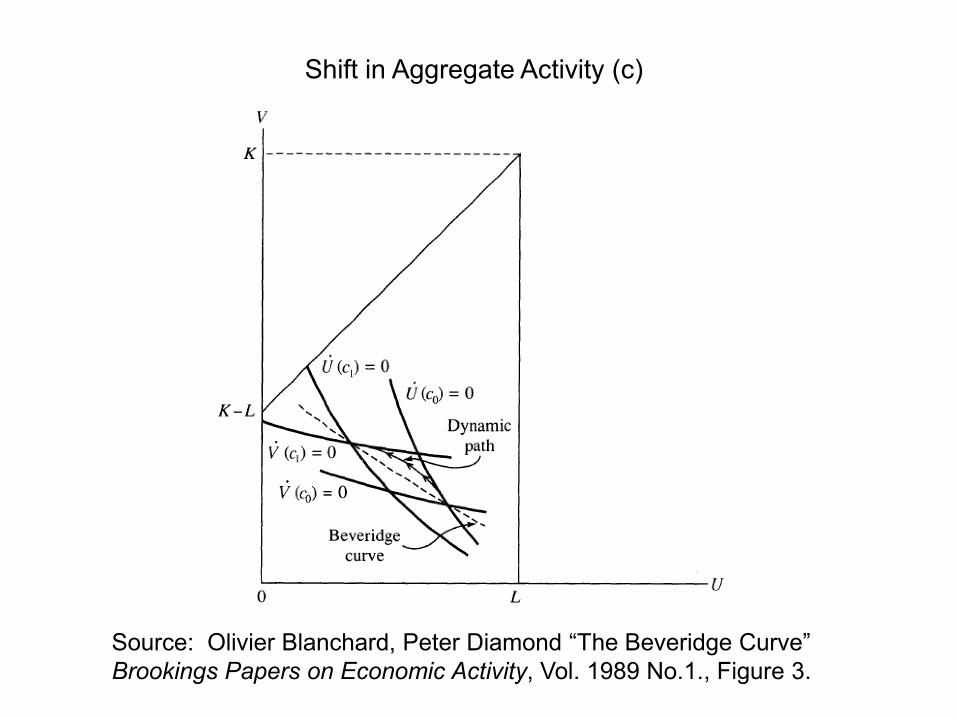
Shift in Aggregate Activity (c)
Source: Olivier Blanchard, Peter Diamond “The Beveridge Curve” Brookings Papers on Economic Activity, Vol. 1989 No.1., Figure 3.
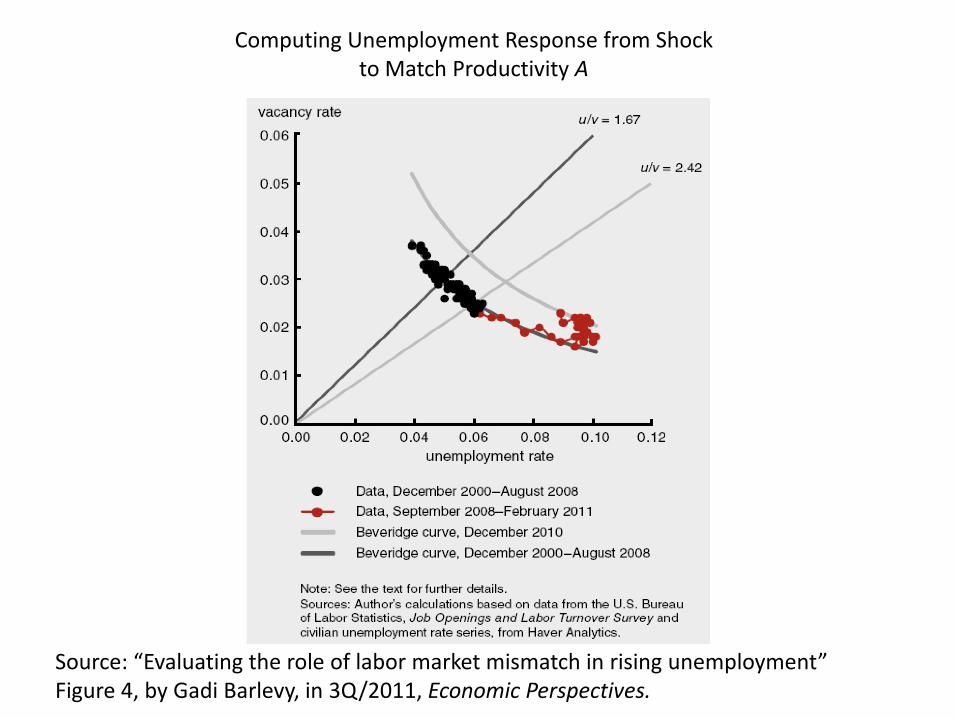
Source: “Evaluating the role of labor market mismatch in rising unemployment” Figure 4, by Gadi Barlevy, in 3Q/2011, Economic Perspectives.
Computing Unemployment Response from Shock to Match Productivity A
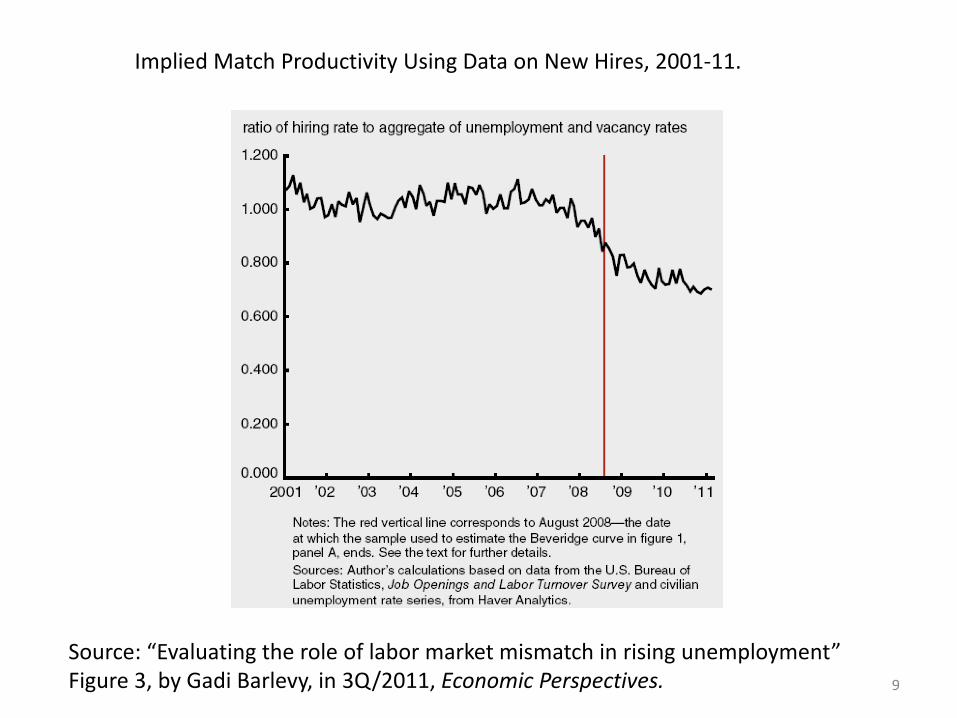
Implied Match Productivity Using Data on New Hires, 2001-11.
Source: “Evaluating the role of labor market mismatch in rising unemployment” Figure 3, by Gadi Barlevy, in 3Q/2011, Economic Perspectives. 9
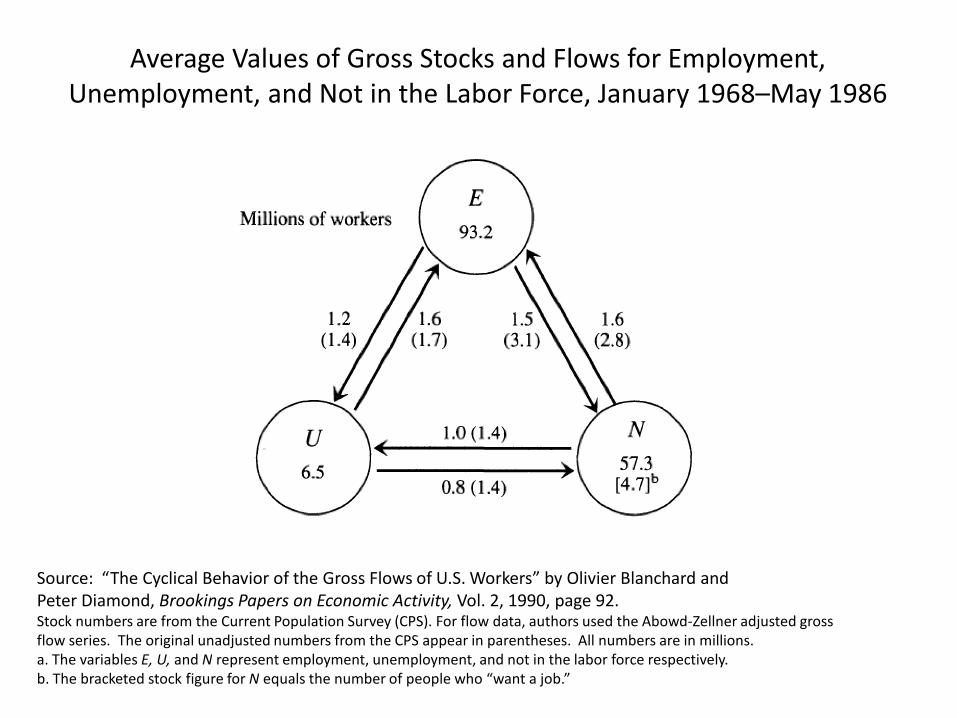
Average Values of Gross Stocks and Flows for Employment, Unemployment, and Not in the Labor Force, January 1968–May 1986
Source: “The Cyclical Behavior of the Gross Flows of U.S. Workers” by Olivier Blanchard and Peter Diamond, Brookings Papers on Economic Activity, Vol. 2, 1990, page 92. Stock numbers are from the Current Population Survey (CPS). For flow data, authors used the Abowd-Zellner adjusted gross flow series. The original unadjusted numbers from the CPS appear in parentheses. All numbers are in millions. a. The variables E, U, and N represent employment, unemployment, and not in the labor force respectively. b. The bracketed stock figure for N equals the number of people who “want a job.”
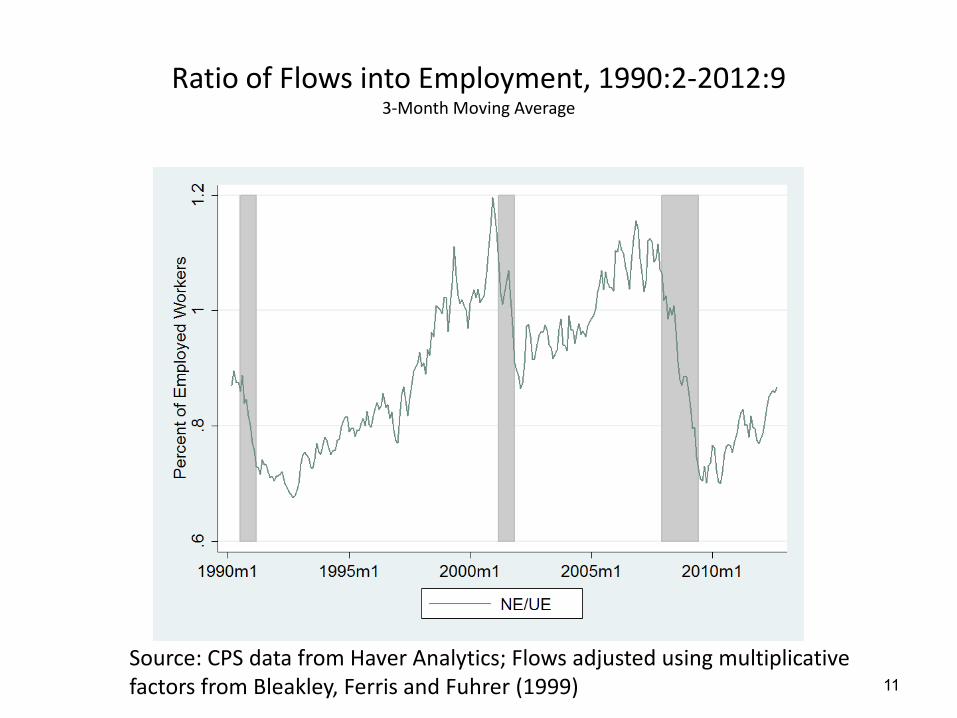
Ratio of Flows into Employment, 1990:2-2012:9 3-Month Moving Average
11 Source: CPS data from Haver Analytics; Flows adjusted using multiplicative factors from Bleakley, Ferris and Fuhrer (1999)
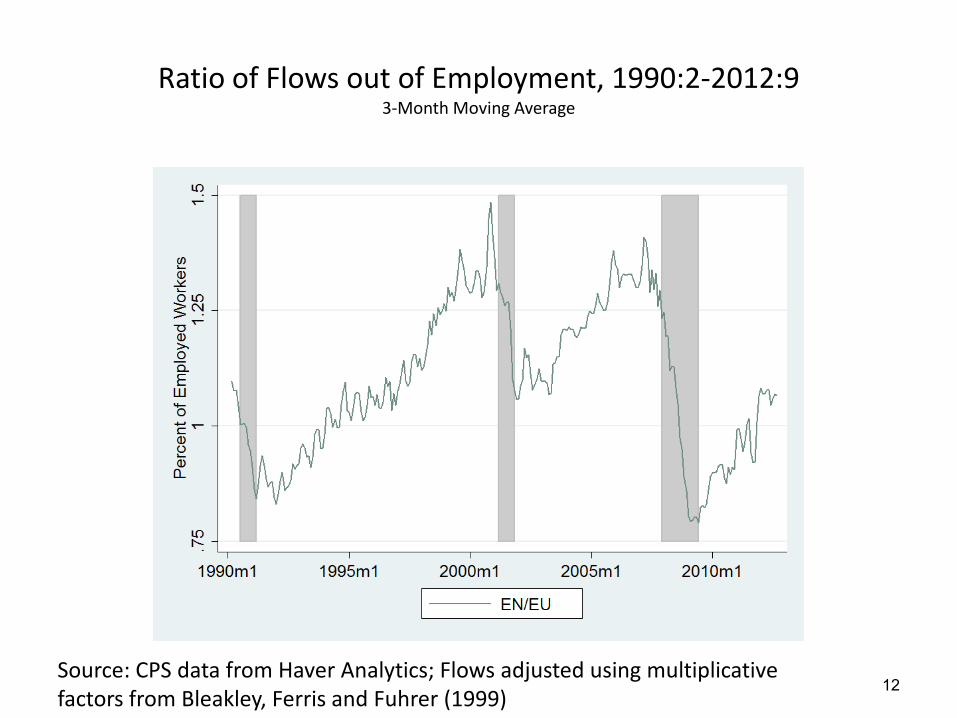
Ratio of Flows out of Employment, 1990:2-2012:9 3-Month Moving Average
12 Source: CPS data from Haver Analytics; Flows adjusted using multiplicative factors from Bleakley, Ferris and Fuhrer (1999)
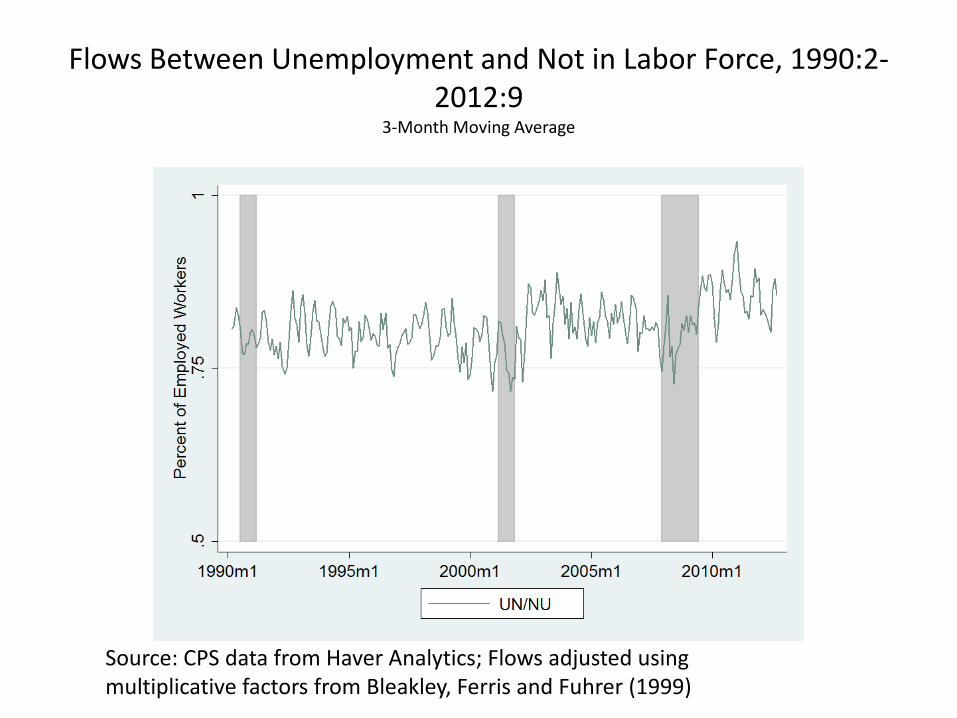
Flows Between Unemployment and Not in Labor Force, 1990:2-2012:9
3-Month Moving Average
Source: CPS data from Haver Analytics; Flows adjusted using multiplicative factors from Bleakley, Ferris and Fuhrer (1999)
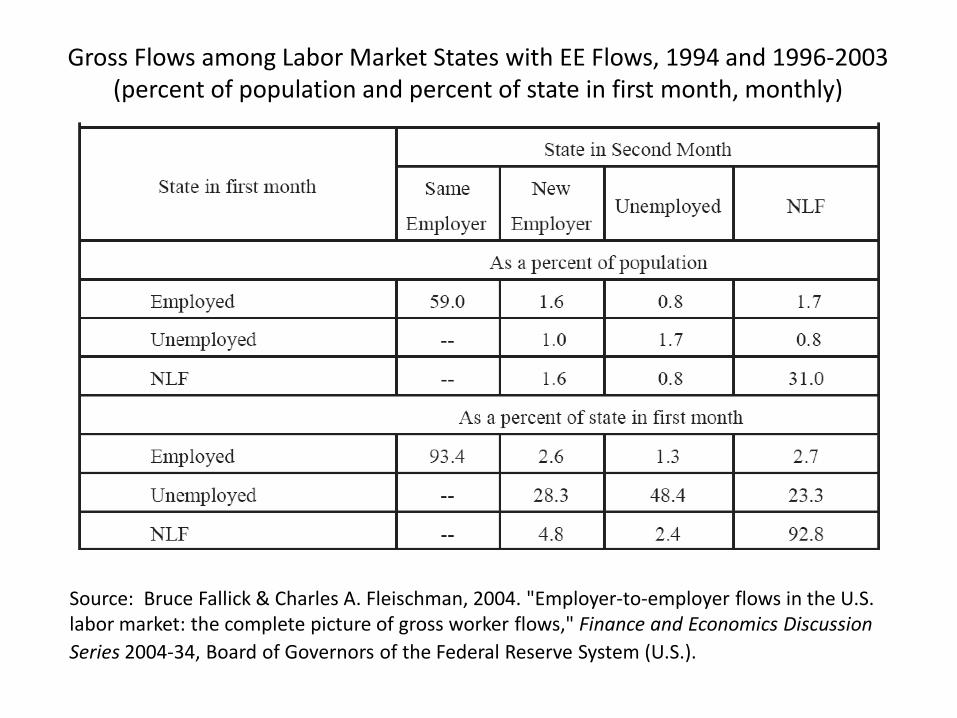
Gross Flows among Labor Market States with EE Flows, 1994 and 1996-2003 (percent of population and percent of state in first month, monthly)
Source: Bruce Fallick & Charles A. Fleischman, 2004. "Employer-to-employer flows in the U.S. labor market: the complete picture of gross worker flows," Finance and Economics Discussion Series 2004-34, Board of Governors of the Federal Reserve System (U.S.).
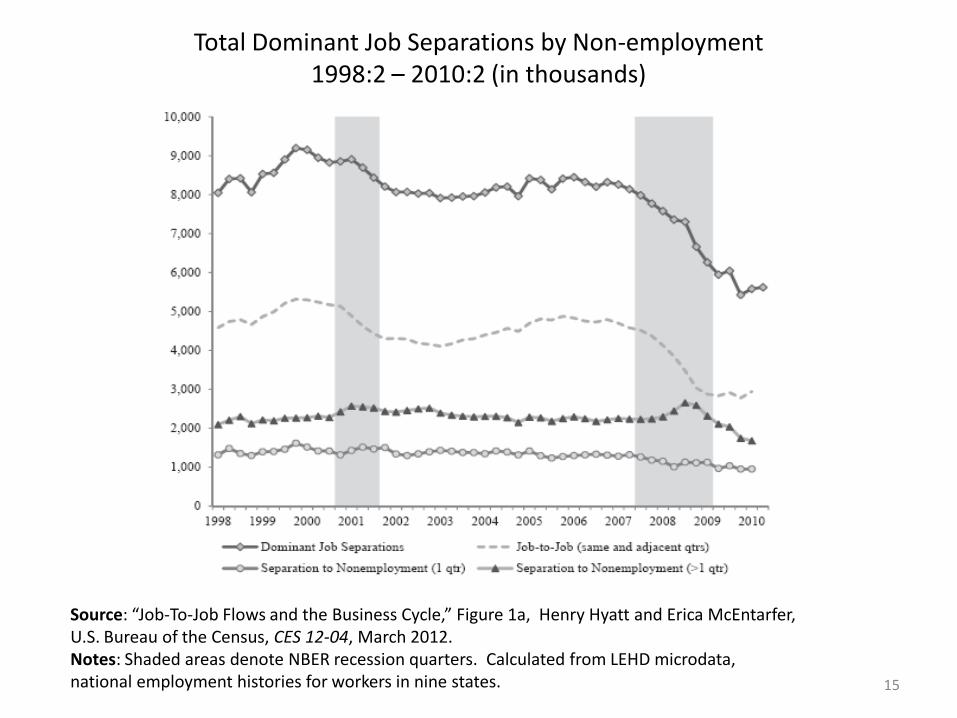
Total Dominant Job Separations by Non-employment 1998:2 – 2010:2 (in thousands)
Source: “Job-To-Job Flows and the Business Cycle,” Figure 1a, Henry Hyatt and Erica McEntarfer, U.S. Bureau of the Census, CES 12-04, March 2012. Notes: Shaded areas denote NBER recession quarters. Calculated from LEHD microdata, national employment histories for workers in nine states. 15
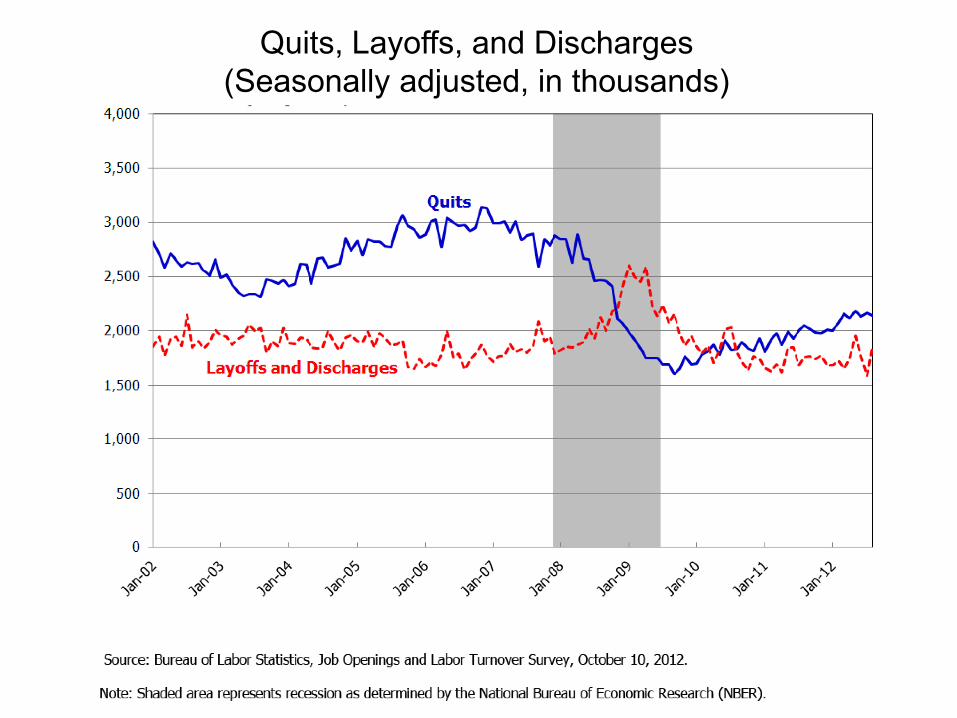
Quits, Layoffs, and Discharges (Seasonally adjusted, in thousands)
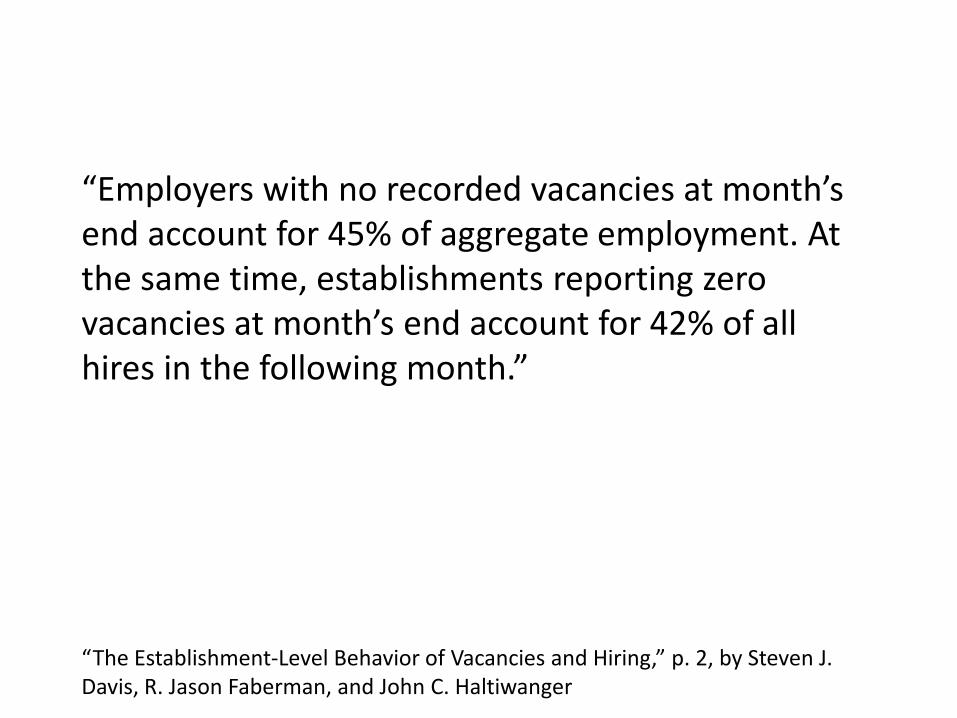
“Employers with no recorded vacancies at month’s end account for 45% of aggregate employment. At the same time, establishments reporting zero vacancies at month’s end account for 42% of all hires in the following month.”
“The Establishment-Level Behavior of Vacancies and Hiring,” p. 2, by Steven J. Davis, R. Jason Faberman, and John C. Haltiwanger
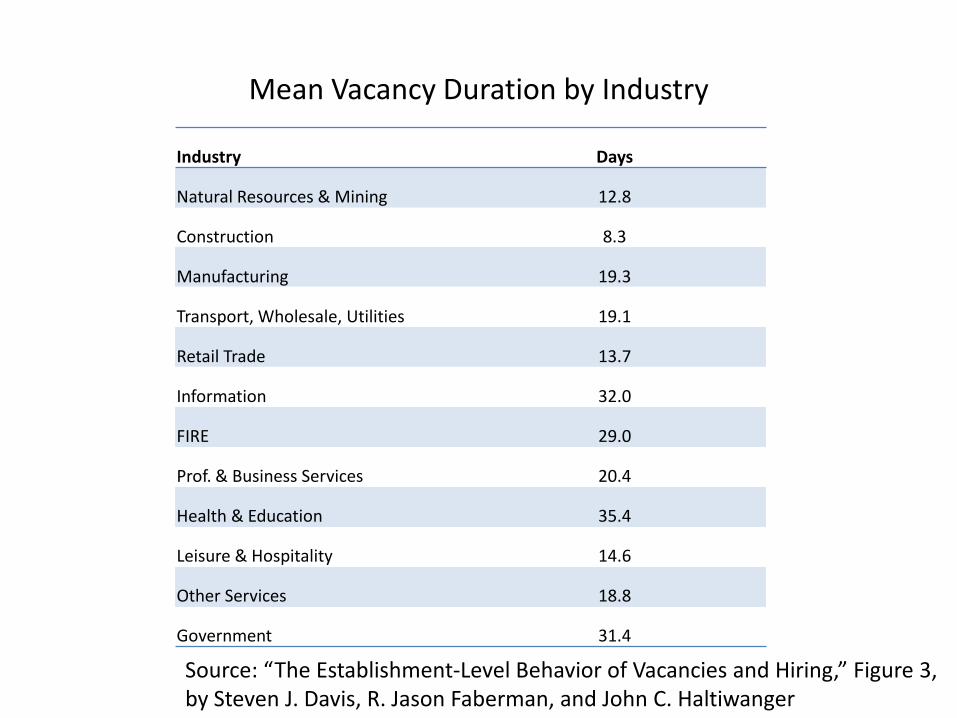
Mean Vacancy Duration by Industry
Industry Days
Natural Resources & Mining 12.8
Construction 8.3
Manufacturing 19.3
Transport, Wholesale, Utilities 19.1
Retail Trade 13.7
Information 32.0
FIRE 29.0
Prof. & Business Services 20.4
Health & Education 35.4
Leisure & Hospitality 14.6
Other Services 18.8
Government 31.4
Source: “The Establishment-Level Behavior of Vacancies and Hiring,” Figure 3, by Steven J. Davis, R. Jason Faberman, and John C. Haltiwanger
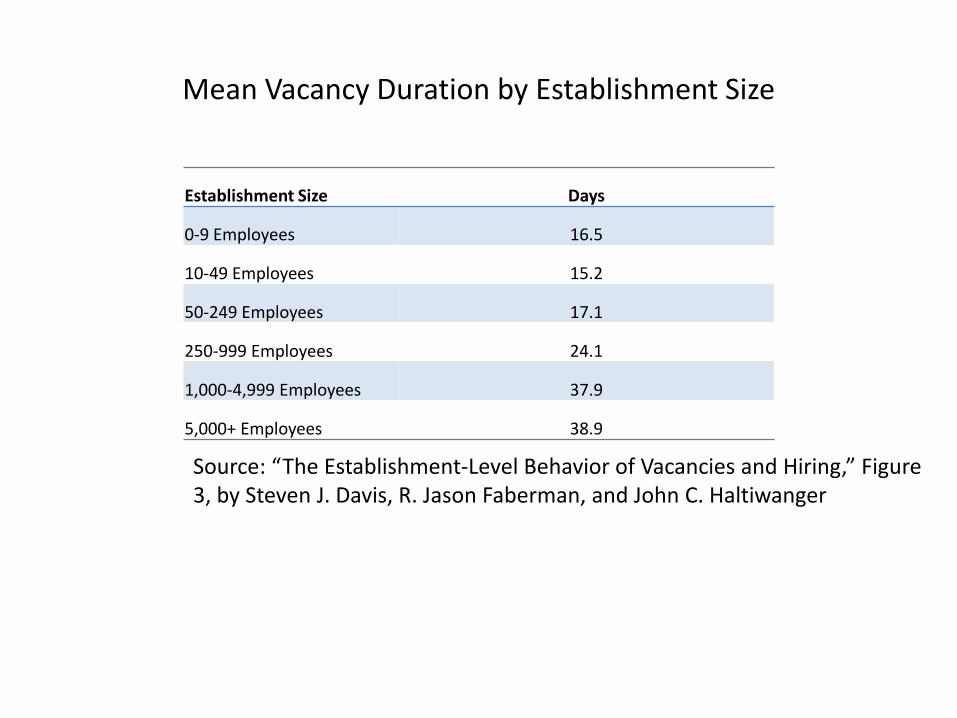
Mean Vacancy Duration by Establishment Size
Establishment Size Days
0-9 Employees 16.5
10-49 Employees 15.2
50-249 Employees 17.1
250-999 Employees 24.1
1,000-4,999 Employees 37.9
5,000+ Employees 38.9
Source: “The Establishment-Level Behavior of Vacancies and Hiring,” Figure 3, by Steven J. Davis, R. Jason Faberman, and John C. Haltiwanger
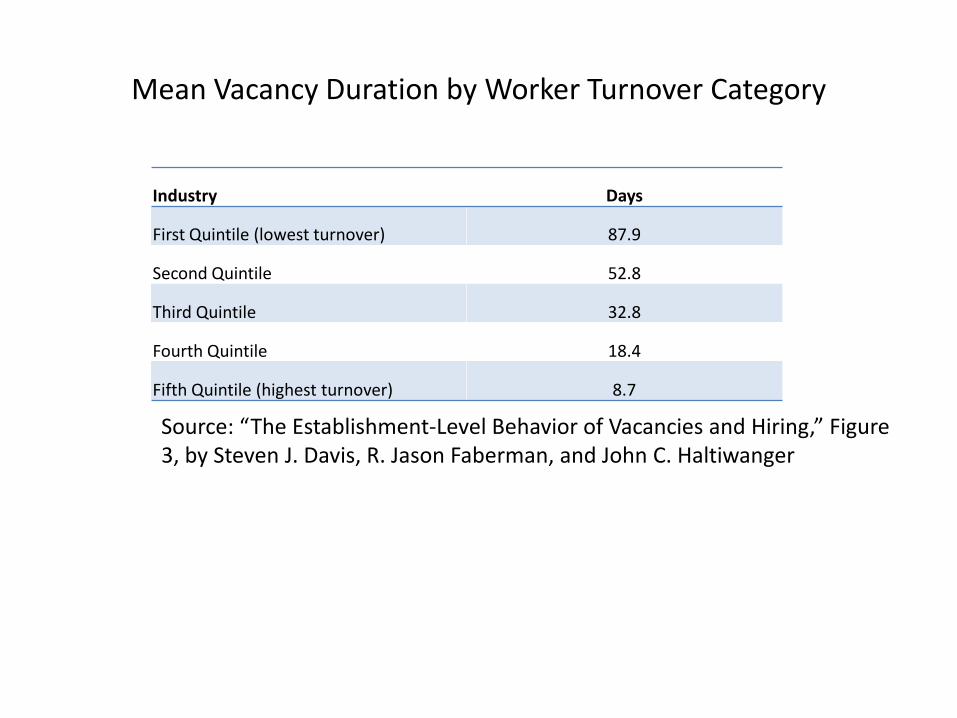
Mean Vacancy Duration by Worker Turnover Category
Industry Days
First Quintile (lowest turnover) 87.9
Second Quintile 52.8
Third Quintile 32.8
Fourth Quintile 18.4
Fifth Quintile (highest turnover) 8.7
Source: “The Establishment-Level Behavior of Vacancies and Hiring,” Figure 3, by Steven J. Davis, R. Jason Faberman, and John C. Haltiwanger
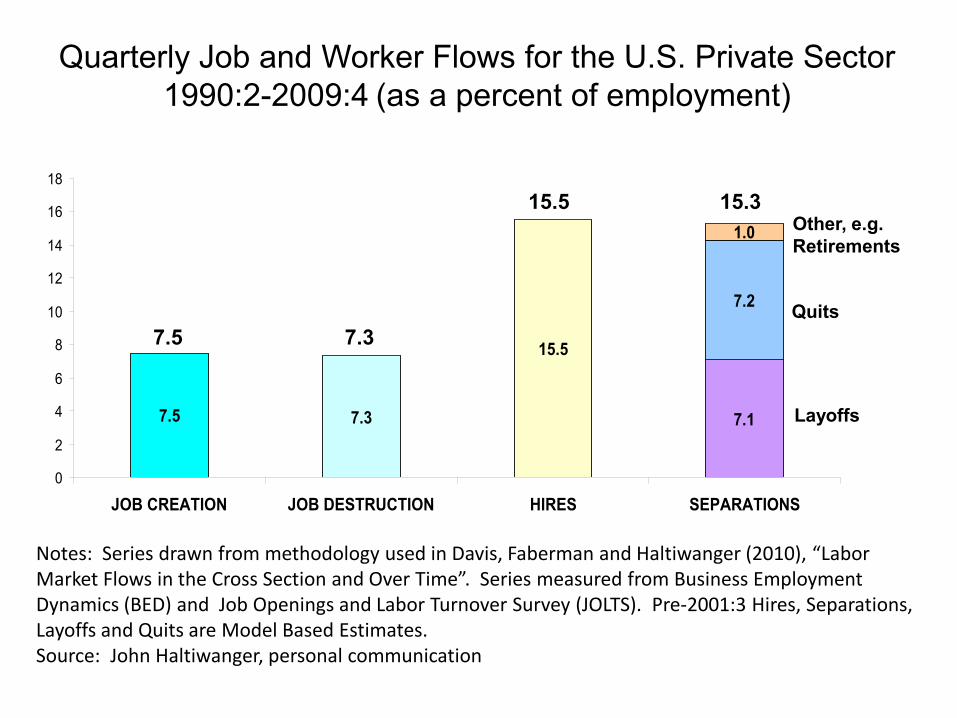
7.5 7.3
15.5
7.1
7.2
1.0
0
2
4
6
8
10
12
14
16
18
JOB CREATION JOB DESTRUCTION HIRES SEPARATIONS
Layoffs
Quits
Other, e.g. Retirements
Quarterly Job and Worker Flows for the U.S. Private Sector 1990:2-2009:4 (as a percent of employment)
Notes: Series drawn from methodology used in Davis, Faberman and Haltiwanger (2010), “Labor Market Flows in the Cross Section and Over Time”. Series measured from Business Employment Dynamics (BED) and Job Openings and Labor Turnover Survey (JOLTS). Pre-2001:3 Hires, Separations, Layoffs and Quits are Model Based Estimates. Source: John Haltiwanger, personal communication
15.3 15.5
7.5 7.3
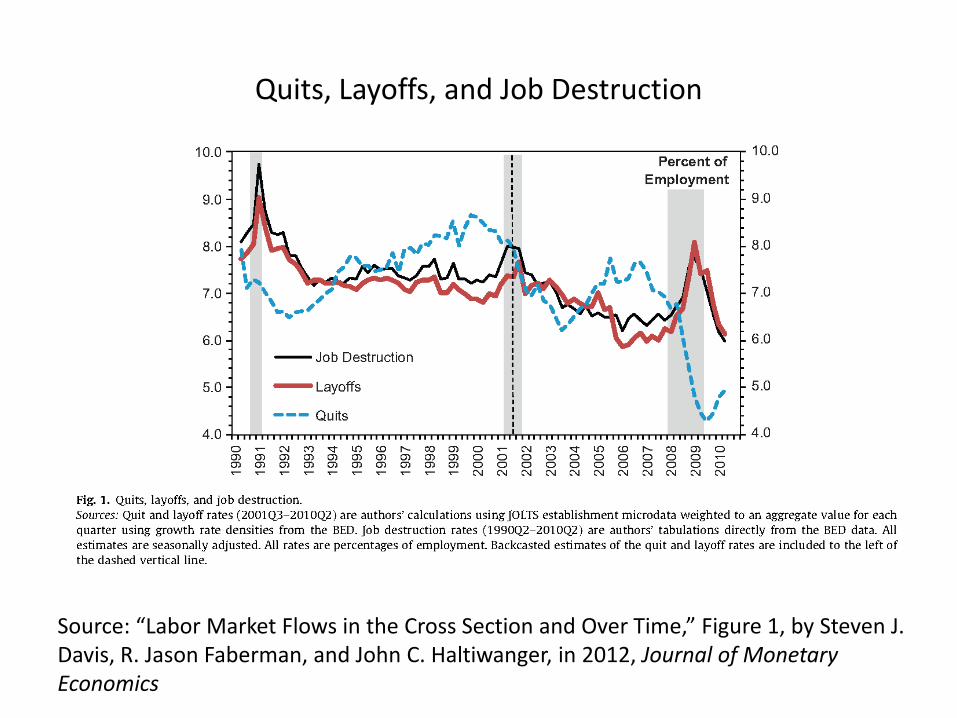
Quits, Layoffs, and Job Destruction
Source: “Labor Market Flows in the Cross Section and Over Time,” Figure 1, by Steven J. Davis, R. Jason Faberman, and John C. Haltiwanger, in 2012, Journal of Monetary Economics
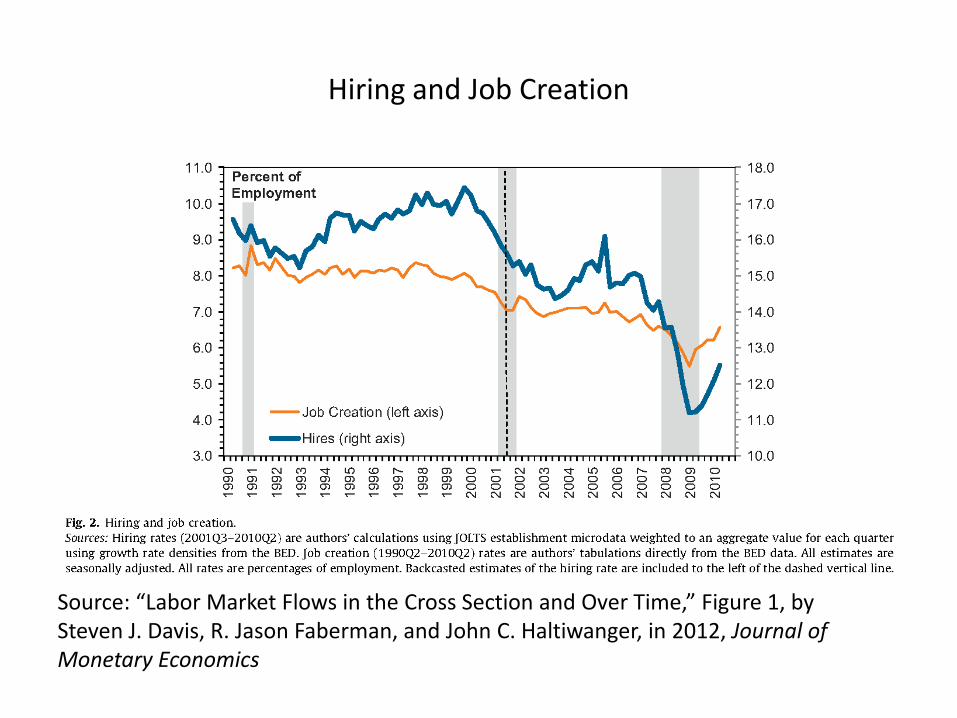
Hiring and Job Creation
Source: “Labor Market Flows in the Cross Section and Over Time,” Figure 1, by Steven J. Davis, R. Jason Faberman, and John C. Haltiwanger, in 2012, Journal of Monetary Economics
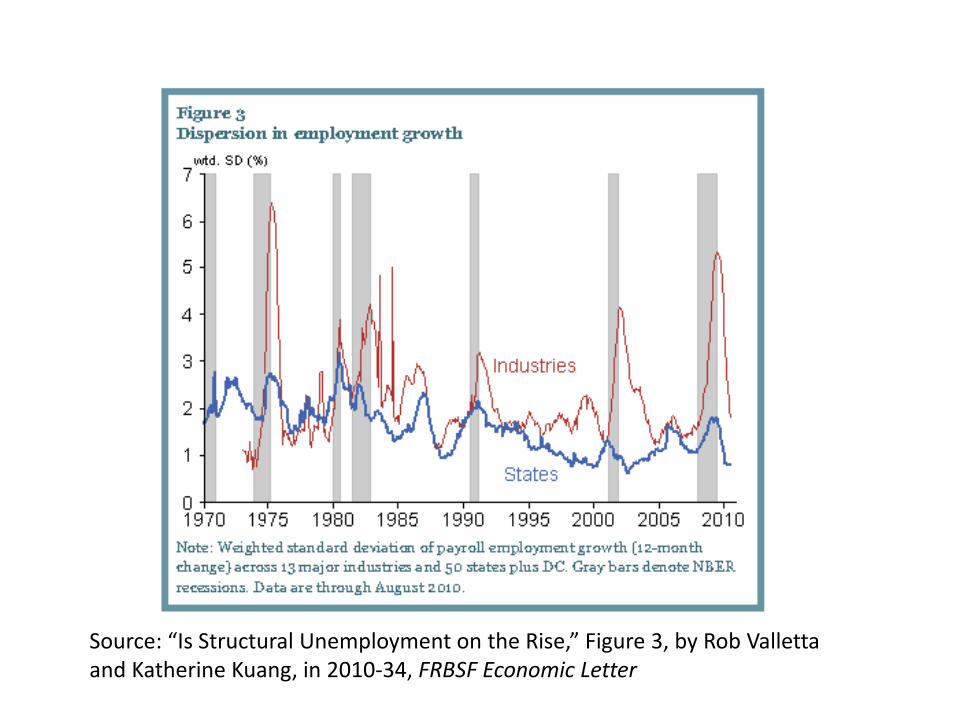
Source: “Is Structural Unemployment on the Rise,” Figure 3, by Rob Valletta and Katherine Kuang, in 2010-34, FRBSF Economic Letter
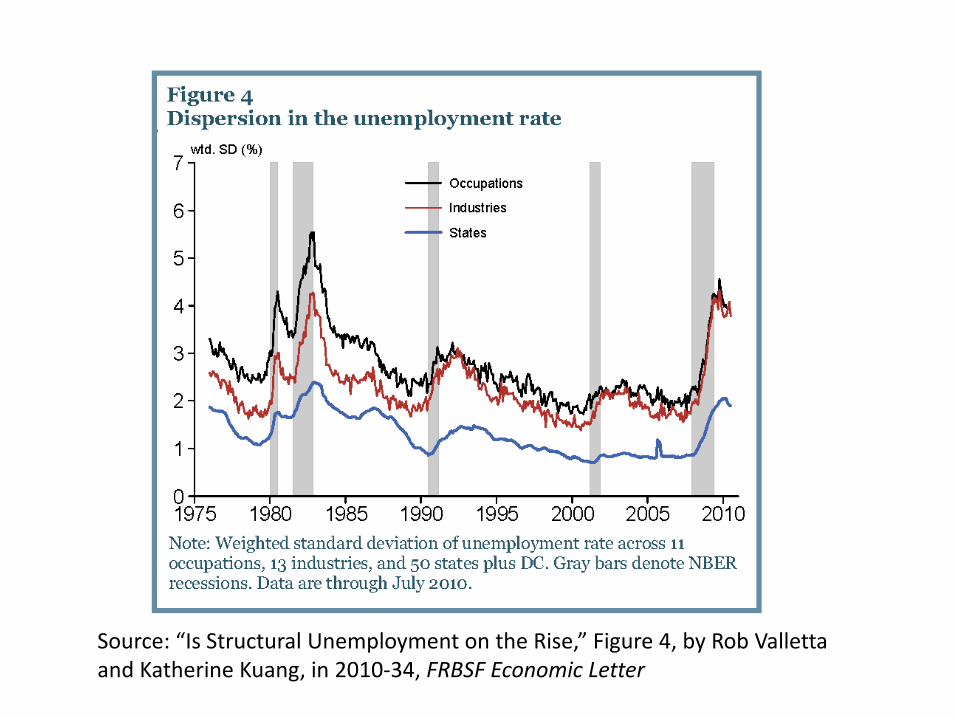
Source: “Is Structural Unemployment on the Rise,” Figure 4, by Rob Valletta and Katherine Kuang, in 2010-34, FRBSF Economic Letter