cyclist traffic light violations in dublin city · proceedings of the itrn2015 27-28th august 2015...
TRANSCRIPT
Proceedings of the
ITRN2015 27-28th August 2015 NUI Galway Richardson & Caulfield: Cyclist Safety
CYCLIST TRAFFIC LIGHT VIOLATIONS IN DUBLIN CITY
Matthew Richardson Department of Civil, Structural and Environmental Engineering, Trinity College Dublin Brian Caulfield Assistant Professor Department of Civil, Structural and Environmental Engineering, Trinity College Dublin Abstract
With the recent growth of cycling in the City, it is vital to accommodate and manage this growing demand by ensuring the safety and road discipline of cyclists. The high incidence of traffic light violations by cyclists poses a threat to Dublin’s rapidly growing reputation as one of the most cycle-friendly cities in the world. It is imperative that the issue of red light running by cyclists is addressed now. This study examines the impact of different infrastructure types and junction design on traffic light violations by cyclists in Dublin City, as well as the behavioural patterns and demographics of offending cyclists. Two data collection methods were used in this research; observational surveys and an online questionnaire. The results of the study show that almost half of the cyclists in Dublin City Centre are law-breaking, with young male cyclists being the least compliant with traffic signals. The results also suggest that cyclist behaviour is greatly influenced by infrastructural design/layout weaknesses and that the overwhelming majority of cyclists do not comply with the bicycle-specific traffic signals which have been introduced along cycle tracks in the city
Introduction
Dublin City has a larger working population than any other city in Ireland (CSO, 2011). The transportation network in Dublin City, which is predominantly designed for motorised traffic, is increasingly focussing on cycling facilities. This is a result of the large increase in cyclist volumes in Dublin in recent years. The City currently has a vast network of cycling facilities including 120km of on-road cycle lanes, 50km of shared cycle/bus lanes and 25km of off-road cycle tracks (Dublin City Cycling, 2014). There is however, an alarmingly low rate of compliance by cyclists with the rules of the road. This study measures the percentage of cyclists breaking the traffic lights in Dublin City and examines the behaviour and demographics of offending cyclists. It is important to decipher why cyclists violate traffic signals in order to guide local authorities making future investments to reduce such transgressions.
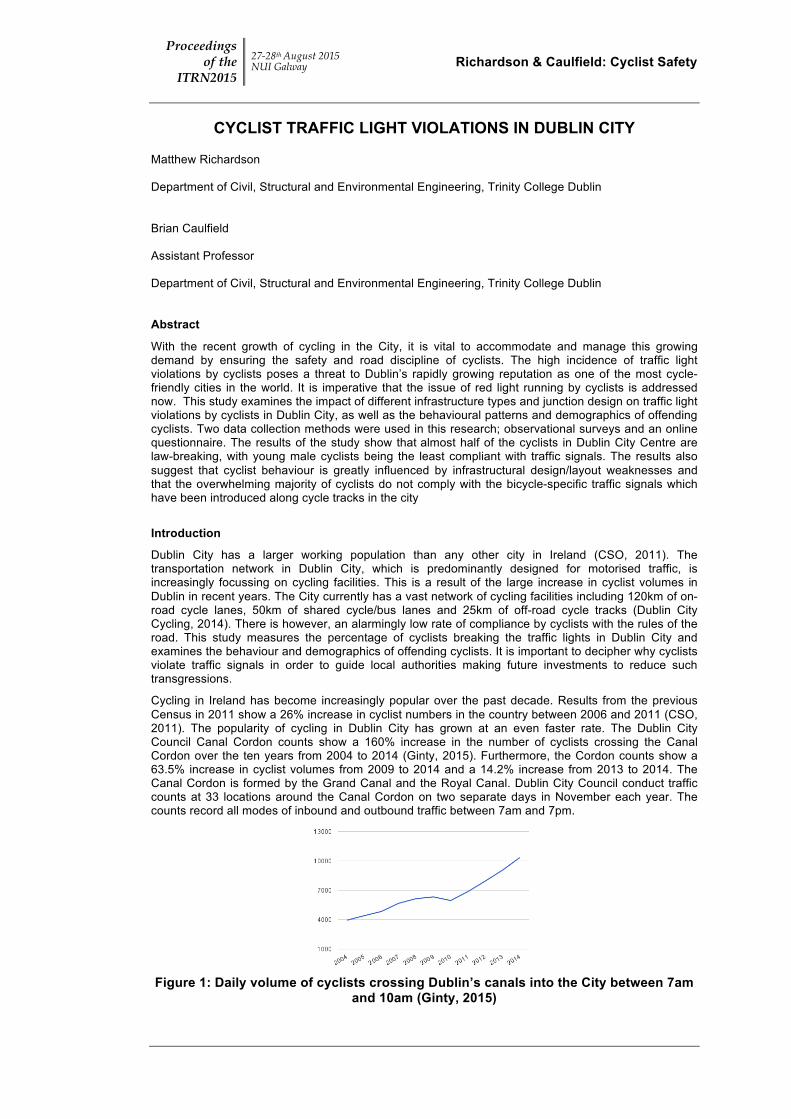
Cycling in Ireland has become increasingly popular over the past decade. Results from the previous Census in 2011 show a 26% increase in cyclist numbers in the country between 2006 and 2011 (CSO, 2011). The popularity of cycling in Dublin City has grown at an even faster rate. The Dublin City Council Canal Cordon counts show a 160% increase in the number of cyclists crossing the Canal Cordon over the ten years from 2004 to 2014 (Ginty, 2015). Furthermore, the Cordon counts show a 63.5% increase in cyclist volumes from 2009 to 2014 and a 14.2% increase from 2013 to 2014. The Canal Cordon is formed by the Grand Canal and the Royal Canal. Dublin City Council conduct traffic counts at 33 locations around the Canal Cordon on two separate days in November each year. The counts record all modes of inbound and outbound traffic between 7am and 7pm.
Figure 1: Daily volume of cyclists crossing Dublin’s canals into the City between 7am
and 10am (Ginty, 2015)
AUTHORS’ SURNAMES: Brief Title 27-28th August 2015 NUI Galway
Proceedings of the
ITRN2015
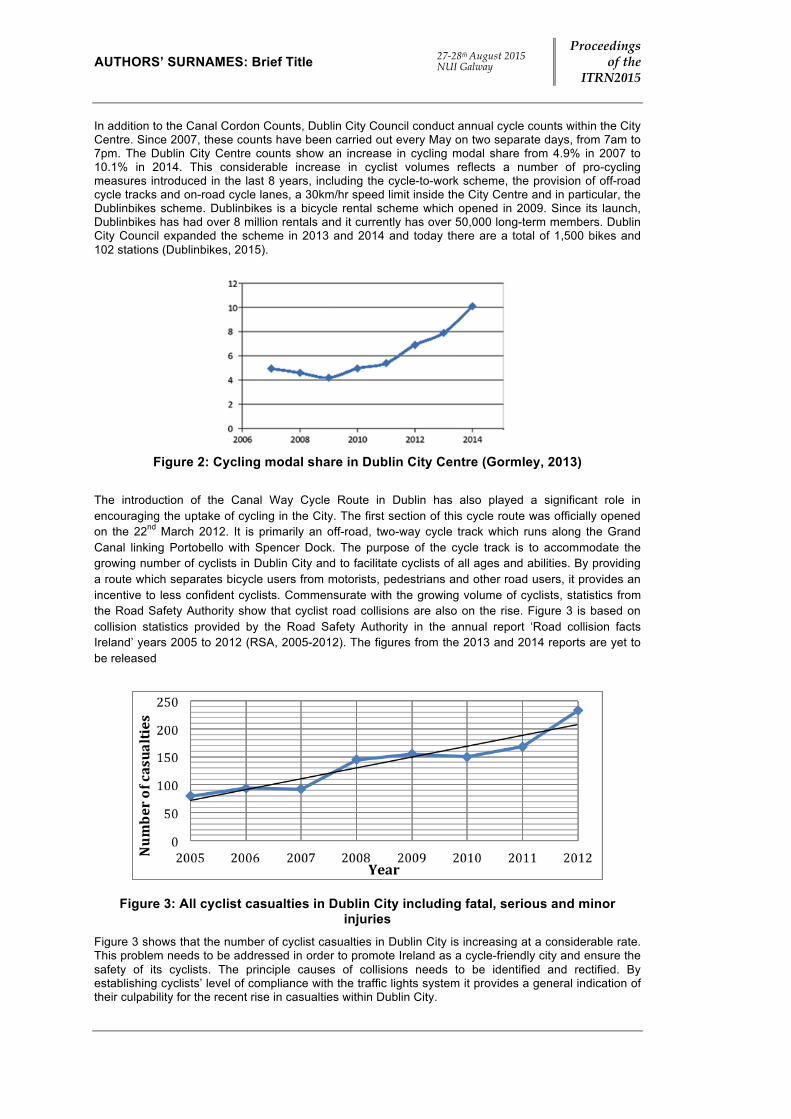
In addition to the Canal Cordon Counts, Dublin City Council conduct annual cycle counts within the City Centre. Since 2007, these counts have been carried out every May on two separate days, from 7am to 7pm. The Dublin City Centre counts show an increase in cycling modal share from 4.9% in 2007 to 10.1% in 2014. This considerable increase in cyclist volumes reflects a number of pro-cycling measures introduced in the last 8 years, including the cycle-to-work scheme, the provision of off-road cycle tracks and on-road cycle lanes, a 30km/hr speed limit inside the City Centre and in particular, the Dublinbikes scheme. Dublinbikes is a bicycle rental scheme which opened in 2009. Since its launch, Dublinbikes has had over 8 million rentals and it currently has over 50,000 long-term members. Dublin City Council expanded the scheme in 2013 and 2014 and today there are a total of 1,500 bikes and 102 stations (Dublinbikes, 2015).
Figure 2: Cycling modal share in Dublin City Centre (Gormley, 2013)
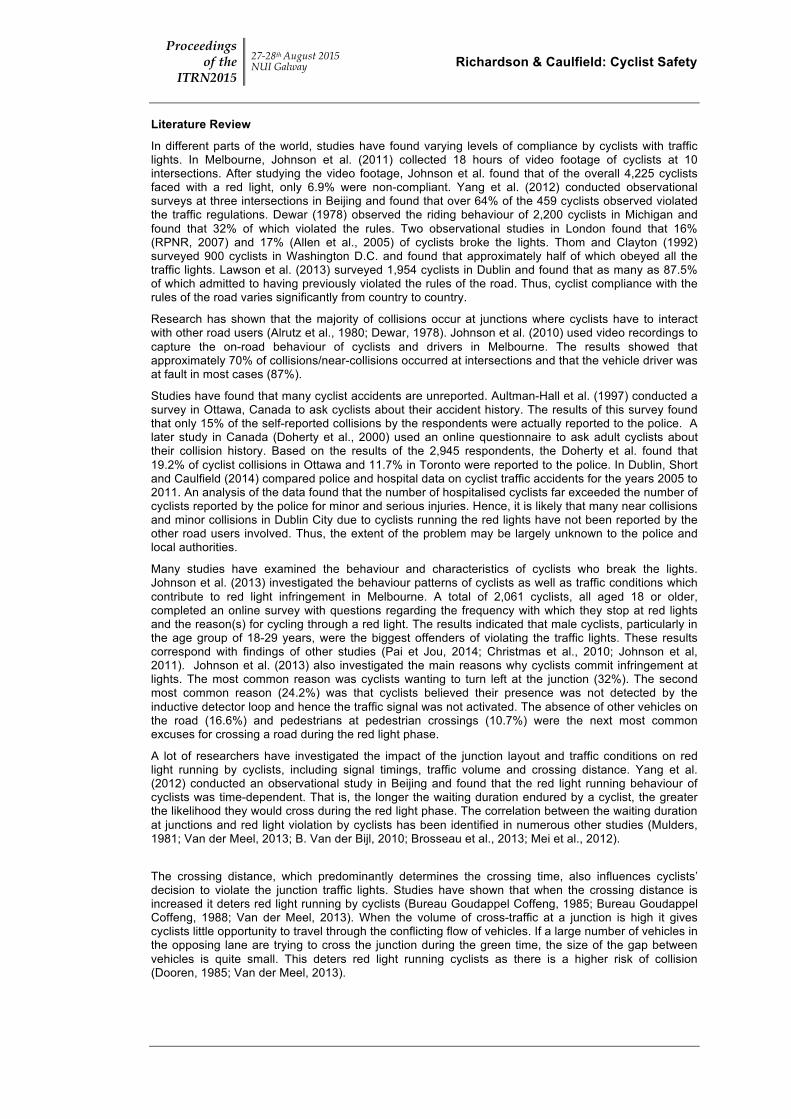
The introduction of the Canal Way Cycle Route in Dublin has also played a significant role in encouraging the uptake of cycling in the City. The first section of this cycle route was officially opened on the 22nd March 2012. It is primarily an off-road, two-way cycle track which runs along the Grand Canal linking Portobello with Spencer Dock. The purpose of the cycle track is to accommodate the growing number of cyclists in Dublin City and to facilitate cyclists of all ages and abilities. By providing a route which separates bicycle users from motorists, pedestrians and other road users, it provides an incentive to less confident cyclists. Commensurate with the growing volume of cyclists, statistics from the Road Safety Authority show that cyclist road collisions are also on the rise. Figure 3 is based on collision statistics provided by the Road Safety Authority in the annual report ‘Road collision facts Ireland’ years 2005 to 2012 (RSA, 2005-2012). The figures from the 2013 and 2014 reports are yet to be released
Figure 3: All cyclist casualties in Dublin City including fatal, serious and minor injuries
Figure 3 shows that the number of cyclist casualties in Dublin City is increasing at a considerable rate. This problem needs to be addressed in order to promote Ireland as a cycle-friendly city and ensure the safety of its cyclists. The principle causes of collisions needs to be identified and rectified. By establishing cyclists’ level of compliance with the traffic lights system it provides a general indication of their culpability for the recent rise in casualties within Dublin City.
Proceedings of the
ITRN2015 27-28th August 2015 NUI Galway Richardson & Caulfield: Cyclist Safety
Literature Review
In different parts of the world, studies have found varying levels of compliance by cyclists with traffic lights. In Melbourne, Johnson et al. (2011) collected 18 hours of video footage of cyclists at 10 intersections. After studying the video footage, Johnson et al. found that of the overall 4,225 cyclists faced with a red light, only 6.9% were non-compliant. Yang et al. (2012) conducted observational surveys at three intersections in Beijing and found that over 64% of the 459 cyclists observed violated the traffic regulations. Dewar (1978) observed the riding behaviour of 2,200 cyclists in Michigan and found that 32% of which violated the rules. Two observational studies in London found that 16% (RPNR, 2007) and 17% (Allen et al., 2005) of cyclists broke the lights. Thom and Clayton (1992) surveyed 900 cyclists in Washington D.C. and found that approximately half of which obeyed all the traffic lights. Lawson et al. (2013) surveyed 1,954 cyclists in Dublin and found that as many as 87.5% of which admitted to having previously violated the rules of the road. Thus, cyclist compliance with the rules of the road varies significantly from country to country.
Research has shown that the majority of collisions occur at junctions where cyclists have to interact with other road users (Alrutz et al., 1980; Dewar, 1978). Johnson et al. (2010) used video recordings to capture the on-road behaviour of cyclists and drivers in Melbourne. The results showed that approximately 70% of collisions/near-collisions occurred at intersections and that the vehicle driver was at fault in most cases (87%).
Studies have found that many cyclist accidents are unreported. Aultman-Hall et al. (1997) conducted a survey in Ottawa, Canada to ask cyclists about their accident history. The results of this survey found that only 15% of the self-reported collisions by the respondents were actually reported to the police. A later study in Canada (Doherty et al., 2000) used an online questionnaire to ask adult cyclists about their collision history. Based on the results of the 2,945 respondents, the Doherty et al. found that 19.2% of cyclist collisions in Ottawa and 11.7% in Toronto were reported to the police. In Dublin, Short and Caulfield (2014) compared police and hospital data on cyclist traffic accidents for the years 2005 to 2011. An analysis of the data found that the number of hospitalised cyclists far exceeded the number of cyclists reported by the police for minor and serious injuries. Hence, it is likely that many near collisions and minor collisions in Dublin City due to cyclists running the red lights have not been reported by the other road users involved. Thus, the extent of the problem may be largely unknown to the police and local authorities.
Many studies have examined the behaviour and characteristics of cyclists who break the lights. Johnson et al. (2013) investigated the behaviour patterns of cyclists as well as traffic conditions which contribute to red light infringement in Melbourne. A total of 2,061 cyclists, all aged 18 or older, completed an online survey with questions regarding the frequency with which they stop at red lights and the reason(s) for cycling through a red light. The results indicated that male cyclists, particularly in the age group of 18-29 years, were the biggest offenders of violating the traffic lights. These results correspond with findings of other studies (Pai et Jou, 2014; Christmas et al., 2010; Johnson et al, 2011). Johnson et al. (2013) also investigated the main reasons why cyclists commit infringement at lights. The most common reason was cyclists wanting to turn left at the junction (32%). The second most common reason (24.2%) was that cyclists believed their presence was not detected by the inductive detector loop and hence the traffic signal was not activated. The absence of other vehicles on the road (16.6%) and pedestrians at pedestrian crossings (10.7%) were the next most common excuses for crossing a road during the red light phase.
A lot of researchers have investigated the impact of the junction layout and traffic conditions on red light running by cyclists, including signal timings, traffic volume and crossing distance. Yang et al. (2012) conducted an observational study in Beijing and found that the red light running behaviour of cyclists was time-dependent. That is, the longer the waiting duration endured by a cyclist, the greater the likelihood they would cross during the red light phase. The correlation between the waiting duration at junctions and red light violation by cyclists has been identified in numerous other studies (Mulders, 1981; Van der Meel, 2013; B. Van der Bijl, 2010; Brosseau et al., 2013; Mei et al., 2012).
The crossing distance, which predominantly determines the crossing time, also influences cyclists’ decision to violate the junction traffic lights. Studies have shown that when the crossing distance is increased it deters red light running by cyclists (Bureau Goudappel Coffeng, 1985; Bureau Goudappel Coffeng, 1988; Van der Meel, 2013). When the volume of cross-traffic at a junction is high it gives cyclists little opportunity to travel through the conflicting flow of vehicles. If a large number of vehicles in the opposing lane are trying to cross the junction during the green time, the size of the gap between vehicles is quite small. This deters red light running cyclists as there is a higher risk of collision (Dooren, 1985; Van der Meel, 2013).
AUTHORS’ SURNAMES: Brief Title 27-28th August 2015 NUI Galway
Proceedings of the
ITRN2015
Despite the importance of previous studies, some research gaps still exist. No studies have compared the behaviour of Dublinbike users with regular (non-rental) bicycle users in Dublin City. Furthermore, no studies have examined the behaviour of rental bike users in foreign cities where a public bicycle sharing system exists.
The impact of cycle infrastructure on red light running has only been addressed by Cole et al. (2011) and Monsere et al. (2011). Despite the fact that both studies were conducted in Oregon, America and in the same year, different conclusions were drawn. Monsere et al. (2011) found similar rates of traffic light violation by cyclists on both cycle lanes and road-segregated cycle tracks, whereas Cole et al. (2011) found that cycle lane users were much more compliant with traffic lights.
Cyclist compliance with bicycle-specific traffic signals and regular traffic signals has been compared by four studies (Arason, 2014; Hilkevitch, 2013; Korve and Niemeier, 2002; Monsere et al., 2013). The findings were not fully consistent; three of the studies found bicycle-specific signals to have a deterrent effect on red light running, while one study found cyclist compliance to be largely the same with both traffic signal systems. Although the majority of the studies reached a similar conclusion, another cause for concern is the fact that all four studies were conducted in America and thus may not be entirely representative of cyclist behaviour elsewhere in the world.
Due to the paucity of research on the associated behaviour of cyclists with different cycle infrastructure (i.e. on-road and off-road cycle routes), bicycle-specific traffic lights and rental bicycles, this study has taken the opportunity to explore these research gaps. Segregated cycle tracks, bicycle traffic signals and the Dublinbikes scheme have all been introduced to Dublin City in recent years, with further development plans on the way. It is therefore critical to identify now the extent to which each impact on red light running by cyclists. Methods
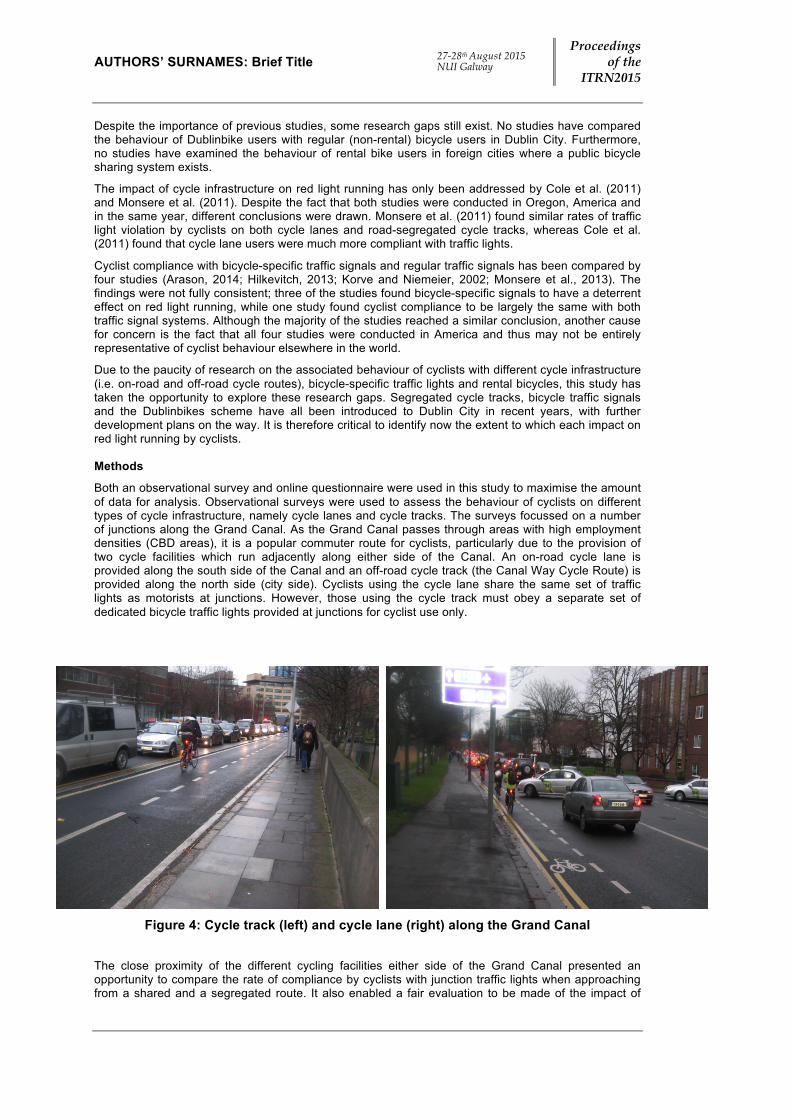
Both an observational survey and online questionnaire were used in this study to maximise the amount of data for analysis. Observational surveys were used to assess the behaviour of cyclists on different types of cycle infrastructure, namely cycle lanes and cycle tracks. The surveys focussed on a number of junctions along the Grand Canal. As the Grand Canal passes through areas with high employment densities (CBD areas), it is a popular commuter route for cyclists, particularly due to the provision of two cycle facilities which run adjacently along either side of the Canal. An on-road cycle lane is provided along the south side of the Canal and an off-road cycle track (the Canal Way Cycle Route) is provided along the north side (city side). Cyclists using the cycle lane share the same set of traffic lights as motorists at junctions. However, those using the cycle track must obey a separate set of dedicated bicycle traffic lights provided at junctions for cyclist use only.
Figure 4: Cycle track (left) and cycle lane (right) along the Grand Canal
The close proximity of the different cycling facilities either side of the Grand Canal presented an opportunity to compare the rate of compliance by cyclists with junction traffic lights when approaching from a shared and a segregated route. It also enabled a fair evaluation to be made of the impact of
Proceedings of the
ITRN2015 27-28th August 2015 NUI Galway Richardson & Caulfield: Cyclist Safety
different traffic light systems on red light running by cyclists i.e. motorist/shared traffic lights and bicycle traffic lights.
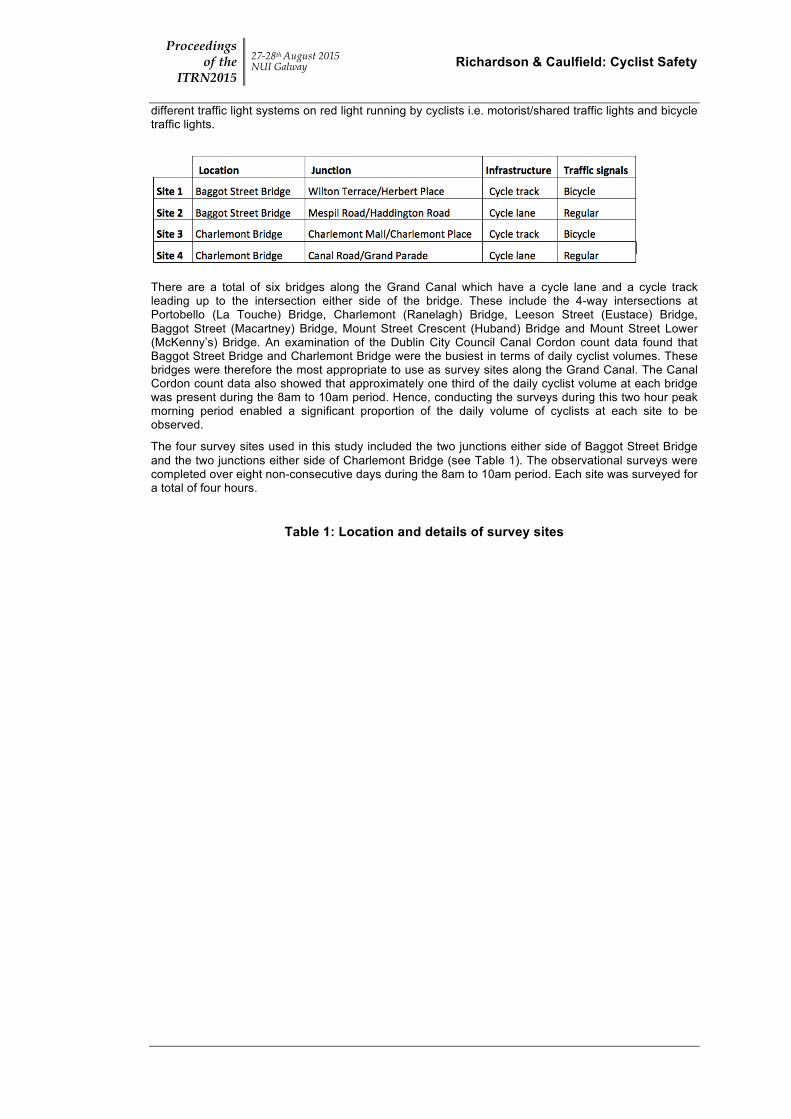
There are a total of six bridges along the Grand Canal which have a cycle lane and a cycle track leading up to the intersection either side of the bridge. These include the 4-way intersections at Portobello (La Touche) Bridge, Charlemont (Ranelagh) Bridge, Leeson Street (Eustace) Bridge, Baggot Street (Macartney) Bridge, Mount Street Crescent (Huband) Bridge and Mount Street Lower (McKenny’s) Bridge. An examination of the Dublin City Council Canal Cordon count data found that Baggot Street Bridge and Charlemont Bridge were the busiest in terms of daily cyclist volumes. These bridges were therefore the most appropriate to use as survey sites along the Grand Canal. The Canal Cordon count data also showed that approximately one third of the daily cyclist volume at each bridge was present during the 8am to 10am period. Hence, conducting the surveys during this two hour peak morning period enabled a significant proportion of the daily volume of cyclists at each site to be observed.
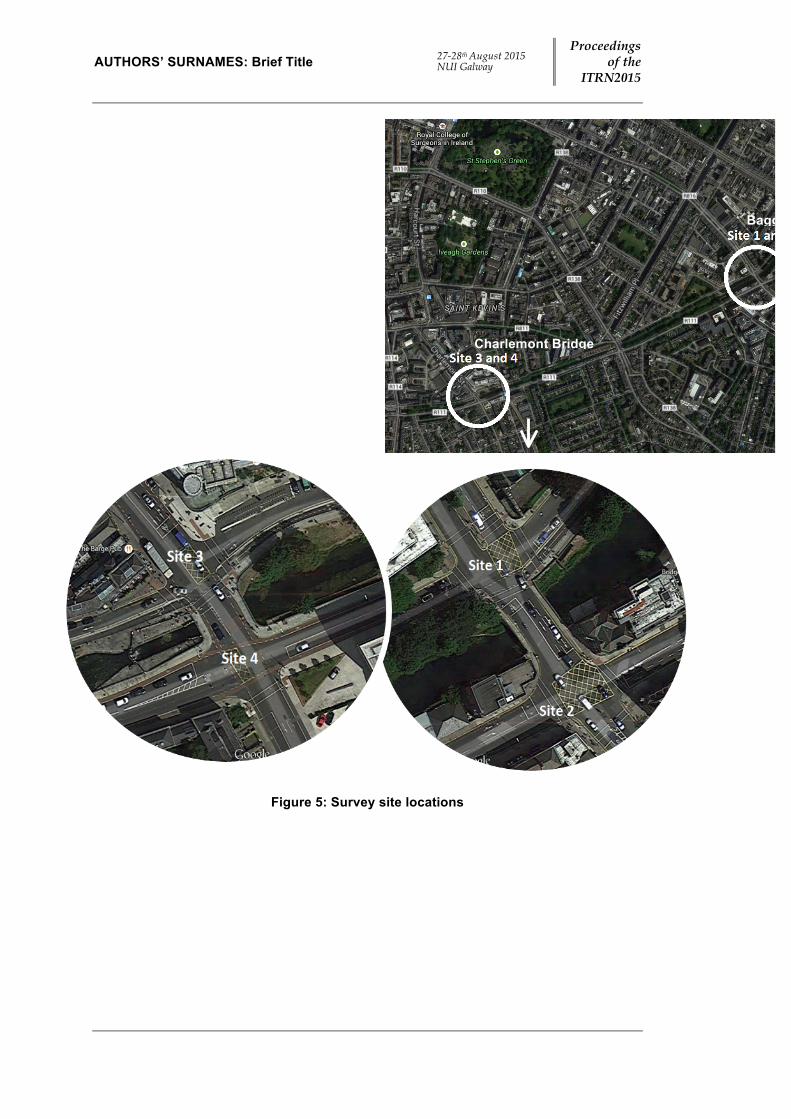
The four survey sites used in this study included the two junctions either side of Baggot Street Bridge and the two junctions either side of Charlemont Bridge (see Table 1). The observational surveys were completed over eight non-consecutive days during the 8am to 10am period. Each site was surveyed for a total of four hours.
Table 1: Location and details of survey sites
AUTHORS’ SURNAMES: Brief Title 27-28th August 2015 NUI Galway
Proceedings of the
ITRN2015
Figure 5: Survey site locations
Baggot Street Bridge
Charlemont Bridge
Proceedings of the
ITRN2015 27-28th August 2015 NUI Galway Richardson & Caulfield: Cyclist Safety
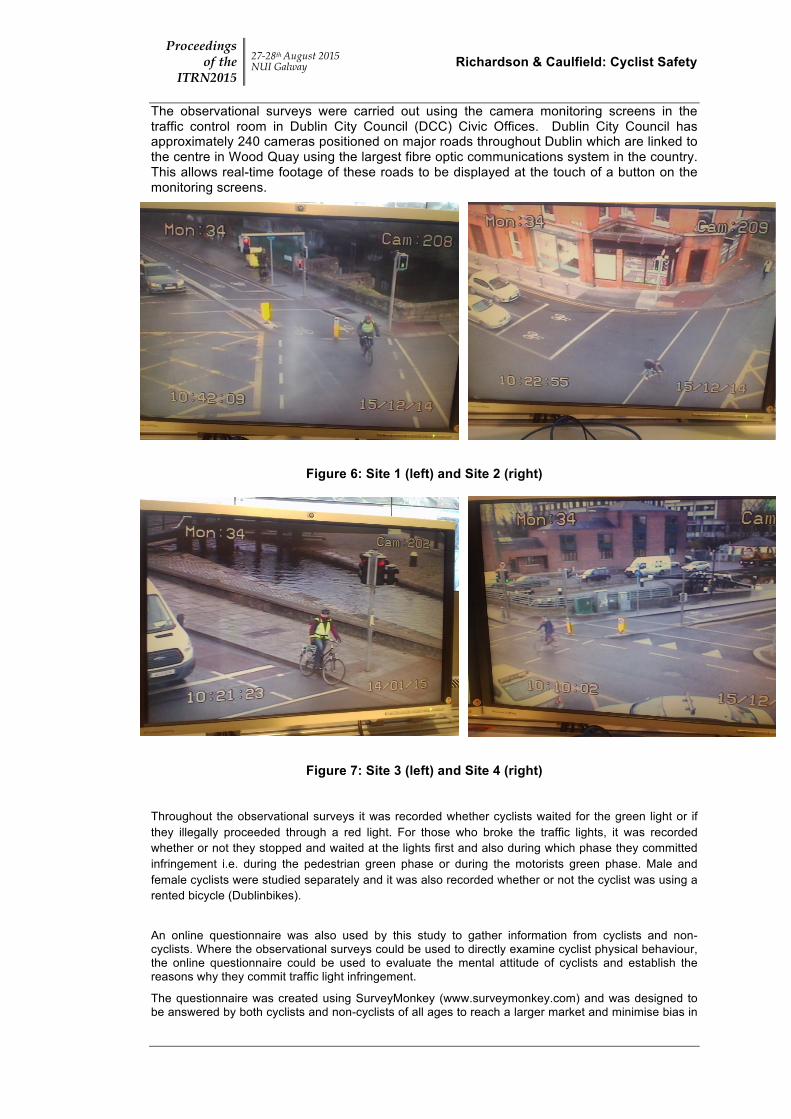
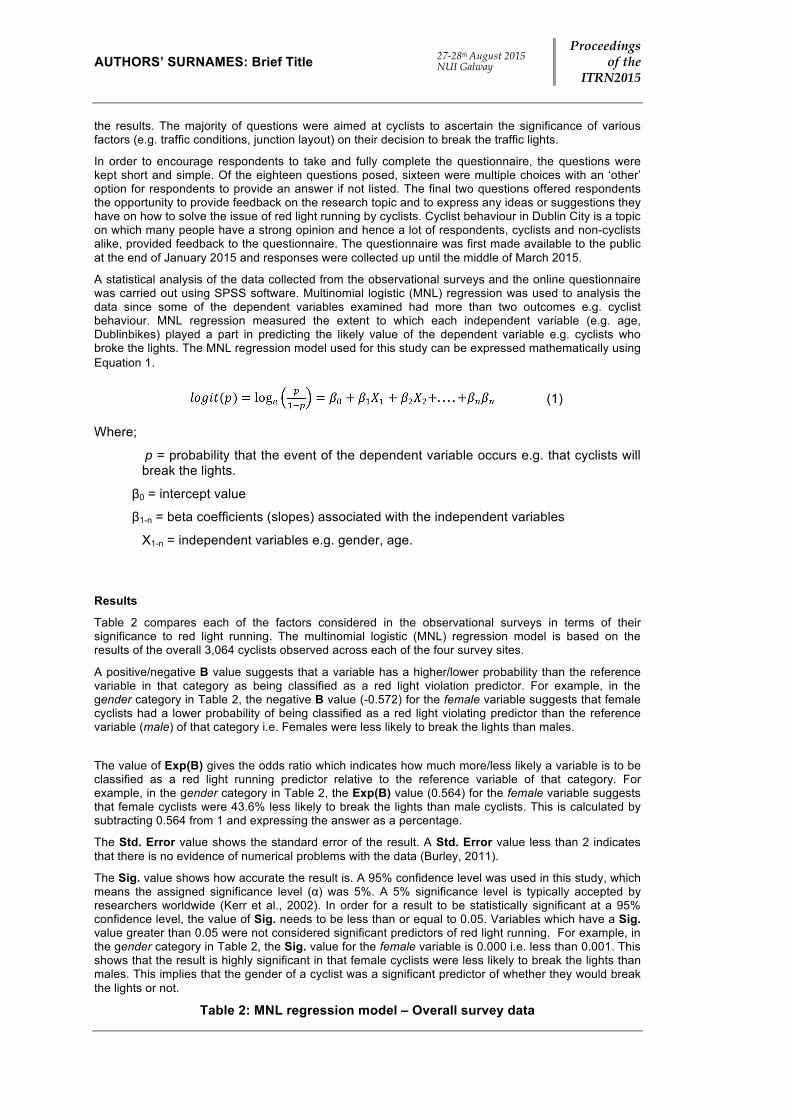
The observational surveys were carried out using the camera monitoring screens in the traffic control room in Dublin City Council (DCC) Civic Offices. Dublin City Council has approximately 240 cameras positioned on major roads throughout Dublin which are linked to the centre in Wood Quay using the largest fibre optic communications system in the country. This allows real-time footage of these roads to be displayed at the touch of a button on the monitoring screens.
Figure 6: Site 1 (left) and Site 2 (right)
Figure 7: Site 3 (left) and Site 4 (right)
Throughout the observational surveys it was recorded whether cyclists waited for the green light or if they illegally proceeded through a red light. For those who broke the traffic lights, it was recorded whether or not they stopped and waited at the lights first and also during which phase they committed infringement i.e. during the pedestrian green phase or during the motorists green phase. Male and female cyclists were studied separately and it was also recorded whether or not the cyclist was using a rented bicycle (Dublinbikes).
An online questionnaire was also used by this study to gather information from cyclists and non-cyclists. Where the observational surveys could be used to directly examine cyclist physical behaviour, the online questionnaire could be used to evaluate the mental attitude of cyclists and establish the reasons why they commit traffic light infringement.
The questionnaire was created using SurveyMonkey (www.surveymonkey.com) and was designed to be answered by both cyclists and non-cyclists of all ages to reach a larger market and minimise bias in
AUTHORS’ SURNAMES: Brief Title 27-28th August 2015 NUI Galway
Proceedings of the
ITRN2015
the results. The majority of questions were aimed at cyclists to ascertain the significance of various factors (e.g. traffic conditions, junction layout) on their decision to break the traffic lights.
In order to encourage respondents to take and fully complete the questionnaire, the questions were kept short and simple. Of the eighteen questions posed, sixteen were multiple choices with an ‘other’ option for respondents to provide an answer if not listed. The final two questions offered respondents the opportunity to provide feedback on the research topic and to express any ideas or suggestions they have on how to solve the issue of red light running by cyclists. Cyclist behaviour in Dublin City is a topic on which many people have a strong opinion and hence a lot of respondents, cyclists and non-cyclists alike, provided feedback to the questionnaire. The questionnaire was first made available to the public at the end of January 2015 and responses were collected up until the middle of March 2015.
A statistical analysis of the data collected from the observational surveys and the online questionnaire was carried out using SPSS software. Multinomial logistic (MNL) regression was used to analysis the data since some of the dependent variables examined had more than two outcomes e.g. cyclist behaviour. MNL regression measured the extent to which each independent variable (e.g. age, Dublinbikes) played a part in predicting the likely value of the dependent variable e.g. cyclists who broke the lights. The MNL regression model used for this study can be expressed mathematically using Equation 1.
(1)
Where;
p = probability that the event of the dependent variable occurs e.g. that cyclists will break the lights.
β0 = intercept value
β1-n = beta coefficients (slopes) associated with the independent variables
X1-n = independent variables e.g. gender, age. Results
Table 2 compares each of the factors considered in the observational surveys in terms of their significance to red light running. The multinomial logistic (MNL) regression model is based on the results of the overall 3,064 cyclists observed across each of the four survey sites.
A positive/negative B value suggests that a variable has a higher/lower probability than the reference variable in that category as being classified as a red light violation predictor. For example, in the gender category in Table 2, the negative B value (-0.572) for the female variable suggests that female cyclists had a lower probability of being classified as a red light violating predictor than the reference variable (male) of that category i.e. Females were less likely to break the lights than males.
The value of Exp(B) gives the odds ratio which indicates how much more/less likely a variable is to be classified as a red light running predictor relative to the reference variable of that category. For example, in the gender category in Table 2, the Exp(B) value (0.564) for the female variable suggests that female cyclists were 43.6% less likely to break the lights than male cyclists. This is calculated by subtracting 0.564 from 1 and expressing the answer as a percentage.
The Std. Error value shows the standard error of the result. A Std. Error value less than 2 indicates that there is no evidence of numerical problems with the data (Burley, 2011).
The Sig. value shows how accurate the result is. A 95% confidence level was used in this study, which means the assigned significance level (α) was 5%. A 5% significance level is typically accepted by researchers worldwide (Kerr et al., 2002). In order for a result to be statistically significant at a 95% confidence level, the value of Sig. needs to be less than or equal to 0.05. Variables which have a Sig. value greater than 0.05 were not considered significant predictors of red light running. For example, in the gender category in Table 2, the Sig. value for the female variable is 0.000 i.e. less than 0.001. This shows that the result is highly significant in that female cyclists were less likely to break the lights than males. This implies that the gender of a cyclist was a significant predictor of whether they would break the lights or not.
Table 2: MNL regression model – Overall survey data
Proceedings of the
ITRN2015 27-28th August 2015 NUI Galway Richardson & Caulfield: Cyclist Safety
Broke the lights? a B Std. Error Sig. Exp(B)
Yes
Intercept -2.062 0.463 .000
Gender Female -0.572 0.146 .000 0.564
Male 0b .
Dublinbike user No 0.501 0.335 .135 1.650
Yes 0b .
Survey time
8:00-8:30am 0.133 0.227 .557 1.143
8:30-9:00am 0.117 0.199 .554 1.125
9:00-9:30am 0.115 0.201 .567 1.112
9:30-10:00am 0b .
Weather conditions
Dry and calm 0.136 0.293 .643 1.146
Dry and windy 0.156 0.273 .566 1.169
Wet and calm 0b .
Infrastructure type
Cycle track and bicycle traffic lights 5.563 0.254 .000 260.694
Cycle lane and regular traffic lights 0b .
N 3064 -‐2 log likelihood at convergence 158.654 Nagelkerke R² 0.739 Chi-‐squared statistic (sig = 0.000) 2400.93 Degrees of freedom 8
a. The reference category is: No
b. This parameter is set to zero because it is redundant
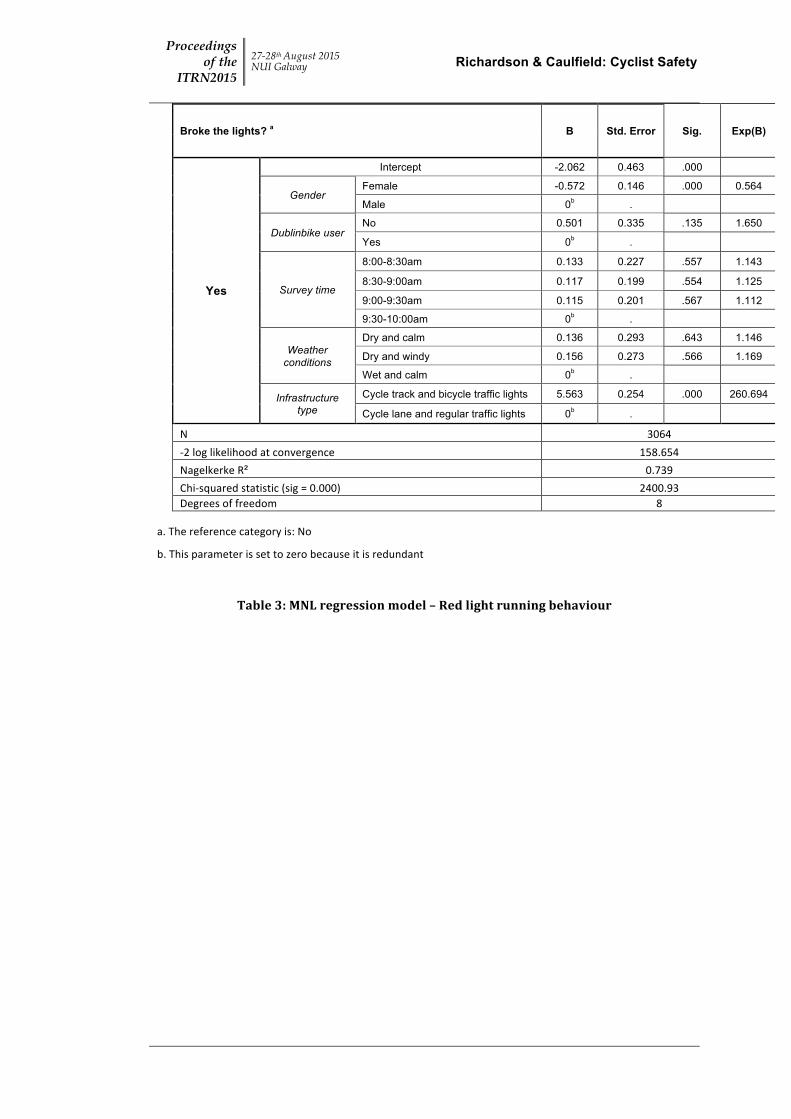
Table 3: MNL regression model – Red light running behaviour
AUTHORS’ SURNAMES: Brief Title 27-28th August 2015 NUI Galway
Proceedings of the
ITRN2015
As shown in Table 2, the most significant predictors of red light running were infrastructure type and cyclist gender. Since Dublinbike users, Survey time and Weather conditions were not significant factors, they have been omitted from the following MNL model (Table 3), which examines the different behaviour types of red light running cyclists.
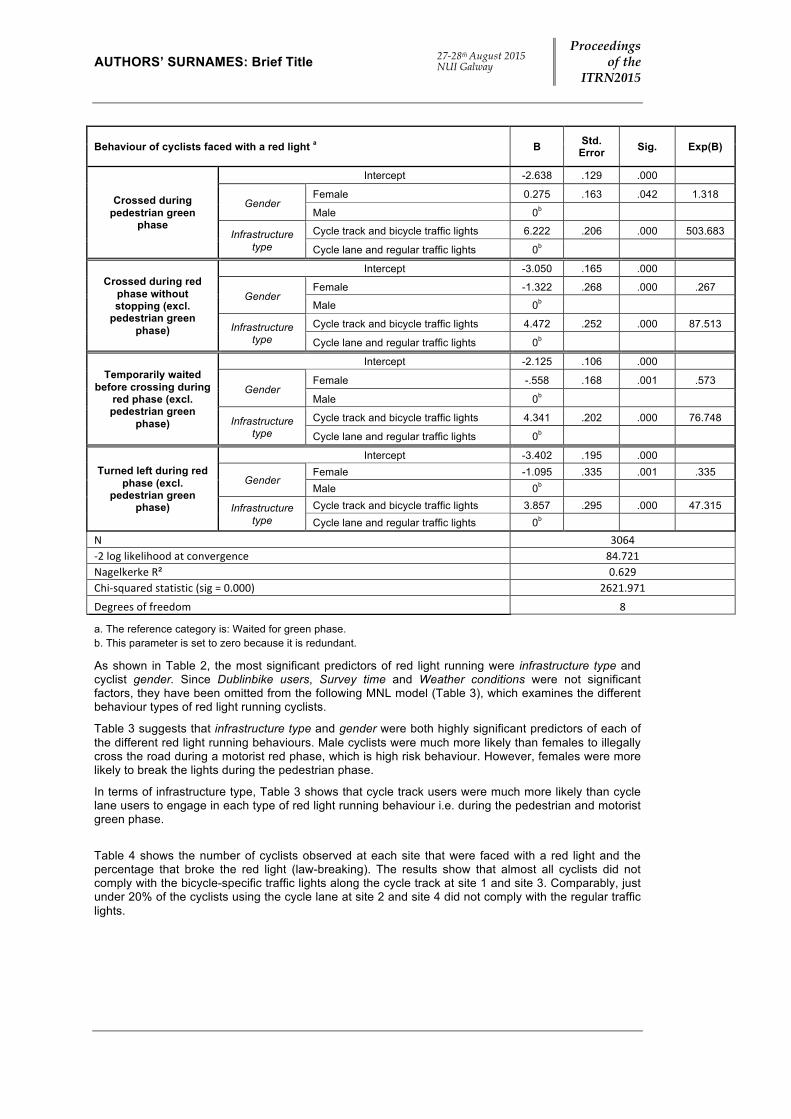
Table 3 suggests that infrastructure type and gender were both highly significant predictors of each of the different red light running behaviours. Male cyclists were much more likely than females to illegally cross the road during a motorist red phase, which is high risk behaviour. However, females were more likely to break the lights during the pedestrian phase.
In terms of infrastructure type, Table 3 shows that cycle track users were much more likely than cycle lane users to engage in each type of red light running behaviour i.e. during the pedestrian and motorist green phase.
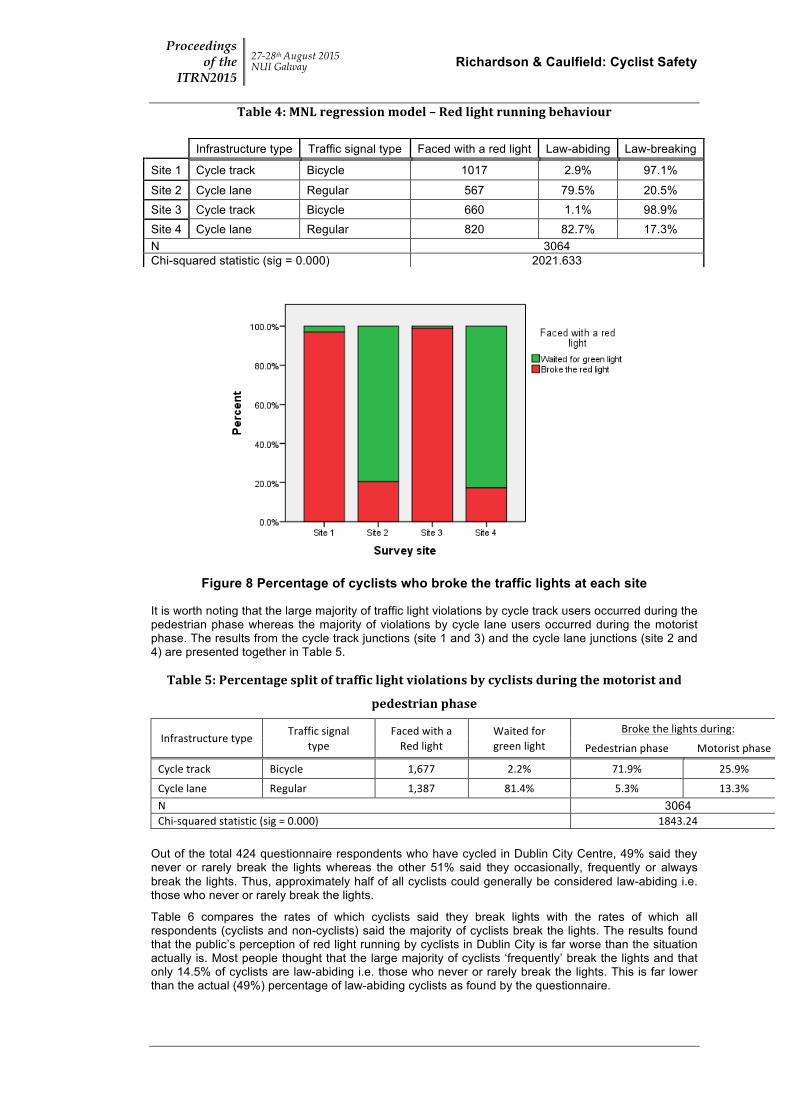
Table 4 shows the number of cyclists observed at each site that were faced with a red light and the percentage that broke the red light (law-breaking). The results show that almost all cyclists did not comply with the bicycle-specific traffic lights along the cycle track at site 1 and site 3. Comparably, just under 20% of the cyclists using the cycle lane at site 2 and site 4 did not comply with the regular traffic lights.
Behaviour of cyclists faced with a red light a B Std. Error Sig. Exp(B)
Crossed during pedestrian green
phase
Intercept -2.638 .129 .000
Gender Female 0.275 .163 .042 1.318
Male 0b Infrastructure
type Cycle track and bicycle traffic lights 6.222 .206 .000 503.683
Cycle lane and regular traffic lights 0b
Crossed during red phase without stopping (excl.
pedestrian green phase)
Intercept -3.050 .165 .000
Gender Female -1.322 .268 .000 .267
Male 0b Infrastructure
type Cycle track and bicycle traffic lights 4.472 .252 .000 87.513
Cycle lane and regular traffic lights 0b
Temporarily waited before crossing during
red phase (excl. pedestrian green
phase)
Intercept -2.125 .106 .000
Gender Female -.558 .168 .001 .573
Male 0b Infrastructure
type Cycle track and bicycle traffic lights 4.341 .202 .000 76.748
Cycle lane and regular traffic lights 0b
Turned left during red phase (excl.
pedestrian green phase)
Intercept -3.402 .195 .000
Gender Female -1.095 .335 .001 .335 Male 0b
Infrastructure type
Cycle track and bicycle traffic lights 3.857 .295 .000 47.315 Cycle lane and regular traffic lights 0b
N 3064 -‐2 log likelihood at convergence 84.721 Nagelkerke R² 0.629 Chi-‐squared statistic (sig = 0.000) 2621.971
Degrees of freedom 8
a. The reference category is: Waited for green phase. b. This parameter is set to zero because it is redundant.
Proceedings of the
ITRN2015 27-28th August 2015 NUI Galway Richardson & Caulfield: Cyclist Safety
Table 4: MNL regression model – Red light running behaviour
Figure 8 Percentage of cyclists who broke the traffic lights at each site
It is worth noting that the large majority of traffic light violations by cycle track users occurred during the pedestrian phase whereas the majority of violations by cycle lane users occurred during the motorist phase. The results from the cycle track junctions (site 1 and 3) and the cycle lane junctions (site 2 and 4) are presented together in Table 5.
Table 5: Percentage split of traffic light violations by cyclists during the motorist and
pedestrian phase
Infrastructure type Traffic signal Faced with a Waited for Broke the lights during: type Red light green light Pedestrian phase Motorist phase
Cycle track Bicycle 1,677 2.2% 71.9% 25.9%
Cycle lane Regular 1,387 81.4% 5.3% 13.3% N 3064 Chi-‐squared statistic (sig = 0.000) 1843.24
Out of the total 424 questionnaire respondents who have cycled in Dublin City Centre, 49% said they never or rarely break the lights whereas the other 51% said they occasionally, frequently or always break the lights. Thus, approximately half of all cyclists could generally be considered law-abiding i.e. those who never or rarely break the lights.
Table 6 compares the rates of which cyclists said they break lights with the rates of which all respondents (cyclists and non-cyclists) said the majority of cyclists break the lights. The results found that the public’s perception of red light running by cyclists in Dublin City is far worse than the situation actually is. Most people thought that the large majority of cyclists ‘frequently’ break the lights and that only 14.5% of cyclists are law-abiding i.e. those who never or rarely break the lights. This is far lower than the actual (49%) percentage of law-abiding cyclists as found by the questionnaire.
Infrastructure type Traffic signal type Faced with a red light Law-abiding Law-breaking
Site 1 Cycle track Bicycle 1017 2.9% 97.1%
Site 2 Cycle lane Regular 567 79.5% 20.5% Site 3 Cycle track Bicycle 660 1.1% 98.9% Site 4 Cycle lane Regular 820 82.7% 17.3% N 3064 Chi-squared statistic (sig = 0.000) 2021.633
AUTHORS’ SURNAMES: Brief Title 27-28th August 2015 NUI Galway
Proceedings of the
ITRN2015
The large majority (67.4%) of respondents said they would be less inclined to commit infringement if traffic lights provided several seconds of advanced green time for cyclists to clear the junction ahead of motorists. This was also frequently mentioned in the feedback section of the questionnaire; a substantial number of respondents said they regularly break the lights to get safely ahead of motorists before the green light. Thus, many respondents suggested advanced green time for cyclists as the best solution to deter red light running. The junction crossing distance and turning left at the lights were also considered by cyclists to be important factors in their decision to violate traffic lights.
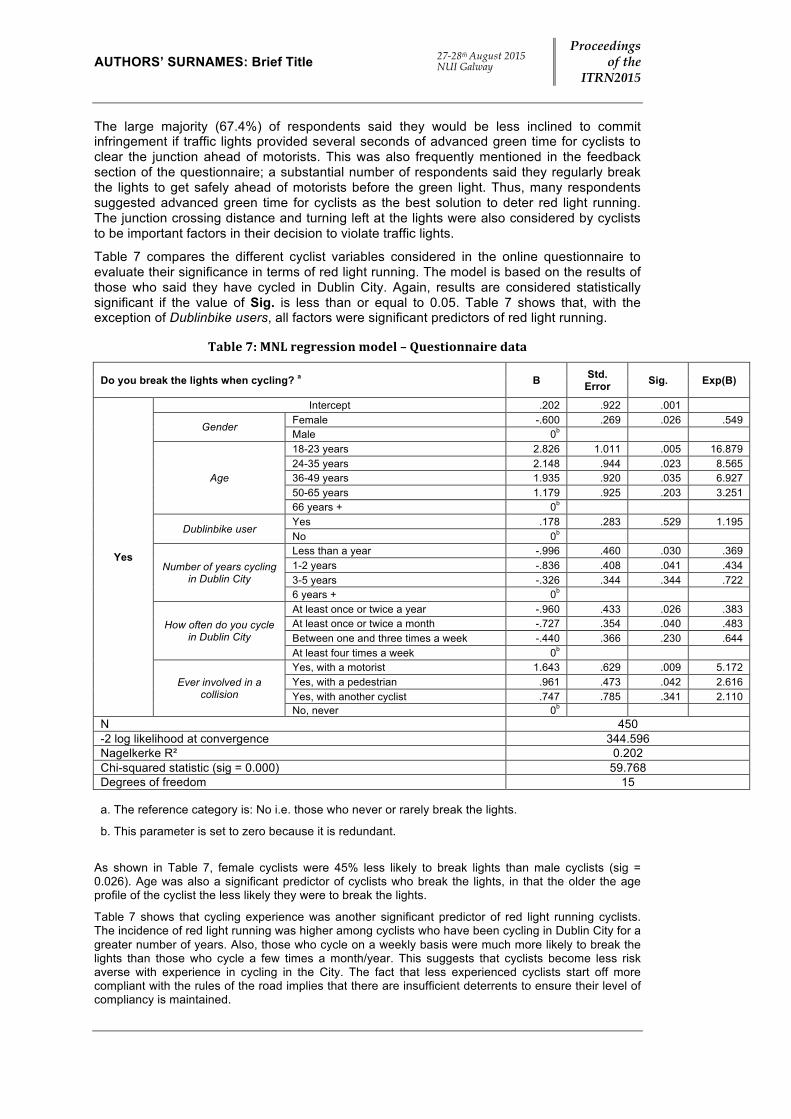
Table 7 compares the different cyclist variables considered in the online questionnaire to evaluate their significance in terms of red light running. The model is based on the results of those who said they have cycled in Dublin City. Again, results are considered statistically significant if the value of Sig. is less than or equal to 0.05. Table 7 shows that, with the exception of Dublinbike users, all factors were significant predictors of red light running.
Table 7: MNL regression model – Questionnaire data
Do you break the lights when cycling? a B Std. Error Sig. Exp(B)
Yes
Intercept .202 .922 .001
Gender Female -.600 .269 .026 .549 Male 0b
Age
18-23 years 2.826 1.011 .005 16.879 24-35 years 2.148 .944 .023 8.565 36-49 years 1.935 .920 .035 6.927 50-65 years 1.179 .925 .203 3.251 66 years + 0b
Dublinbike user Yes .178 .283 .529 1.195 No 0b
Number of years cycling in Dublin City
Less than a year -.996 .460 .030 .369 1-2 years -.836 .408 .041 .434 3-5 years -.326 .344 .344 .722 6 years + 0b
How often do you cycle in Dublin City
At least once or twice a year -.960 .433 .026 .383 At least once or twice a month -.727 .354 .040 .483 Between one and three times a week -.440 .366 .230 .644 At least four times a week 0b
Ever involved in a collision
Yes, with a motorist 1.643 .629 .009 5.172 Yes, with a pedestrian .961 .473 .042 2.616 Yes, with another cyclist .747 .785 .341 2.110 No, never 0b
N 450 -2 log likelihood at convergence 344.596 Nagelkerke R² 0.202 Chi-squared statistic (sig = 0.000) 59.768 Degrees of freedom 15
a. The reference category is: No i.e. those who never or rarely break the lights.
b. This parameter is set to zero because it is redundant.
As shown in Table 7, female cyclists were 45% less likely to break lights than male cyclists (sig = 0.026). Age was also a significant predictor of cyclists who break the lights, in that the older the age profile of the cyclist the less likely they were to break the lights.
Table 7 shows that cycling experience was another significant predictor of red light running cyclists. The incidence of red light running was higher among cyclists who have been cycling in Dublin City for a greater number of years. Also, those who cycle on a weekly basis were much more likely to break the lights than those who cycle a few times a month/year. This suggests that cyclists become less risk averse with experience in cycling in the City. The fact that less experienced cyclists start off more compliant with the rules of the road implies that there are insufficient deterrents to ensure their level of compliancy is maintained.
Proceedings of the
ITRN2015 27-28th August 2015 NUI Galway Richardson & Caulfield: Cyclist Safety
Table 7 shows that those who break the lights were 2.6 times (sig = 0.042) more likely to have been involved in a collision with a pedestrian and 5.2 times (sig = 0.009) more likely to have been involved in collision with a motorist. This highlights the danger of cyclists taking risks at junctions, both to themselves and to other road users.
Discussion
The observational survey results show that almost all cyclists (97.8%) break the bicycle-specific traffic lights on the Grand Canal cycle track whereas less than one in five cyclists (18.6%) break the regular traffic lights on the cycle lane. This is an astonishing difference considering the fact that both cycle facilities are exceptionally close together; approximately 25m apart along most of the Canal. This close proximity also means that the traffic conditions are largely the same for cycle lane and cycle track users in terms of the volume of cross-traffic travelling over the Canal bridges. However, unlike on the cycle lane, the large majority (71.9%) of traffic light violations by cycle track users occurred during the pedestrian phase.
Male and female cyclists of all ages similarly cross the junctions along the cycle track during the pedestrian phase without stopping to measure the risk first. Since these bicycle traffic lights are unique to cycle tracks in Dublin City, some cyclists may not even notice them; particularly if they only pass through one or two junctions with bicycle traffic lights on their journey.
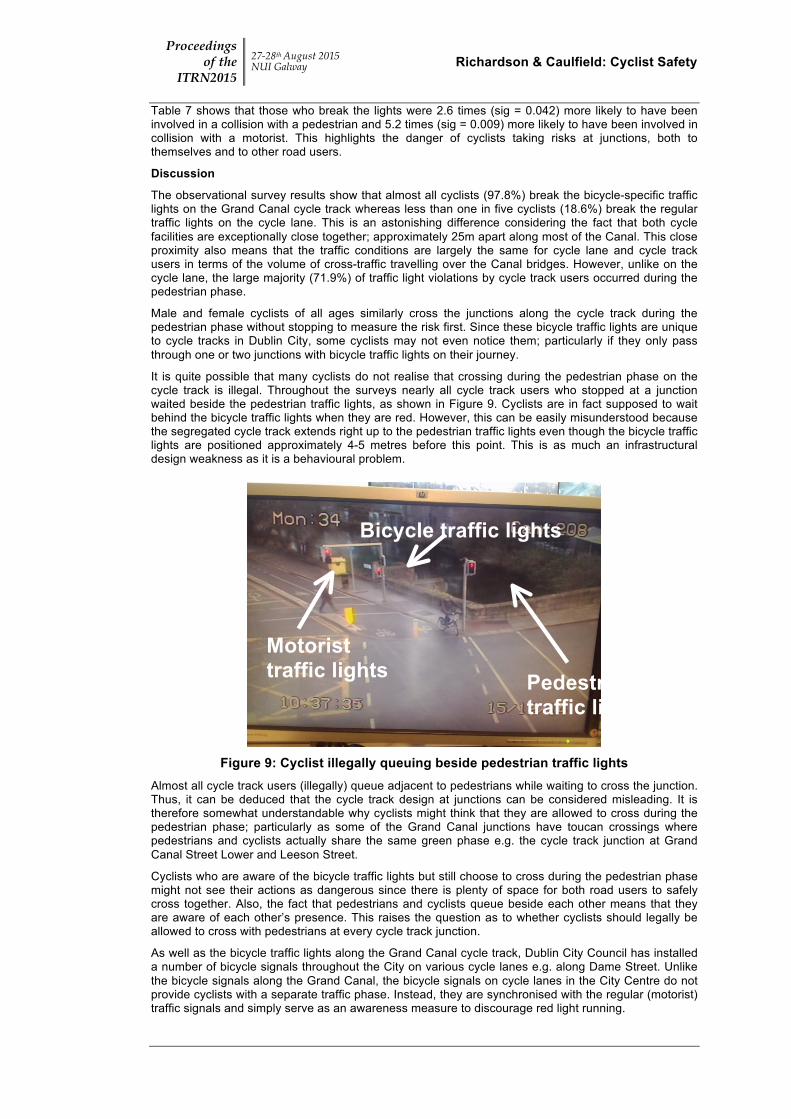
It is quite possible that many cyclists do not realise that crossing during the pedestrian phase on the cycle track is illegal. Throughout the surveys nearly all cycle track users who stopped at a junction waited beside the pedestrian traffic lights, as shown in Figure 9. Cyclists are in fact supposed to wait behind the bicycle traffic lights when they are red. However, this can be easily misunderstood because the segregated cycle track extends right up to the pedestrian traffic lights even though the bicycle traffic lights are positioned approximately 4-5 metres before this point. This is as much an infrastructural design weakness as it is a behavioural problem.
Figure 9: Cyclist illegally queuing beside pedestrian traffic lights
Almost all cycle track users (illegally) queue adjacent to pedestrians while waiting to cross the junction. Thus, it can be deduced that the cycle track design at junctions can be considered misleading. It is therefore somewhat understandable why cyclists might think that they are allowed to cross during the pedestrian phase; particularly as some of the Grand Canal junctions have toucan crossings where pedestrians and cyclists actually share the same green phase e.g. the cycle track junction at Grand Canal Street Lower and Leeson Street.
Cyclists who are aware of the bicycle traffic lights but still choose to cross during the pedestrian phase might not see their actions as dangerous since there is plenty of space for both road users to safely cross together. Also, the fact that pedestrians and cyclists queue beside each other means that they are aware of each other’s presence. This raises the question as to whether cyclists should legally be allowed to cross with pedestrians at every cycle track junction.
As well as the bicycle traffic lights along the Grand Canal cycle track, Dublin City Council has installed a number of bicycle signals throughout the City on various cycle lanes e.g. along Dame Street. Unlike the bicycle signals along the Grand Canal, the bicycle signals on cycle lanes in the City Centre do not provide cyclists with a separate traffic phase. Instead, they are synchronised with the regular (motorist) traffic signals and simply serve as an awareness measure to discourage red light running.
Bicycle traffic lights
Pedestrian traffic lights
Motorist traffic lights
AUTHORS’ SURNAMES: Brief Title 27-28th August 2015 NUI Galway
Proceedings of the
ITRN2015
Based on the questionnaire findings, these bicycle ‘awareness’ signals would greatly benefit cyclists if they provided an advanced green light, before the regular green light, to allow cyclists clear the junction ahead of motorists. A large amount of questionnaire feedback received from cyclists related to running the red light just before the light turns green. Many deemed this behaviour to be safer than actually waiting for the green light and accelerating alongside aggressive motorists. In fact, two-thirds (67.4%) of cyclists said they would be more inclined to wait for an advanced green light than violate the traffic lights. This shows the potential of these bicycle ‘awareness’ lights to greatly reduce red light running in Dublin City if they introduce a head start function for cyclists.
Conclusion
This study has examined the behaviour of cyclists in Dublin City Centre with specific regard to traffic light violations. The aim of the study was to identify the demographics of offending cyclists and the principal factors which influence their decision to break the lights. The study found that approximately half (49%) of the cyclists in Dublin City Centre are law-breaking, particularly male cyclists in the 18-23 age bracket.
Female cyclists are approximately 45% less likely to break the traffic lights than males. Regarding males and females who break the lights, male cyclists take higher risks and are more likely than females to illegally cross a junction during a motorist phase. The red light running behaviour of female cyclists is less reckless in comparison. Females are much more likely to break the lights during the pedestrian phase (which is lower risk than the motorist phase) and are also more inclined to temporarily wait at a red light and measure the risk first before committing infringement.
Using observational surveys and an online questionnaire, this research has found no significant difference between users of a bike rental scheme (Dublinbikes) and non-rental bike users in terms of their rate of compliance with traffic signals and the level of risk taken by those who do break the lights, for both genders.
The findings of this research have shown that cyclist behaviour is influenced by infrastructural design/layout weaknesses. Cyclists are less likely to infringe traffic signals at junctions where there is a long crossing distance. Additionally, the majority of those who break the lights are more likely to do so when there is a long wait for the green light. This is a major factor associated with red light running. Over two-thirds (67.4%) of 445 cyclists said they would be less inclined to break the lights if advanced green time was provided to allow cyclists clear the junction ahead of motorists.
Two different cycle infrastructure types run along the Grand Canal in Dublin. On the City side of the Canal, an off-road cycle track is provided with dedicated bicycle traffic signals at junctions. On the opposite side of the Canal, an on-road cycle lane is provided and users must comply with the regular (motorist) traffic signals at junctions. The rate of compliance by cycle lane users with regular traffic lights along the Grand Canal is approximately 81.4%. The rate of compliance by cycle track users with bicycle traffic lights is exceptionally low at only 2.2%. The large majority of cycle track users (71.9%) are illegally (knowingly or unknowingly) complying with the pedestrian traffic lights instead of their own. There are plans to introduce more cycle tracks in Dublin City, such as the Liffey Cycle Route (Kelly, 2015), so the issue of cycle track users ‘illegally’ crossing during the pedestrian phase needs to resolved before providing additional segregated cycle routes.
Increased traffic light compliance would help improve Dublin’s cycling culture and the attitudes of motorists and pedestrians towards cyclists. Though there is a paucity of work on this research topic to date, it is hoped that this study will provide a basis for all future studies. It is manifest from this study that there is a strong case for further studies in this field, thus providing a more substantive case to influence professionals involved in the area.
References ALLEN, D. BYGRAVE, S. HARPER, H. (2005). “Behaviour at cycle advanced stop lines”. Published Project Report
PPR240. TRL for Transport for London, 2005. ALRUTZ, D. (1980). HUK-Verband, Köln, Germany. Presented at Velo City, Bremen, 1980 and in conference proceedings. ARASON, N. (2014). “No Accident: Eliminating Injury and Death on Canadian Roads”. Publisher: Wilfrid Laurier
University Press (April 1, 2014). ISBN-10: 1554589630 AULTMAN-HALL, L., HALL F. L. (1998). “Ottawa-Carleton commuter cyclist on- and off-road incident rates”.
Accident Analysis & Prevention, Volume 30, Issue 1, January 1998, Pages 29–43 B. VAN DER BIJL. (2010). “Individual users’ perception of signalised intersections”. Master thesis. Peek traffic
solutions. University of Twente. Accessed at http://essay.utwente.nl/59761/1/MA_thesis_B_vander_Bijl.pdf BROSSEAU, M., ZANGENEHPOUR, S., SAUNIER, N., MIRANDA-MORENO, L. (2013).”The Impact of Traffic
Lights on Dangerous Pedestrian Crossings and Violations: a Case Study in Montreal” Transportation Research Part F Traffic Psychology and Behaviour. Volume 21, ISSN: 1369-8478.
Proceedings of the
ITRN2015 27-28th August 2015 NUI Galway Richardson & Caulfield: Cyclist Safety
BUREAU GOUDAPPEL COFFENG (1985). “Roodlichtdiscipline van (brom)fietsers : een verkennend onderzoek”. [Red Light Discipline of cyclists : an exploratory study] In opdracht van het Directoraat-‐Generaal Rijkswaterstaat, Dienst Verkeerkunde DVK. Kenmerk RWD/752/18/Ht ed. Deventer: Bureau Goudappel Coffeng.
BUREAU GOUDAPPEL COFFENG (1988). “Oriënterend onderzoek roodlichtdiscipline van (brom)fietsers.” [Examining the red light discipline of cyclists] Onderzoek in opdracht van het Directoraat-‐Generaal Rijkswaterstaat, Dienst Verkeerskunde DVK + bijlage. Deventer: Bureau Goudappel Coffeng.
BURLEY, H. (2012). “Cases on Institutional Research Systems”. (pp. 1-429). Hershey, PA: IGI Global. doi:10.4018/978-1-60960-857-6
CENTRAL STATISITICS OFFICE [CSO]. (2011). Census Ireland 2011. CHRISTMAS, S., HELMAN, S., BUTRESS, S., NEWMAN, C., HUTCHINS, R. (2010). “Cycling, Safety and Sharing
the Road: Qualitative Research with Cyclists and Other Road Users”. Road Safety Web Publication No.17 (RSWP 17). Department for Transport: London. September 2010.
COLE, A., BENSTON, S., COHOE, P., HARRIS, S. (2011). "Red Light Behavior between Motor Vehicles and Bicycles" Portland State University, November 28, 2011. Accessed at http://media.oregonlive.com/commuting/other/SCI%20201%20Project%202.pdf
DEWAR, R. (1978). “Bicycle Riding Practices: Implications for Safety Campaigns.” Journal of Safety Research, Vol. 10, No. 1, 1978, pp. 35–42.
DOHERTY, S, T., AULTMAN-HALL, L., SWAYNOS, J. (2000). “Commuter cyclist accident patterns in Toronto and Ottawa” Journal of Transportation Engineering ASCE. Vol.126, No.1, 2000, pp. 21–26.
DOOREN, J. J. V. (1985). Onderzoek naar de roodlichtdiscipline van (brom) fietsers : een verkennend onderzoek naar de invloedsfactoren. Afstudeerverslag Verkeersakademie”. Tilburg VAT NHTV, Tilburg. Tilburg: Verkeersakademie TILBURG VAT NHTV.
DUBLIN CITY CYCLING. (2014). “Area Maps of Cycle Tracks and Bike Lanes”. Dublin City Council. Available online from http://www.dublincitycycling.ie/cycling-facilities/cycle-lanes-and-facilities [Accessed 25/10/2014]
DUBLINBIKES. (2015). “Coca Cola Zero Dublinbikes – The stats”. Dublinbikes website, article published on the 4th Feb, 2015. Available from https://abo-‐dublin.cyclocity.fr/Magazine/News/Coca-‐Cola-‐Zero-‐dublinbikes-‐the-‐stats [Accessed 23/03/2015]
GINTY, C. (2015). “160% INCREASE IN CYCLING INTO DUBLIN CITY CENTRE BETWEEN 2004-2014” Irish cycle.com. Article published on 4th March 2015. Available online from http://irishcycle.com/2015/03/04/160-increase-in-cycling-into-dublin-city-centre-between-2004-2014/ [Accessed 17/05/2014]
HILKEVITCH, J. (2013). “City says Dearborn bike signals keeping cyclists in line”. Chicago Tribune. Published on June 10, 2013. Article available online at http://articles.chicagotribune.com/2013-06-10/classified/ct-met-getting-around-0610-20130610_1_cyclists-signals-bike-traffic [Accessed 5/2/2015]
JOHNSON, M., CHARLTON, J., OXLEY, J., NEWSTEAD, S. (2013). “Why do cyclists infringe at red lights? An investigation of Australian cyclists’ reasons for red light infringement” Accident Analysis and Prevention 50 (2013) 840– 847
JOHNSON, M., NEWSTEAD, S., CHARLTON, J., OXLEY, J. (2010). “Naturalistic Cycling Study: Identifying Risk Factors for On-Road Commuter Cyclists” Association for the Advancement of Automotive Medicine, Volume 54, January 2010, ISSN: 1943-2461, 275–283.
JOHNSON, M., NEWSTEAD, S., CHARLTON, J., OXLEY, J. (2011). “Riding through red lights: The rate, characteristics and risk factors of non-compliant urban commuter cyclists” Accident Analysis and Prevention 43 (2011) 323–328.
KERR, W, A., HALL, H, K., KOZUB, S, A. (2002). “Doing Statistics with SPSS”. Paper back, 1st Edition. ISBN-13: 978-0761973850 .
KORVE, M, J., NIEMEIER, D, A. (2002). ‘Benefit–Cost Analysis of added bicycle phase at existing signalised intersection’. Journal of Transportation Engineering 128 (1): 4–48.
LAWSON, A, R., PAKRASHI, V., GHOSH, B., SZETO, W, Y. (2013). “Perception of safety of cyclists in Dublin City”. Accident Analysis and Prevention 50 (2013) 499– 511.
MEI, H., XIAOBAO, Y. & BIN, J. (2012). “Modeling Cyclist Violation Behavior at Signalized Intersection in China”. Computational Sciences and Optimization (CSO), 2012 Fifth International Joint Conference on, 23-26 June 2012. 489-493
MONSERE, C, M., MCNEILL, N., DILL, J. (2011). “Evaluation of Innovative Bicycle Facilities: SW Broadway Cycle Track & SW Stark/Oak Street Buffered Bike Lanes.” Final Report. Prepared for Portland State University for the Bureau of Transportation, City of Portland. January 2011.
MULDERS, H. P. G. (1981). “Rood-licht-negatie van voetgangers op geregelde oversteekplaatsen. Literatuuroverzicht”. [Pedestrian red light negligence on signal controlled crossings. A literature review.] VK-81-03 ed. Haren: Rijksuniversiteit Groningen RUG, Verkeerskundig Studiecentrum VSC.
PAI, C, W. JOU, R, C. (2014). “Cyclists’ red-light running behaviours: An examination of risk-taking, opportunistic, and law-obeying behaviours” Accident Analysis & Prevention 62, January 2014, Pages 191–198
RNPR. (2007). “Proportion of Cyclists Who Violate Red Lights in London”. Road Network Performance & Research Team, Traffic Note 8 June 2007. Available online from http://www.tfl.gov.uk/cdn/static/cms/documents/traffic-note-8-cycling-red-lights.pdf [Accessed 4/2/2015]
ROAD SAFETY AUTHORITY. (2005-2012). “Road Collision Facts Ireland”. Annual collision statistics, years 2005-2014. Available online from http://www.rsa.ie/en/RSA/Road-Safety/Our-Research/Collision-Statistics/ [Accessed 21/01/2015]
SHORT, J., CAULFIELD, B. (2014). “The safety challenge of increased cycling”. Transport Policy, 33, 154-165. THOM, R., CLAYTON, A. (1992). “Low-Cost Opportunities for Making Cities Bicycle-Friendly Based on a Case
Study Analysis of Cyclist Behavior and Accidents”. In Transportation Research Record 1372, TRB, National Research Council, Washington, D.C., 1992, pp. 90–101.
VAN DER MEEL, E, M. (2013). “Red light running by Cyclists: What factors influence the red light running by cyclists”. Master thesis. Delft University of Technology Civil Engineering, Master Transport and Planning. Accessed at 201210918-Master_thesis-_Red_light_running_by_cyclists_-_Evelien_van_der_Meel.pdf (5.9 MB)
AUTHORS’ SURNAMES: Brief Title 27-28th August 2015 NUI Galway
Proceedings of the
ITRN2015
YANG, X., HUAN, M., SI, B., GAO, L., GUO, H. (2012). “Crossing at a Red Light: Behaviour of Cyclists at Urban Intersections” Discrete Dynamics in Nature and Society, Volume 2012, Article ID 490810
YANG, X., HUAN, M., SI, B., GAO, L., GUO, H. (2012). “Crossing at a Red Light: Behaviour of Cyclists at Urban Intersections” Discrete Dynamics in Nature and Society, Volume 2012, Article ID 490810