cyclone and tsunami hazards in the arabian sea-a ... and tsunami hazards in the arabian sea – a...
TRANSCRIPT

Journal of Shipping and Ocean Engineering 5 (2015) 242-254 doi 10.17265/2159-5879/2015.05.003
Cyclone and Tsunami Hazards in the Arabian Sea-A
Numerical Modelling Case Study by Royal
HaskoningDHV
M. A. Sarker1 and A. J. Sleigh2
1. Royal HaskoningDHV, Rightwell House, Bretton, Peterborough PE3 8DW, United Kingdom
2. Royal HaskoningDHV, Stanley Hall, Edmund Street, Liverpool L3 9NG, United Kingdom
Abstract: Significant loss of life and damage to properties, ecosystems and marine facilities occur due to various natural hazards such as cyclones and tsunamis. Royal HaskoningDHV has developed regional hydrodynamic and wave models covering the Northern Arabian Sea to address these issues. Cyclone modelling was carried out on 11 major cyclones since 1945 and the tsunami modelling on an earthquake along the Makran Fault Line in 1945. Sample results from these modelling studies are presented in this paper. The methodology described in this article for modelling cyclones and tsunamis in the Arabian Sea could be applied to simulate these natural hazards at other sites around the world. Key words: Numerical modelling, cyclone, tsunami, extreme waves, storm surge, port development, Arabian Sea.
1. Introduction
Various natural hazards such as cyclones and
tsunamis impose significant risks during construction
and operation of sea ports, oil terminals & jetties,
offshore exploratory drilling rigs and offshore oil
extraction rigs. Furthermore, these natural hazards put
lives and properties in coastal areas at greater risks.
Significant loss of life, damage to properties,
ecosystems and marine facilities occur due to these
natural hazards.
A large tidal hydrodynamic model is required to
simulate cyclone surge and tsunami heights on a
region whereas a large wave model is required to
simulate cyclone waves.
Royal HaskoningDHV has developed regional
hydrodynamic and wave models covering the
Northern Arabian Sea to investigate these natural
hazards and support their project work in Oman. The
Corresponding author: Md Akhtaruzzaman Sarker, Ph.D., Principal Engineer, research field: numerical modelling of coastal processes including waves, tides, sediment transport, cyclones, tsunamis, ice and water quality (dredge plume, outfall discharge and oil spills). Email: [email protected].
models have been used to assess cyclones and
tsunamis within the Arabian Sea. Cyclone modelling
has concentrated on 11 major cyclones since 1945 and
the tsunami modelling on an earthquake along the
Makran Fault Line in 1945. Sample results from these
modelling studies are presented in this paper for
illustration purposes only.
The methodology described for modelling cyclones
and tsunamis in the Arabian Sea could be applied to
simulate these natural hazards at other sites around the
world.
2. Hydrodynamic Modelling
2.1 The Model
Royal HaskoningDHV has developed a
2-dimensional Regional Tidal Hydrodynamic Model
for the Northern Arabian Sea using the MIKE21/3
Flow Model FM software of DHI [1]. The model is
based on the numerical solution of the
two/three-dimensional incompressible Reynolds
averaged Navier-Stokes equations invoking the
assumptions of Boussinesq and of hydrostatic
D DAVID PUBLISHING

Cyclone and Tsunami Hazards in the Arabian Sea – A Numerical Modelling Case Study by Royal HaskoningDHV
243
pressure. The regional model covers the coastlines of
six countries i.e. Yemen, Oman, UAE, Iran, Pakistan
and India (see Fig. 1). The model can be used in its
own right to simulate tidal movements and surges
within the Northern Arabian Sea as well as “building
block” to drive a wide range of other models such as
cyclone, tsunami, oil spill, water quality, sediment
transport and morphological models. The model was
used to drive the cyclone and tsunami models as
described in the following sections.
2.2 Methodology
The model was set up in such a way that with a
finer local mesh and more detailed bathymetry and
land boundary data within a specified area, localised
water movement can be accurately modelled at a point
of interest without the need of introducing nested
models. With this unstructured flexible mesh, it is
easy to refine the mesh into an area of interest.
The model bathymetry is shown in Fig. 1 and was
obtained from the C-Map Global Database [2]. The
model has two open boundaries—one to the south and
the other to the north-west. The model was driven by
tide levels at these two boundaries obtained from the
Global Tidal Model Database available within the
MIKE21 Toolbox [3].
2.3 Model Applications
The tidal hydrodynamic model has been used to
assess cyclone surge and tsunami heights within the
region.
3. Cyclone Modelling
3.1 The Model
Royal HaskoningDHV has developed a
2-dimensional Regional Cyclone Model for the
Northern Arabian Sea using the MIKE21/3 software.
The cyclone model can be used to simulate both
waves and surges for cyclones passing through the
Northern Arabian Sea. The MIKE21 SW (Spectral
Wave) Model was used to simulate the cyclone waves
[4] and the MIKE21/3 Flow Model FM to simulate the
cyclone surge [1]. The fully spectral formulation of
the SW model is based on the wave action
conservation equation, where the
directional-frequency wave action spectrum is the
dependent variable.
3.2 Methodology
Cyclones occur frequently in the Arabian Sea and
can affect the Northern Arabian Sea Region. In
particular, the passage of Cyclone Gonu (in 2007) and
Fig. 1 Model extent and bathymetry.

Cyclone and Tsunami Hazards in the Arabian Sea – A Numerical Modelling Case Study by Royal HaskoningDHV
244
Fig. 2 Wind fields of Cyclone Phet (2010).
Cyclone Phet (in 2010) into the Gulf of Oman has
raised awareness of the risk of events affecting the
Omani coastline north of Ras Al Hadd. Since 1945 a
total of 28 cyclones were initially identified to have
crossed the Arabian Sea and affected the Omani
coastline. A total of 11 cyclones were finally selected
from the pool of 28 based on a combination of
severity (wind speed and, central pressure and
diameter) and the proximity to the site of interest.
These 11 cyclones were simulated in the study.
Tracks and pressure fields of the selected cyclones
were obtained from the Joint Typhoon Warning
Centre, USA [5]. The MIKE21 Toolbox [3] was used
to derive wind and pressure fields (as shown in Figs. 2
and 3) from the cyclone tracks and central pressures.
The tool allows users to compute wind and pressure
data due to tropical cyclone (hurricane or typhoon).
All the parameters required by the Young and Sobey
(1981) [3] model were available for the study and this
was, therefore, used to generate the cyclonic wind and
pressure fields. The cyclone model was driven by
these wind and pressure fields.
3.3 Model Validation
Wave heights, periods and directions were extracted
from model results at selected locations and were
compared to those obtained from various sources to
validate the model and thereby to improve confidence
in model prediction.
3.3.1 Comparison for Cyclone Gonu (2007)
There are limited data to validate the cyclone
modelling. Most of the available information was for
Cyclone Gonu (2007) and therefore the model
validation was focused primarily on this cyclone.
Table 1 compares the model prediction with those
observed by the Oman Meteorological Office [6] and
the WMO (World Meteorological Organisation) [7].
The modelled wave heights at Chabahar and in the
Gulf of Oman compared well with those reported by
World Meteorological Organisation [7]. However, the
modelled wave heights in the Arabian Sea are higher
than those reported by WMO [7]. Similarly, the
modelled wave heights in the Arabian Sea are higher
than those reported by the Omani Meteorological Office

Cyclone and Tsunami Hazards in the Arabian Sea – A Numerical Modelling Case Study by Royal HaskoningDHV
245
Table 1 Comparison of cyclone results for Cyclone Gonu (2007).
Locations Maximum significant wave heights
World Meteorological Organisation [7] Oman Met Office [6] Present study Measurement point AW2 at Chabahar in Iran at 30m depth
4.2 m - 4.5 m
Gulf of Oman 8 m - 9 m
Arabian Sea >11 m 6-12 m Up to 15 m
Table 2 Comparison of cyclone results for Cyclone Phet (2010).
Locations Maximum significant wave heights
Oman Met Office [6] Present study
Gulf of Oman 4 m 4 m
Arabian Sea 7 to 8 m 13 m
[6], however, the range of significant wave heights
provided by the Omani Meteorological Office [6] is
rather wide (6-12 m). Maximum significant wave
heights of over 11 m in the Arabian Sea were reported
by WMO [7]. On the other hand, maximum wave
height of up to 15 m was found in the present study. It
should be noted that wave conditions at Chabahar by
WMO [7] were measured using ADCP.
Although there are some differences in wave
heights reported by other organisations, it is
concluded that there is reasonable agreement in the
pattern and magnitude of waves (particularly in the
coastal zone).
3.3.2 Comparison for Cyclone Phet (2010)
Some information was also obtained on Cyclone
Phet (2010) from literature search. Table 2 compares
the model prediction with those provided by the Oman
Meteorological Office [6].
The modelled wave heights in the Gulf of Oman are
similar to those reported by the Omani Meteorological
Office [6]. However, in the Arabian Sea the modelled
wave heights are significantly higher than those
reported by the Omani Meteorological Office [6].
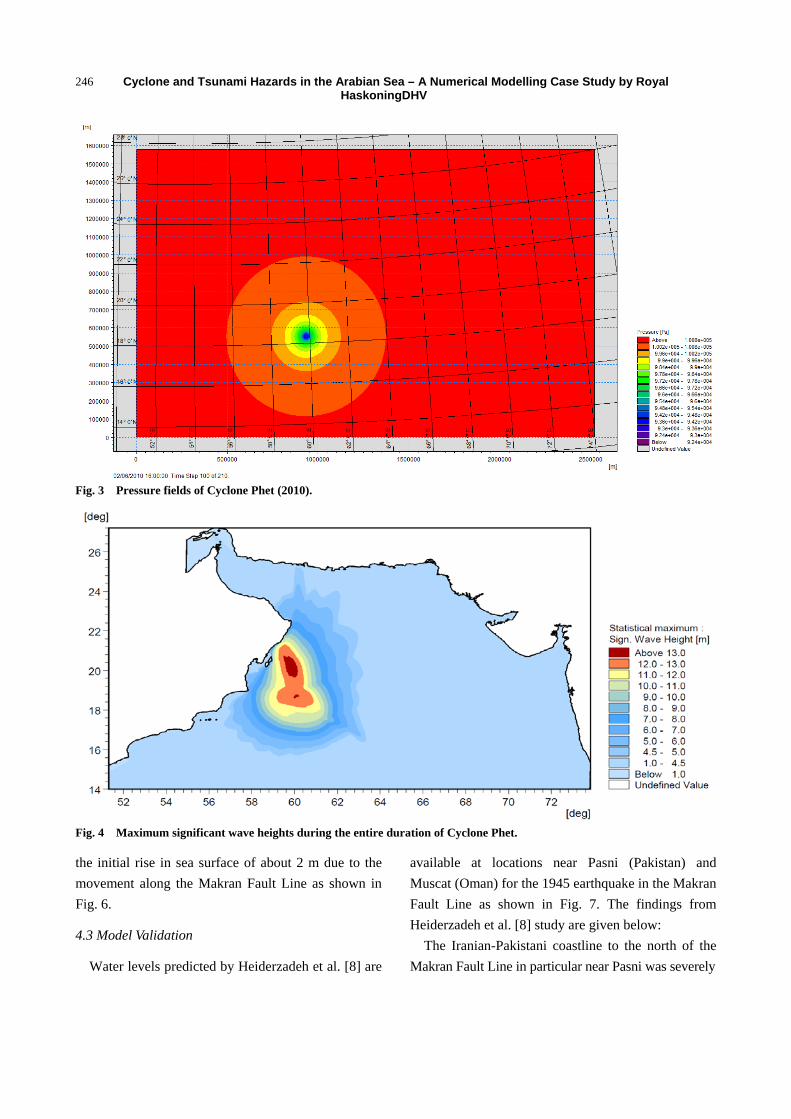
3.4 Model Results
All 11 cyclones selected were simulated in the
study and it was found that the Cyclone Phet (2010)
was one of the most severe events. Only the model
results from Cyclone Phet (2010) are presented to
limit the length of the paper. Fig. 4 shows the
maximum significant waves heights and Fig. 5
illustrates the maximum surge during the entire
duration of Cyclone Phet. The cyclone generated
maximum significant wave height of about 13 m in
the Arabian Sea and about 4 m in the Gulf of Oman.
The highest surge of approximately 1.0 m was found
at the northern part of the Masirah Island.
4. Tsunami Modelling
4.1 The Model
Royal HaskoningDHV has developed a
2-dimensional Regional Tsunami Model for the
Northern Arabian Sea using the MIKE21/3 Flow
Model FM software. The model can be used to
simulate the propagation of tsunami waves and to
predict their height and forward velocity within the
Northern Arabian Sea region.
4.2 Methodology
The 1945 Balochistan Earthquake in Pakistan
occurred at 5:26 PST on 28 November 1945 with a
magnitude of 8.1. The earthquake’s epicentre was 97.6
km south-southwest of Pasni in Balochistan (Pakistan)
and the resulting tsunami caused damage along the
Makran coastal region. Deaths from the event were
reported to be as many as 4,000 people. Furthermore,
the tsunami caused catastrophic damage to properties
and other coastal facilities. The model has been used
to simulate the propagation of the tsunami following
Cyclone and Tsunami Hazards in the Arabian Sea – A Numerical Modelling Case Study by Royal HaskoningDHV
246
Fig. 3 Pressure fields of Cyclone Phet (2010).
Fig. 4 Maximum significant wave heights during the entire duration of Cyclone Phet.
the initial rise in sea surface of about 2 m due to the
movement along the Makran Fault Line as shown in
Fig. 6.
4.3 Model Validation
Water levels predicted by Heiderzadeh et al. [8] are
available at locations near Pasni (Pakistan) and
Muscat (Oman) for the 1945 earthquake in the Makran
Fault Line as shown in Fig. 7. The findings from
Heiderzadeh et al. [8] study are given below:
The Iranian-Pakistani coastline to the north of the
Makran Fault Line in particular near Pasni was severely

Cyclone and Tsunami Hazards in the Arabian Sea – A Numerical Modelling Case Study by Royal HaskoningDHV
247
Fig. 5 Maximum surge during the entire duration of Cyclone Phet.
Fig. 6 Initial rise in sea surface during the 1945 tsunami.
affected. A rise in the sea surface near Pasni was
generally about 4.5-5.5 m.
Their work shows that Muscat was less affected
with a rise in the sea surface of about 0.30 m.
Water levels were extracted from the present
modelling study at locations near Pasni and Muscat as
shown in Figs. 8 and 9. The findings are given below:
From the present study the predicted rise in the sea
surface along the Iranian-Pakistani coastline to the
north of the Makran Fault Line in particular near Pasni
was approximately 4.3 m.
The present study indicates that Muscat was less
affected with a rise in the sea surface of approximately
0.22 m.

Cyclone and Tsunami Hazards in the Arabian Sea – A Numerical Modelling Case Study by Royal HaskoningDHV
248
Fig. 7 Computed maximum tsunami levels along the coastal areas caused by the 1945 earthquake with Mw = 8.1 [8].
Fig. 8 Water levels near Pasni (Pakistan).

Cyclone and Tsunami Hazards in the Arabian Sea – A Numerical Modelling Case Study by Royal HaskoningDHV
249
Fig. 9 Water levels near Muscat (Oman).
Table 3 Findings from the Heiderzadeh et al. [8] study and the present study.
Source of information Water level rise near Pasni (m) Water level rise near Muscat (m)
Heiderzadeh et al. [8] 4.5 to 5.5 0.30
Present study 4.3 0.22
The findings from the Heiderzadeh et al. [8] study
and the present study are summarised in Table 3.
A good agreement was found both in the pattern
and the magnitude of the sea surface rise near Pasni
and Muscat between the Heiderzadeh et al. [8] study
and the present study. Therefore, it is concluded that
the present model is capable of predicting the sea
surface rise with an acceptable level of confidence.
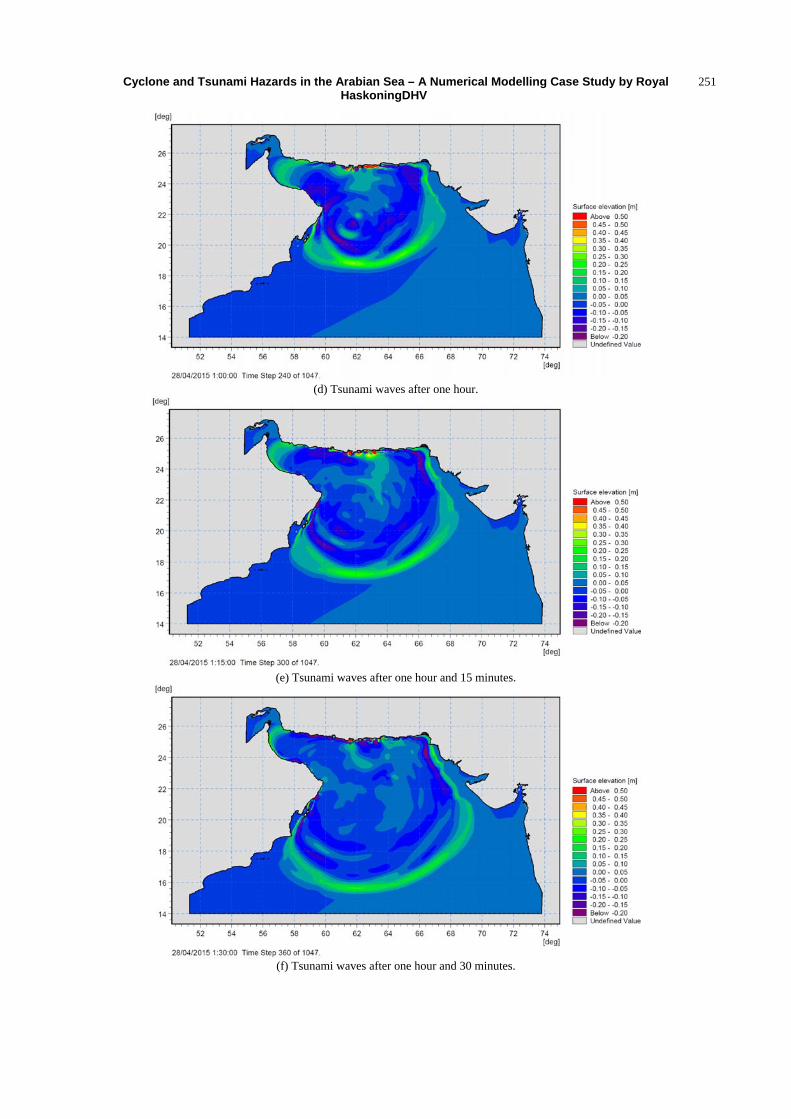
4.4 Model Results
The propagation of tsunami waves over time was
extracted from model results as illustrated in Fig. 10.
The model results indicate that it will take
approximately 15 minutes for the tsunami to reach
Pasni, less than 30 minutes to reach Muscat and less
than one hour to reach Masirah Island. Fig. 11
illustrates the maximum sea surface elevation during
the entire passage of the tsunami. The coastal areas
north of the Makran Fault Line are the worst affected
due to their close proximity to the fault. A rise in
water level of 4.3 m was found at Pasni and 0.22 m at
Muscat. The maximum current speeds during the
entire duration of the tsunami are shown in Fig. 12.
Again, the coastal areas north of the Makran Fault
Line are the worst with maximum current speeds up to
3.2 m/s predicted.
5. Application of Modelling Results
The results from the cyclone and tsunami models
provide valuable information at all stages of a project
including planning, design, environmental impact
assessment, construction, operation, and
de-commissioning. The model results can also be used
in emergency planning and decision-making to
estimate potential loss of life, damage to properties
and marine facilities and to develop mitigation
measures and plan clean-up operations.
The regional tidal hydrodynamic model can be used
to simulate tidal movements and surges as well as to
drive a wide range of other models such as cyclone,

Cyclone and Tsunami Hazards in the Arabian Sea – A Numerical Modelling Case Study by Royal HaskoningDHV
250
(a) Tsunami waves after 15 minutes.
(b) Tsunami waves after 30 minutes.
(c) Tsunami waves after 45 minutes.
Cyclone and Tsunami Hazards in the Arabian Sea – A Numerical Modelling Case Study by Royal HaskoningDHV
251
(d) Tsunami waves after one hour.
(e) Tsunami waves after one hour and 15 minutes.
(f) Tsunami waves after one hour and 30 minutes.

Cyclone and Tsunami Hazards in the Arabian Sea – A Numerical Modelling Case Study by Royal HaskoningDHV
252
(g) Tsunami waves after one hour and 45 minutes.
Fig. 10 Tsunami wave propagation over time.
(a) Maximum sea surface elevation - entire domain.
(b) Maximum sea surface elevation - zoomed in to the north.
Fig. 11 Maximum sea surface elevation during the entire duration of the tsunami.

Cyclone and Tsunami Hazards in the Arabian Sea – A Numerical Modelling Case Study by Royal HaskoningDHV
253
(a) Maximum current speeds - entire domain.
(b) Maximum current speeds - zoomed in to the north.
Fig. 12 Maximum current speeds during the entire duration of the tsunami.
tsunami, oil spill, water quality, sediment transport
and morphological models.
The cyclone and the tsunami models are key tools
for deriving robust design conditions for coastal and
marine structures and facilities. The models can also
provide input conditions to scale physical models for
testing structural stability and overtopping rates and
input to coastal flood studies.
6. Conclusion
This article illustrates how hydrodynamic and wave
models can be used to simulate the impacts of
cyclones and tsunamis on coastal developments and
facilities. Although the emphasis has been on
modelling these processes within the Arabian Sea, the
methodology outlined in the article could be applied to
Cyclone and Tsunami Hazards in the Arabian Sea – A Numerical Modelling Case Study by Royal HaskoningDHV
254
sites within other regions that are affected by these
natural hazards.
Acknowledgements
The authors would like to thank Royal
HaskoningDHV (an independent, international
engineering and project management consultancy
company, www.royalhaskoningdhv.com) for giving
permission to publish this article. For more details on
this article and other numerical modelling work
carried out by Royal HaskoningDHV worldwide,
please contact Dr. Zaman Sarker (email:
References
[1] DHI. 2014. MIKE21 Flow Model FM User Guide, DK-2970, Hørsholm, Denmark.
[2] C-Map JEPPESEN Commercial Marine, Hovlandsveien 52, Egersund, Postal Code 4370,
Norway, 2014, available online at http://www.jeppesen.com/index.jsp.
[3] DHI. 2014. MIKE21 Toolbox User Guide, DK-2970, Hørsholm, Denmark.
[4] DHI. 2014 MIKE21 SW User Guide, DK-2970, Hørsholm, Denmark.
[5] The Joint Typhoon Warning Center (JTWC), the U.S. Department of Defense Agency, http://www.usno.navy.mil/JTWC.
[6] Ministry of Transport and Communications, Civil Aviation Affairs, General Directorate of Meteorological and Air Navigation, Department of Forecasting and Monitoring, Sultanate of Oman. Report adverse weather conditions for the special Tropical Cyclone (bit) (during the period May 31 to June 6, 2010).
[7] World Meteorological Organisation, WWRP 2010 – 2, 1st WMO International Conference on Indian Ocean Tropical Cyclones and Climate Change, Muscat, Sultanate of Oman, 8-11 March 2009.
[8] Heidarzadeh M., Pirooz M. D., Zaker N. H., and Synolakis C. E. 2008. “Evaluating Tsunami Hazard in the Northwestern Indian Ocean.” Pure appl. geophys. 165 (2008): 2045-58.