cyprus' tourism: environment, profitability ... · inextricably bound up in mastering and...
TRANSCRIPT

Cyprus' Tourism: Environment, Profitability & Sustainability Dynamics
Nicholas C Georgantzas, Fordham University @ Lincoln Center, New York, NY 10023, USA Tel.: (+212) 636-6216, ƒax: (+212) 765-5573, e-mail: [email protected]
AbstractIn response to Cyprus Hotel Association's foresight to test how Cyprus' year 2010 official strategy might affect tourist arrivals, hotel bed capacity and profitability and the island's environment, this study looked at Cyprus' hotel value chain within the island's tourism customer-supplier value chain. It focused on relations among tourism sectors as well as on links with and leaks to other socioeconomic sectors, including the environment. A system dynamics simulation model helped compute 35 scenarios of what might happen to Cyprus' tourism over the next 40 years. The faithful reproduction of historical tourism and bed capacity data through a 40-year time horizon shows the model's usefulness. The 35 strategic scenarios assess hotel value-chain sensitivity (25 scenarios), tourism growth (4 scenarios) and tourism seasonality (6 scenarios), along with their potential effects on the sustainability of Cyprus' environment and hotel profit. Keywords: Cyprus, environment, government policy, hospitality industry, hotel value chain, simulation modeling,
strategy, sustainability, system dynamics, tourism
1 Introduction Tourism plays a significant role in people's lives. A growing worldwide phenomenon, it attracts young and old alike to new destinations and exotic experiences, in numbers unheard of a few decades ago (Anonymous 1997). The World Tourism Organization (WTO) reports over 700 million tourism arrivals for the year 2000 worldwide, an 18 percent increase over 1996. The picture looks even rosier for world economies as receipts from tourism in the past 10 years have almost tripled, rising above US$620 billion in 2000, a 47 percent increase (WTO 2001). Although predominately seen as benign to the environment, tourism requires both infrastructure and material. New airports, hotels, roads and golf-courses wreak havoc on the local environment and cause substantial increases in sea, air, land and noise pollution for large areas, not to mention the disruption to local cultures and societies (Akis, Peristianis & Wagner 1996). In order to accommodate golf players, for example, vast areas of forest are cut and chemical fertilizers and water (in some cases 3,000 cubic meters of water per day) are used in vast quantities. Countries want to preserve the environment in order to attract foreign visitors, but often «eco-tourism» is not ecological. One of the causes of clear-cutting mountain slopes, for example, is to supply firewood for climbing and trekking tourists. Similarly, hotels, roads and gasoline stations are built just for nature-loving visitors. Cyprus laid its tourism foundations in the early 1960s, its sensational growth touching every facet of the island's life. The summer of 1974 Turkish invasion brought all economic activity to a standstill. It divided the island into a Greek-Cypriot area, controlled by the internationally recognized Cypriot Government (59 percent of the island's land area), and a Turkish-Cypriot area (37 percent of the island), separated by a UN buffer zone (4 percent of the island). There are also two British sovereign base areas within the Greek-Cypriot portion of the island (Fig. 1). The blow was devastating for the two highly developed Famagusta and Kyrenia areas the invaders took. Lost to the invasion were 13,000 hotel beds, constituting 71.7 percent of the total bed capacity at the time, plus 5,000 beds under construction and about 40 percent of the island's restaurants, cafes, bars and night clubs (Anonymous 1998).

The government of the Republic of Cyprus, through the Cyprus Tourism Organization (CTO), a semi-government organization responsible for planning, promotion and marketing Cyprus' tourism, and the island's hoteliers and other tourism value-chain participants worked

hard for the reactivation of tourism in the Republic's free areas (Fig. 1). The Ministry of Commerce, Industry and Tourism oversees CTO's activities. Cyprus is not the only place in the world where visitors can take blue skies, sparkling waters, miles of beaches and sun-drenched days for granted. But it is absolutely the only Mediterranean island where Aphrodite was born, Richard the Lionhearted was married, and Shakespeare set Othello. With entire villages dedicated primarily to tourism, e.g. Ayia Napa and Protaras (Fig. 1), the free part of the island is large enough (5,457.5 sq. km) to offer guests limitless choice and space, yet small enough to allow for a sense of familiarity and place. Whether tourists most enjoy exploring archaeological sites and museums or perhaps are nature lovers or outdoor sports enthusiasts, the clean air and golden light equally impress. So do the practically non-existent crime and the heartfelt Cypriot culture and hospitality (Fig. 2). Akis et al. (1996) outline the dangers of ghetto tourism resulting from governments not consulting with local residents about tourism development projects. In such cases, visitors remain isolated either in holiday camps, such Club Mediterranean and Club 18-30, or in planned resorts, such as Benidorm, Spain. Even if old attitudes die hard, alternative tourism emphasizes niche-market destinations with more than a sandy beach, warm sea and a cloudless sky. Alternative tourism necessitates interaction, however, between visitors and local residents. When guests stray from hotels and resorts either by hired cars or by penetrating the local mysteries of public transportation, they meet and interact with local shopkeepers, restaurateurs, farmers and shepherds. Anyone involved in an interesting-looking or photogenic activity will do. Realizing the vital role tourism can play in diversifying and restructuring its economy, Cyprus' government has placed from the outset a high priority on tourism. The emphasis has been mainly on the development and expansion of the tourism product and gaining for Cyprus a top place among its Mediterranean competitors. The policy aims at the high and middle-income tourists to the exclusion of mass tourism. As a result, the majority of tourists belong to the more sophisticated classes and are of a mature age (Toufexis-Panayiotou 1989). The annual average growth rate in tourist arrivals during the pre-invasion 1960-1974 period was about 20 percent compared to the corresponding eight percent growth in international tourist traffic. The annual growth in foreign exchange earnings from tourism in the period was about 22 percent compared to a 12 percent earnings from tourism internationally (Kammas 1991). Chief problems facing Cyprus in the years after the invasion were: (a) the re-establishment of Cyprus on the world tourist map, (b) the creation of new hotel accommodation and ancillary facilities to replace those lost, and (c) the construction of new international airports in Larnaca and Pafos (Fig. 1) to link Cyprus with the outside world. After 1976 tourism took anew its high-priority place in government plans, reflected in the aims, target policy and expenditure programs of the 1977-78, 1979-81, 1982-86, 1987-91 and 1994-98 official development plans. Recognizing that Cyprus' tourism is currently at a turning point, CTO has prepared a strategic plan to the year 2010 in close cooperation with its partners in the public and private sectors. The new strategy aims at competitively repositioning the Republic of Cyprus in the international tourism market. Its implementation entails hiring Bates UK, London, part of Bates' Worldwide Cordiant Communications Group, promoting Cyprus as a tourist destination across the globe. CTO's consolidated CY£13 (US$22) million worldwide account encompasses more than 10 markets in Europe, North America and the Middle East that local agencies served in times past (Campbell 1999, Elliot 1999). The Cyprus Hotel Association has been particularly interested in how the 2010 official strategy might affect Cyprus' tourist arrivals, which in turn determine hotel bed capacity and

profitability. Moreover, since the European Union (EU) already sees Cyprus as widely leading the accession process and in line to be among the first to formally join the EU (Anonymous 2000b), giving due regard to the environment is also a top priority. Many attributes, causes and perspectives can be advanced in this context, trying to determine what lies at the core of Cyprus' tourism performance. The answer is, however, inextricably bound up in mastering and controlling the entire tourism customer-supplier value chain (Porter 1985, Zeleny 1999). A dominant issue in value-chain management (VCM) is the integration and coordination of business processes (Georgantzas 2001b, Hammer 2000, Peppard 1999). The sustainability of Cyprus' tourism might well depend on the ability of its value-chain participants to coalign the processes and practices of partner enterpriseseach of them run as an autopoietic (self-organizing) network. In response to the Cyprus Hotel Association's concerns, this essay examined Cyprus' hotel value chain within the island's tourism customer-supplier value chain. Its focus was on relations among tourism sectors as well as on links with and leaks to other socioeconomic sectors, including the environment an its sustainability. A five-sector system dynamics (Forrester 1958) model helps explore the dynamic behavior patterns (dynamics) of a generic value-chain management (VCM) structure in order to unearth what Cyprus' tourism, including its hotels and their suppliers are up to. Adapted from Sterman (2000, Ch. 17), the VCM segments of the simulation model explain the sources of oscillation, amplification and phase lag generally seen in customer-supplier value chains; phenomena which executives at 3M, Bristol-Myers Squibb, Hewlett-Packard and P&G collectively call the bullwhip effect (Hau, Padmanabhan & Whang 1997). Locally rational policies that create smooth and stable adjustment of individual business units can, through their interaction with other functions and firms, cause oscillation and instability, i.e. bullwhip-like dynamics. The model incorporates policy parameters pertinent to decision making and timing that allow testing the sensitivity of Cyprus' hotel VCM to customer-supplier value chain changes. The results reveal policies that hoteliers and their suppliers can use to improve performance. Following the data section below is a brief overview of Cyprus' tourism customer-supplier value chain. Then the description of the system dynamics model precedes the interpretation of its dynamics. It is perhaps its capacity to reintegrate the content and process perspectives of strategy that has turn system dynamics into a new paradigm for competitive advantage (Istvan 1992), and simulation modeling (Georgantzas 2001a) in general into a critical fifth tool in addition to the four tools used in science: observation, logical/mathematical analysis, hypothesis testing and experiment (Turner 1997). But system dynamics models also allow computing scenarios to assess the possible implications of strategic situations. These are not merely hypothesized plausible futures, but computed by simulating changes in strategy and the business environment (Georgantzas & Acar 1995). Following the model structure description, the faithful reproduction of historical tourism and bed capacity data through a 40-year time horizon attests to the model's usefulness. Then, 35 computed scenarios show what might happen to Cyprus' tourism over the next 40 years. These strategic scenarios assess Cyprus' hotel value-chain sensitivity (25 scenarios), tourism growth (4 scenarios) and tourism seasonality (6 scenarios) as well as their potential effects on the sustainability of Cyprus' environment and hotel profitability.

2 Data Apart from the 1974 Turkish invasion that reduced the island's free land area down to 59 percent, Cyprus also suffers from other anthropogenic changes like the rest of our biosphere. Multiple data sources, some of them conflicting, of course, including official ones, helped synthesize the graph on the lower left of Fig. 1 (Ellis 1998). The gray and highly variable yearly average-temperature curve shows Cyprus' annual mean temperature and the black 5-year average curve is a moving average. The latter curve smoothes out annual variations to show Cyprus' tendency towards (global) warming, ascribable to anthropogenic climate changes. The graph shows a 1°C rise over the century. Certainly, monthly variations are even greater, with lower and upper peak temperatures at about -5°C and +47°C, respectively, in the Mesaoria (Lefkosia) region. The graph on the lower right of Fig. 1 shows the average temperature of the Mediterranean Sea surrounding Cyprus. The upper layer temperature, which fluctuates more than the buffered lower layer temperature, might be in part responsible for the island's high tourism seasonality (top-left panel of Fig. 3), which the Cyprus Hotel Association is so concerned with.
Figure 3 shows a bird's eye view of the data used in computing the scenarios requested by the Cyprus Hotel Association. The actual annual tourism data (top left of Fig. 3) show a high growth pattern which, although desirable, masks Cyprus' high tourism seasonality. Cyprus' Statistical Service (CYSTAT) only recently has started to compile monthly tourism data, capturing the regular upward and downward movements throughout each year that tie to recurring tourist arrivals (CYSTAT 2000). Although the bed capacity dynamics (middle left of Fig. 3) is qualitatively similar to annual tourism, Cyprus' hotel price seasonality shows that the island's hoteliers have not yet aligned their 2001 price schedules (Window on Cyprus Team 2001) with the island's tourism seasonality.

Cyprus' tourism depends on hotel bed capacity in its coastal areas. This was also the chief characteristic of the pre-1974 tourism. Following its reactivation, coastal bed capacity experienced a great boom. Conversely, bed capacity of the Nicosia area and hill resorts changed very little. Despite the great bed capacity increase, the total number of beds in the government-controlled areas surpassed for the first time in 1981 the entire island's bed capacity level of 1973. The total capacity of the free areas was 15,253 beds in 1981 as against 14,796 in 1973. By the end of 1990 the number of beds in operation in the free area totaled 59,271. The increasing bed capacity led to the approval by the cabinet in late November 1990 of the new tourist policy which aims at slowing down the rate of growth of beds and the gradual upgrading of the tourism product. Although the rate of new applications for the construction of new bed capacity was reduced drastically as a result of this policy, bed supply reached 86,151 beds by the end of 1998 due to the many approvals granted prior to the new restriction measures (CYSTAT 2000). The US Census Bureau's (2000) international database (IDB) furnished historical data and long-term forecasts for Cyprus' population (lower left of Fig. 3). IDB contains statistical tables of demographic and socioeconomic data for 227 countries and areas of the world, including Cyprus. Last but not least on Fig. 3, Francoudi & Stephanou's on-line Scrutinizer Reports were most helpful in forming the probability density function (pdf) of Cyprus' hotel profit margin (xak.com 2001). The Cyprus Hotel Association's concern with high tourism seasonality prompted the benchmarking of Fig. 4. The Association's concern is justified. Cyprus' tourism seasonality shows a much wider spread than those of Malta (MTA 2000) and USA (ITA 2001) do.
An immediate implication of high tourism seasonality is the off-season bed capacity under-utilization problematic. Akis et al. (1996) outline more socioeconomic consequences for Ayia Napa and Protaras (Fig. 1). Dedicated primarily to tourism, these villages become ghost towns in the winter when tourism workers return to their hometowns and regular winter jobs. Looking more closely at links with and leaks to other socioeconomic sectors, Fig. 5a shows Cyprus' production and consumption seasonal index values for water, electricity and natural gas (CYSTAT 2000). Comparing Cyprus' natural gas production and consumption seasonality with that of the European Union's 15-country (EU-15) and the economic and monetary union's (Euro zone) seasonality (Eurostat 2001) does not reveal any considerable discrepancy (Fig. 5b). The large influx of tourists during the summer months, however, does seem to have an impact on Cyprus' water and electricity production and consumption (Fig. 5c). Cyprus' water is its most important natural resource and a prerequisite for progress. Water scarcity has acted as a limiting constraint for the development of agriculture and the also water intensive tourism (CYSTAT 2000). Tourism aggravates Cyprus' water problems, among which
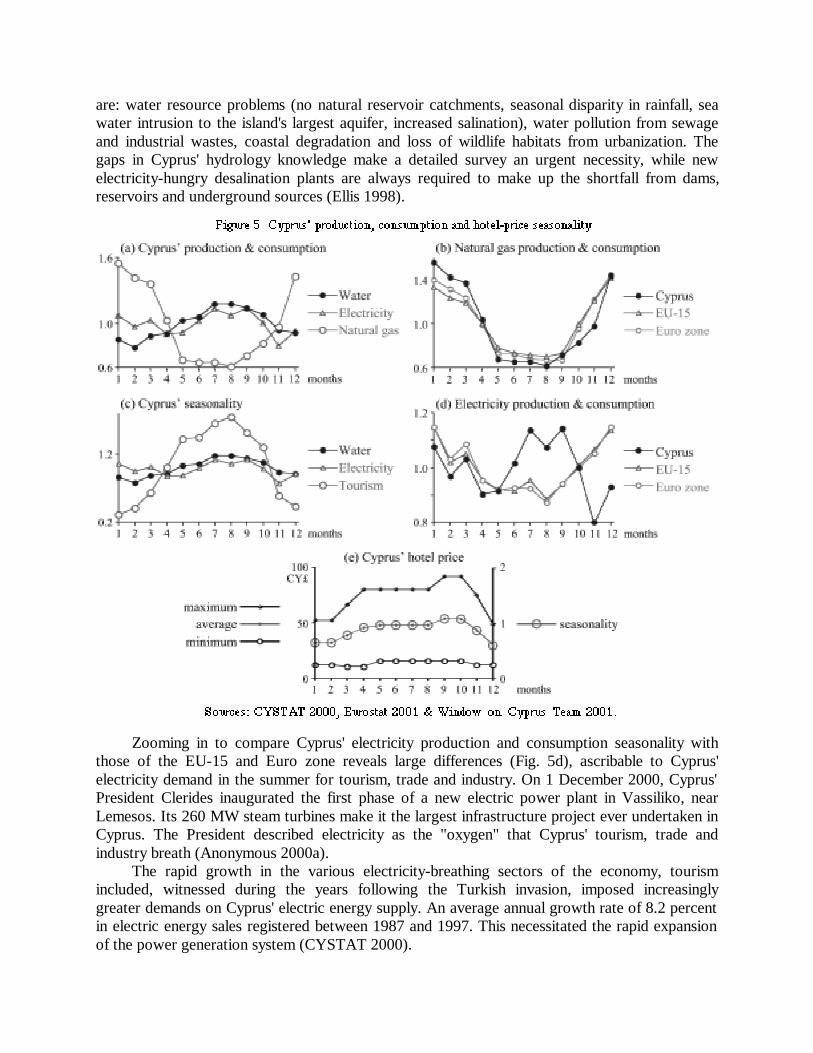
are: water resource problems (no natural reservoir catchments, seasonal disparity in rainfall, sea water intrusion to the island's largest aquifer, increased salination), water pollution from sewage and industrial wastes, coastal degradation and loss of wildlife habitats from urbanization. The gaps in Cyprus' hydrology knowledge make a detailed survey an urgent necessity, while new electricity-hungry desalination plants are always required to make up the shortfall from dams, reservoirs and underground sources (Ellis 1998).
Zooming in to compare Cyprus' electricity production and consumption seasonality with those of the EU-15 and Euro zone reveals large differences (Fig. 5d), ascribable to Cyprus' electricity demand in the summer for tourism, trade and industry. On 1 December 2000, Cyprus' President Clerides inaugurated the first phase of a new electric power plant in Vassiliko, near Lemesos. Its 260 MW steam turbines make it the largest infrastructure project ever undertaken in Cyprus. The President described electricity as the "oxygen" that Cyprus' tourism, trade and industry breath (Anonymous 2000a). The rapid growth in the various electricity-breathing sectors of the economy, tourism included, witnessed during the years following the Turkish invasion, imposed increasingly greater demands on Cyprus' electric energy supply. An average annual growth rate of 8.2 percent in electric energy sales registered between 1987 and 1997. This necessitated the rapid expansion of the power generation system (CYSTAT 2000).

The Electricity Authority of Cyprus (EAC) is an independent, non-profit semi-government enterprise established under the Electricity Development Law CAP 171 of 1952 in order to exercise and perform functions relating to the generation, transmission and distribution of electric energy in Cyprus. The total capacity of the EAC generation system has been 690 MW installed at two power stations: Dhekelia and Moni. One of the EAC's primary and continuous concerns is to minimize the impact of electric energy generation to the environment. During the last three years EAC has invested a sum in excess of CY£3 million in projects aimed at the protection of Cyprus' environment. The on-line data of the Window on Cyprus Team (2001) helped synthesize the graph of Fig. 5e. Cyprus' hoteliers list their price schedules at this web site, which lists from one-star to five-star rated hotels. Converting Cyprus' average hotel prices for 2001 into seasonal index values allows computing tourism seasonality scenarios to assess what might happen to Cyprus' hotel profitability if the island's hoteliers aligned their price schedules with tourism seasonality.
3 Value-chain management (VCM) The requisite manifestations of the firm and industry value-chain frameworks (Porter 1985) or, more broadly, value-chain management (VCM) is ablaze in trade journals and magazines today. Most authors either look at VCM in terms of traditional logistics or talk metaphorically about its highly complex dynamics. Both views are limiting. Modern firms rapidly transition into networks of peers rather than hierarchical trees. Business links form and dissolve rapidly within adaptively complex network systems. And net member collaboration replaces command and control, rendering traditional management meaningless. Where communication and culture can be more important than technology, issues shift from data management to decision support to collaboration effectiveness tools (Georgantzas 2000 & 2001b). Figure 6 shows the complex network of customers, service providers, travel agencies and tour operators that comprise Cyprus' tourism-industry value chain. Modern communication and information technology (ICT) enables customers to access other tourism-industry value-chain participants directly through the Internet. However, the service providers' specialized product (i.e. good and service) knowledge, and the travel agency and tour operator contributions continue to create economic value added (EVA) experiences for Cyprus' visitors. The rest of this essay focuses on Cyprus' hotel value chain (bottom right of Fig. 6). Briefly, a customer-supplier value chain is the set of structures and processes that all firms use to deliver output to their customers (Porter 1985). The output can be a physical product, e.g. a candlestick, the provision of a salient resource, e.g. skilled labor, or an intangible product, e.g. hospitality service or process design. As Sterman points out, a customer-supplier value chain "consists of (1) the stock and flow structures for the acquisition of the inputs to the process and (2) the management policies governing the various flows" (2000, p. 663). It sounds simple, but why do customer-supplier value chains so often exhibit persistent and costly instability? So often in fact oscillating order rates (e.g. beds per year) and inventories (e.g. hotel bed capacity) hurt VCM that executives at 3M, Bristol-Myers Squibb, Hewlett-Packard and P&G have come up with a nickname for the persistent and costly instability observed in customer-supplier value chains: the bullwhip effect they call it. Hau et al. (1997) argue that the bullwhip effect is not a deliberate attempt to subotage the performance of fellow value-chain members, but the result of distorted information throughout the value chain. Namely, Hau et al. see demand forecast inaccuracy, hasty supply-chain rationing, order batching inaccuracy and price fluctuations as prominent causes of the bullwhip effect in customer-supplier value chains. Transacting business through digital commerce

enhances VCM, enabling firms to somewhat tame the bullwhip effect, i.e. the magnification of demand fluctuations as customer orders move up the value chain.
Modern distributed ICT not withstanding, however, the bullwhip effect persists, its sting felt as costly instability strikes customer-supplier value-chains. The buildup in work-in process (WIP) inventory alone often erodes VCM profitability (Handfield & Nichols 1999). The question is: What is the origin of the bullwhip-like oscillations in value chains? And how must Cyprus' hoteliers and their suppliers handle them?
4 Model description A system dynamics simulation model (Fig. 7 & 8) highlights the structure underlying member interactions along Cyprus' hotel value chain (bottom right of Fig. 6). The model incorporates a generic VCM structure that allows modeling customer-supplier value chains in business as well as in physical, biological and other systems. Although the VCM model structure is for the most part generic, its situation specific parameters faithfully reproduce the dynamic behavior patterns seen in Cyprus' hotel value-chain processes, business rules and resources.
4.1 Cyprus' hotel value-chain management (VCM) sectors
A major bullwhip-effect component, oscillation requires both that time delays exist in the negative feedback loops controlling a system and that VCM fails to account for them. Managers often ignore the supply chain of corrective actions initiated but which have not yet had their effect. Although foolish to ignore time delays, case studies in real estate and shipping as well as experimental data show that people often do exactly that (Sterman 2000). In Cyprus, the fast-

increasing bed capacity led to the November 1990 tourism policy measures, but bed supply continued growing after the restriction's implementation (CYSTAT 2000). Like all firms, Cyprus' hotels are sets of processes. Their order fulfillment, service delivery, advertising, hiring, firing and pricing are all processes. Each requires inputs acquired from suppliers. A customer-supplier value chain is the structure that acquires the inputs, transforms them into outputs and delivers them to customers. Customers can be external (e.g. tourists) or internal (e.g. hotels) and the inputs and outputs can be tangible (e.g. a jet ski and its parts and raw material) or intangible (e.g. a concert performance where the output is a soul-inspired, spiritually rejuvenated audience). Figure 7 shows the stock and flow diagram of Cyprus' hotel generic value-chain structure. In system dynamics models, rectangles represent stocks, i.e. state variables that accumulate through time, such as the Supply Chain and Bed Capacity of Fig. 7. The word icons that fill and drain the stocks represent material flows that cause the stocks to change. The acquisitions rate (top of Fig. 7), for example, shows the beds' flow from Supply Chain to Bed Capacity. Single-line arrows represent information flows, while plain word icons depict auxiliary constants, behavioral relationships or decision points that convert information into decisions. Changes in the acquisitions rate, for example, depend on Cyprus' hotel Supply Chain shipments adjusted by an acquisition lag time. The diagram of Fig. 7 is modified from the actual simulation model built using iThink® Analyst 6 (Richmond et al. 2000). Value chains entail a stock and flow structure (top of Fig. 7) for the acquisition, storage and conversion of inputs into outputs, and decision rules (middle of Fig. 7) governing the flows. The jet ski value chain, for example, includes the stock and flow networks of material such as hulls and bows pulled out of jet ski molds. The hulls and bows travel down monorail assembly paths prior to their shipment to dealers. At each stage in the process, there is a stock of parts buffering production activities (e.g. an inventory of fiberglass laminate between hull and bow acquisition and usage, an inventory of hulls and bows for the lower and upper structure of the jet ski, and an inventory of jet skis between dealer acquisition and sales). The decision rules governing the flows entail policies for ordering fiberglass laminate from suppliers, scheduling the spraying of preformed molds with three to five layers of fiberglass laminate before assembly, shipping new jet skis to dealers and customer demand (i.e. desired bed capacity: bottom of Fig. 7). Cyprus' hotel value chain consists of cascades of supply chains, which often extend beyond a single hotel's boundaries. Effective VCM models must incorporate different agents and firms, including suppliers, hotels, distribution channels and customers (e.g. tourists). System dynamics is well suited for Cyprus' hotel VCM modeling and policy design because the island's hotel value chain entails multiple chains of stocks and flows, with time lags and delays, and because the decision rules governing the flows create feedback loops among value-chain participants or value- and supply-chain partners. There is a one-to-one correspondence between the model diagram of Fig. 7 and its algebraic equations. The model was built by first diagramming its structure on the glass of a computer screen and then specifying simple algebraic equations and parameter values. The software enforces consistency between the diagram and the equations, while its built-in functions help quantify policy parameters and variables pertinent to Cyprus' hotel value chain. The stock and flow structure of Fig. 7 shows the Supply Chain (SC) stock of unfilled orders for new hotel beds, i.e. orders that have been placed but not yet received. Cyprus' hotel SC is the accumulation of orders less acquisitions.

The max function of iThink® Analyst 6 ensures that bed acquisitions and orders do not become negative. Orders cannot be negative in most situations. Once fiberglass laminate is delivered, for example, and sprayed on preformed jet ski molds, it cannot be returned. In cases where excess units can be returned, different cost and criteria usually govern the returns process, so it must be modeled separately, not as a negative orders rate. The stock to be controlled, hotel Bed Capacity, is the accumulation of the acquisitions rate less the depreciation rate and the beds lost to the summer of 1974 Turkish invasion. The depreciation rate that drains Cyprus' hotel Bed Capacity (BC) arises from decay and use, i.e. capital depreciation. BC depreciation depends on Cyprus' hotel BC, but can also depend on other endogenous or exogenous variables and parameters, such as average bed life (top right of Fig. 7). Generally, hotel managers cannot simply add new beds to a hotel as they wish. Acquiring new beds involves time lags and delays, and requires resources. Hotel construction, for example, requires labor and equipment, and hiring new employees requires recruiting effort. Resources can themselves be dynamic and impose capacity constraints. Assuming ample process capacity, and that the only delay in acquiring new beds entails an acquisition lag, the acquisitions rate depends on the Supply Chain of officially registered beds that have been ordered but not yet received and the acquisition lag. Like the orders rate, the acquisitions rate must also be nonnegative.

In the decision rules structure (middle of Fig. 7), Cyprus' hoteliers and hotel managers order to replace depreciated hotel beds as well as any discrepancy between desired bed capacity and actual BC. The acquisition lag forces them to maintain an adequate supply of unfilled orders, so that bed acquisitions are close to desired acquisitions. Hence, the orders rate represents an anchoring and adjustment process. Desired acquisitions is the anchor, which Cyprus' hotel VCM must adjust to bring its SC of unfilled orders in line with its target, the desired SC. The simplest formulation that will adjust BC is linear in the discrepancy between desired and actual bed capacity. Like in most VCM situations, the complexity of the feedback loops among variables, e.g. the negative (balancing) BC and SC control loops of Fig. 7, makes it impossible to optimize Cyprus' hotel customer-supplier value chain. Instead, people use cognitive biases (CBs) or heuristics, e.g. anchoring and adjustment (Georgantzas 1990), when placing orders. The decision rules structure of Fig. 7 is thereby firmly grounded on the theory of bounded rationality developed by Cyert & March (1963) and Simon (1982). Cyprus' hotel VCM must adjust its Supply Chain analogously to how it adjusts its Bed Capacity. Similarly, it must set its desired SC according to the expected acquisition lag, which could generally differ from the actual acquisition lag. The model of Fig. 7 assumes a high degree of rationality in Cyprus' hotel VCM. It assumes hotel managers adjust their SC to achieve desired acquisitions, which includes replacement of depreciated beds and correction of temporary gaps between desired and actual BC. Sterman's (2000) experimental data show that VCM decisions are often blunt, i.e. they do not adjust SC in response to temporary imbalances in BC, but use rough estimates of long-term throughput requirements, i.e. an expected depreciation rate. The formulation of the desired Supply Chain must be refined if individual hotels were to use this generic VCM model, based on empirical investigation of actual hotels' VCM decision-making process. Why would desired acquisitions ever depend on expected depreciation rather than the actual depreciation rate? Every flow's current value is an instantaneous rate of change, while instruments can only measure average rates over some finite interval. Neither can a hotel measure its sales or depreciation rate right now. No matter how accurate the instruments used, rates of change measured and reported in VCM always differ from the instantaneous ones. Cyprus' hotel VCM structure of Fig. 7 is generic. Actual VCM systems can be nonlinear, with complex feedback loops among endogenous and exogenous variables, influenced by many systematic and stochastic forces. Individual hotel acquisition processes can entail variable delays and constrained supplier capacities. Such systems tend to exhibit wild oscillations and instability, i.e. the bullwhip effect.
4.2 Cyprus population, environment, tourism and hotel profitability sectors
Within the Population & Environment sector (top panel of Fig. 8), the carbon dioxide (CO2) pollution stock, CO2 Pollution, is the accumulation of Cyprus' anthropogenic emissions less the Mediterranean Sea region self clean-up rate. The clean-up rate that drains Cyprus' CO2 Pollution depends on the level of anthropogenic pollution itself as well as on a clean-up time constant.

Emissions that feed CO2 Pollution (top panel of Fig. 8) depend on Cyprus' population and tourism and on emissions\person, a constant taken from Brenkert's (1998) CO2 emission data on Cyprus. Together, Cyprus' population, local tourism and monthly Tourism (middle panel of Fig. 8) determine the population and tourism sum. According to CYSTAT (2000) both CTO and Cyprus' government attach great importance to local tourism. The latest study on domestic tourism conducted in 1995 revealed that about 46 percent of Cypriots take long holidays. Out of these, 61 percent took their long holidays exclusively in Cyprus and 8 percent in Cyprus and abroad (31 percent chose to only travel abroad). These are precisely the percentages the model uses. On the right side of the top panel of Fig. 8, the world population data and world land area co-determine the world ef (environmental footprint). Compared with Cyprus' smooth ef, i.e. the smooth ratio of the island's free land area divided by its total population and tourism, the world environmental footprint allows creating a dynamic measure of relative attractiveness between Cyprus and the rest of the world. The ef effect, i.e. the ratio of Cyprus' smooth ef divided by the world ef, assumes that the higher this ratio is, the more attractive the island is to potential tourists, and vice versa. The environmental footprint effect (ef effect), which depends on Cyprus' total population and tourism, feeds back to the island's Annual Tourism via the inflow of foreign visitors who come to visit Cyprus every year.

The logistic or Verhulst growth model, after François Verhulst who first published it in 1838 (Richardson 1991), helps explain and predict Cyprus' actual Annual Tourism, a real quantity that cannot grow forever (top left panel of Fig. 3). Every system that initially grows exponentially, eventually approaches the carrying capacity of its environment, whether it be food supply for moose, the number of people susceptible to infection, or the potential market for a good or service. As an autopoietic system approaches its limits to growth, it goes through a non-linear transition from a region where positive feedback dominates to a negative feedback dominated regime. S-shaped growth often results: a smooth transition from exponential growth to equilibrium. Widely used for modeling population growth, innovation diffusion and other social phenomena, the logistic growth model conforms to the requirements for S-shaped growth and the ecological concept of carrying capacity. The population it models typically grows in a fixed environment, such as Cyprus' foreign Annual Tourism has done since 1960 up to year 2000 (top-left panel of Fig. 3). Initially dominated by positive feedback, Cyprus' Annual Tourism might soon reach the island's critical carrying capacity, with a nonlinear shift to dominance by negative feedback. While accounting for Cyprus' tourism lost to the summer of 1974 Turkish invasion, further depleting the Annual Tourism stock is the outflow of Cyprus' visitors who might soon go as the island's free area reaches its natural tourism Carrying Capacity, estimated at seventy times the number of Cyprus' visitors in 1960. On the one hand, CYSTAT had compiled monthly tourism data for only 30 months at the time of this investigation (CYSTAT 2000). These were used for computing Cyprus' tourism seasonality (top panel of Fig. 3). On the other hand, Cyprus Hotel Association listed Cyprus tourism seasonality as one of its major concerns. Incorporating both the foreign Annual Tourism and the monthly Tourism stocks in the model (middle panel of Fig. 8) allows both looking at the big picture of annual tourism growth and assessing the potential long-term effects of tourism seasonality on the sustainability of Cyprus' environment and hotel profit. Moreover, the publicly available actual Annual Tourism data (top left panel of Fig. 3) from CYSTAT, allow testing the model's usefulness, depending on how faithfully it can reproduce the actual historical data over a 40-year time horizon. Cyprus' foreign visitors and local tourists arrive at the island's hotels and resorts according to Cyprus' tourism seasonality, thereby feeding Cyprus' monthly Tourism stock. About 11.3 days later, according to CYSTAT's (2000) estimated average stay days, both foreign visitors and local tourists depart, thereby depleting the monthly Tourism stock. By letting iThink® Analyst's step height = 0 and Cyprus' tourism seasonality continue repeating its established pattern, the model computes a zero-growth or base-run scenario for Cyprus' tourism. Subsequently, however, step height values other than zero initiate different tourism growth scenarios. Similarly, the substitution of the Malta and USA seasonality into the model allows testing the implications of Bates UK trying to alleviate Cyprus' tourism seasonality through precise target marketing. The modulo (mod) function of iThink® Analyst 6 converts simulation time (months) to a 12-month metric of time. Depending on which country's seasonality graphical table function (gtf) is used, each 12 months of simulation time, the corresponding gtf will reset itself to one (i.e. January). The last panel of Fig. 8 tells of yet another Cyprus Hotel Association concern: Hotel Profitability. Here, actual receipts per tourist feed into revenue until year 2000, thereby rendering all subsequent forward-looking projections thereafter into constant 2000 prices. Revenue in turn

feeds into Accounts Receivable which, with a pay lag of two months (i.e. 60-days net), in turn adds to the cumulative Cash on hand via the cash in inflow. Naturally, as in most business, not all accounts receivable convert into accumulated Cash, so the model subtracts a small fraction of write offs, the complement of a collectible fraction. On the lower right of the bottom panel of Fig. 8, expenses feed into Accounts Payable which, through its payments outflow, in turn depletes Cash via the latter stock's cash out outflow. Depending on the hotel profit margin complement, i.e. a (1 - profit margin) component, expenses account for both the fixed and the variable hotel cost. This total cost incorporates the cost of maintaining a certain level of Bed Capacity throughout the year as well as the cost of overbooking during the peak tourism season. Overbooking is a global phenomenon. Seeking to maximize capacity utilization during peak-season months, hotels overbook almost as frequency as airlines do within the global tourism value chain (Fig. 6). Guest complaints are up by 22 percent from two years ago (Drucker & Higgins 2001). Interviews with Cyprus' hoteliers and hotel managers showed that, as a courtesy, they pleasantly surprise their visitors by sending them on free cruises to nearby Egypt and Israel when hotel rooms are overbooked and tourists with hotel reservations do actually show up. This explains why hotel expenses depend on the maximum amount of either Bed Capacity or monthly Tourism. In the middle of the bottom panel of Fig. 8, hotel profit (hp) is the algebraic sum of revenue minus expenses. The hotel profit margin determines Cyprus' hotel expenses. During each computation interval (dt) in the simulation, iThink® Analyst's built-in Normal({, ) distribution function generates sequences of random numbers conforming to the sample mean () and standard deviation () parameters (lower left panel of Fig. 3), specified from the on-line data of Francoudi & Stephanou (xak.com 2001). By not specifying a random seed, the actual samples drawn from the Normal(, ) distribution function are not replicable. It is amazing how close to real life simulation modeling is! A 5-year moving average smooth hp smoothes out seasonal variations in Cyprus' hotel profit.
5 Simulation results
5.1 Behavior reproduction tests
Among common statistics that help assess a model's ability to reproduce system behavior, descriptive point-by-point metrics compute the error between a data series and the model output at every point for which data exist and then report an average over the relevant time horizon. The most widely used measure of fit is the coefficient of determination, R2, which measures the variance in the data explained by the model as a dimensionless fraction. If R2 = 1, then the model replicates the actual series exactly; if R2 = 0, then the model output is constant. The coefficient of determination is the square of the correlation coefficient, r, which measures the degree to which two series co-vary. The mean square error (MSE), which measures the average error between the simulated and actual data in the same units as the variable itself, weights large errors much more heavily than small ones. Which measure is best?

Although widely reported because audiences expect it, R2 is actually not very useful. Two series with the same error, e, for example, can generate very different R2 values depending on their trend (Sterman 2000, p. 874). What is important though is to know the sources of error as well as its size. Theil's (1966) inequality statistics provide an elegant decomposition of the MSE into three components: bias (UM), unequal variation (US) and unequal co-variation (UC), where UM + US + UC = 1. Bias arises when the model output and the actual data have different means. Unequal variation shows that the variances of the two series differ. Unequal covariation means that the model and the data are imperfectly correlated, i.e. they differ point by point. Dividing each component by the MSE gives the fraction of the MSE due to bias (UM), the fraction of the MSE due to unequal variation (US), and the fraction of the MSE due to unequal covariation (UC). A large UM reveals a potentially serious systematic error, usually due to errors in parameter estimates. US errors may also be systematic. When unequal variation dominates the MSE, the model and data match on average and are highly correlated but the variation in the two around their common mean differs. One variable is a stretched out version of the other. US may be large either because the trend in the actual data and the model is different, or because the model and the data have the same phasing but different amplitude fluctuations (Sterman 2000, p. 876). If most of the error is concentrated in unequal covariation, then the model captures the mean and trends in the data well, differing from the data only point by point. When UC is large, then most of the error is unsystematic and, according to Sterman (2000, p. 877), «a model should not be faulted for failing to match the random component of the data».

Figure 9 shows the actual (CYSTAT 2000) and simulated data for Annual Tourism and Bed Capacity. Although both the r and the R2 values are high, and the residual (e) plots (on the lower-left side of Fig. 9) show desirable patterns, it is Theil's inequality statistics (right panel of Fig. 9) that strongly support the model's usefulness. In Theil's Annual Tourism and Bed Capacity statistics, most of the MSE is concentrated in unequal covariation, UC, showing that the model captures the mean and trends in the actual data well, differing only point by point (i.e. unsystematic error).
5.2 Cyprus' hotel value-chain scenarios
Although generic, Cyprus' hotel value-chain structure (Fig. 7) yields important insight into its customer-supplier value chain dynamics. Figure 10 shows the system's response to incremental step increases in desired bed capacity at time t = 481 months (January 2001). Initially, desired bed capacity (Customer Demand sector of Fig. 7) and actual bed capacity are equal from t = 0 months (December 1960) to t = 480 months (December 2000). Then, at time t = 481 months (January 2001), the built-in step function of iThink® Analyst 6 allows simulating a set of five different surges in desired bed capacity (lower right panel of Fig. 10).
Each step increase in desired bed capacity immediately opens up a gap between desired and actual Bed Capacity. In order to adjust, Bed Capacity jumps, increasing desired acquisitions in the Decision Rules sector of Fig. 7. Since there is no capacity constraint on acquisitions, both acquisitions and Bed Capacity begin to rise. As they do, Cyprus' hotel bed shortfall diminishes, reducing the BC increase through time. As Bed Capacity rises, however, so does depreciation too (top right of Fig. 7). After three adjustment times, i.e. 108 months, Bed Capacity has adjusted to about 95 percent of its ascent to its new equilibrium. The consequences for Cyprus' hotel value chain are profound. First, the Bed Capacity adjustment process creates significant amplification. Although desired bed capacity increased by

50 percent in Run #5, orders (top left of Fig. 7 & middle right of Fig. 10) increase by a maximum of more than 700 percent (the peak of orders divided by orders at time t = 481 months). The amplification ratio, i.e. the ratio of the maximum change in the output to the maximum change in the input, is therefore 700%/50% = 14 (lower left of Fig. 10). A one-percent increase in desired bed capacity causes a 14-percent surge in Supply Chain demand (orders). While the amplification ratio's magnitude depends on adjustment times and lags, its existence does not (Sterman 2000, p. 673). Second, amplification is temporary. In the long run, a one-percent increase in desired bed capacity leads to a one-percent increase in Cyprus' hotel Supply Chain orders. After two-adjustment times, i.e. 70 months, Supply Chain orders gradually fall back to match acquisitions (middle of Fig. 10). During the disequilibrium adjustment, however, the Supply Chain orders overshoot their new equilibrium, an inevitable consequence of the stock and flow structure of customer-supplier value chains. The only way the Supply Chain can increase is for its orders inflow to exceed its acquisitions outflow. Within Cyprus' hotel value chain, its Supply Chain faces relatively larger changes in demand than hotel BC and the surge in demand is temporary. Third, although all four variables temporarily increase, the acquisitions' and orders' amplification ratios remain constant (lower left of Fig. 10). As desired bed capacity steps up, manifested in the desired bed capacity step, so do both rates' new equilibrium points, but in direct proportion to the step increase in desired bed capacity. This scenario set confirms Sterman's corollary that, while amplification magnitude depends on adjustment times and lags, its existence does not. A direct implication is that no matter how drastically tourists, tour operators and travel agencies downstream in Cyprus' tourism value chain (Fig. 6) change their orders' magnitude, they simply cannot affect the hotel value chain's supply-chain amplification. Cyprus' hotel VCM must never blame customers and downstream firms or their forecasts for bullwhip effects in Cyprus' hotel value chain. Fourth, the orders' amplification ratio is almost quadruple the acquisitions', suggesting that Cyprus' hotel suppliers face much larger changes in demand than hotels do. Although temporary, during its disequilibrium adjustment, orders consistently overshoot their new equilibrium points (middle right of Fig. 10), an inevitable consequence of the stock and flow structure. Customers are innocent, but Cyprus' hotel VCM structure is not. Figure 11 shows how Cyprus' hotel value-chain responds to acquisition lag changes (lower right of Fig. 11). Since the acquisition lag intervenes between Bed Capacity and its Supply Chain, changes are almost transparent to Bed Capacity and acquisitions (top left of Fig. 11), but surely the Supply Chain and its orders (top right of Fig. 11) feel them. The higher the acquisition lag is, the lower orders are before time t = 481 months (January 2001). According to Little's Law (Sterman 2000, pp. 421-425), Cyprus' hotel Supply Chain must contain its acquisition lag's worth of the bed throughput hotels desire, regardless of the probability distribution of its outflow. Little's Law also explains Cyprus' hotel value chain inertia. Both acquisitions and orders return to their original equilibrium values after their disequilibrium adjustment. As acquisition lag changes are almost transparent to acquisitions, they hardly affect its amplification ratio (lower left of Fig. 11). Contrary to the almost constant amplification ratio of acquisitions, however, the orders' amplification ratio increases as the acquisition lag gets longer. The implication is that the longer acquisition lag is in Cyprus' hotel value chain, the higher the required Supply Chain throughput is, and the more Cyprus' hotel suppliers feel customer demand amplification like the sting of a bullwhip.

Figure 12 shows how bed acquisitions and orders respond to changes in the average bed life (lower right of Fig. 12). The longer the average bed life is, the lower these rates are. Alternatively, the more frequently Cyprus' hotels renew their BC, the higher the required SC capacity is. However, the acquisitions' and orders' amplification ratios show a concave-up curvilinear pattern (lower left of Fig. 12). The acquisitions' amplification ratio reaches a relative minimum at t = 240 months (20 years), and the orders' amplification ratio reaches a relative minimum at t = 180 months (15 years). Beyond these points, however, the longer Cyprus' hotels take to renew Bed Capacity, the faster the orders' amplification ratio rises; much faster than the acquisitions' amplification ratio does. One implication is that, the further upstream Cyprus' hotel suppliers are, the more they feel tourism demand amplification, like the sting of a bullwhip. That is, the longer Cyprus' hotels take to renew their beds, the more protuberant the shock they inflict upon Cyprus' economy when they do renew.
Figure 13 shows how Cyprus' hotel value chain responds to changes in bed capacity adjustment time (lower right of Fig 13). Both rates' adjustment to their new equilibrium decreases as bed capacity adjustment time gets longer, and so does the orders' amplification ratio (lower left of Fig. 13).

The acquisitions' amplification ratio, however, slightly rises as bed capacity adjustment time gets longer. Alternatively put, as bed capacity adjustment time gets shorter, it generates a higher amplification ratio in Cyprus' hotel supplier orders. When bed capacity adjustment time is cut down to one year (12 months), Supply Chain orders rise almost instantly. One immediate implication is that bed capacity adjustment time, an internal VCM policy lever, can aggressively amplify an increase in desired bed capacity as a single order rate overshoot. The more aggressively Cyprus' hotels respond to changes in tourist arrivals, the more protuberant the shocks they inflict upon Cyprus' economy. Figure 14 shows how Cyprus' hotel value-chain responds to changes in its supply-chain adjustment time (scat: lower right of Fig. 14). Both the acquisitions' and orders' amplification ratio stays relatively constant (lower left of Fig. 14). One immediate implication is that scat, another VCM internal policy lever, cannot as readily amplify increases in desired bed capacity as overshoots in orders. Clearly, Cyprus' hotel suppliers are not responsible for shocks in Cyprus' economy; at least as far as its hotel value-chain is concerned.
5.3 Cyprus' tourism growth scenarios
Four arbitrary scenarios of Cyprus' annual tourism growth (Fig. 15) assess its potential effects on the island's monthly tourism, hotel value chain, environment and hotel profitability. Instead of

trying to predict what will happen to Cyprus' tourism over the next 40 years, these four scenarios ask what might happen.
Namely, the top panel of Fig. 15 shows what might happen to Cyprus' Annual Tourism if the island's foreign visitors continue to come as they have been for the past 40 years, with an annual average growth fraction of 14.25 percent (Run #2), decreased by 25 percent (Run #1), or increased by 25 percent (Run #3) or 50 percent (Run #4), as a result of Cyprus' year 2010 official strategy intervention. The lower-left panel of Fig. 15 shows how Cyprus' monthly Tourism might evolve through time if the above scenarios played, despite Bates UK trying to alleviate tourism seasonality via precise target marketing. Zooming in, the lower-right panel of Fig. 15 shows how Cyprus' foreign and domestic visitors might continue to arrive to and depart from the island's hotels if Cyprus' tourism seasonality pattern (Fig. 4) persisted through year 2040 and these arbitrary annual tourism growth scenarios played.
If Bates UK fails to alleviate Cyprus' high tourism seasonality via precise target marketing, not much will change during the winter. During the peak-season months, however, the difference between the decline (Run #1) and relative high-growth (Run #4) scenarios might be about

250,000 extra tourists that Cyprus' hotels must make ready to accommodate. This monthly Tourism difference roughly translates into a need for about 155,000 beds (Fig. 16). Are Cyprus' hotels and their suppliers ready to deal with such a discrepancy? In contrast to the previous section's parameter-driven hotel value-chain scenarios, the scenarios of Fig. 15 & 16 correspond to arbitrary but plausible growth rates in Cyprus' Annual Tourism. If the high-growth (Run #4: +50%) scenario plays, i.e. mass tourism continues, hotel bed acquisitions and orders (lower panel of Fig. 16) might temporarily overshoot their pending equilibria, an inevitable consequence of the stock and flow structure of Cyprus' hotel value chain. The only way the hotel Supply Chain can increase is for its orders inflow to exceed its acquisitions outflow. Within Cyprus' hotel value chain, its Supply Chain faces relatively larger changes in demand than its hotel Bed Capacity does and the surge in demand is temporary. CTO's (2000) data show 2211 registered orders for new beds in January 2000, implying that Cyprus' hotels seem ready to face the high-growth scenario of Fig. 15 & 16. Hence, the high-growth scenario (Run #4) might be already playing, creating a significant bullwhip effect, i.e. amplification and instability, in Cyprus' hotel value-chain acquisitions and orders. Although the amplification is temporary (lower panel of Fig. 16), during its disequilibrium adjustment Cyprus' hotel suppliers might face much larger changes in demand than hotels do before bed acquisitions and orders return to their respective equilibria. And, the higher the tourism growth is, the more protuberant the shock inflicted upon Cyprus' economy. If, however, the Run #1: -25 percent scenario of Fig. 15 plays, while Cyprus already is building hotel Bed Capacity in anticipation of the Run #4 high-growth scenario, then disaster might be in the making. The result could be a huge bed over-capacity, with run down, unused, bankrupt hotels and resorts.
In addition to their profound consequences for its hotel value-chain participants, Cyprus' tourism growth might also determine the fate of the island's environment (Fig. 17). Namely, high tourism growth implies more anthropogenic emissions feeding Cyprus' CO2 Pollution (top left panel of Fig. 17), depending on the island's population and tourism as well as on emissions per person. Qualitatively, Cyprus' CO2 Pollution scenarios look exactly like the A2 scenario family of harmonized anthropogenic CO2 emissions created by the Intergovernmental Panel on Climate Change (IPCC) to understand the risk of human-induced climate change (Nakicenovic,

Davidson, Davis et al. 2000, Fig. 3b, p. 8). Like in the rest of the world, unless a drastic change in technology alters the emissions per person ratio in the next 40 years, CO2 Pollution is expected to grow proportionally with Cyprus' tourism, degrading the island's climate and environment.
High tourism growth also lowers Cyprus' environmental footprint. Naturally, the summer 1974 Turkish invasion has had a drastic negative effect on Cyprus' relative attractiveness because it reduced the island's free land area by 41 percent. Although qualitatively similar to the world's average environmental footprint after the invasion, Cyprus' environmental footprint is lower than the world's average environmental footprint (lower left panel of Fig. 17), rendering the island's free area relatively less attractive as more foreign tourists visit Cyprus. Manifested in the environmental footprint effect (top right panel of Fig. 17), Cyprus becomes relatively less attractive than the rest of the world as more visitors choose to vacation on the island's free area. And what can Cyprus' hoteliers expect to see in terms of bottom-line dynamics? According to the simulation results of Fig. 18, seasonal variations notwithstanding, the higher Cyprus' tourism growth is, the lower hotel profit (hp) is, in the short term. In the long term, however, higher tourism growth yields higher smooth hp, in constant year 2000 prices. High tourism growth implies accommodating overbooked tourists with hotel reservations that actually show up. Although free cruises erode Cyprus' hotel profit, the alternative is angry tourists that kind of go off in hotel lobbies. Drucker & Higgins (2001) show that while tourists have gotten angry at hotels before, hotels have made the problem worse in recent years worldwide. They have tightened check-in rules, doubled their renovations and increased the rate of overbooking by about 30 percent. The results can be explosive if one adds the record flight delays that travelers endure worldwide. Anyhow, free cruises to nearby Egypt and Israel sound much better than simply training employees on handling unhappy guests that scream in lobbies. Eventually, as Cyprus' Bed Capacity increases and thereby catches up with tourism demand, there will be less overbooking and a few free cruises to erode Cyprus' hotel profit. Given enough time for an initial BC disequilibrium adjustment (Fig. 16), in the long term, higher tourism growth yields both higher hotel profit and higher cumulative Cash (left panel of Fig. 18).

5.4 Cyprus' tourism and hotel price seasonality scenarios
What if Bates UK managed to alleviate Cyprus' high tourism seasonality? Optimistically perhaps, Cyprus' year 2010 official strategy implementation might achieve the seasonality pattern of its Mediterranean island competitor, Malta, or even that of a more developed nation, such as USA (top panel of Fig. 19). And what if Cyprus' hotels coaligned their future price schedules with the island's current tourism seasonality (left panel of Fig. 19)? These are the questions the seasonality scenario matrix of Fig. 19 asks. Its six matrix cells address Cyprus Hotel Association's seasonality concern directly, along with the associated implications for Cyprus' tourism, environmental pollution and hotel profit. Figure 20 shows the simulation results corresponding to the six strategic scenarios of Fig. 19. Overall, Fig. 20 shows that the more successful Bates UK is at decreasing Cyprus' high tourism seasonality, the more consistent Cyprus' monthly Tourism arrivals will be, the less CO2 Pollution the island will accumulate, the more attractive it will be in terms of its environmental footprint, and the higher its hotel profit and Cash will be. Similarly, the more closely Cyprus' hotels align their price schedules with their island's current seasonality, the higher their profit and accumulated Cash will be.
Specifically, as the Bates UK marketing campaign brings Cyprus' tourism seasonality closer to that of Malta and USA, the less prominent the monthly Tourism upward and downward movements throughout each year that tie to recurring tourist arrivals (top left panel of Fig. 20). Immediate socioeconomic consequences of such an achievement might include a more consistently high utilization of Cyprus' hotel Bed Capacity as well as more consistent employment for Cyprus' labor force. The more Bates UK succeeds at lowering Cyprus' tourism seasonality, the less the off-season bed capacity underutilization problem Cyprus' hotels will have. Cyprus' villages dedicated primarily to tourism, such as Ayia Napa and Protaras (Fig. 1) might no longer become ghost towns in the winter. Cyprus' reduced tourism seasonality might turn the island's tourism workers into consistently employed hospitality professionals who need not return to their hometowns and 'regular' jobs during the winter.

Regarding Cyprus' environment, it seems that anthropogenic CO2 emissions attributed to upward and downward movements throughout each year that tie to recurring tourist arrivals create much more stress and strain for the island's natural environment than a consistent stream of tourism with lower seasonality would (middle left of Fig. 20). Zooming in on Cyprus' relative attractiveness in terms of its environmental footprint effect (middle right of Fig. 20), the lower its tourism seasonality becomes, the more relatively attractive the island's free area is compared to the rest of the world. Even if Bates UK fails to alleviate Cyprus' high tourism seasonality with its precise-target marketing campaign, Cyprus' hotels might still see more profit if they align their price schedules with their island's current seasonality pattern. It is worth noting the difference between Run #1 and Run #4 on the lower left panel of Fig. 20. Tourism seasonality remains high under both these scenarios. However, Cyprus' hotel profit more than doubles when hotels coalign their price schedule with tourism seasonality. Even if Bates UK succeeds, Cyprus' hotels might have much to gain from coaligning their price schedules with tourism seasonality (Run #5 & Run #6); particularly at a time when most of them consider going public (xak.com 2001).
5.5 Service quality scenarios
Talking of going public, improving their profit margin (top right panel of Fig. 18) is another way for Cyprus' hotels to improve their financial performance and, thereby, publicly traded stock price. And what better way to improve efficiency than through higher service quality? Adapted from Georgantzas (1993), the causal loop diagram of Fig. 21 shows how hotel Service Quality depends on resources as well as on the quality gap between customers' expected and perceived service quality.

Perceived quality depends on actual Service Quality and on Employee Morale, a stock driven by actual Service Quality. The service quality gap drives Management Commitment, which together with the value-added coefficient (vac) determine a hotel's resource allocation to Service Quality. The lower panel of Fig. 21 shows that a hotel's transition to higher Service Quality might be bumpy. Much like Cyprus' hotel value chain is prone to instability and oscillation attributed to its internal stock and flow structure, Service Quality might also show bullwhip effects as the vac internal lever allocates more resources to Service Quality. Consider, for example, furious guests fuming about "all that drilling noise in the hallway" as hotels renovate (Drucker & Higgins 2001). Cyprus' hoteliers and hotel managers must remember this.
6 Discussion and Conclusion Although the simulation results show how Cyprus' hotel value-chain instability is an inevitable consequence of its stock and flow structure, most academics and practitioners persistently see demand forecast inaccuracy as the most prominent cause of the bullwhip effect in customer-supplier value chains. Indeed, forecasting has become quite sophisticated in carrying out extrapolations of past trends. Graphically extrapolating a curve, however, does not render the future more predictable in business or other economico-socio-political environments. In their comprehensive treatment of Delphi, for example, Linstone & Turoff (1975) find most forecasting techniques unsatisfactory both in substance and method. Ackoff (1981) concurs and describes three conditions under which
perfectly accurate forecasts could be obtained. First, if a system and its environment did not and could not change, and we knew its state at any one moment of time, then, of course, we would know its state at any other moment of time, including the future. Clearly, these conditions do not exist, but even if

they did, preparation would not be possible because it requires change. Second, perfectly accurate forecasts would be possible if a system and its environment were, or were part of, a deterministic system. If the future of a system that could be so predicted were determined, it would not be subject to change. Preparation presupposes choice but determinism presupposes a lack of it. Third, we would be able to predict the future perfectly if we were omnipotent (Ackoff 1981: 59-60).
Even the popular Delphi, which entails revising prior probabilities about the future as tangible evidence of changes in business becomes available, is more of a consensus-building rather than a forecasting technique. And Hax & Majluf (1984) warn managers against bounding strategic situations by making a pseudoscience out of the art of consensus building. Similarly, Farmer (1973) emphasizes the shortcomings of forecasting changes in the business environment. After examining forecasts published in Fortune from 1933 to 1950, Farmer concludes that even the most radical forecasts were too conservative when compared with actual business trends. Such flaws have prodded major firms to dissolve archetypal economic and econometric forecasting departments, Citibank, Compaq, Dell, GE, even IBM, included. While the cost of forecasting skyrocketed, its precision and reliability either stagnated or declined. The ever-decreasing sample size of the corporate market is amply responsible. It is easy to predict the behavior of statistically large mass markets through time, but with rapidly narrowing market niches, small groups and individual customers, prediction becomes hard. Forecasters can predict what ten thousand people will do, but not what one person might do (Zeleny 1997). "Markets do not buy anything, individuals do" warns Tom Peters. What matters most is what individual tourists do, not what they say they will or would do on assorted polls or consumer market surveys. Cyprus' visitors have complete freedom to do as they please and to say as they please. They do not have to do what they say or say what they do. They can change their minds, preferences and reasoning as many times as they want and do not have to explain it. They do not have to be transitive or consistent in their preferences. Cyprus' hoteliers and hotel managers that rely on forecasting face a nasty dilemma. In the short run, they can forecast but cannot act. In the long run, they can act but cannot forecast. Bound by their hotel value-chain processes, resources and core competencies, in the short term, hotel managers might feel as if they are sitting on their hands. They cannot act. The long term unties their hands. Now they can act. They have the time they need to change their hotels' processes, resources and core competencies... but in what direction? Long-term forecasts are always wrong! Clearly, the need for forecasting is a function of the time difference between change and a hotels ability to act on it; between the time a need arises and the time it can be satisfied. As shrinking corporate markets compress lead-time to satisfaction to a blur, firms reliance on forecasting grows weak. Competing for the compression of lead-time to satisfaction intensifies as its limits begin to border the instantaneous or zero time. Experts educated guesses, no matter how sophisticated or wild, no longer define business planning. Instead of forecasting, hotels must opt for flexibility and responsiveness to cover all possible future states, regardless of probabilities. Building an ever-widening portfolio of response capabilities, one with the foresight to cover both the best-case and the worst-case scenarios, is crucial for corporate planning and strategic management in the hospitality industry. Computed strategic scenarios help hotels rediscover the original entrepreneurial power of creative foresight in contexts of accelerated change, greater complexity and genuine uncertainty. Contrary to what business journalists write about them, scenarios are powerful planning tools precisely because the future is unpredictable. Their purpose is not prediction because scenarios

are not forecasts but mirrors that help hotel managers face their own logic and assumptions about the future (Georgantzas & Acar 1995). Instead of trying to predict what will happen in the future, scenarios ask what might happen. Managers and firms seeking foresight use scenarios to prepare for whatever the future brings. Unlike forecasting or market research, scenarios present alternative images about the future. The foresight scenario planning group (FSPG), for example, part of UKs Foresight Programme (http://www.foresight.gov.uk/), builds macroenvironmental scenarios aimed at creating a culture change in the way the UK approaches the future. Within the strategic management process, scenarios provide a common vocabulary and an effective basis for communicating complex and, sometimes, paradoxical conditions and strategy options. Good scenarios are plausible and surprising, they have the power to break old stereotypes and their creators assume ownership before they put them to work. Using scenarios is rehearsing the future, while enabling multi-loop institutional learning in strategy design and implementation (Georgantzas & Acar 1995, Sterman 2000). The most serious flaw of straight forecasts is their inconsistency and inability to fathom the impact of several changes taken together. Many forecasting techniques oversimplify significant interactions among important variables. Conversely, computed from custom-built simulation models (Fig. 7 & 8), strategic scenarios help hotels recognize warning signs. And the drama unfolding within each scenario helps hotels avoid surprises, adapt to change and act effectively. Within Cyprus' hotel value-chain management (VCM) structure: 1. Hotel suppliers face larger changes in demand than hotels do. And the further upstream hotel suppliers are,
the more amplified their demand surges are. 2. These demand surges are temporary.
a. If Cyprus sustains the slack capacity necessary to absorb the demand surges in its hotel value chain, then the multiplier effect will help Cyprus' economy benefit from tourism, thereby increasing its current multiplier effect of 1.14 (Witt & Moutinho 1989, p. 531).
b. If, however, hotels and their suppliers resort to imports and foreign labor, then Cyprus economy will not gain as much.
3. No matter how drastically tourists, tour operators and travel agencies downstream in Cyprus' hotel value chain change their orders' magnitude, they cannot cause hotel supplier demand amplification. Cyprus' hotel suppliers must blame neither customers nor downstream firms and their forecasts for the bullwhip-like demand amplification effects in Cyprus' hotel value chain and economy. Instead of blaming their customers, Cyprus' hotel value-chain participants must seek to unearth and understand the dynamic implications of the stock and flow structure of the hotel value chain.
4. The hotel suppliers orders' amplification ratio is almost quadruple the acquisitions', suggesting that Cyprus' hotel suppliers face much larger changes in demand than hotels do. Although temporary, during its disequilibrium adjustment, orders consistently overshoot their new equilibrium points (middle right of Fig. 10), an inevitable consequence of the customer-supplier value chain stock and flow structure.
5. The longer the acquisition lag is in Cyprus' hotel value chain, the higher the required Supply Chain throughput is, and the more the hotel Supply Chain feels customer demand amplification (Fig. 11).
6. The longer the average bed life is, the higher the required Supply Chain throughput is. Alternatively put, the longer Cyprus' hotels take to renew their Bed Capacity, the more protuberant the shock they inflict upon the local economy when they do renew. Moreover, the further upstream Cyprus' hotel value chain firms are, the more they feel tourism demand amplification, like the sting of a bullwhip (Fig. 12).
7. Bed capacity adjustment time, an internal policy lever, can aggressively amplify an increase in desired bed capacity as a single order rate overshoot. The more aggressively Cyprus' hotels respond to changes in Annual Tourism, the more protuberant the shocks they inflict upon Cyprus' economy (Fig 13).
8. Supply-chain adjustment time, another Cyprus' hotel value chain internal policy lever, cannot as readily amplify increases in desired bed capacity as overshoots in orders. Clearly, Cyprus' hotel Supply Chain is not responsible for shocks in Cyprus' economy (Fig. 14).
9. Uncertainty about the Bates UK intervention effects on Cyprus' tourism necessitates computing a wide-angle spread of strategic scenarios, i.e. ranging from a negative 25 percent tourism decline to a positive 50 percent

tourism growth (Fig. 15). CTO data show that Cyprus already might be building hotel bed capacity in anticipation of high tourism growth (Fig. 16). If, however, the 25 percent decline scenario plays, then the result could be a huge bed over-capacity, with run down, unused, bankrupt hotels and resorts.
10. Sudden, high tourism growth might degrade Cyprus environment even further, making Cyprus a less desirable place for tourism (Fig. 17).
11. High tourism growth can also depress Cyprus hotel profitability in the short term, i.e. during the hotel value-chain adjustment period (Fig. 18).
12. Alleviating high tourism seasonality might help Cyprus' environmental sustainability as well as its hotel profitability (Fig. 20).
13. The strategic coalignment of Cyprus' hotel price schedules with its tourism seasonality might help hotel profitability, even if the high tourism seasonality persists (Fig. 20).
14. The sure way to improve efficiency (i.e. profit margin) is through higher quality, but Cyprus' hotels beware: the road to higher service quality might be bumpy (Fig. 21).
With respect to insight #7 above, Web-enabled digital commerce is an instance of a much broader VCM initiative to improve intra-firm communication, responsiveness and accountability through supplier integration, a source of competitive advantage. Partnerships with suppliers can help Cyprus' hotels focus resources on their core service. As they strive to improve their supplier links, the cost of supporting multiple suppliers escalates. Consequently, Cyprus' hotels might try to reduce the number of their suppliers and stay with the ones who are the easiest to work with. VCM improvements occur primarily through the development of existing supplier capabilities rather than large-scale supplier switching. This essay's computed scenarios show that the sustainability of Cyprus' tourism might well depend on the ability of its hotel value-chain participants to coalign the processes and practices of partner enterpriseseach of them run as an autopoietic (i.e. self-organizing) network. By definition, self-organization is itself a process of spontaneous system change, a constant evolution controlled not by the environment or an encompassing external system, but normally triggered internally. Consequently, for Cyprus' hotel value-creation process network to survive, it must integrate its suppliers and customers, its whole business and natural environment. The logistic or Verhulst model explains and predicts Cyprus' tourism and bed capacity growth well (Fig. 9) because it includes two feedback processes fundamental to every growth process: a positive loop (+) that generates an initial period of accelerating growth and a negative feedback (-) that causes growth to slow as the island's Carrying Capacity is approached. Any system growing by positive feedback must include these two loops, coupled nonlinearly. Any growth model must be characterized by a fractional growth rate that ultimately declines to zero as Cyprus tourism approaches its carrying capacity (Sterman 2000, Ch. 9). Alternative growth models, such as the Bass diffusion model (Bass 1969), Gompertz, Richards or Weibull might produce wildly different predictions while fitting Cyprus' tourism data equally well. Yet, the logistic growth model not only conforms to the requirements for S-shaped growth but also includes the ecological concept of carrying capacity, relevant to Cyprus Hotel Association's concern about the island's environmental sustainability. Nonetheless, the ability to fit Cyprus' actual tourism data does not provide a strong basis for selecting among alternative hypotheses about the nature or strength of different feedback loop structures that might be responsible for Cyprus' tourism dynamics. The present study is a preliminary assessment of Cyprus' tourism. Examining historical fit must be a part of a larger process designed to stimulate learning and model improvement suitable for policy design and decision making. Future research must focus on unearthing the rich feedback-loop structure that might be needed to generate more complex and realistic patterns than this project did. Both complexity and realism might be necessary in order to continue testing and refining Cyprus' official year 2010 strategy design and implementation.

7 References Ackoff, R.L. (1981) Creating the Corporate Future, New York, NY: Wiley. Akis, S., N. Peristianis & J. Wagner (1996) 'Residents' attitudes to tourism development: The case of Cyprus',
Tourism Management 17 (7): 481-494. Anonymous (1997) Tourism market assessment, STAT-USA on the Internet, US Department of Commerce. Anonymous (1998) Core Document: Cyprus, High Commissioner for Human Rights, United Nations. Anonymous (2000a) 'Did you know?', Cyprus Embassy Newsletter (Dec.): 3. Anonymous (2000b) 'EU sets Cyprus vote at four, backs UN talks', Cyprus Embassy Newsletter (Dec.): 1-2. Bass, F. (1969) 'A new product growth model for consumer durables', Management Science 15 (215-227). Brenkert, A.L. (1998) Carbon Dioxide Emission Estimates from Fossil-Fuel Burning, Hydraulic Cement Production,
and Gas Flaring for 1995 on a One Degree Grid Cell Basis, Oak Ridge, Tennessee: Oak Ridge National Laboratory, Carbon Dioxide Information Analysis Center (Database: NDP-058A 2-1998).
Campbell, L. (1999) 'Bates UK lands global £13m Cyprus account', Campaign (15 Oct.): 5. CTO (2000) Annual Report & Tourism Statistics, Nicosia, Cyprus: Cyprus Tourism Organisation (CTO). Cyert, R.M. & J.G. March (1963) A Behavioral Theory of the Firm, Englewood Cliffs, NJ: Prentice Hall. CYSTAT (2000) Cyprus Key Figures: Tourism, Nicosia, CYPRUS: The Statistical Service of Cyprus (CYSTAT)
http://www.pio.gov.cy/dsr/key_figures/tourism/index.htm. Drucker, J. & M. Higgins (2001) 'Hotel rage: Losing it in the lobby', The Wall Street Journal (Friday 16 February):
W1, W7. Elliot, S. (1999) 'The Media Business: AdvertisingAddenda: Accounts', New York Times (29 Oct.): 7. Ellis, B. (1998) Water in Cyprus, Romanel-sur-Lausanne, Switzerland: Protonique S.A. (under a mandate from
EnviroTech Limited, Larnaka, Cyprus) http://www.protonique.com/cyprus_water. Eurostat (2001) Eurostat Yearbook 2000: European Commission Key Indicators, Brussels, Belgium: Statistical
Office of the European Communities. Farmer, R.N. (1973) 'Looking backward at looking forward', Business Horizons (Feb): 21-36. Forrester, J.W. (1958) 'Industrial dynamics: A major breakthrough for decision makers', Harvard Business Review
36 (4): 37-66. Georgantzas, N.C. (1990) 'Cognitive biases, modeling and performance: An experimental analysis', Proceedings of
the 6th International System Dynamics Society Conference, Jul. 9-14, Boston, MA: 410-424. Georgantzas, N.C. (1993) 'Service designs for quality: Modeling resource allocation', The 36th ORSA/TIMS Joint
National Meeting, Oct. 31-Nov. 3, Phoenix, AZ: 3. Georgantzas, N.C. (2000) 'Value Chain Dynamics in Virtual Enterprise Networks', Proceedings of The Regional
Enterprise Networks First International Conference, Prague, Czech Republic, November 22-23 Georgantzas, N.C. (2001a) 'Simulation modeling', in M. Warner & J. Kotter, Eds. International Encyclopedia of
Business and Management, London, UK: Thomson Learning. Georgantzas, N.C. (2001b) 'Virtual Enterprise Networks: The Fifth Element of Corporate Governance', Human
Systems Management (forthcoming). Georgantzas, N.C. & W. Acar (1995) Scenario-Driven Planning: Learning to Manage Strategic Uncertainty,
Westport, CT: Greenwood. Hammer, M. (2000) 'Out of the box: The rise of the virtual enterprise', Information Week Online (20 Mar.):
http://www.informationweek.com/778/78uwmh.htm. Handfield, R.B. & E.L. Nichols, Jr. (1999) Introduction to supply chain management, Upper Saddle River, NJ:
Prentice Hall. (Deals with the integration of information and material flows across multiple firms that form the supply chain.).
Hau, L.L., V. Padmanabhan & S. Whang (1997) 'The bullwhip effect in supply chains', Sloan Management Review (Spring): 93-102.
Hax, A.C. & N.S. Majluf (1984) Strategic management: An integrative perspective, Englewood Cliffs, NJ: Prentice-Hall.
Istvan, R.L. (1992) 'A new productivity paradigm for competitive advantage', Strategic Management Journal 13 (7): 525-537.
ITA (2001) Monthly Tourism Statistics, Monthly Arrivals to the United States - Table C, Section 1: Total Arrivals, Washington, DC: International Trade Administration (ITA), US Department of Commerce (http://tinet.ita.doc.gov/research/monthly/arrivals/index.html).
Kammas, M. (1991) 'Tourism development in Cyprus', The Cyprus Review 3 (2): 7-26. Linstone, H.A. & M. Turoff, Eds. (1975) The Delphi method, Reading, MA: Addison-Wesley.

MTA (2000) Malta Tourism Statistics, Valletta, Malta: Malta Tourism Authority (MTA), http://www.maltatourismauthority.com/research/statistics/.
Nakicenovic, N., O. Davidson, G. Davis, et al. (2000) Summary for PolicymakersEmissions Scenarios: A Special Report of Working Group III of the Intergovernmental Panel on Climate Change (IPCC), World Meteorological Organization (WMO) & United Nations Environment Programme (UNEP).
Peppard, J. (1999) 'Benchmarking, process re-engineering and strategy: some focusing frameworks', Human Systems Management 18 (3, 4, Special Issue: Distributed Enterprise, Intelligent Automation and Industrial Benchmarking Putting ICT into Practice): 297-313.
Porter, M.E. (1985) Competitive Advantage: Creating and Sustaining Superior Performance, New York, NY: Free Press.
Richardson, G. (1991) Feedback Thought in Social Science and Systems Theory, Philadelphia, PA: University of Pennsylvania Press.
Richmond, B. & e. al. (2000) iThink Analyst 6: The power to understand!, Hanover, NH: High Performance Systems, Inc.
Simon, H.A. (1982) Models of Bounded Rationality A 2-volume, Cambridge, MA: MIT Press. Sterman, J.D. (2000) Business dynamics: Systems thinking and modeling for a complex world, Boston, MA: Irwin
McGraw-Hill. Theil, H. (1966) Applied Economic Forecasting, New York, NY: Elsevier Science (North Holland). Toufexis-Panayiotou, M. (1989) 'Travel and tourism in Cyprus: A study of the travel decision process', The Cyprus
Review 1 (1): 111-134. Turner, F. (1997) 'Foreword: Chaos and social science', in R.A. Eve, S. Horsfall & M.E. Lee, Eds. Chaos,
complexity and sociology, Thousand Oaks, CA: Sage, pp. xi-xxvii. US Census Bureau (2000) International Data Base Data Access: Display Mode, Washington, DC: United States
Department of Commerce, http://www.census.gov/ipc/www/idbprint.html. Window on Cyprus Team (2001) Cyprus Hotels, Larnaca, Cyprus: Armata Productions (http://www.cyprus-
hotels.com/cyprus_hotels.htm). Witt, S.F. & L. Moutinho (1989) Tourism Marketing and Management Handbook, Upper Saddle River, NJ:
Prentice-Hall International. WTO (2001) Yearbook of Tourism Statistics, Madrid, Spain: World Tourism Organization (WTO) Publications,
http://www.world-tourism.org/omt/esta/statserv.htm. xak.com (2001) Scrutinizer Reports, Francoudi & Stephanou Financial Services, Ltd. Zeleny, M. (1997) 'The Decline of Forecasting?', Human Systems Management 16 (1): 153-155. Zeleny, M. (1999) 'Industrial districts of Italy: Local-network economies in a global-market web', Human Systems
Management 18 (2: Special Issue on Industrial Districts of Italy): 66-68.