cytostruct: augmenting the network visualization of ... · structure resource cytostruct:...
TRANSCRIPT
Resource
CyToStruct: Augmenting t
he Network Visualizationof Cytoscape with the Power of Molecular ViewersGraphical Abstract
Highlights
d CyToStruct integrates the network visualization of Cytoscape
with molecular viewers
d Demos connecting Cytoscape with PyMOL, UCSF Chimera,
VMD, and Jmol are provided
d CyToStruct allows easy sharing of detailed structural data
among scholars
d Visualization of macromolecular complexes: http://
trachel-srv.cs.haifa.ac.il/rachel/ppi/
Nepomnyachiy et al., 2015, Structure 23, 941–948May 5, 2015 ª2015 Elsevier Ltd All rights reservedhttp://dx.doi.org/10.1016/j.str.2015.02.013
Authors
Sergey Nepomnyachiy, Nir Ben-Tal,
Rachel Kolodny
[email protected] (R.K.),[email protected] (N.B.-T.)
In Brief
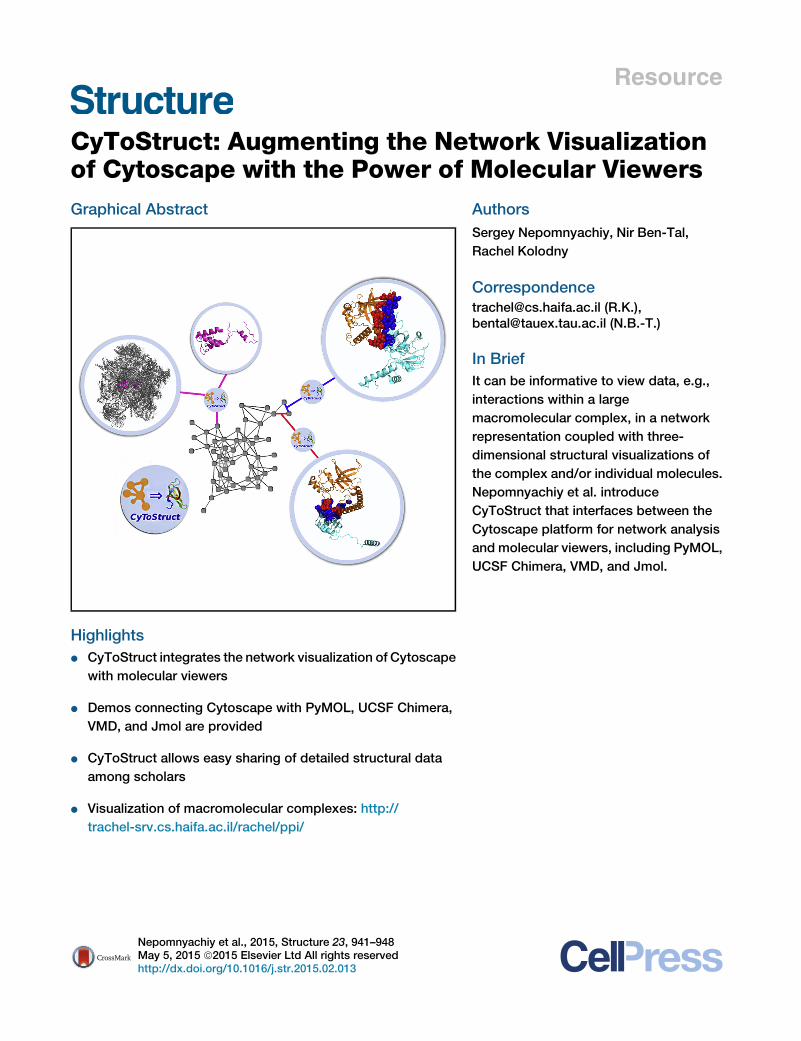
It can be informative to view data, e.g.,
interactions within a large
macromolecular complex, in a network
representation coupled with three-
dimensional structural visualizations of
the complex and/or individual molecules.
Nepomnyachiy et al. introduce
CyToStruct that interfaces between the
Cytoscape platform for network analysis
and molecular viewers, including PyMOL,
UCSF Chimera, VMD, and Jmol.
Structure
Resource
CyToStruct: Augmenting the Network Visualizationof Cytoscape with the Power of Molecular ViewersSergey Nepomnyachiy,1 Nir Ben-Tal,2,* and Rachel Kolodny3,*1Department of Computer Science & Engineering, Polytechnic Institute of NYU, Brooklyn, NY 11201, USA2Department of Biochemistry and Molecular Biochemistry, George S. Wise Faculty of Life Sciences, Tel Aviv University, Ramat Aviv 69978,
Israel3Department of Computer Science, University of Haifa, Mount Carmel 31905, Israel
*Correspondence: [email protected] (R.K.), [email protected] (N.B.-T.)
http://dx.doi.org/10.1016/j.str.2015.02.013
SUMMARY
It can be informative to viewbiological data, e.g., pro-tein-protein interactions within a large complex, in anetwork representation coupled with three-dimen-sional structural visualizations of individual molecu-lar entities. CyToStruct, introduced here, provides atransparent interface between the Cytoscape plat-form for network analysis and molecular viewers,including PyMOL, UCSF Chimera, VMD, and Jmol.CyToStruct launches and passes scripts tomolecularviewers from thenetwork’s edgesandnodes.Wepro-vide demonstrations to analyze interactions amongsubunits in large protein/RNA/DNA complexes, andsimilarities among proteins. CyToStruct enriches thenetwork tools ofCytoscapeby adding a layer of struc-tural analysis, offering all capabilities implemented inmolecular viewers. CyToStruct is available at https://bitbucket.org/sergeyn/cytostruct/wiki/Home and inthe Cytoscape App Store. Given the coordinatesof a molecular complex, our web server (http://trachel-srv.cs.haifa.ac.il/rachel/ppi/) automaticallygenerates all files needed to visualize the complexas a Cytoscape network with CyToStruct bridging toPyMOL, UCSF Chimera, VMD, and Jmol.
INTRODUCTION
Network representations of molecular systems, coupled with
protein structural information, can yield insights into many inter-
esting questions in molecular biology (Ben-Tal and Kolodny,
2014; Greene, 2012). Network representations are frequently
used, for example, in the study of protein-protein interactions.
In these networks, nodes represent proteins and edges repre-
sent interactions between the proteins. Structural data on
proteins and their interactions, e.g., within a molecular com-
plex, can provide useful insights that complement the network
perspective (Petrey and Honig, 2014; Russell and Aloy, 2008;
Stein et al., 2011): For example, structural information can help
reveal the effects of clinical mutations on the interaction between
a specific pair of proteins, and the network can then be exploited
to identify cellular processes that might be affected by these
Structure 23
mutations. Similarly it is also insightful to visualize relationships
among drug-like compounds using network and structural repre-
sentations (e.g., Keiser et al., 2007; Xiong et al., 2008). Such in-
sights could ultimately be leveraged to suggest small therapeutic
molecules to manipulate these cellular processes by altering the
interactions between specific protein pairs.
More broadly, networks provide a very general framework for
studying objects, represented by nodes, and the relationships
among them, represented by the edges that connect nodes. In
the context of molecular biology, nodes can represent structural
entities, such as metabolites, nucleic acid chains, protein chains
or complexes, domains, motifs, secondary structure elements,
and even residues or atoms. The set of nodes can be large,
collectively representing a metabolome (Chang et al., 2013;
Zhang et al., 2009), a proteome (Singh et al., 2008), the set of
all known proteins (Dokholyan et al., 2002; Nepomnyachiy
et al., 2014), or drugs (Keiser et al., 2007). Alternatively, the
network can include proteins of a specific complex (Aloy et al.,
2004). At an even finer resolution, the nodes can represent
residues within a single protein (e.g., Amitai et al., 2004). The
edges can represent different types of relationships, including:
biochemical reactions (Jeong et al., 2000), a likely common
evolutionary origin (Nepomnyachiy et al., 2014), geometric simi-
larity (Dokholyan et al., 2002), interaction between proteins (Aloy
and Russell, 2006), co-occurrence (Bornberg-Bauer et al., 2005),
or a shared interface (Aloy et al., 2004). These are merely exam-
ples demonstrating the wide appeal and potential of using net-
works in molecular biology research.
Visualization offers straightforward means of studying net-
works and the relationships within them. There are two types
of information that a scholar of a molecular biological system
may wish to visualize: the overall network and the individual
molecular entities represented by the edges and nodes of the
network. Cytoscape is a powerful and user-friendly software
tool for visualizing networks (Saito et al., 2012). In Cytoscape,
the user specifies the list of nodes and their connecting edges,
and can also specify parameters that are associated with the no-
des and edges. Cytoscape visualizes the information as a two-
dimensional figure of the network, and the visual properties of
the nodes/edges can be customized according to their parame-
ters. To visualize molecular structures, the scholar can select
from many available molecular viewers (for a review of these,
see O’Donoghue et al., 2010). Molecular viewers are sophisti-
cated software tools that not only highlight particular aspects
of one or many molecules/proteins but can also analyze the
, 941–948, May 5, 2015 ª2015 Elsevier Ltd All rights reserved 941
structures themselves (e.g., they implement algorithms for com-
paring two structures by calculating the optimal rotation and
translation for superimposition). Scholars can customize molec-
ular viewers in either of the following two ways: (1) using the
graphical user interface (GUI) and a series of mouse clicks, or
(2) using a command line interface and a series of commands
in the appropriate syntax; a set of such commands is termed a
script. The GUI is easier for novice users and convenient for
small-scale applications, whereas large-scale operations require
the use of scripts.
Several tools offer integrations of the network and molecular
views. StructureViz (Morris et al., 2007) is a Cytoscape app
that links Cytoscape to UCSF Chimera (Pettersen et al., 2004).
Others analyze molecular structures as a network, in which the
residues/atoms are the nodes, and the analysis is geared to
better understand the structure itself. These include RINalyzer
(Doncheva et al., 2011), a Cytoscape plugin that converts a
molecule into a network and visualizes it in Cytoscape or xPyder
& PyInteraph, which are PyMOL (Schrodinger, 2010) plugins
(Pasi et al., 2012; Tiberti et al., 2014), and NetworkView (Eargle
and Luthey-Schulten, 2012), which extends VMD (Humphrey
et al., 1996).
Protein scholars have combined the network and molecular
perspectives in various studies (e.g., Alva et al., 2010; Do-
kholyan et al., 2002; Farıas-Rico et al., 2014; Sillitoe et al.,
2015; Skolnick et al., 2009). When studying all of the protein
space we revealed that protein space is non-homogeneous
and includes a continuous region with many similar folds in
addition to discrete regions with isolated folds (Nepomnyachiy
et al., 2014). A combined approach was also used to predict
protein-protein interactions in complexes (e.g., Lasker et al.,
2012, 2010), and to study signal transduction pathways (e.g.,
Aloy and Russell, 2002; Hosur et al., 2012) and interactions
on a genome scale (e.g., Zhang et al., 2012). It was also
used to study specificity-determining (e.g., Chakraborty et al.,
2012) and co-evolving (e.g., de Juan et al., 2013; Marks
et al., 2012) amino acids. Finally, scholars used the aforemen-
tioned existing tools to study specific protein families (e.g., Sef-
fernick et al., 2009; Sukovich et al., 2010) and proteins (e.g.,
Raucci et al., 2014; Singh et al., 2014).
We present here CyToStruct, an open-source Cytoscape 3.0
(Saito et al., 2012) application that seamlessly and automatically
connects the network viewwith potentially anymolecular viewer.
This is implemented by adding commands to a menu linked to
the nodes and edges in the network. The commands run an
external program—typically, a pre-specified molecular viewer,
with a customized script—thus providing a molecular visualiza-
tion of the selected node or edge.
CyToStruct is geared for ‘‘power users’’ of several types.
First and foremost, it is well suited for scholars who want to
use the full range of capabilities of their molecular viewers
and rely on script interfaces to do so. Indeed, the script inter-
faces of molecular viewers are well developed, well docu-
mented, and stable, in that they are not expected to change
when the software is upgraded. CyToStruct also caters to po-
wer users who study datasets that are too large to be pro-
cessed manually with a mouse; these users must process their
data automatically and configure their viewers via scripts. In
particular, when the relationships among the structural entities
942 Structure 23, 941–948, May 5, 2015 ª2015 Elsevier Ltd All rights
composing the network are identified using existing software
tools (e.g., using a structural aligner [Krissinel and Henrick,
2004] or interface analysis tools such as PISA [Krissinel and
Henrick, 2007] or COCOMAPS [Vangone et al., 2011]), the input
to the viewer can be easily generated automatically from the
output of other computer programs. Finally, CyToStruct offers
a way for scholars who have carefully assembled networks
incorporating structural data to easily share their results with
the scientific community. Using CyToStruct, such scholars
can specify the networks and highlight structural data for every
node and edge.
The configuration effort involved in using CyToStruct is mini-
mal. Once CyToStruct is installed, all one needs to do is create
a template in the scripting language of the desired molecular
viewer, and prepare a text file with the table that holds the
node- or edge-specific information for the script. We have
created three demonstrations that highlight the capabilities of
CyToStruct and show how to configure the different files. The
demo scripts we provide can be downloaded and used as a
starting point for configuring CyToStruct for new applications.
To further assist in configuring CyToStruct when studyingmolec-
ular complexes as networks, we have set up a web server (http://
trachel-srv.cs.haifa.ac.il/rachel/ppi/) which, given the atomic co-
ordinates (PDB file) of a complex, generates the Cytoscape file
along with all necessary CyToStruct data files.
RESULTS
Demonstrating CyToStructWe compiled three demos describing, respectively, (1) inter-mo-
lecular interactions within a large protein/RNA complex (protein-
protein interaction network), (2) a network of similarity among
structural domains, and (3) a tutorial with only four nodes.
The demos are available for download from the accompanying
website (https://bitbucket.org/sergeyn/cytostruct/wiki/Demos
%20(case%20studies): each demo includes a sample network
and corresponding structural data. The networks and their prop-
erties (e.g., edge width, or node colors), are described in the Cy-
toscape session files (of type .cys). For each demo, we manually
imported the Cytoscape network from a file with a list of con-
nected nodes (we attach the .sif files). Notice that to customize
the script for the molecular viewers per node and edge, each
node and each edgemust have a unique identifier. The additional
structural data include (1) the CyToStruct data matrix file(s), (2)
the files containing the coordinates of the molecular structures
(of type .pdb), and (3) the CyToStruct YAML configuration file
(http://www.yaml.org/). We provide configuration files with me-
nus that run Jmol (http://www.jmol.org/), PyMOL (Schrodinger,
2010), VMD (Humphrey et al., 1996), and UCSF Chimera (Pet-
tersen et al., 2004). These molecular viewers are freely available
for academic use, and the user should install the desired viewer
on his or her machine before running the demos. Furthermore, in
the (Windows) YAML files, we assume that the commands ‘‘py-
molwin,’’ ‘‘vmd,’’ and ‘‘chimera’’ run the programs (i.e., that the
location of their executables is in the Path environment variable).
In the case of Jmol, we run the ‘‘java’’ commandwith appropriate
flags (e.g., -jar ‘‘C:yProgram Files (x86)yJmolyJmol.jar,’’ and
these flags depend on the specific location of the Jmol installa-
tion); note that in this case the executable is the command
reserved

Figure 1. CyToStruct Interfaces between a Cytoscape Network of Protein-Protein Interactions and the Corresponding Protein/RNA Com-
plex, Visualized Using PyMOL
The network describes the human mitochondrial ribosome complex of 48 proteins (Brown et al., 2014). The PyMOL window at the front shows the interface
between two proteins, mL51 and uL4, highlighting the CA atoms of the interface residues (as identified by PISA [Krissinel and Henrick, 2007]) as spheres.
‘‘java,’’ and Jmol is specified via the command line arguments of
that program. Finally, one must also install CyToStruct (from the
Cytoscape App Store at http://apps.cytoscape.org/).
Next, we describe the demos.
Protein-Protein Interaction Network
The network represents the human mitochondrial ribosome
complex ((Brown et al., 2014); PDB ID 3J7Y). The complex
has 48 proteins, 20 of which are mitochondria specific. Using
PISA (Krissinel and Henrick, 2007), we calculated the areas
and residues of interfaces in the complex and created a
network based on the list of contacts. Each node is a protein
(nodes that are colored light blue represent conserved pro-
teins; yellow nodes are mitochondria specific), and protein
pairs with an interface larger than 100 A2 are connected by
an edge; the edge width is proportional to the interface area.
Right-clicking on a node launches a visualization of the node’s
corresponding protein, e.g., using PyMOL. Right-clicking on
an edge launches a visualization of the two corresponding in-
teracting proteins, with their interface residues highlighted.
Figure 1 shows a screenshot of the network in Cytoscape,
and the selection of an edge, along with the PyMOL window
showing the interface.
Indeed, any molecular complex can be represented as a
network: Cytoscape can visualize the overall structure, and mo-
lecular viewers can visualize the interacting chains and interface
residues; CyToStruct can bridge between the two. To help first-
Structure 23
time users, we have set up a web server (http://trachel-srv.cs.
haifa.ac.il/rachel/ppi/) that converts PISA (Krissinel and Henrick,
2007) output to the format needed by Cytoscape and CyToS-
truct, given a complex file (e.g., 3j7y.pdb). Once CyToStruct is
installed, the user can open the *.cys file included in the output
zip file, and explore the chains and interfaces by right-clicking
on a node or edge to run a molecular viewer with the script
customized for that node or edge.
A Network of the Similarities among Structural Domains
The network (Nepomnyachiy et al., 2014) consists of a 70%
sequence non-redundant representative set of SCOP (Struc-
tural Classification of Proteins) domains (Hubbard et al.,
1997). Nodes represent domains, each colored according to
its SCOP class; each edge connects a pair of domains that
share a motif: a subset of more than 75 residues with similar
sequences (more than 30% similarity) and similar structures
(at most 2.5 A root-mean-square deviation [RMSD] after opti-
mally superimposing the two; see Nepomnyachiy et al., 2014
for details). Figure 2 shows a screenshot of the network in
Cytoscape, along with a selection of an edge in PyMOL. To
generate a visualization of an edge for this network, the scripts
load the two connected domains and color their similar motifs
in cyan and magenta. Importantly, to demonstrate the similarity
between the motifs, we use the molecular viewers to calculate
the optimal rotation and translation (in terms of the lowest
RMSD) for the matching residues and use the output to
, 941–948, May 5, 2015 ª2015 Elsevier Ltd All rights reserved 943
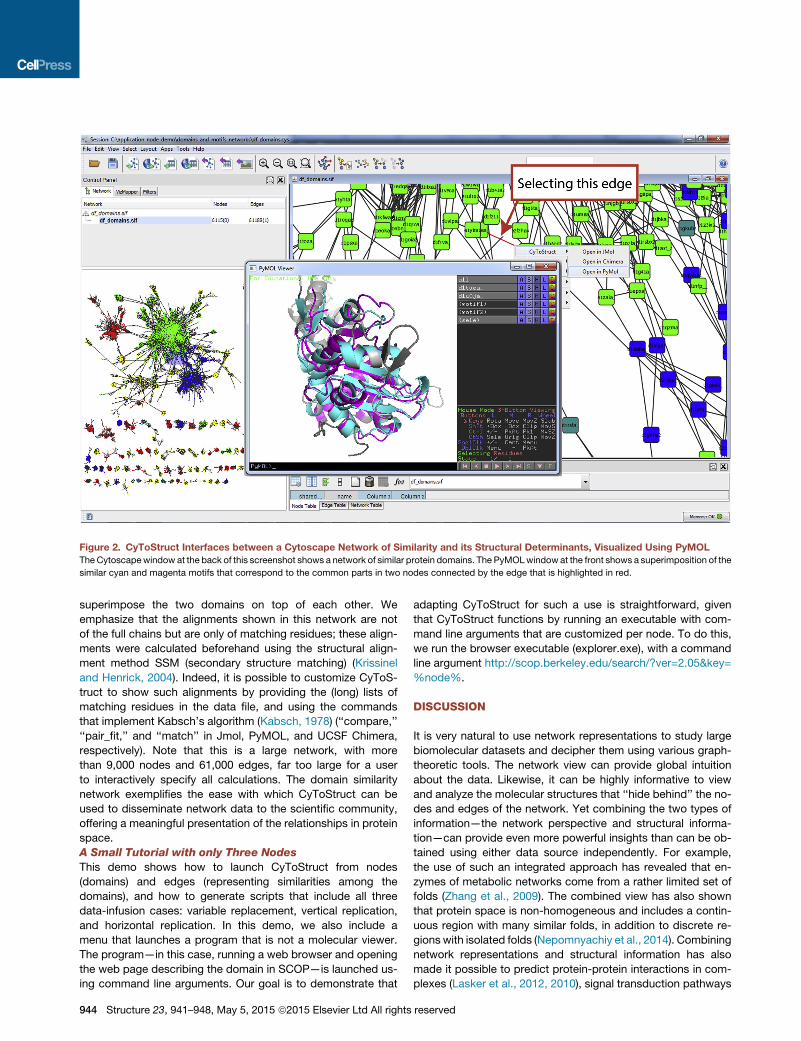
Figure 2. CyToStruct Interfaces between a Cytoscape Network of Similarity and its Structural Determinants, Visualized Using PyMOL
TheCytoscapewindow at the back of this screenshot shows a network of similar protein domains. The PyMOLwindow at the front shows a superimposition of the
similar cyan and magenta motifs that correspond to the common parts in two nodes connected by the edge that is highlighted in red.
superimpose the two domains on top of each other. We
emphasize that the alignments shown in this network are not
of the full chains but are only of matching residues; these align-
ments were calculated beforehand using the structural align-
ment method SSM (secondary structure matching) (Krissinel
and Henrick, 2004). Indeed, it is possible to customize CyToS-
truct to show such alignments by providing the (long) lists of
matching residues in the data file, and using the commands
that implement Kabsch’s algorithm (Kabsch, 1978) (‘‘compare,’’
‘‘pair_fit,’’ and ‘‘match’’ in Jmol, PyMOL, and UCSF Chimera,
respectively). Note that this is a large network, with more
than 9,000 nodes and 61,000 edges, far too large for a user
to interactively specify all calculations. The domain similarity
network exemplifies the ease with which CyToStruct can be
used to disseminate network data to the scientific community,
offering a meaningful presentation of the relationships in protein
space.
A Small Tutorial with only Three Nodes
This demo shows how to launch CyToStruct from nodes
(domains) and edges (representing similarities among the
domains), and how to generate scripts that include all three
data-infusion cases: variable replacement, vertical replication,
and horizontal replication. In this demo, we also include a
menu that launches a program that is not a molecular viewer.
The program—in this case, running a web browser and opening
the web page describing the domain in SCOP—is launched us-
ing command line arguments. Our goal is to demonstrate that
944 Structure 23, 941–948, May 5, 2015 ª2015 Elsevier Ltd All rights
adapting CyToStruct for such a use is straightforward, given
that CyToStruct functions by running an executable with com-
mand line arguments that are customized per node. To do this,
we run the browser executable (explorer.exe), with a command
line argument http://scop.berkeley.edu/search/?ver=2.05&key=
%node%.
DISCUSSION
It is very natural to use network representations to study large
biomolecular datasets and decipher them using various graph-
theoretic tools. The network view can provide global intuition
about the data. Likewise, it can be highly informative to view
and analyze the molecular structures that ‘‘hide behind’’ the no-
des and edges of the network. Yet combining the two types of
information—the network perspective and structural informa-
tion—can provide even more powerful insights than can be ob-
tained using either data source independently. For example,
the use of such an integrated approach has revealed that en-
zymes of metabolic networks come from a rather limited set of
folds (Zhang et al., 2009). The combined view has also shown
that protein space is non-homogeneous and includes a contin-
uous region with many similar folds, in addition to discrete re-
gions with isolated folds (Nepomnyachiy et al., 2014). Combining
network representations and structural information has also
made it possible to predict protein-protein interactions in com-
plexes (Lasker et al., 2012, 2010), signal transduction pathways
reserved
A C
B
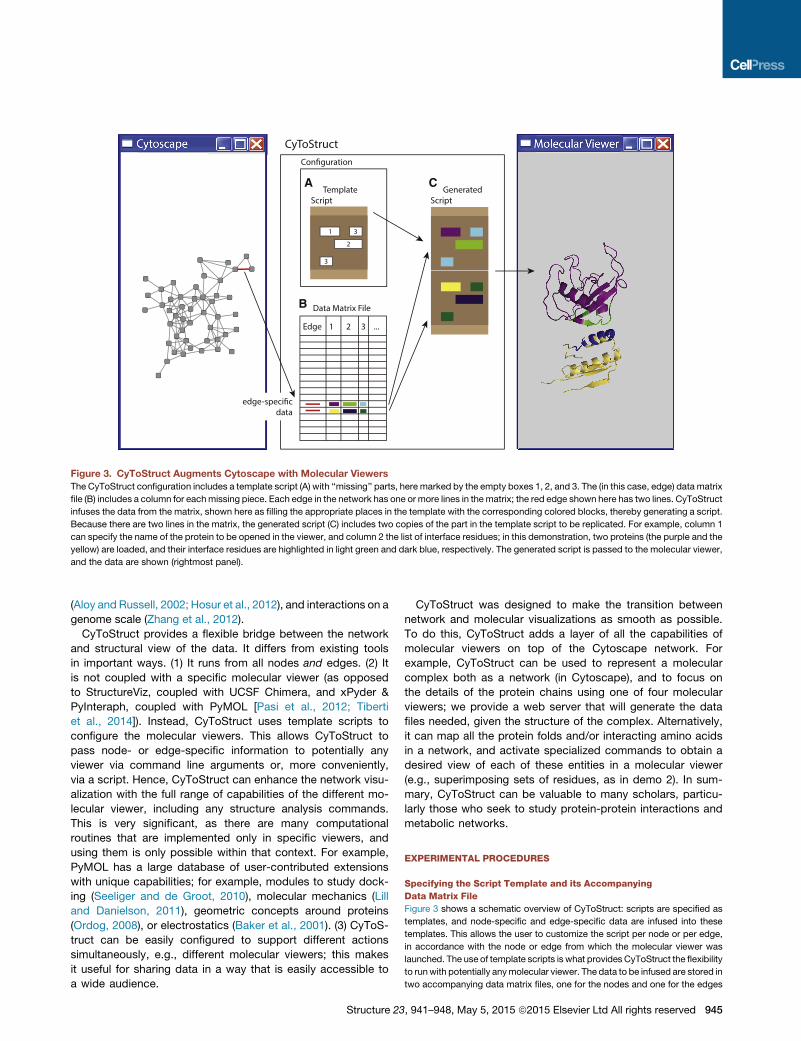
Figure 3. CyToStruct Augments Cytoscape with Molecular Viewers
The CyToStruct configuration includes a template script (A) with ‘‘missing’’ parts, here marked by the empty boxes 1, 2, and 3. The (in this case, edge) data matrix
file (B) includes a column for eachmissing piece. Each edge in the network has one or more lines in the matrix; the red edge shown here has two lines. CyToStruct
infuses the data from the matrix, shown here as filling the appropriate places in the template with the corresponding colored blocks, thereby generating a script.
Because there are two lines in the matrix, the generated script (C) includes two copies of the part in the template script to be replicated. For example, column 1
can specify the name of the protein to be opened in the viewer, and column 2 the list of interface residues; in this demonstration, two proteins (the purple and the
yellow) are loaded, and their interface residues are highlighted in light green and dark blue, respectively. The generated script is passed to the molecular viewer,
and the data are shown (rightmost panel).
(Aloy and Russell, 2002; Hosur et al., 2012), and interactions on a
genome scale (Zhang et al., 2012).
CyToStruct provides a flexible bridge between the network
and structural view of the data. It differs from existing tools
in important ways. (1) It runs from all nodes and edges. (2) It
is not coupled with a specific molecular viewer (as opposed
to StructureViz, coupled with UCSF Chimera, and xPyder &
PyInteraph, coupled with PyMOL [Pasi et al., 2012; Tiberti
et al., 2014]). Instead, CyToStruct uses template scripts to
configure the molecular viewers. This allows CyToStruct to
pass node- or edge-specific information to potentially any
viewer via command line arguments or, more conveniently,
via a script. Hence, CyToStruct can enhance the network visu-
alization with the full range of capabilities of the different mo-
lecular viewer, including any structure analysis commands.
This is very significant, as there are many computational
routines that are implemented only in specific viewers, and
using them is only possible within that context. For example,
PyMOL has a large database of user-contributed extensions
with unique capabilities; for example, modules to study dock-
ing (Seeliger and de Groot, 2010), molecular mechanics (Lill
and Danielson, 2011), geometric concepts around proteins
(Ordog, 2008), or electrostatics (Baker et al., 2001). (3) CyToS-
truct can be easily configured to support different actions
simultaneously, e.g., different molecular viewers; this makes
it useful for sharing data in a way that is easily accessible to
a wide audience.
Structure 23
CyToStruct was designed to make the transition between
network and molecular visualizations as smooth as possible.
To do this, CyToStruct adds a layer of all the capabilities of
molecular viewers on top of the Cytoscape network. For
example, CyToStruct can be used to represent a molecular
complex both as a network (in Cytoscape), and to focus on
the details of the protein chains using one of four molecular
viewers; we provide a web server that will generate the data
files needed, given the structure of the complex. Alternatively,
it can map all the protein folds and/or interacting amino acids
in a network, and activate specialized commands to obtain a
desired view of each of these entities in a molecular viewer
(e.g., superimposing sets of residues, as in demo 2). In sum-
mary, CyToStruct can be valuable to many scholars, particu-
larly those who seek to study protein-protein interactions and
metabolic networks.
EXPERIMENTAL PROCEDURES
Specifying the Script Template and its Accompanying
Data Matrix File
Figure 3 shows a schematic overview of CyToStruct: scripts are specified as
templates, and node-specific and edge-specific data are infused into these
templates. This allows the user to customize the script per node or per edge,
in accordance with the node or edge from which the molecular viewer was
launched. The use of template scripts is what provides CyToStruct the flexibility
to runwith potentially anymolecular viewer. The data to be infused are stored in
two accompanying data matrix files, one for the nodes and one for the edges
, 941–948, May 5, 2015 ª2015 Elsevier Ltd All rights reserved 945
cd %dir%bg_color white%V_START%load %domain%.ent select motif_%domain%, (resi %H_START%%residues%,%H_END%%last_res%) color %dcolor%, %domain%color %mcolor%, motif_%domain%%V_END% hide allshow cartoon
cd C:\application_node_demo\bg_color white
load d1ji4a_.ent select motif_d1ji4a_, (resi 1-2,4-20,22-24,25) color cyan, d1ji4a_color blue, motif_d1ji4a_load d1dtoa_.ent select motif_d1dtoa_, (resi 0-121,122) color orange, d1dtoa_color red, motif_d1dtoa_ hide allshow cartoon
horizontal replication
vertical replication
variable replacement
node domain residues
1 d1ji4a_ 25 cyan blue
1 d1dtoa_ 122 orange red
2 d1tueb_ 163 magenta yellow
3 d1r6na_ 2 cyan blue
last_res dcolor mcolor
1
0,2-123,124,127-161
0-121
1-2,4-20,22-24
A
C
B
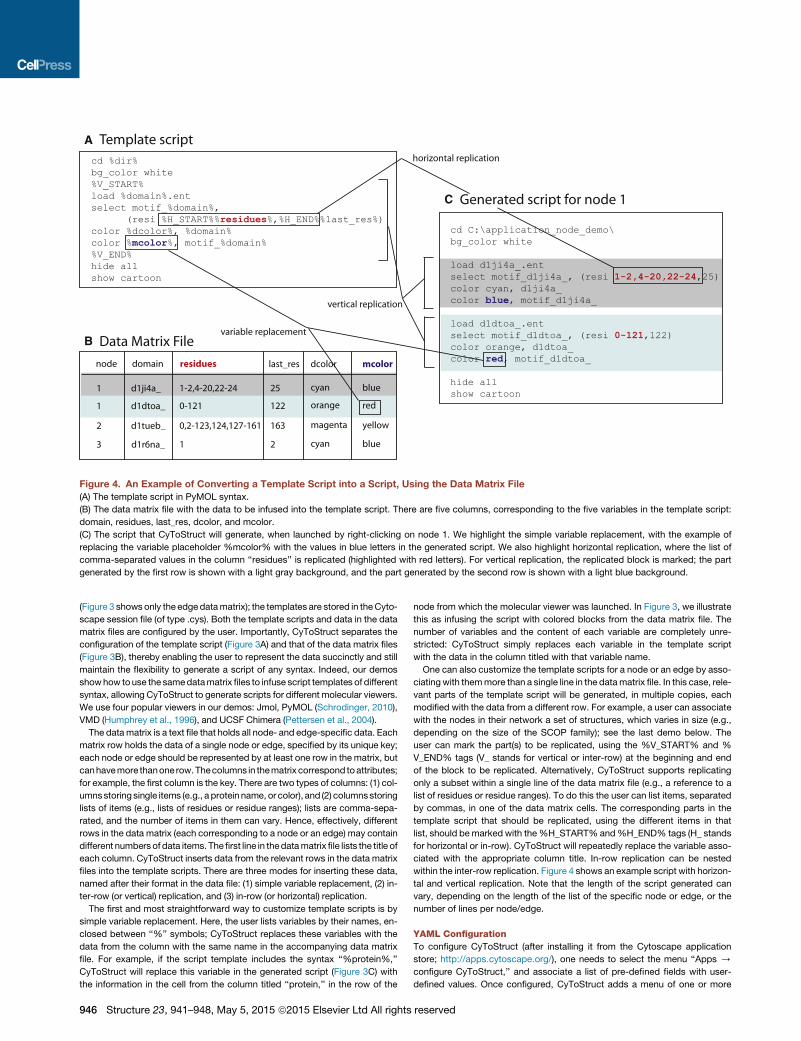
Figure 4. An Example of Converting a Template Script into a Script, Using the Data Matrix File(A) The template script in PyMOL syntax.
(B) The data matrix file with the data to be infused into the template script. There are five columns, corresponding to the five variables in the template script:
domain, residues, last_res, dcolor, and mcolor.
(C) The script that CyToStruct will generate, when launched by right-clicking on node 1. We highlight the simple variable replacement, with the example of
replacing the variable placeholder %mcolor% with the values in blue letters in the generated script. We also highlight horizontal replication, where the list of
comma-separated values in the column ‘‘residues’’ is replicated (highlighted with red letters). For vertical replication, the replicated block is marked; the part
generated by the first row is shown with a light gray background, and the part generated by the second row is shown with a light blue background.
(Figure 3 shows only the edgedatamatrix); the templates are stored in theCyto-
scape session file (of type .cys). Both the template scripts and data in the data
matrix files are configured by the user. Importantly, CyToStruct separates the
configuration of the template script (Figure 3A) and that of the data matrix files
(Figure 3B), thereby enabling the user to represent the data succinctly and still
maintain the flexibility to generate a script of any syntax. Indeed, our demos
showhow to use the samedatamatrix files to infuse script templates of different
syntax, allowing CyToStruct to generate scripts for different molecular viewers.
We use four popular viewers in our demos: Jmol, PyMOL (Schrodinger, 2010),
VMD (Humphrey et al., 1996), and UCSF Chimera (Pettersen et al., 2004).
The datamatrix is a text file that holds all node- and edge-specific data. Each
matrix row holds the data of a single node or edge, specified by its unique key;
each node or edge should be represented by at least one row in the matrix, but
canhavemore thanone row.Thecolumns in thematrix correspond toattributes;
for example, the first column is the key. There are two types of columns: (1) col-
umnsstoring single items (e.g., a protein name, or color), and (2) columnsstoring
lists of items (e.g., lists of residues or residue ranges); lists are comma-sepa-
rated, and the number of items in them can vary. Hence, effectively, different
rows in the data matrix (each corresponding to a node or an edge) may contain
different numbers of data items. Thefirst line in thedatamatrix file lists the title of
each column. CyToStruct inserts data from the relevant rows in the data matrix
files into the template scripts. There are three modes for inserting these data,
named after their format in the data file: (1) simple variable replacement, (2) in-
ter-row (or vertical) replication, and (3) in-row (or horizontal) replication.
The first and most straightforward way to customize template scripts is by
simple variable replacement. Here, the user lists variables by their names, en-
closed between ‘‘%’’ symbols; CyToStruct replaces these variables with the
data from the column with the same name in the accompanying data matrix
file. For example, if the script template includes the syntax ‘‘%protein%,’’
CyToStruct will replace this variable in the generated script (Figure 3C) with
the information in the cell from the column titled ‘‘protein,’’ in the row of the
946 Structure 23, 941–948, May 5, 2015 ª2015 Elsevier Ltd All rights
node from which the molecular viewer was launched. In Figure 3, we illustrate
this as infusing the script with colored blocks from the data matrix file. The
number of variables and the content of each variable are completely unre-
stricted: CyToStruct simply replaces each variable in the template script
with the data in the column titled with that variable name.
One can also customize the template scripts for a node or an edge by asso-
ciating with themmore than a single line in the datamatrix file. In this case, rele-
vant parts of the template script will be generated, in multiple copies, each
modified with the data from a different row. For example, a user can associate
with the nodes in their network a set of structures, which varies in size (e.g.,
depending on the size of the SCOP family); see the last demo below. The
user can mark the part(s) to be replicated, using the %V_START% and %
V_END% tags (V_ stands for vertical or inter-row) at the beginning and end
of the block to be replicated. Alternatively, CyToStruct supports replicating
only a subset within a single line of the data matrix file (e.g., a reference to a
list of residues or residue ranges). To do this the user can list items, separated
by commas, in one of the data matrix cells. The corresponding parts in the
template script that should be replicated, using the different items in that
list, should bemarked with the%H_START% and%H_END% tags (H_ stands
for horizontal or in-row). CyToStruct will repeatedly replace the variable asso-
ciated with the appropriate column title. In-row replication can be nested
within the inter-row replication. Figure 4 shows an example script with horizon-
tal and vertical replication. Note that the length of the script generated can
vary, depending on the length of the list of the specific node or edge, or the
number of lines per node/edge.
YAML Configuration
To configure CyToStruct (after installing it from the Cytoscape application
store; http://apps.cytoscape.org/), one needs to select the menu ‘‘Apps /
configure CyToStruct,’’ and associate a list of pre-defined fields with user-
defined values. Once configured, CyToStruct adds a menu of one or more
reserved
items that will open when the user right-clicks on a node or an edge in Cyto-
scape. Upon selection of an item from this menu, CyToStruct will execute a
program—typically, amolecular viewer (although it can also launch other types
of programs; see the following section for further details)—and pass it the
script it customized with the edge- or node-specific data. The user-defined
values for these pre-defined fields should be listed in valid YAML—a simple,
text-based, configuration language (the user can refer to online YAML syntax
validators if necessary; e.g., http://yamllint.com/). The pre-defined fields are:
(1) appContext, which specifies whether CyToStruct will be activated from
an edge or a node; (2) appCaption with the menu caption; (3) appBinary with
the name of the application to launch: this is the name of the command that
it is run from (e.g., pymolwin for PyMOL on Windows machines). If the user
wants to add command line arguments, he or she can list them following the
command name. Alternatively, one can use (4) cmdLineArgs with the com-
mand line arguments, (5) suffix with the suffix of the temporary script file
(e.g., pml for PyMOL), (6) dataMatrixFile with the name of the data matrix
file, and (7) scriptLines with the script template itself. Within the script, one
can use %variable% tags with any variable names, and the %H_START%,
%H_END%, %V_START%, and %V_END% tags. The variables %node%
and %edge% can be used in the script and in the command line arguments;
CyToStruct replaces such a variable with the label of the node or edge from
which the molecular viewer was launched. The variable %dir%, which holds
the directory of the current Cytoscape session file (of type .cys), can also be
used in the script. Finally, the user can specify alternative delimiters for the col-
umns in the data file (the default is a space) and within arrays (the default is a
comma) using (8) columnDelimiter and (9) arrayDelimiter.
ACKNOWLEDGMENTS
We thank Dr. Alexey Amunts for sharing the 3J7Y structure with us prior to
publication, and Aya Narunsky and Gal Masrati for their helpful suggestions
concerning visualization. N.B.-T. acknowledges the financial support of grant
No. 1775/12 of the I-COREProgram of the Planning and Budgeting Committee
and The Israel Science Foundation.
Received: December 2, 2014
Revised: February 20, 2015
Accepted: February 24, 2015
Published: April 9, 2015
REFERENCES
Aloy, P., and Russell, R.B. (2002). Interrogating protein interaction networks
through structural biology. Proc. Natl. Acad. Sci. USA 99, 5896–5901.
Aloy, P., and Russell, R.B. (2006). Structural systems biology: modelling pro-
tein interactions. Nat. Rev. Mol. Cell Biol. 7, 188–197.
Aloy, P., Bottcher, B., Ceulemans, H., Leutwein, C., Mellwig, C., Fischer,
S., Gavin, A.-C., Bork, P., Superti-Furga, G., and Serrano, L. (2004).
Structure-based assembly of protein complexes in yeast. Science 303,
2026–2029.
Alva, V., Remmert, M., Biegert, A., Lupas, A.N., and Soding, J. (2010). A galaxy
of folds. Protein Sci. 19, 124–130.
Amitai, G., Shemesh, A., Sitbon, E., Shklar, M., Netanely, D., Venger, I., and
Pietrokovski, S. (2004). Network analysis of protein structures identifies func-
tional residues. J. Mol. Biol. 344, 1135–1146.
Baker, N.A., Sept, D., Joseph, S., Holst, M.J., and McCammon, J.A. (2001).
Electrostatics of nanosystems: application to microtubules and the ribosome.
Proc. Natl. Acad. Sci. USA 98, 10037–10041.
Ben-Tal, N., and Kolodny, R. (2014). Representation of the protein universe us-
ing classifications, maps, and networks. Isr. J. Chem. 54, 1286–1292.
Bornberg-Bauer, E., Beaussart, F., Kummerfeld, S., Teichmann, S., and
Weiner, J., III. (2005). The evolution of domain arrangements in proteins and
interaction networks. Cell. Mol. Life Sci. 62, 435–445.
Brown, A., Amunts, A., Bai, X.-C., Sugimoto, Y., Edwards, P.C., Murshudov,
G., Scheres, S.H., and Ramakrishnan, V. (2014). Structure of the large ribo-
somal subunit from human mitochondria. Science 346, 718–722.
Structure 23
Chakraborty, A., Mandloi, S., Lanczycki, C.J., Panchenko, A.R., and
Chakrabarti, S. (2012). SPEER-SERVER: a web server for prediction of protein
specificity determining sites. Nucleic Acids Res. 40, W242–W248.
Chang, R.L., Andrews, K., Kim, D., Li, Z., Godzik, A., and Palsson, B.O. (2013).
Structural systems biology evaluation of metabolic thermotolerance in
Escherichia coli. Science 340, 1220–1223.
de Juan, D., Pazos, F., and Valencia, A. (2013). Emerging methods in protein
co-evolution. Nat. Rev. Genet. 14, 249–261.
Dokholyan, N.V., Shakhnovich, B., and Shakhnovich, E.I. (2002). Expanding
protein universe and its origin from the biological Big Bang. Proc. Natl.
Acad. Sci. USA 99, 14132–14136.
Doncheva, N.T., Klein, K., Domingues, F.S., and Albrecht, M. (2011). Analyzing
and visualizing residue networks of protein structures. Trends Biochem. Sci.
36, 179–182.
Eargle, J., and Luthey-Schulten, Z. (2012). NetworkView: 3D display and anal-
ysis of protein$RNA interaction networks. Bioinformatics 28, 3000–3001.
Farıas-Rico, J.A., Schmidt, S., and Hocker, B. (2014). Evolutionary relationship
of two ancient protein superfolds. Nat. Chem. Biol. 10, 710–715.
Greene, L.H. (2012). Protein structure networks. Brief. Funct. Genomics 11,
469–478.
Hosur, R., Peng, J., Vinayagam, A., Stelzl, U., Xu, J., Perrimon, N.,
Bienkowska, J., and Berger, B. (2012). Coev2Net: a computational framework
for boosting confidence in high-throughput protein-protein interaction data-
sets. Genome Biol. 13, R76.
Hubbard, T.J., Murzin, A.G., Brenner, S.E., and Chothia, C. (1997). SCOP: a
structural classification of proteins database. Nucleic Acids Res. 25, 236–239.
Humphrey, W., Dalke, A., and Schulten, K. (1996). VMD: visual molecular dy-
namics. J. Mol. Graph. 14, 33–38.
Jeong, H., Tombor, B., Albert, R., Oltvai, Z.N., and Barabasi, A.L. (2000). The
large-scale organization of metabolic networks. Nature 407, 651–654.
Kabsch, W. (1978). A discussion of the solution for the best rotation to relate
two sets of vectors. Acta Crystallogr. A 34, 827–828.
Keiser, M.J., Roth, B.L., Armbruster, B.N., Ernsberger, P., Irwin, J.J., and
Shoichet, B.K. (2007). Relating protein pharmacology by ligand chemistry.
Nat. Biotechnol. 25, 197–206.
Krissinel, E., and Henrick, K. (2004). Secondary-structure matching (SSM), a
new tool for fast protein structure alignment in three dimensions. Acta
Crystallogr. D 60, 2256–2268.
Krissinel, E., and Henrick, K. (2007). Inference of macromolecular assemblies
from crystalline state. J. Mol. Biol. 372, 774–797.
Lasker, K., Phillips, J.L., Russel, D., Velazquez-Muriel, J., Schneidman-
Duhovny, D., Tjioe, E., Webb, B., Schlessinger, A., and Sali, A. (2010).
Integrative structure modeling of macromolecular assemblies from prote-
omics data. Mol. Cell. Proteomics 9, 1689–1702.
Lasker, K., Forster, F., Bohn, S., Walzthoeni, T., Villa, E., Unverdorben, P.,
Beck, F., Aebersold, R., Sali, A., and Baumeister, W. (2012). Molecular archi-
tecture of the 26S proteasome holocomplex determined by an integrative
approach. Proc. Natl. Acad. Sci. USA 109, 1380–1387.
Lill, M.A., and Danielson, M.L. (2011). Computer-aided drug design platform
using PyMOL. J. Comput. Aided Mol. Des. 25, 13–19.
Marks, D.S., Hopf, T.A., and Sander, C. (2012). Protein structure prediction
from sequence variation. Nat. Biotechnol. 30, 1072–1080.
Morris, J.H., Huang, C.C., Babbitt, P.C., and Ferrin, T.E. (2007). structureViz:
linking Cytoscape and UCSF Chimera. Bioinformatics 23, 2345–2347.
Nepomnyachiy, S., Ben-Tal, N., and Kolodny, R. (2014). Global view of the pro-
tein universe. Proc. Natl. Acad. Sci. USA 111, 11691–11696.
O’Donoghue, S.I., Goodsell, D.S., Frangakis, A.S., Jossinet, F., Laskowski,
R.A., Nilges, M., Saibil, H.R., Schafferhans, A., Wade, R.C., and Westhof, E.
(2010). Visualization of macromolecular structures. Nat. Methods 7, S42–S55.
Ordog, R. (2008). PyDeT, a PyMOL plug-in for visualizing geometric concepts
around proteins. Bioinformation 2, 346–347.
, 941–948, May 5, 2015 ª2015 Elsevier Ltd All rights reserved 947
Pasi, M., Tiberti, M., Arrigoni, A., and Papaleo, E. (2012). xPyder: a PyMOL plu-
gin to analyze coupled residues and their networks in protein structures.
J. Chem. Inf. Model. 52, 1865–1874.
Petrey, D., and Honig, B. (2014). Structural bioinformatics of the interactome.
Annu. Rev. Biophys. 43, 193–210.
Pettersen, E.F., Goddard, T.D., Huang, C.C., Couch, G.S., Greenblatt, D.M.,
Meng, E.C., and Ferrin, T.E. (2004). UCSF Chimera—a visualization system
for exploratory research and analysis. J. Comput. Chem. 25, 1605–1612.
Raucci, R., Colonna, G., Giovane, A., Castello, G., and Costantini, S. (2014).
N-terminal region of human chemokine receptor CXCR3: structural analysis
of CXCR3 (1-48) by experimental and computational studies. Biochim.
Biophys. Acta 1844, 1868–1880.
Russell, R.B., and Aloy, P. (2008). Targeting and tinkering with interaction net-
works. Nat. Chem. Biol. 4, 666–673.
Saito, R., Smoot, M.E., Ono, K., Ruscheinski, J., Wang, P.-L., Lotia, S., Pico,
A.R., Bader, G.D., and Ideker, T. (2012). A travel guide to Cytoscape plugins.
Nat. Methods 9, 1069–1076.
Schrodinger, LLC. (2010). The PyMOL Molecular Graphics System, Version
1.3r1. (New York: Schrodinger, LLC).
Seeliger, D., and de Groot, B.L. (2010). Ligand docking and binding site anal-
ysis with PyMOL and Autodock/Vina. J. Comput. AidedMol. Des. 24, 417–422.
Seffernick, J.L., Samanta, S.K., Louie, T.M., Wackett, L.P., and Subramanian,
M. (2009). Investigative mining of sequence data for novel enzymes: a case
study with nitrilases. J. Biotechnol. 143, 17–26.
Sillitoe, I., Lewis, T.E., Cuff, A., Das, S., Ashford, P., Dawson, N.L., Furnham,
N., Laskowski, R.A., Lee, D., Lees, J.G., et al. (2015). CATH: comprehensive
structural and functional annotations for genome sequences. Nucleic Acids
Res. 43, D376–D381.
Singh, R., Xu, J., and Berger, B. (2008). Global alignment of multiple protein
interaction networks with application to functional orthology detection. Proc.
Natl. Acad. Sci. USA 105, 12763–12768.
948 Structure 23, 941–948, May 5, 2015 ª2015 Elsevier Ltd All rights
Singh, O., Sawariya, K., and Aparoy, P. (2014). Graphlet signature-based
scoring method to estimate protein–ligand binding affinity. R. Soc. Open Sci.
1, 140306.
Skolnick, J., Arakaki, A.K., Lee, S.Y., and Brylinski, M. (2009). The continuity of
protein structure space is an intrinsic property of proteins. Proc. Natl. Acad.
Sci. USA 106, 15690–15695.
Stein, A., Mosca, R., and Aloy, P. (2011). Three-dimensional modeling of pro-
tein interactions and complexes is going ’omics. Curr. Opin. Struct. Biol. 21,
200–208.
Sukovich, D.J., Seffernick, J.L., Richman, J.E., Gralnick, J.A., and Wackett,
L.P. (2010). Widespread head-to-head hydrocarbon biosynthesis in bacteria
and role of OleA. Appl. Environ. Microbiol. 76, 3850–3862.
Tiberti, M., Invernizzi, G., Lambrughi, M., Inbar, Y., Schreiber, G., and
Papaleo, E. (2014). PyInteraph: a framework for the analysis of interaction
networks in structural ensembles of proteins. J. Chem. Inf. Model. 54,
1537–1551.
Vangone, A., Spinelli, R., Scarano, V., Cavallo, L., and Oliva, R. (2011).
COCOMAPS: a web application to analyze and visualize contacts at the inter-
face of biomolecular complexes. Bioinformatics 27, 2915–2916.
Xiong, B., Liu, K., Wu, J., Burk, D.L., Jiang, H., and Shen, J. (2008). DrugViz: a
Cytoscape plugin for visualizing and analyzing small molecule drugs in biolog-
ical networks. Bioinformatics 24, 2117–2118.
Zhang, Y., Thiele, I., Weekes, D., Li, Z., Jaroszewski, L., Ginalski, K., Deacon,
A.M., Wooley, J., Lesley, S.A., and Wilson, I.A. (2009). Three-dimensional
structural view of the central metabolic network of Thermotoga maritima.
Science 325, 1544–1549.
Zhang, Q.C., Petrey, D., Deng, L., Qiang, L., Shi, Y., Thu, C.A., Bisikirska,
B., Lefebvre, C., Accili, D., and Hunter, T. (2012). Structure-based predic-
tion of protein-protein interactions on a genome-wide scale. Nature 490,
556–560.
reserved