d 3.8 strategies for saving fuel with tractors trainer …efficient 20. iee/09/764/si2.558250 d 3.8...
TRANSCRIPT

Efficient 20. IEE/09/764/SI2.558250
D 3.8 Strategies for saving fuel with
tractors Trainer handbook
Version 12/2012
Franz Handler
Manfred Nadlinger

1

2
Table of contents Page
1. INTRODUCTION .................................................................................................................. 5
1.1 Total energy consumption of different crops ............................................................................... 5
1.2 Fuel consumption for particular crops .......................................................................................... 6
1.3 Fuel consumption of particular farms ........................................................................................... 7
1.4 Proportion of fuel of tractor costs ................................................................................................ 8
1.5 Energy flow of tractors .................................................................................................................. 9
1.6 Fuel consumption for different agricultural works ..................................................................... 10
2. ACQUISITION OF THE ACTUAL SITUATION OF FUEL CONSUMPTION .................................... 13
2.1 Conclusion ................................................................................................................................... 19
3. OPTIMIZING THE USE OF A TRACTOR IN THE FIELD ............................................................. 20
3.1 Engine data .................................................................................................................................. 20
3.1.1 Engine power .................................................................................................................. 21
3.1.2 Torque and torque rise .................................................................................................. 21
3.1.3 Development of torque and power output ................................................................... 22
3.1.4 Specific fuel consumption .............................................................................................. 22
3.2 Engine selection .......................................................................................................................... 24
3.3 Engine load .................................................................................................................................. 27
3.4 Engines in constant power range and overloading ..................................................................... 29
3.5 Comparison of tractors in different power ranges ..................................................................... 30
3.6 Use of hand throttle .................................................................................................................... 32
3.7 Gear ............................................................................................................................................. 32
3.8 Power take-off ............................................................................................................................. 34
3.9 Hydraulic system ......................................................................................................................... 36
3.10 Undercarriage, tyre pressure ...................................................................................................... 37

3
3.11 Climbing resistance ..................................................................................................................... 43
3.12 Ballasting of tractor ..................................................................................................................... 44
3.13 Maintenance of tractor ............................................................................................................... 46
3.14 Conclusion ................................................................................................................................... 49
4. IMPACT OF FARM STRUCTURE ........................................................................................... 52
4.1 Plot size ....................................................................................................................................... 52
4.2 Plot form ..................................................................................................................................... 53
4.3 Distances of plots ........................................................................................................................ 54
4.4 Conclusion ................................................................................................................................... 55
5. SPECIFIC MEASURES OF SOIL TILLAGE ................................................................................ 56
5.1 Reduction of energy-wasting cultivation procedures ................................................................. 56
5.2 Reduction of working processes – combination of tasks ............................................................ 57
5.3 Avoiding of soil compaction ........................................................................................................ 58
5.4 Improvement of soil structure – biological loosening ................................................................ 59
5.5 Optimal working depth or cultivation ......................................................................................... 60
5.6 Adjusting of working intensity .................................................................................................... 61
5.7 Optimal adjustment of working width, speed and engine power .............................................. 62
5.8 Optimal adjustment of equipment ............................................................................................. 63
5.9 Maintenance of equipment ........................................................................................................ 64
5.10 Conclusion ................................................................................................................................... 65
6. SPECIFIC MEASURES OF FORAGE HARVESTING ................................................................... 67
6.1 Reduction of number of operations – combination of operations ............................................. 67
6.2 Adjustment of cutting intensity .................................................................................................. 68
6.3 Maintenance of equipment ........................................................................................................ 70
6.4 Optimal adjustment of working width, speed and engine power .............................................. 71
6.5 Conclusion ................................................................................................................................... 73
4
7. CHOICE OF TRANSPORT VEHICLES ...................................................................................... 74
7.1 Influence of size of transport vehicle .......................................................................................... 74
7.2 Comparison tractor - lorry .......................................................................................................... 76
7.3 Conclusion ................................................................................................................................... 77
8. CRUCIAL FACTOR MAN ...................................................................................................... 78
8.1 Conclusion ................................................................................................................................... 79
9. TABLE OF FIGURES ............................................................................................................ 80
10. LIST OF REFERENCES .......................................................................................................... 82

5
1. Introduction
1.1 Total energy consumption of different crops
Basing on a Swiss analysis about one third of the total energy consumption needed in agriculture has to be spent only for fuel. One exception is long-term grassland where less fuel is needed (wilted silage on long-term grassland). Apart from fuel most of the energy has to be spent for the indirect use of energy, like the production of machinery and the construction of parking facilities, as well as the chemical fertilization of fields and grasslands.
Figure 1: Composition of energy consumption of different agricultural crops
Energy consumption of different crops
02.000
4.000
6.000
8.00010.000
12.000
Ener
gy c
onsu
mpt
ion
[kW
h/ha
]
Mineral fertilizerSeed/plant protection productsMachinery/buildingsFuel
Sources: Mack und Kränzlein 2006 /Mack, Zimmermann und Kränzlein 2008
About 1/3 of total energy consumption in agriculture has to be spent for fuel.

6
1.2 Fuel consumption for particular crops
Individual agricultural crops show clearly indicated differences relating to their fuel consumption. For example cereals can differ considerably depending on their method of cultivation. For sugar beet and potatoes quite more fuel has to be spent for harvesting compared to cereals. For meadow lands the number of cuts is crucial. On the other hand for fruit growing and viniculture the quite high number of cutting processes is decisive for the high fuel consumption in comparison to other crops.
Figure 2: Fuel consumption per year for different crops
Diesel consumption for different crops
Diesel consumption for different crops amounts to 60 – 210 litres/ha depending on labour intensity.Procedure and number of operations are crucial.
0
50
100
150
200
250
Cer
eals
(con
vent
iona
ltil
lage
)
Cer
eals
(redu
ced
tilla
ge)
Suga
rbee
t,po
tato
es
Mea
dow
2 cu
tting
s
Mea
dow
4 cu
tting
s
Mea
dow
6 cu
tting
s
Frui
t gro
win
g
Vini
cultu
re
Ann
ual d
iese
l con
sum
ptio
n [l/
ha]
Source: Calculations by FJ- BLT

7
1.3 Fuel consumption of particular farms
Apart from the different agricultural crops also the size of the farm has a strong influence on its fuel consumption.
In Figure 9 average values that have been collected over three years on different farms are shown as example. They represent the different dimensions of fuel consumption of farms. Of course singular cases can show more or less large variations of these averages.
Figure 3: Annual diesel consumption of different farms
Diesel consumption of different farms
0
2.00
0
4.00
0
6.00
0
8.00
0
10.0
00
12.0
00
14.0
00
16.0
00
18.0
00Commercial crops (41 ha A)
Commercial crops (150 ha A)
Dairy cows (15 cows, 6 ha A, 15 ha GL)
Dairy cows (40 cows, 30 ha A, 33 ha GL)
Suckler cows (10 cows, 5 ha A, 13 ha GL)
Suckler cows (30 cows, 17 ha A, 38 ha GL)
Pig fattening (1000 places, 77 ha A)
Pig breeding (150 sows, 37 ha A)
Fruits (5 ha apples, 1 ha field)
Viniculture (5 ha wine, 5 ha field)
Mai
n pr
oduc
ts
Annual diesel consumption [l]
A … arable land, GL … grassland
Source: Calculations by FJ-BLT
Crop and farm size are decisive factors for diesel consumption.
8
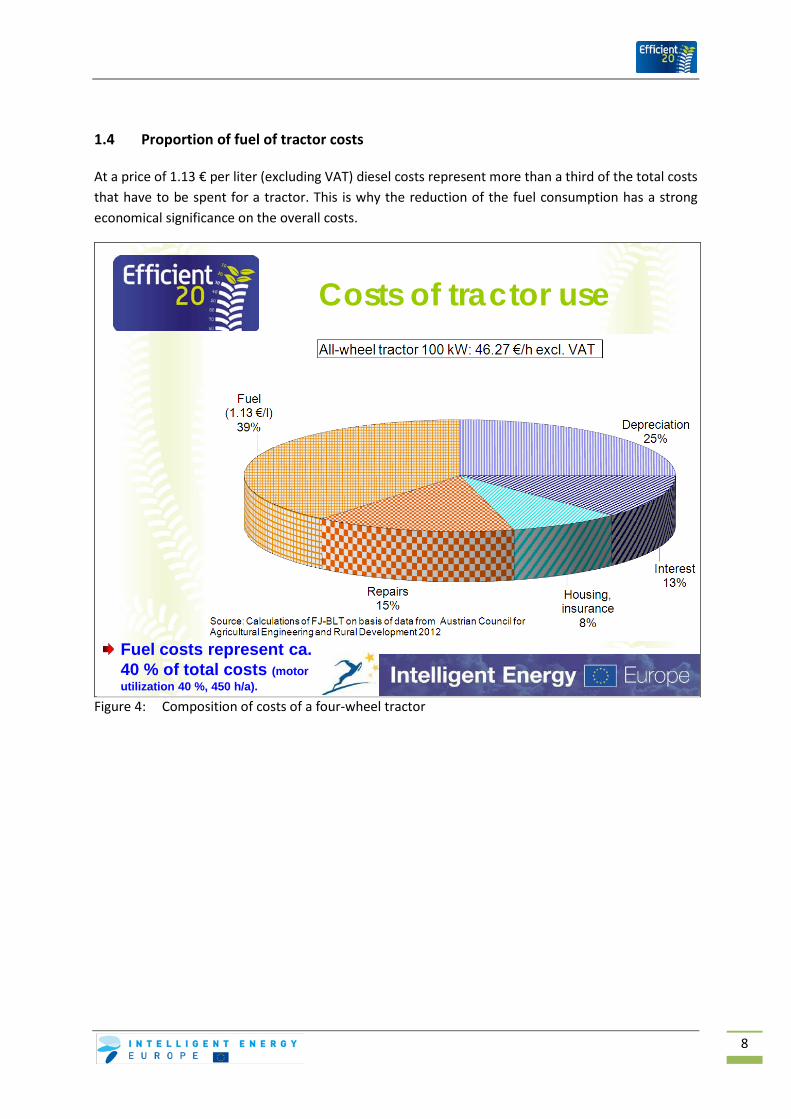
1.4 Proportion of fuel of tractor costs
At a price of 1.13 € per liter (excluding VAT) diesel costs represent more than a third of the total costs that have to be spent for a tractor. This is why the reduction of the fuel consumption has a strong economical significance on the overall costs.
Figure 4: Composition of costs of a four-wheel tractor
Costs of tractor use
Fuel costs represent ca. 40 % of total costs (motor utilization 40 %, 450 h/a).
9
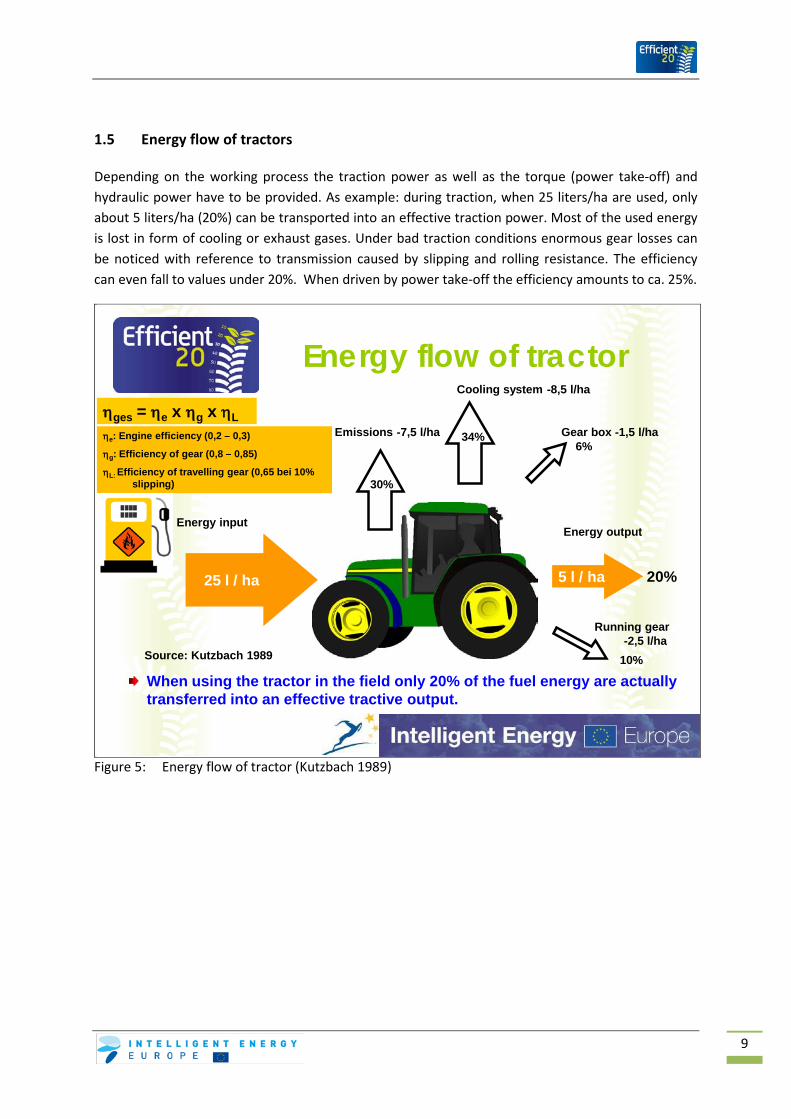
1.5 Energy flow of tractors
Depending on the working process the traction power as well as the torque (power take-off) and hydraulic power have to be provided. As example: during traction, when 25 liters/ha are used, only about 5 liters/ha (20%) can be transported into an effective traction power. Most of the used energy is lost in form of cooling or exhaust gases. Under bad traction conditions enormous gear losses can be noticed with reference to transmission caused by slipping and rolling resistance. The efficiency can even fall to values under 20%. When driven by power take-off the efficiency amounts to ca. 25%.
Figure 5: Energy flow of tractor (Kutzbach 1989)
Energy flow of tractor
25 l / ha 5 l / ha
ηe: Engine efficiency (0,2 – 0,3)
ηg: Efficiency of gear (0,8 – 0,85)
ηL: Efficiency of travelling gear (0,65 bei 10% slipping)
ηges = ηe x ηg x ηL
20%
Energy inputEnergy output
Emissions -7,5 l/ha
Cooling system -8,5 l/ha
Gear box -1,5 l/ha
Running gear -2,5 l/ha
10%
6%34%
30%
When using the tractor in the field only 20% of the fuel energy are actually transferred into an effective tractive output.
Source: Kutzbach 1989

10
1.6 Fuel consumption for different agricultural works
Due to the varying power requirement there are also significant differences with regard to fuel consumption for various agricultural processes. Table 1 and Figure 6 show the results of an investigation from 540 farms in Schleswig-Holstein / Germany. Also when performing the same tasks, the fuel consumption differs due to the influence of the type of soil or its condition, moisture, working speed, working intensity, harvest amount, machine type, setting of the machine and its maintenance, plot size, plot form, distance between field and farm and, last but not least, because of the driver. Therefore variations of ± 50% in relation to the average value are possible. This is also one of the reasons why single farms may have enormous savings potentials.
Table 1: Fuel consumption for different agricultural works (investigation from 540 farms, Holz 2006)
Working process Fuel consumption (l/ha) Remarks Average value Variation
Stubble processing 9.1 5.0-18.0 3.0 to 6.0 m Disc harrow 10.0 7.2-12.0 3.0 to 6.0 m Spade rotary harrow 6.0 6.0 m Soil loosening 19.8 18.3-21.3 35 to 38 cm deep Ploughing 21.8 15.0-30.0 18 to 30 cm deep Milling 15.9 up to 20.0 2.3 to 3.0 m Rotary harrow solo 12.7 8.0-22.0 3.0 m Mulching 12.9 10.0-17.6 2.3 to 3.0 m Rotary tiller + drilling machine 14.2 10.0-20.0 3.0 to 4.0 m Universal drilling machine 10.8 8.0-18.0 3.0 to 4.0 m Chemical fertilization 2.2 1.1-3.0 12 to 24 m Plant protection 2.0 0.75-3.4 12 to 24 m Harvester cereals 19.6 15.0-25.0 5 and 6 shaker (110 to
275 PS) Harvester rape 22.0 17.0-30.0 Transport of cereals 4.0-5.0 12 to 18 t

11
Figure 6: Fuel consumption for different agricultural works (investigation on 540 farms, Holz 2006) In Table 2 (next page) reference values determined by the ÖKL (Österreichisches Kuratorium für Landtechnik und Landentwicklung, Vienna) referring to diesel consumption for important agricultural working processes are summarized. Current values with regard to fuel consumption can also be seen on the following webpage: www.oekl.at/richtwerte/ .
For the transport of bulk goods an average value of ca. 0,09 liters per ton and kilometer between farm and field can be calculated (ÖKL 2008).
Fuel consumption for different agricultural works
0 5 10 15 20 25 30 35
Stubble processing with cultivator Disc harrow Deep tillingPloughing
Rotary tiller Rotary harrow
Mulching Rotary harrow + drilling machine
Universal drilling machine Mineral fertilization
Plant protection Harvesting cereals
Harvester rape seed Transport of cereals
Fuel consumption [l/ha]Source: Holz 2006

12
Table 2: Fuel consumption for different agricultural works (ÖKL 2008)
Working process / machinery Use Working process / machinery Use Soil cultivation Rotary mower for cultivating 5 l/ha Ploughing - light soil 15 l/ha Rotary mower with mowing conditioner 6 l/ha Ploughing - average soil 23 l/ha Automatic mower with mowing
conditioner 6 l/ha
Ploughing - heavy soil 40 l/ha Rotary tedder 3 l/ha Deep tilling (soil loosening) 21 l/ha Rotary hay rake 4 l/ha Stubble processing with grubber 9 l/ha Loader for lifting of air-dried hay 7 l/ha Deep grubbing 15 l/ha Loader for lifting of wilted silage 9 l/ha Spring tine harrow (fine grubbing) 7 l/ha Exact forage harvester 12 l/ha Harrow with seedbed combination 6 l/ha Pressing of silage round bales 0.70 l/ha Disc harrow 7 l/ha Swathing of bales 0.40 l/ha Rotary tiller 10 l/ha Fodder harvesting – silage maize Milling 12 l/ha Exact forage harvester 34 l/ha Sowing Harvesting Single grain seed 5 l/ha Cereals, sun flowers, rape, field beans 22 l/ha Mulch-single grain seed-maize 11 l/ha Peas 27 l/ha Drilling seed 5 l/ha Corn (maize) 25 l/ha Comb. rotary harrow + sower
15 l/ha Pressing of droughty goods (straw/hay)
Comb. milling + sower High pressure compressor (13 kg/bale) 0.02 l/ha Comb. dovetailing rotor + sower Round bale (250 kg/bale) 0.5 l/ha Direct sowing 9 l/ha Cuboid bale (200 kg bale) 0.4 l/ha Planting potatoes, semi-automatic 20 l/ha Potato harvester 52 l/ha Planting potatoes, fully automatic 15 l/ha Potato harvester – self-propelling 51 l/ha Fertilization Potato clearing loader 32 l/ha Tractor-mounted rotating spreader 1.5 l/ha Potato clearing loader – self-propelling 39 l/ha Mounted pneumatic spreader 2.5 l/ha Sugar beet harvester 49 l/ha Sowing of calcium 2.5 l/ha Sugar beet harvester – self-propelling 53 l/ha Chemical plant protection Pomiculture Agricultural sprayer 2 l/ha Mulching – flail mower 10 l/ha Mechanical plant protection Flail mower for winter cut 26 l/ha Harrowing 3.5 l/ha Plant protection - tractor sprayer 7 l/ha Cultivating maize (hoe machine) 4 l/ha Chemical fertilization - distributor 7.5 l/ha Cultivating maize (cultivator) 5 l/ha Viniculture (Fruits) Cultivating and harrowing 5.5 l/ha Milling of small lanes 11 l/ha Cultivating of beets 5 l/ha Cutting of leaves 8 l/ha Accumulating potatoes 5 l/ha Mulching – flail mower 12 l/ha Flame treatment 4 l/ha Plant protection - tractor sprayer 5 l/ha Maintenance Earthing up / ploughing of vineyards 20 l/ha Towing 4 l/ha Clearing vineyards 18 l/ha Rolling 3.5 l/ha Subsoiling (rotary plough) 20 l/ha Output of farm fertilizer Vintage with vine harvester 20 l/ha Spreading manure 14 l/ha Cultivating 11 l/ha Vacuum tank lorry 6 l/ha Sowing of plants and grass 3 l/ha Pump vat – towing pipe 7 l/ha Cutting of vines 7 l/ha Fodder harvesting – meadow land Rolling 4 l/ha Cutterbar mower cultivation 3 l/ha
13
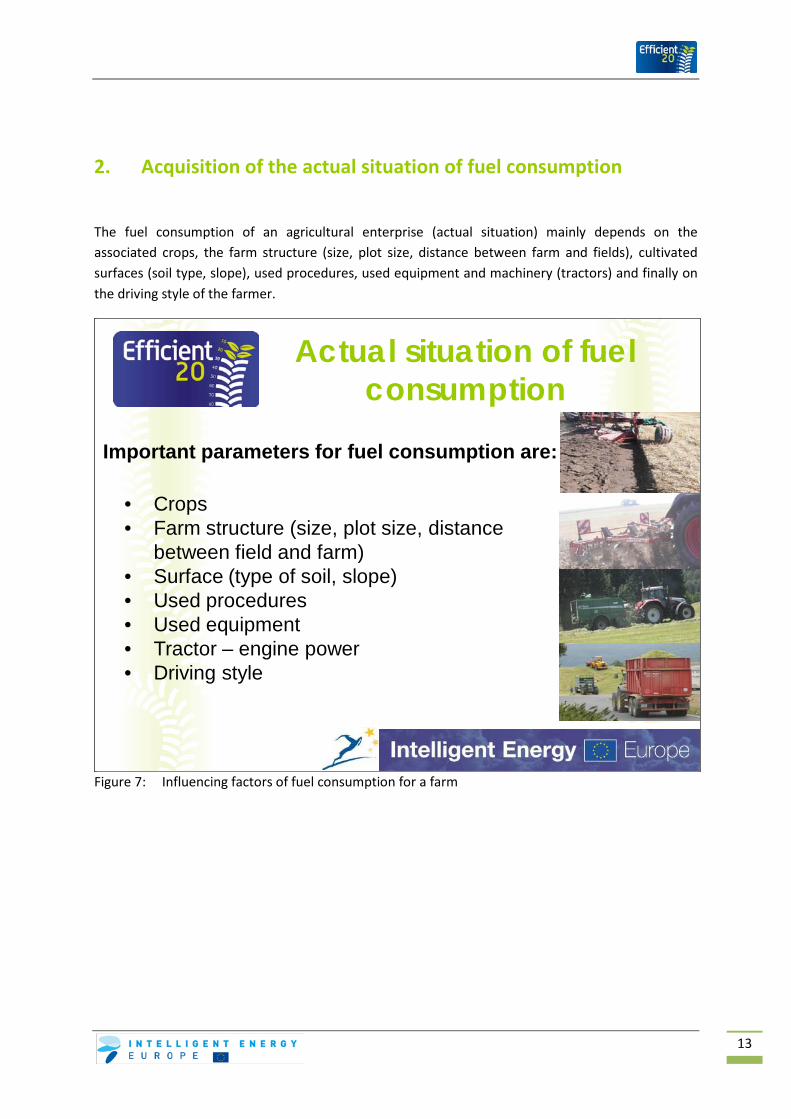
2. Acquisition of the actual situation of fuel consumption
The fuel consumption of an agricultural enterprise (actual situation) mainly depends on the associated crops, the farm structure (size, plot size, distance between farm and fields), cultivated surfaces (soil type, slope), used procedures, used equipment and machinery (tractors) and finally on the driving style of the farmer.
Figure 7: Influencing factors of fuel consumption for a farm
Actual situation of fuel consumption
Important parameters for fuel consumption are:
• Crops• Farm structure (size, plot size, distance
between field and farm)• Surface (type of soil, slope)• Used procedures• Used equipment• Tractor – engine power• Driving style

14
To get a general overview of the actual situation it is important to measure the fuel consumption of all the different tasks on a farm (see Figure 8). By comparing the actual data with standard values (as shown in Table 2) starting points can be found to reduce the overall fuel consumption in future. Because of the remarkable fluctuation range of fuel consumption for different tasks (see Figure 6) it can be very profitable for a farmer to collect his personal data and, basing on that, find out his potential with regard to an optimization.
Figure 8: Survey in field work before and after fuel saving measures
Actual situation of fuel consumption
• Measuring the fuel consumption for different tasks on a farm actual situation (actual consumption)
• Comparison of actual situation with standard values basis for fuel saving measures
• Check the impacts of these saving actions by measuring!

15
To investigate the potential for further savings it is necessary to record the data of the actual situation by logging the fuel consumption relating to each plot and each operation on the farm. This must be performed for each single step, written by hand or electronically. Basing on that an overview can be achieved of all the procedures and their corresponding fuel consumption. Therefore a basis for further efficient saving measures is formed. The following figure shows an example of a recording table.
Figure 9: Example of a recording table in practice
Acquisition of actual situation
Date Time Time
required Plot / operation / used equipment/
operation conditions / working depth, working height
Area Diesel consumption
from until [h] [ha] [l] [l/h] [l/ha]
20.08.09 10.00 14.30 4.5 Meadow land / cutting / front-rear-combination / first cut / 6 cm 13.5 54 12 4
Example of a recording table:
Recordings about fuel consumption are the basis for efficient future savings!
16
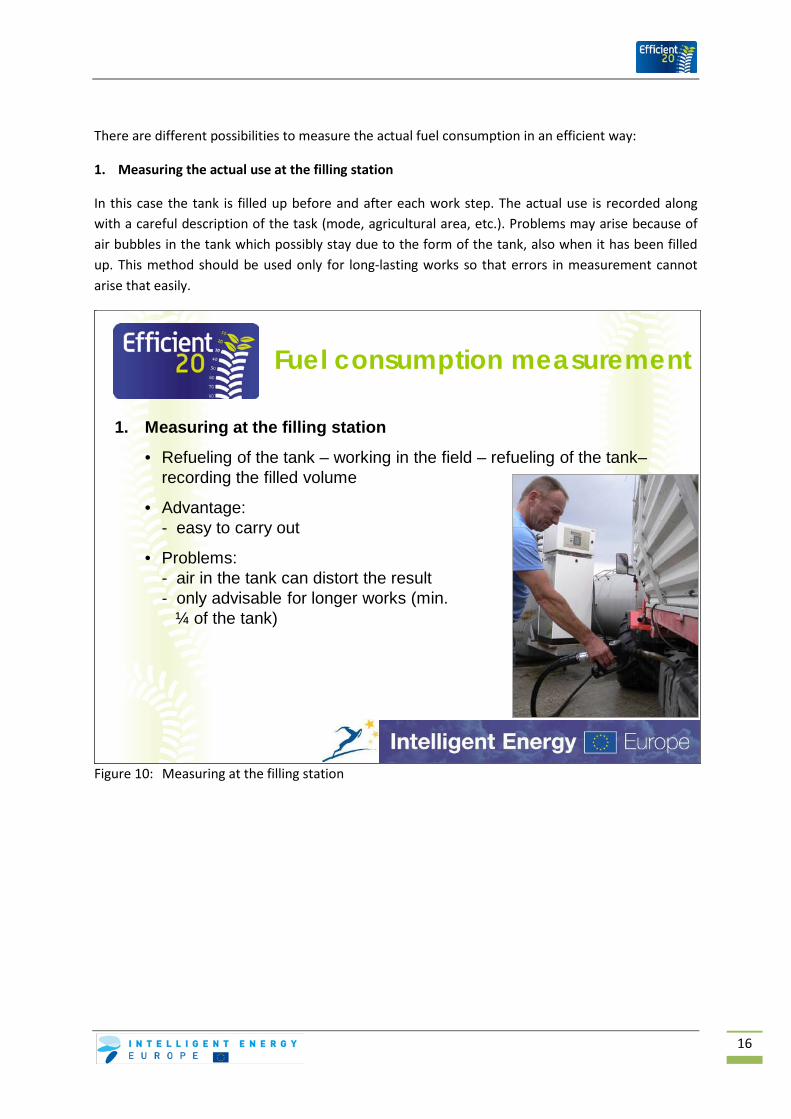
There are different possibilities to measure the actual fuel consumption in an efficient way:
1. Measuring the actual use at the filling station
In this case the tank is filled up before and after each work step. The actual use is recorded along with a careful description of the task (mode, agricultural area, etc.). Problems may arise because of air bubbles in the tank which possibly stay due to the form of the tank, also when it has been filled up. This method should be used only for long-lasting works so that errors in measurement cannot arise that easily.
Figure 10: Measuring at the filling station
Fuel consumption measurement
1. Measuring at the filling station
• Refueling of the tank – working in the field – refueling of the tank–recording the filled volume
• Advantage:- easy to carry out
• Problems: - air in the tank can distort the result- only advisable for longer works (min.
¼ of the tank)
17
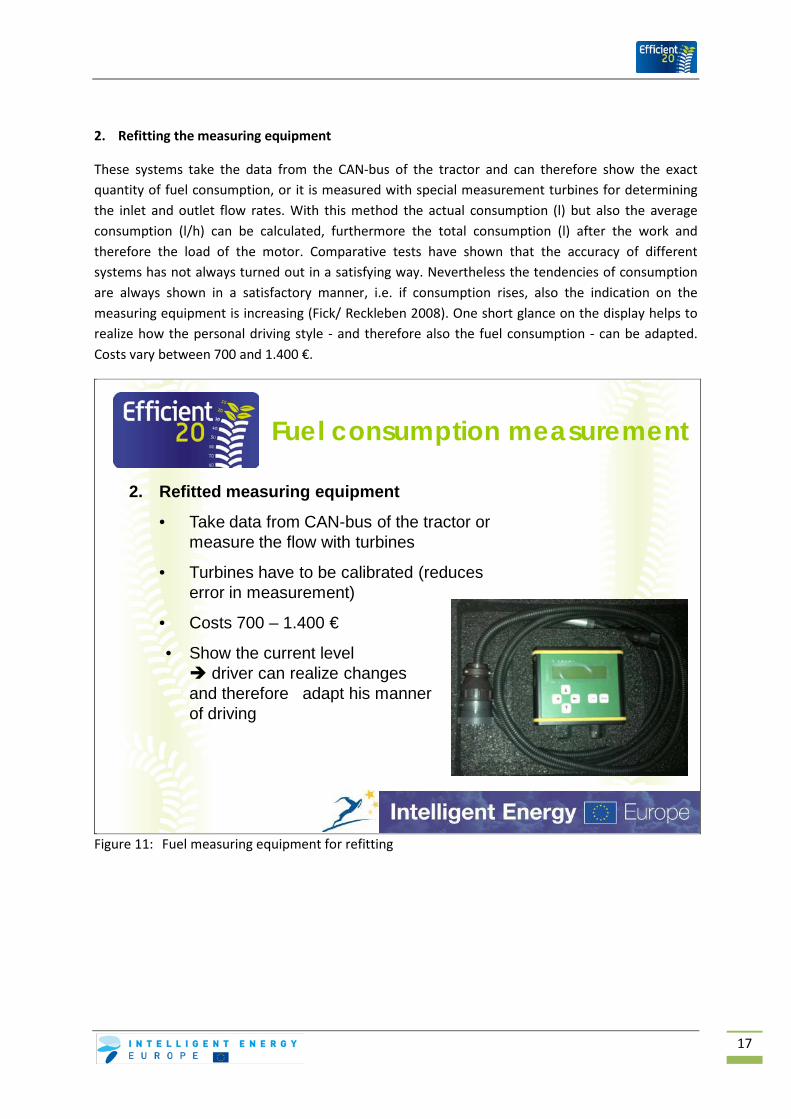
2. Refitting the measuring equipment
These systems take the data from the CAN-bus of the tractor and can therefore show the exact quantity of fuel consumption, or it is measured with special measurement turbines for determining the inlet and outlet flow rates. With this method the actual consumption (l) but also the average consumption (l/h) can be calculated, furthermore the total consumption (l) after the work and therefore the load of the motor. Comparative tests have shown that the accuracy of different systems has not always turned out in a satisfying way. Nevertheless the tendencies of consumption are always shown in a satisfactory manner, i.e. if consumption rises, also the indication on the measuring equipment is increasing (Fick/ Reckleben 2008). One short glance on the display helps to realize how the personal driving style - and therefore also the fuel consumption - can be adapted. Costs vary between 700 and 1.400 €.
Figure 11: Fuel measuring equipment for refitting
Fuel consumption measurement
2. Refitted measuring equipment
• Take data from CAN-bus of the tractor or measure the flow with turbines
• Turbines have to be calibrated (reduces error in measurement)
• Costs 700 – 1.400 €
• Show the current level driver can realize changes and therefore adapt his manner of driving
18
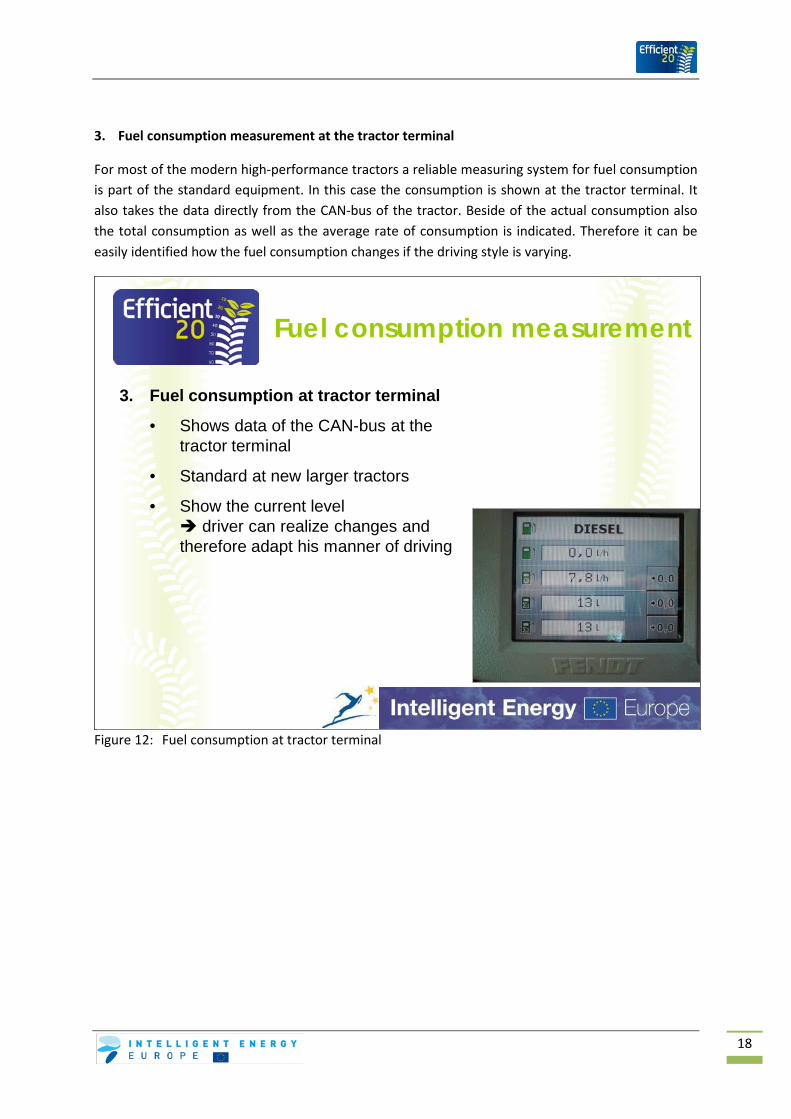
3. Fuel consumption measurement at the tractor terminal
For most of the modern high-performance tractors a reliable measuring system for fuel consumption is part of the standard equipment. In this case the consumption is shown at the tractor terminal. It also takes the data directly from the CAN-bus of the tractor. Beside of the actual consumption also the total consumption as well as the average rate of consumption is indicated. Therefore it can be easily identified how the fuel consumption changes if the driving style is varying.
Figure 12: Fuel consumption at tractor terminal
Fuel consumption measurement
3. Fuel consumption at tractor terminal
• Shows data of the CAN-bus at the tractor terminal
• Standard at new larger tractors
• Show the current level driver can realize changes and therefore adapt his manner of driving

19
2.1 Conclusion
How much fuel has been consumed?
About 1/3 of the total energy consumption in agriculture is spent for fuel.
Cultivation and farm size are crucial factors for the consumption of ca. 1.500 – 15.900 liters/year.
The diesel consumption for different crops amounts to 60 – 120 liters/ha depending on the labour intensity. The number of operations is crucial.
Costs of tractor use
Fuel costs represent ca. 40 % of total costs of the tractor input (at a utilization rate of 450 h/a).
Transmission of fuel energy into tractive power
When using the tractor in the field, only about 20% of the used fuel energy is actually transferred into an effective tractive output.
Range of fuel consumption
Fuel consumption fluctuates about +/-50 % for different tasks.
Finding the optimal potential
Recordings about the actual fuel use are the basis for efficient future savings.
Methods of measuring the fuel consumption
Complete refueling of the tank – working in the field – refueling – recording the filled volume
Refitting of fuel measuring equipment
Using the fuel measuring equipment at the tractor terminal
Pushing the “Eco”-button

20
3. Optimizing the use of a tractor in the field
3.1 Engine data
There are four key indicators to compare tractor engines:
power output
torque
fuel consumption, and
specific fuel consumption.
If all four characteristics are charted in a diagram, a “power diagram” can be created (see Figure 14).
Figure 13: Analysis of key indicators at test rig
Analysis of tractor motors
Key indicators:
Power output Torque Fuel consumption Specific fuel consumption
Presentation Diagram of performance
21
3.1.1 Engine power1
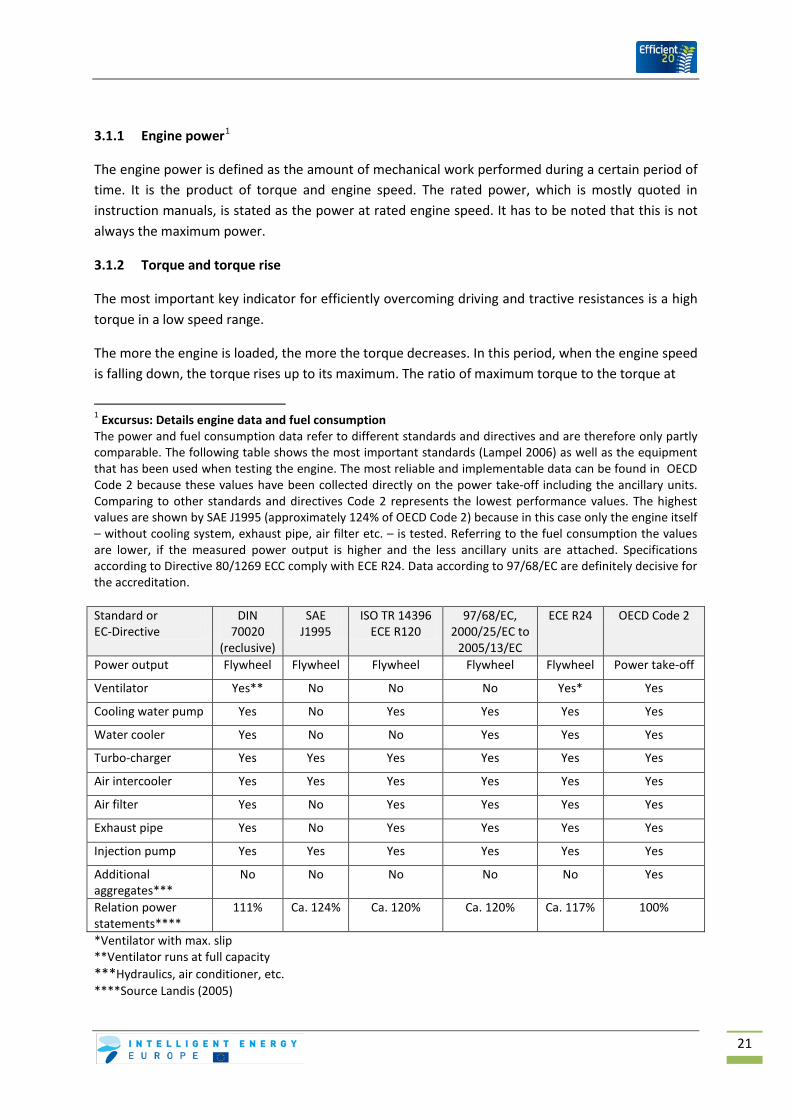
The engine power is defined as the amount of mechanical work performed during a certain period of time. It is the product of torque and engine speed. The rated power, which is mostly quoted in instruction manuals, is stated as the power at rated engine speed. It has to be noted that this is not always the maximum power.
3.1.2 Torque and torque rise
The most important key indicator for efficiently overcoming driving and tractive resistances is a high torque in a low speed range.
The more the engine is loaded, the more the torque decreases. In this period, when the engine speed is falling down, the torque rises up to its maximum. The ratio of maximum torque to the torque at
1 Excursus: Details engine data and fuel consumption The power and fuel consumption data refer to different standards and directives and are therefore only partly comparable. The following table shows the most important standards (Lampel 2006) as well as the equipment that has been used when testing the engine. The most reliable and implementable data can be found in OECD Code 2 because these values have been collected directly on the power take-off including the ancillary units. Comparing to other standards and directives Code 2 represents the lowest performance values. The highest values are shown by SAE J1995 (approximately 124% of OECD Code 2) because in this case only the engine itself – without cooling system, exhaust pipe, air filter etc. – is tested. Referring to the fuel consumption the values are lower, if the measured power output is higher and the less ancillary units are attached. Specifications according to Directive 80/1269 ECC comply with ECE R24. Data according to 97/68/EC are definitely decisive for the accreditation. Standard or EC-Directive
DIN 70020
(reclusive)
SAE J1995
ISO TR 14396 ECE R120
97/68/EC, 2000/25/EC to
2005/13/EC
ECE R24 OECD Code 2
Power output Flywheel Flywheel Flywheel Flywheel Flywheel Power take-off
Ventilator Yes** No No No Yes* Yes
Cooling water pump Yes No Yes Yes Yes Yes
Water cooler Yes No No Yes Yes Yes
Turbo-charger Yes Yes Yes Yes Yes Yes
Air intercooler Yes Yes Yes Yes Yes Yes
Air filter Yes No Yes Yes Yes Yes
Exhaust pipe Yes No Yes Yes Yes Yes
Injection pump Yes Yes Yes Yes Yes Yes
Additional aggregates***
No No No No No Yes
Relation power statements****
111% Ca. 124% Ca. 120% Ca. 120% Ca. 117% 100%
*Ventilator with max. slip **Ventilator runs at full capacity ***Hydraulics, air conditioner, etc. ****Source Landis (2005)
22
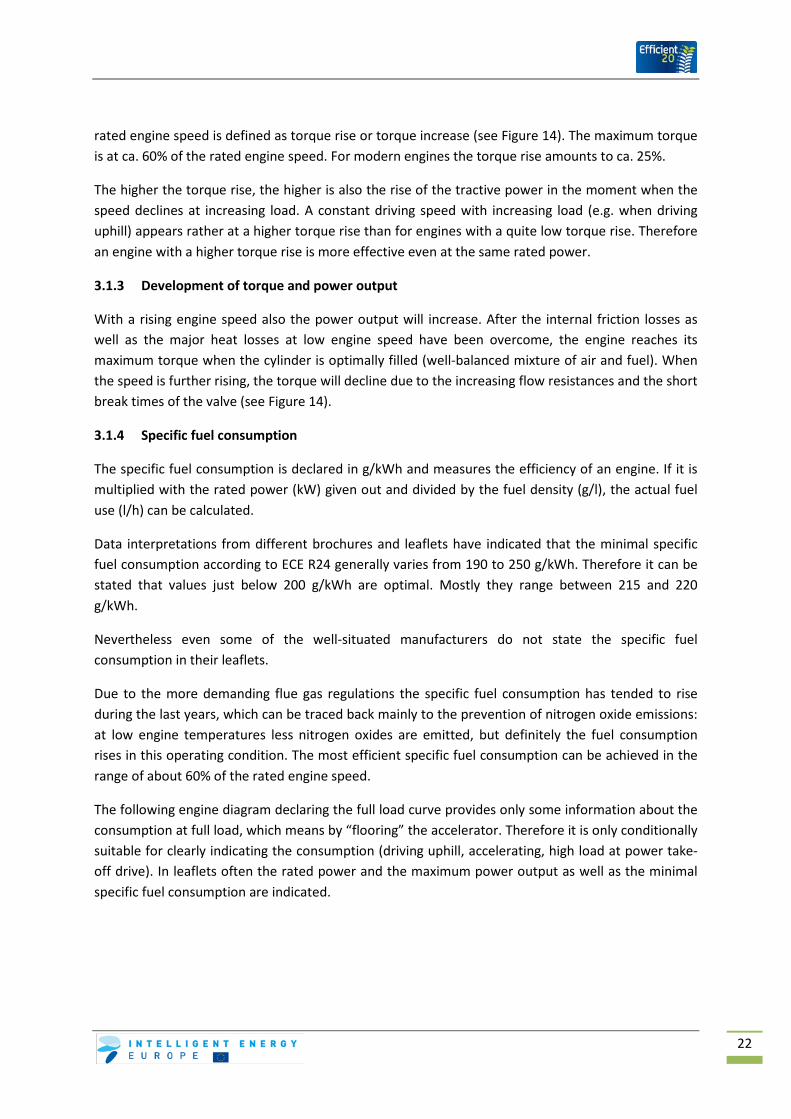
rated engine speed is defined as torque rise or torque increase (see Figure 14). The maximum torque is at ca. 60% of the rated engine speed. For modern engines the torque rise amounts to ca. 25%.
The higher the torque rise, the higher is also the rise of the tractive power in the moment when the speed declines at increasing load. A constant driving speed with increasing load (e.g. when driving uphill) appears rather at a higher torque rise than for engines with a quite low torque rise. Therefore an engine with a higher torque rise is more effective even at the same rated power.
3.1.3 Development of torque and power output
With a rising engine speed also the power output will increase. After the internal friction losses as well as the major heat losses at low engine speed have been overcome, the engine reaches its maximum torque when the cylinder is optimally filled (well-balanced mixture of air and fuel). When the speed is further rising, the torque will decline due to the increasing flow resistances and the short break times of the valve (see Figure 14).
3.1.4 Specific fuel consumption
The specific fuel consumption is declared in g/kWh and measures the efficiency of an engine. If it is multiplied with the rated power (kW) given out and divided by the fuel density (g/l), the actual fuel use (l/h) can be calculated.
Data interpretations from different brochures and leaflets have indicated that the minimal specific fuel consumption according to ECE R24 generally varies from 190 to 250 g/kWh. Therefore it can be stated that values just below 200 g/kWh are optimal. Mostly they range between 215 and 220 g/kWh.
Nevertheless even some of the well-situated manufacturers do not state the specific fuel consumption in their leaflets.
Due to the more demanding flue gas regulations the specific fuel consumption has tended to rise during the last years, which can be traced back mainly to the prevention of nitrogen oxide emissions: at low engine temperatures less nitrogen oxides are emitted, but definitely the fuel consumption rises in this operating condition. The most efficient specific fuel consumption can be achieved in the range of about 60% of the rated engine speed.
The following engine diagram declaring the full load curve provides only some information about the consumption at full load, which means by “flooring” the accelerator. Therefore it is only conditionally suitable for clearly indicating the consumption (driving uphill, accelerating, high load at power take-off drive). In leaflets often the rated power and the maximum power output as well as the minimal specific fuel consumption are indicated.
23
Figure 14: Correlation of torque – power output – fuel consumption – specific fuel consumption and rotational speed
Motor characteristics -Full load curve
Data in brochures mostly refer to the minimal specific consumption!Informative value is limited!
840g/lkW*g/kWhl/h=
Rated power at rated engine speed
Max. torque
Minimal specific consumption
Torque rise
Engine speed (1/min)
Engine speed (1/min)
Engi
ne p
ower
(kW
h)Sp
ecifi
cfu
elco
nsum
ptio
n(g
/kW
h)
Fuel
con
sum
ptio
n(l/
h)Eq
uiva
lent
torq
ue(N
m)
Torque rise = Maximum torque – rated torque (%)rated torque

24
3.2 Engine selection
Data according to fuel consumption shown in brochures and leaflets mostly refer to best values in characteristics that are valuable only for one specific operating point of an engine. Beside that there exist different measuring methods for developing characteristic curves of an engine which can differ in a significant way among themselves (see page 25). Often the measurement method is not even mentioned in some statements.
Figure 15: Minimal specific fuel consumption
Selecting the motor –specific fuel consumption
Data in brochures mostly refer to minimal specific consumption.
Minimal specific consumption 190 – 250 g/kWh according to ECE R24
Take care of different measurement methods which may lead to different results!
Informative value about minimal specific consumption is limited!
DIN 70020 - SAE J1995 - ISO TR 14396 – ECE R120-97/68/EG - 2000/25/EG - 2005/13/EG – 80/1269 EWG -
ECE R24 - OECD Code 2
25
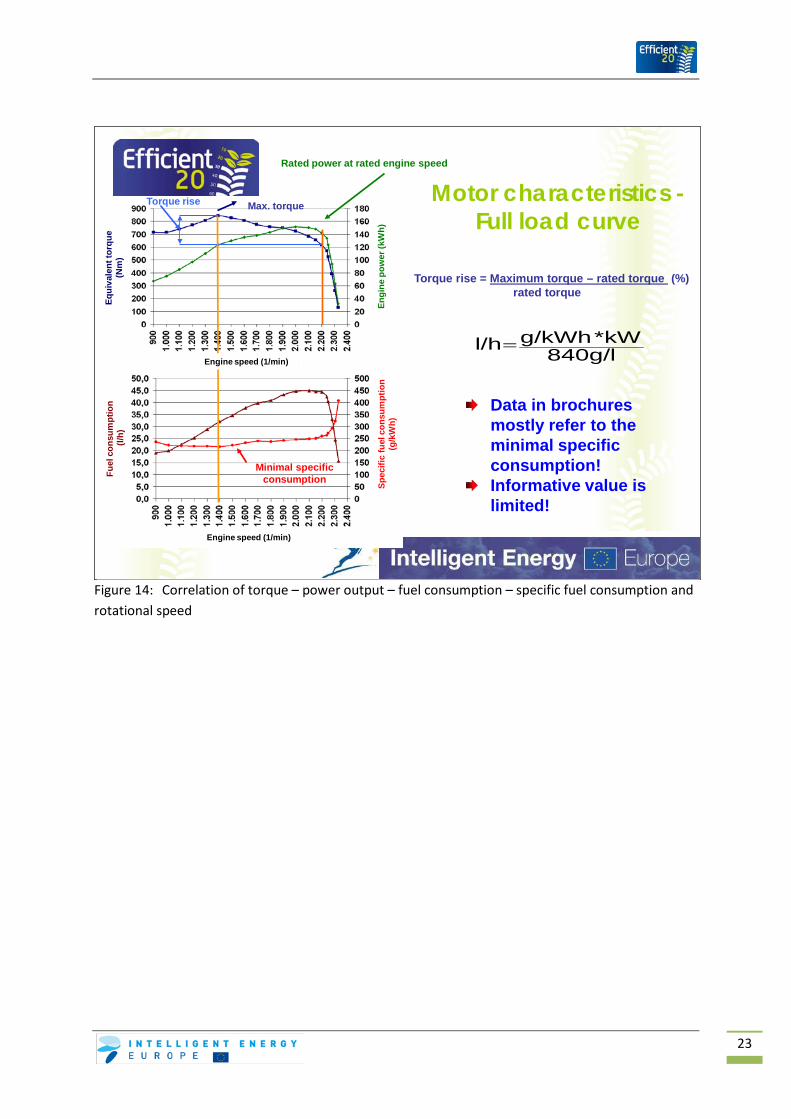
Power measurements on the flywheel of an engine (SAE J1995, ISO TR 14396, 97/68/EC, ECE R24, 80/1296 EEC) and the according fuel consumptions diverge more compared to the practical values measured on the power take-off. The measurements according to OECD Code 2 are directly collected on the power take-off and therefore also include gear friction losses. In addition part-load measurements are made which is of high practical relevance because tractors are mostly operated within the part-load operational range. The fuel consumption determined in this case is explicitly higher than the minimal specific fuel consumption data represented in official brochures. Executive summaries of OECD test reports are available on http://www2.oecd.org/agr-coddb/index_en.asp .
Figure 16: Minimal specific fuel consumption
Selecting the motor –Specific fuel consumption –
Measurement according to OECD Code 2
• Measurement at power take-off• Measurement also in part-load operation range more
practical value• Average value of 6 measuring points: 260 und 410 g/kWh.• Summary report available at:
http://www2.oecd.org/agr-coddb/index_en.asp

26
Figure 17 demonstrates the low informative value of conventional data in brochures. Both tractors seem to be quite equivalent according to the specifications of rated power and the minimum specific fuel consumption. However, Tractor I shows - when operating with the standard speed of the 540-power take-off - more power (+9%) and a lower specific consumption (-11%) than Tractor II. Besides Tractor I have definitely more power in the whole constant power range than Tractor II. But the increased output has no significant influence on the fuel consumption because the specific consumption in this very important speed range has declined by ca. 11%. This difference is only observable when knowing the engine characteristics. Therefore merely indicating the nominal output and the minimal specific fuel consumption are not enough details for profoundly assessing the engine.
Figure 17: Comparison of motor characteristics of two tractors with identical nominal output
Comparison of motor characteristics of two tractors
0102030405060708090
100110120
900
1.00
0
1.10
0
1.20
0
1.30
0
1.40
0
1.50
0
1.60
0
1.70
0
1.80
0
1.90
0
2.00
0
2.10
0
2.20
0
2.30
0
2.40
0
Speed [1/min]
Engi
ne p
ower
[kW
]
0100200300400500600700800900100011001200
Spec
ific
fuel
cons
umpt
ion
[g/k
Wh]
Engine power Tractor I Engine power Tractor IISpecific consumption Tractor I Specific consumption Tractor II
Nominal output 100 kW
Min. specific consumption
Identical rated power and minimal specific consumption, but different power output and specific consumption over the total load range.
Standard power take-off 540 1/min+ 9 % Tractor I
- 11 % Tractor I
27
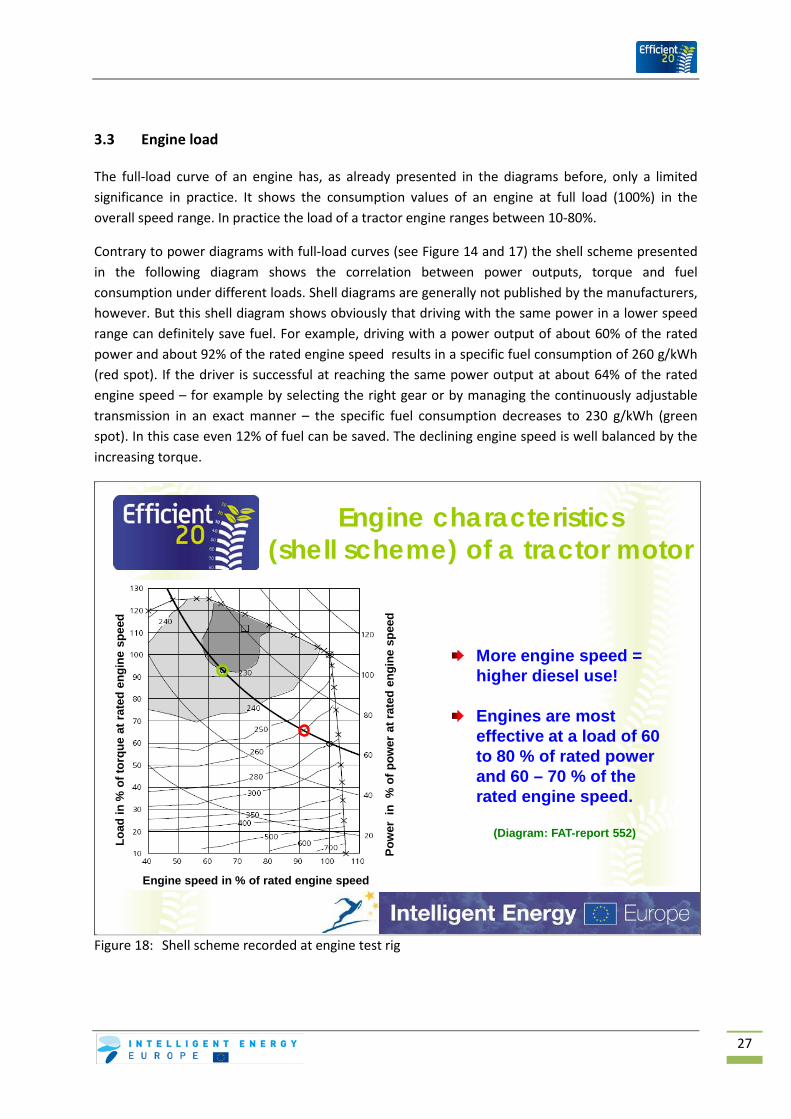
3.3 Engine load
The full-load curve of an engine has, as already presented in the diagrams before, only a limited significance in practice. It shows the consumption values of an engine at full load (100%) in the overall speed range. In practice the load of a tractor engine ranges between 10-80%.
Contrary to power diagrams with full-load curves (see Figure 14 and 17) the shell scheme presented in the following diagram shows the correlation between power outputs, torque and fuel consumption under different loads. Shell diagrams are generally not published by the manufacturers, however. But this shell diagram shows obviously that driving with the same power in a lower speed range can definitely save fuel. For example, driving with a power output of about 60% of the rated power and about 92% of the rated engine speed results in a specific fuel consumption of 260 g/kWh (red spot). If the driver is successful at reaching the same power output at about 64% of the rated engine speed – for example by selecting the right gear or by managing the continuously adjustable transmission in an exact manner – the specific fuel consumption decreases to 230 g/kWh (green spot). In this case even 12% of fuel can be saved. The declining engine speed is well balanced by the increasing torque.
Figure 18: Shell scheme recorded at engine test rig
Engine characteristics (shell scheme) of a tractor motor
More engine speed = higher diesel use!
Engines are most effective at a load of 60 to 80 % of rated power and 60 – 70 % of the rated engine speed.
Engine speed in % of rated engine speed
Load
in %
of t
orqu
eat
rate
den
gine
spee
d
Pow
er i
n %
of p
ower
at r
ated
engi
nesp
eed
(Diagram: FAT-report 552)
28
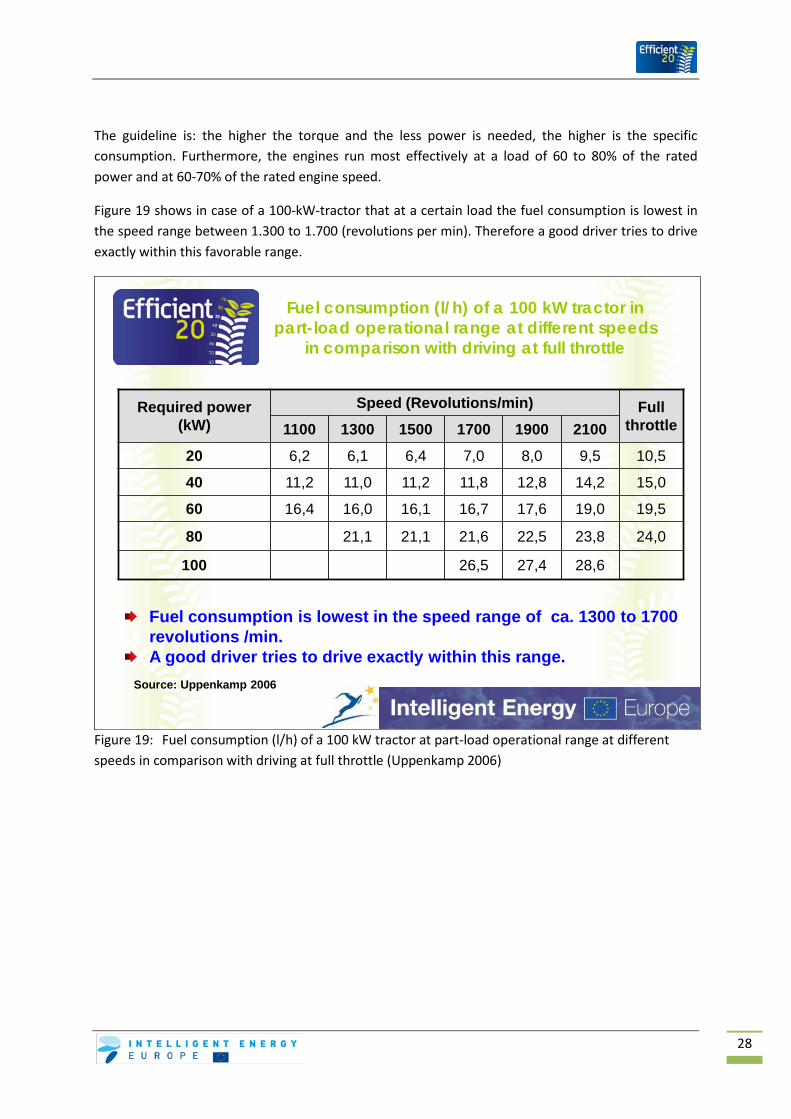
The guideline is: the higher the torque and the less power is needed, the higher is the specific consumption. Furthermore, the engines run most effectively at a load of 60 to 80% of the rated power and at 60-70% of the rated engine speed.
Figure 19 shows in case of a 100-kW-tractor that at a certain load the fuel consumption is lowest in the speed range between 1.300 to 1.700 (revolutions per min). Therefore a good driver tries to drive exactly within this favorable range.
Figure 19: Fuel consumption (l/h) of a 100 kW tractor at part-load operational range at different speeds in comparison with driving at full throttle (Uppenkamp 2006)
Fuel consumption (l/h) of a 100 kW tractor in part-load operational range at different speeds
in comparison with driving at full throttle
Required power (kW)
Speed (Revolutions/min) Fullthrottle1100 1300 1500 1700 1900 2100
20 6,2 6,1 6,4 7,0 8,0 9,5 10,5
40 11,2 11,0 11,2 11,8 12,8 14,2 15,0
60 16,4 16,0 16,1 16,7 17,6 19,0 19,5
80 21,1 21,1 21,6 22,5 23,8 24,0
100 26,5 27,4 28,6
Fuel consumption is lowest in the speed range of ca. 1300 to 1700 revolutions /min.A good driver tries to drive exactly within this range.
Source: Uppenkamp 2006

29
3.4 Engines in constant power range and overloading
By employing turbochargers and electronically controlled injection pumps modern engines have a constant power range of more than 20%. Within this speed range the rated power or more (power bulge) is available (see Figure 20). A tractor with overloading is capable of reaching the rated power also with a lower engine speed; therefore the driver is able to drive frequently in a range of lower fuel consumption. This is often necessary for transporting or for power take-off works provided that the tractor is equipped with a continuously adjustable transmission, an economy drive and an economizing power take-off (Uppenkamp 2006).
Figure 20: Full-load curve of an engine with / without constant power at identical rated power
Comparison of engine characteristics of two tractors
A large range of constant power facilitates fuel-saving driving.
0102030405060708090
100110120
1.000 1.200 1.400 1.600 1.800 2.000 2.200 2.400Engine speed [revolutions/min]
Rat
ed p
ower
[kW
]
Tractor ITractor II
Range of constant performance
Power bulge
Rated power 100 kW
30
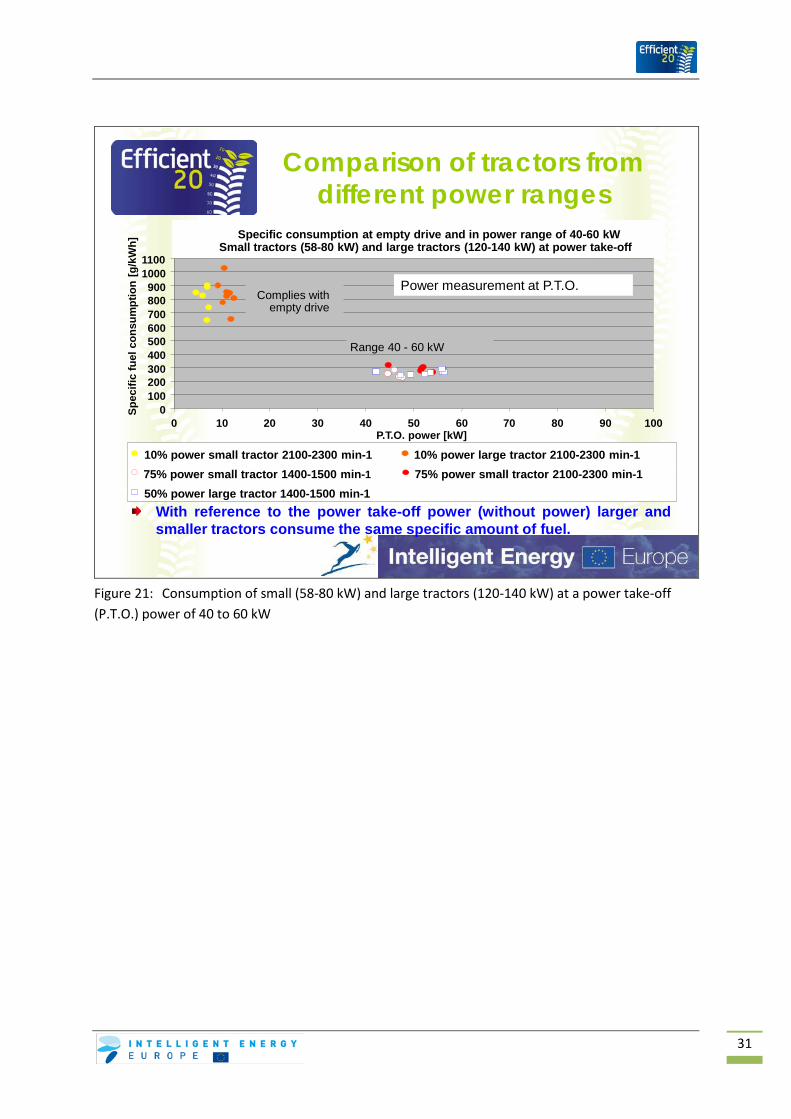
3.5 Comparison of tractors in different power ranges
In a fleet test with plant oil driven tractors, performed at the LFZ Francisco Josephinum in Austria, 38 diesel-driven tractors have been tested with regard to their power take-off and consumption according to the 8-point test cycle of ISO 8178. At this test the tractors are measured under full load but also under part load operation. To make practice-oriented statements based on the measuring data, the tractors have been divided into different power classes (58-80 kW and 120-140 kW) and then tested at 10%, 50% and 75% power at rated engine speed as well as at 50% and 75% power at reduced speed. Then the consumption data have been analyzed.
Considered that – if the power output is lowered to 75% - the engine speed is reduced from the rated speed (ca. 2.300 rev. /min) to reduced speed (ca. 1.500 rev. /min), the specified fuel consumption can also be reduced by 15-19%. In case of a power output of only 50% the specific fuel consumption will be lowered by 20-25%, if the rated speed is reduced to a speed of 1.400-1.500 revolutions/min.
If the tractor is driven only within the part-load range at ca. 10% of the rated power (quasi an empty ride), the specific fuel consumption rises dramatically. That is one of the reasons why unneeded empty rides under part-load operation should be avoided.
Does a small tractor need more fuel for a specific power output than a large tractor?
Figure 21 demonstrates the specific fuel consumption of tractors with a lower power output (58-80 kW) compared to tractors with a high output (120-140 kW) with a power take-off power of 40-60 kW. In both power ranges the specific consumption was nearly the same with reduced engine speed. Only for smaller tractors the consumption is higher at rated speed. If the tractors are driven merely with 10% of their performance, the fuel consumption is almost identical in both power classes. These measurements refer only to the P.T.O. drive. The specific fuel consumption directly on the road will of course be higher for larger tractors due to their own weight and their larger tyres (higher rolling resistance) than for smaller tractors.
31
Comparison of tractors from different power ranges
0100200300400500600700800900
10001100
0 10 20 30 40 50 60 70 80 90 100P.T.O. power [kW]
Spec
ific
fuel
con
sum
ptio
n [g
/kW
h]
10% power small tractor 2100-2300 min-1 10% power large tractor 2100-2300 min-175% power small tractor 1400-1500 min-1 75% power small tractor 2100-2300 min-150% power large tractor 1400-1500 min-1
Specific consumption at empty drive and in power range of 40-60 kWSmall tractors (58-80 kW) and large tractors (120-140 kW) at power take-off
Complies with empty drive
Range 40 - 60 kW
Power measurement at P.T.O.
With reference to the power take-off power (without power) larger andsmaller tractors consume the same specific amount of fuel.
Figure 21: Consumption of small (58-80 kW) and large tractors (120-140 kW) at a power take-off (P.T.O.) power of 40 to 60 kW
32
3.6 Use of hand throttle
For longer works in the field, when engine speed and driving speed should be constant, driving with the hand throttle is more favorable. For this reason speed fluctuations can be avoided and no fuel is wasted. Modern tractors are also equipped with an “electronic” hand throttle; thereby more engine speeds can be recorded and recalled by pushing a bottom (Uppenkamp 2006).
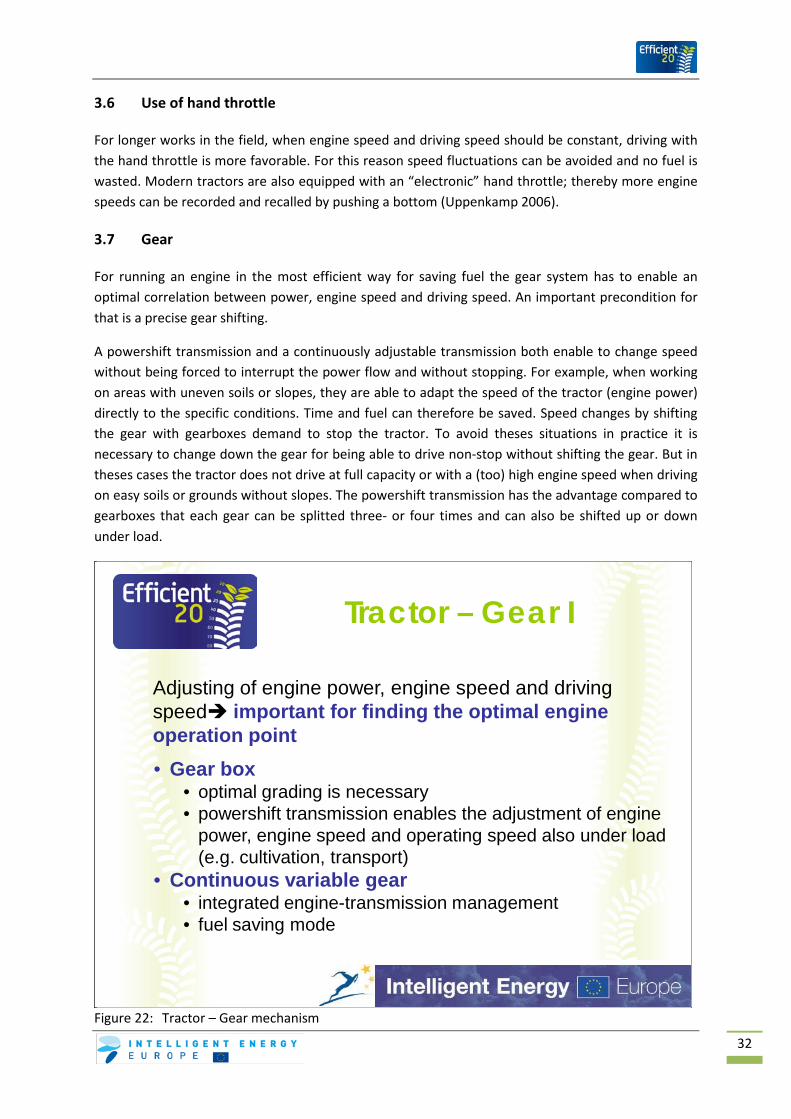
3.7 Gear
For running an engine in the most efficient way for saving fuel the gear system has to enable an optimal correlation between power, engine speed and driving speed. An important precondition for that is a precise gear shifting.
A powershift transmission and a continuously adjustable transmission both enable to change speed without being forced to interrupt the power flow and without stopping. For example, when working on areas with uneven soils or slopes, they are able to adapt the speed of the tractor (engine power) directly to the specific conditions. Time and fuel can therefore be saved. Speed changes by shifting the gear with gearboxes demand to stop the tractor. To avoid theses situations in practice it is necessary to change down the gear for being able to drive non-stop without shifting the gear. But in theses cases the tractor does not drive at full capacity or with a (too) high engine speed when driving on easy soils or grounds without slopes. The powershift transmission has the advantage compared to gearboxes that each gear can be splitted three- or four times and can also be shifted up or down under load.
Figure 22: Tractor – Gear mechanism
Tractor – Gear I
Adjusting of engine power, engine speed and driving speed important for finding the optimal engine operation point• Gear box
• optimal grading is necessary• powershift transmission enables the adjustment of engine
power, engine speed and operating speed also under load (e.g. cultivation, transport)
• Continuous variable gear• integrated engine-transmission management• fuel saving mode

33
The best method for being able to adapt to changing load conditions are continuously adjustable transmission systems. By continuously adjusting the speed with the throttle the driving speed can be adapted to the specific operating requirements. For this reason the engine can always run within the optimal load range. Some of the continuously adjustable gear systems allow to reduce the engine speed considerably when driving on the road with maximum speed and can therefore save fuel. An integrated engine- and gear management allows keeping the engine always within the constant power range at each work. For this reason also fuel is saved and the driver is relieved of some burden. A powershift transmission or continuously adjustable gear system is today part of the standard equipment of any modern powerful tractor.
Figure 23: Fuel savings potential when driving at reduced engine speed
Figure 23 shows the potential for saving fuel when driving at reduced engine speed (80% of rated engine speed) and by using a motor-gear-system with automatic speed adjustment (continuously variable gear) in relation to driving at full throttle (Uppenkamp 2006). It can clearly be seen that the best saving effect can be achieved at lower load. Then the differences between driving at 80% of the rated engine speed and driving with a motor-gear-management disappear when the load is increasing.
Tractor – Gear II
Diesel-saving potential [%] when driving at reduced engine speed and by using an engine-transmission management with automatic engine speed adjustment compared to driving at full throttle
Load [%]
20 40 60 80
80 % of rated engine speed 31,4 15,7 11,2 7,7
Engine-transmission management 45,5 24,3 14,5 8,1
Source: Uppenkamp 2006
34
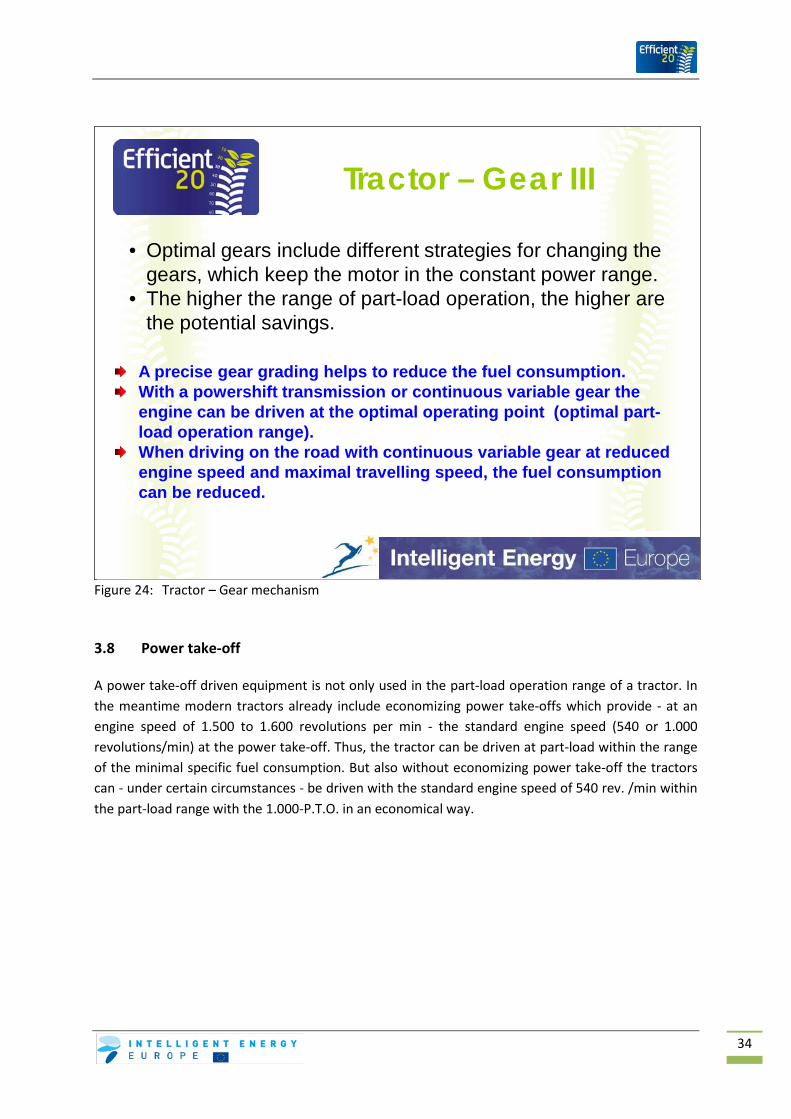
Figure 24: Tractor – Gear mechanism
3.8 Power take-off
A power take-off driven equipment is not only used in the part-load operation range of a tractor. In the meantime modern tractors already include economizing power take-offs which provide - at an engine speed of 1.500 to 1.600 revolutions per min - the standard engine speed (540 or 1.000 revolutions/min) at the power take-off. Thus, the tractor can be driven at part-load within the range of the minimal specific fuel consumption. But also without economizing power take-off the tractors can - under certain circumstances - be driven with the standard engine speed of 540 rev. /min within the part-load range with the 1.000-P.T.O. in an economical way.
Tractor – Gear III
• Optimal gears include different strategies for changing the gears, which keep the motor in the constant power range.
• The higher the range of part-load operation, the higher are the potential savings.
A precise gear grading helps to reduce the fuel consumption.With a powershift transmission or continuous variable gear the engine can be driven at the optimal operating point (optimal part-load operation range).When driving on the road with continuous variable gear at reduced engine speed and maximal travelling speed, the fuel consumption can be reduced.

35
Figure 25: Fuel savings potential in % when using the economizing power take-off or the 1000 P.T.O. depending on engine load in comparison with (use of) 540 standard P.T.O. (Uppenkamp 2006)
Standard power take-off and economizing power take-off
Diesel-saving potential in % when using the economizing power take-off or the 1000-P.T.O. depending on engine load in comparison with the 540-standard P.T.O.
Load [%]20 40 60 80
Economizing P.T.O. (750 rev./min)
18,8 11,8 7,6 3,5
Standard P.T.O.(1000 rev./min) 29,4 16,9 2,2
In part-load range it is favourable to use the economizing P.T.O.! Source: Uppenkamp 2006
36
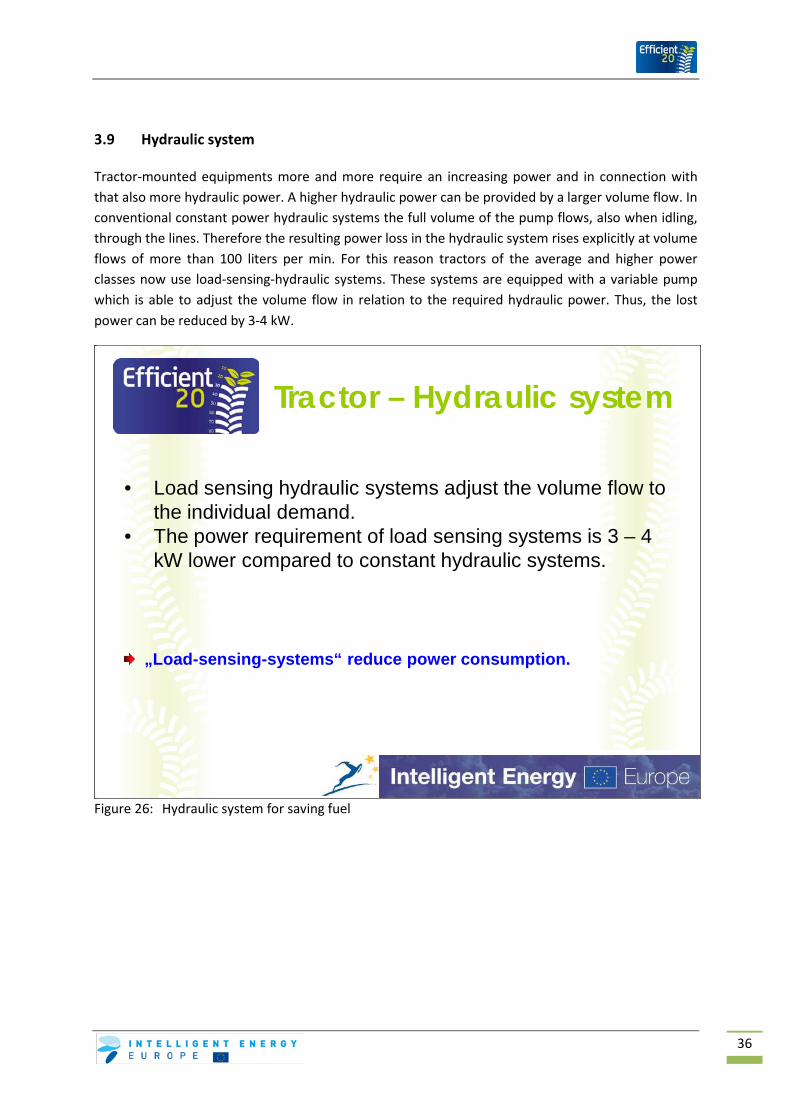
3.9 Hydraulic system
Tractor-mounted equipments more and more require an increasing power and in connection with that also more hydraulic power. A higher hydraulic power can be provided by a larger volume flow. In conventional constant power hydraulic systems the full volume of the pump flows, also when idling, through the lines. Therefore the resulting power loss in the hydraulic system rises explicitly at volume flows of more than 100 liters per min. For this reason tractors of the average and higher power classes now use load-sensing-hydraulic systems. These systems are equipped with a variable pump which is able to adjust the volume flow in relation to the required hydraulic power. Thus, the lost power can be reduced by 3-4 kW.
Figure 26: Hydraulic system for saving fuel
Tractor – Hydraulic system
• Load sensing hydraulic systems adjust the volume flow to the individual demand.
• The power requirement of load sensing systems is 3 – 4 kW lower compared to constant hydraulic systems.
„Load-sensing-systems“ reduce power consumption.

37
3.10 Undercarriage, tyre pressure
The (under-)carriage connects the tractor with the ground and is a decisive factor for a cost-efficient working process. An important factor is a high efficiency in higher load and speed ranges beside a high driving comfort. The traction efficiency - or rolling resistance - is significantly influenced by the tyre pressure.
The road resistance is produced from the rolling motion of the vehicle and is countervailing to the driving force of the vehicle. It is defined by:
the rolling friction between tyres and road surface,
the deformation of the tyres (tumbling), and
the friction in the wheel loader.
The rolling resistance also depends on:
speed
weight of the vehicle
construction of the tyres
pattern of the tyres
tyre pressure
adjusting of the track, and the
ground condition or road surface.
Radial tyres of tractors have, in contrast to diagonal tyres, softer flanks. Thus, the footprint of the tyres is longer which leads to a reduced soil pressure and less slipping. Especially the latter helps to save fuel. For the same reasons the tyres should be preferably big and wide.
When driving on the street the tyre pressure should be quite high to minimize the rolling resistance on road. Contrary to that the tyre pressure has to be as low as possible when working in the field. This helps to reduce the soil pressure and slipping by enlarging the footprint. All in all, it depends on the speed which tyre pressure is required for a specific wheel load (supporting capacity) and can be seen in diagrams as well as tables in appropriate catalogues.
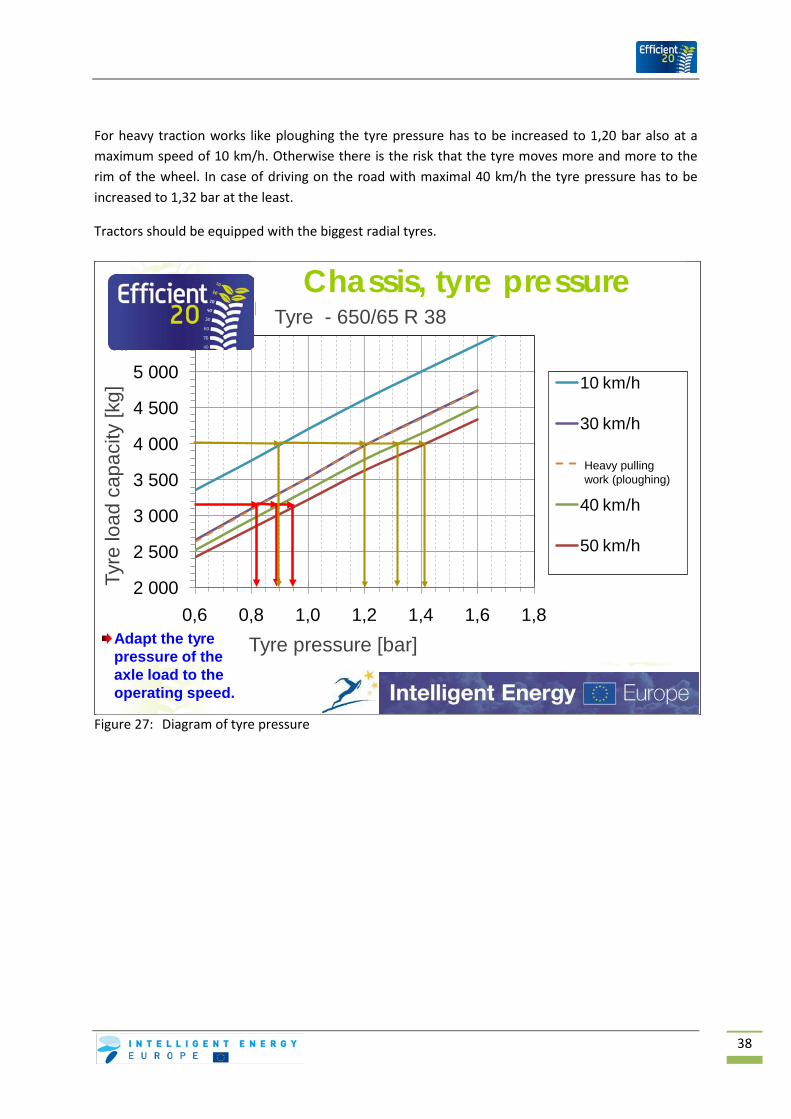
Figure 27 demonstrates that for a work, that requires no big traction (e.g. working with the rotary harrow) and a supporting capacity of 4 000 kg, at a speed of maximal 10 km/h, a tyre pressure of about 0,90 bar is necessary.
38
For heavy traction works like ploughing the tyre pressure has to be increased to 1,20 bar also at a maximum speed of 10 km/h. Otherwise there is the risk that the tyre moves more and more to the rim of the wheel. In case of driving on the road with maximal 40 km/h the tyre pressure has to be increased to 1,32 bar at the least.
Tractors should be equipped with the biggest radial tyres.
Figure 27: Diagram of tyre pressure
2.000
2.500
3.000
3.500
4.000
4.500
5.000
5.500
0,6 0,8 1,0 1,2 1,4 1,6 1,8
Trag
fähi
gkei
t pro
Rei
fen
[kg]
Reifendruck [bar]
Reifenkennlinien - 650/65 R 38
10 km/h
30 km/h
Feldarbeit hohes Drehmoment
40 km/h
50 km/h
Adapt the tyre pressure of the axle load to the operating speed.
Chassis, tyre pressure
Tyre
load
cap
acity
[kg]
Heavy pulling work (ploughing)
Tyre pressure [bar]
Tyre - 650/65 R 38

39
Measurements at the Advanced Technical College Südwestfalen in Soest have shown how the fuel consumption as well as the demand for traction can be influenced by reducing the tyre pressure (Volk 2006). When reducing the tyre pressure from 1,6 bar to 1,0 bar, the slip during grubbing decreased from 18% to 10%, also when ploughing from 25% to 15%. For this reason about 9% of fuel could be saved during grubbing and 12% during ploughing (Figure 28). Furthermore lower wheel pressures lead to a lower track depth of the tractor in the field. Thereby, the working depth and the corresponding fuel consumption can be reduced for the subsequent tilling equipment, like seedbed combinations or rotary harrows.
Figure 28: Fuel consumption with changed tyre pressure
Tyre pressure - tractor
Lowest tyre pressure in the field• Low soil pressure, little track depth• Traction increases and slip decreases at constant traction force• Little track depth in the field lower working depth of following soil
tillage machine is necessary
Example FH Soest- Grubbing
Tyre pressure Slip1,6 bar 18 %1,0 bar 10 % - 9 % diesel consumption
- PloughingTyre pressure Slip1,6 bar 25 %1,0 bar 15 % - 12 % diesel consumption
Use the lowest tyre pressure as possible in the field.Source: Volk 2006

40
Figure 29 shows the impact of the tyre pressure of a liquid manure tank on the traction demand and the track depth. By lowering the tyre pressure from 4 bar, like it is necessary for driving on the road, to 1 bar, as it is possible for working in the field due to the lower speed, the track depth will be reduced by 47%. This leads also to a reduction of traction by 19%. In addition to a lower traction demand and therefore also a lower fuel consumption, a lower track depth may also reduce the working depth for the possibly following tillage work. Fuel can therefore be saved again.
Furthermore, a lower track depth helps to reduce soil compactions. In this case fuel can be saved at the primary tilling operations.
Tape drives are able to transmit large traction powers in a fuel-saving way with a low slipping even on dry soils. The large contact area reduces the track depth and therefore also the effort for the following tilling operation.
Figure 29: Impact of tyre pressure of a trailer on tractive power demand (Volk 2004)
Tyre pressure - trailerLowest tyre pressure in the field
• Lower soil pressure• Traction demand decreases
Example FH Soest –liquid manure tanker
Tyre pressure Tractive power 4,0 bar 135 kW1,0 bar 110 kW
- 19 %
Track depth at 1 bar: 8 cm Track depth at 4 bar: 15 cm
Source: Volk 2004
41
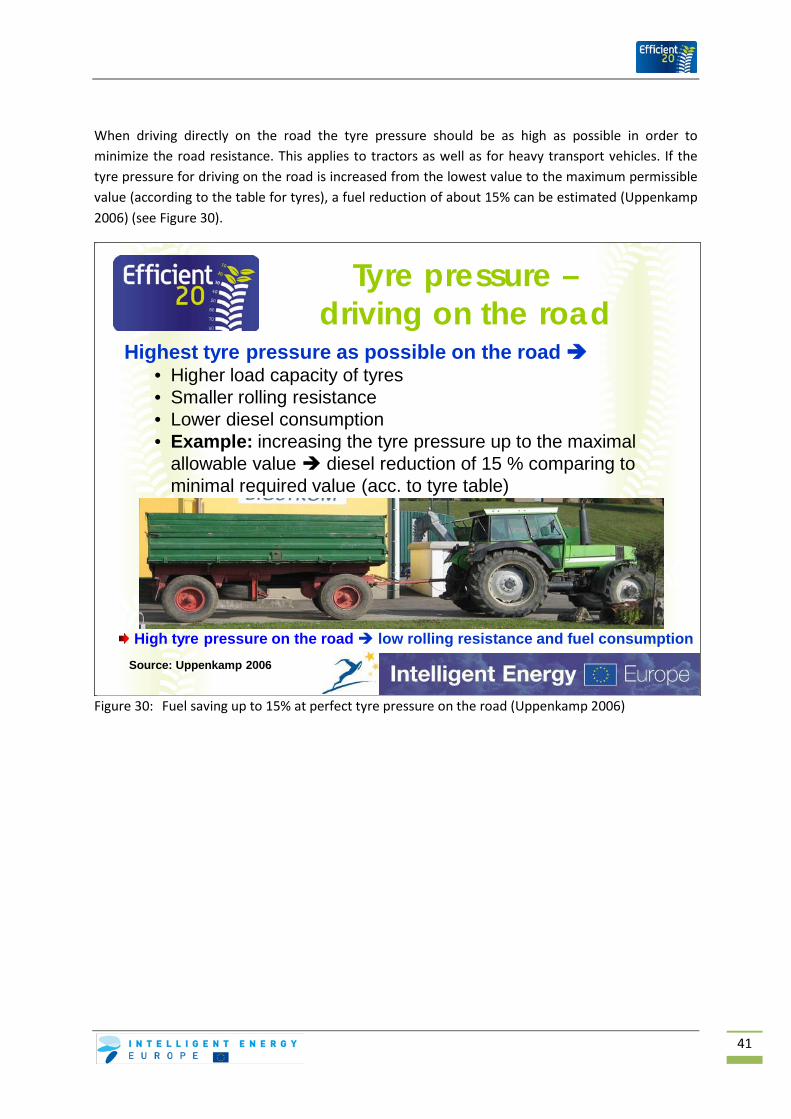
When driving directly on the road the tyre pressure should be as high as possible in order to minimize the road resistance. This applies to tractors as well as for heavy transport vehicles. If the tyre pressure for driving on the road is increased from the lowest value to the maximum permissible value (according to the table for tyres), a fuel reduction of about 15% can be estimated (Uppenkamp 2006) (see Figure 30).
Figure 30: Fuel saving up to 15% at perfect tyre pressure on the road (Uppenkamp 2006)
Tyre pressure –driving on the road
Highest tyre pressure as possible on the road • Higher load capacity of tyres• Smaller rolling resistance• Lower diesel consumption• Example: increasing the tyre pressure up to the maximal
allowable value diesel reduction of 15 % comparing to minimal required value (acc. to tyre table)
High tyre pressure on the road low rolling resistance and fuel consumptionSource: Uppenkamp 2006
42
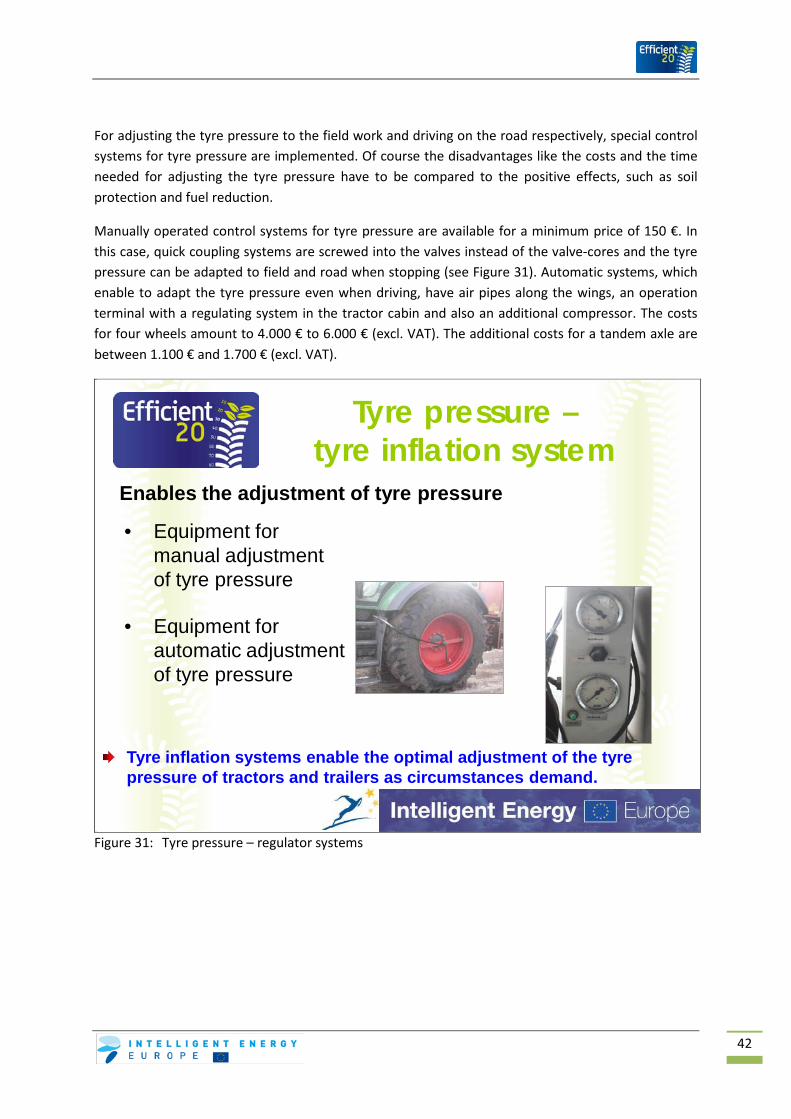
For adjusting the tyre pressure to the field work and driving on the road respectively, special control systems for tyre pressure are implemented. Of course the disadvantages like the costs and the time needed for adjusting the tyre pressure have to be compared to the positive effects, such as soil protection and fuel reduction.
Manually operated control systems for tyre pressure are available for a minimum price of 150 €. In this case, quick coupling systems are screwed into the valves instead of the valve-cores and the tyre pressure can be adapted to field and road when stopping (see Figure 31). Automatic systems, which enable to adapt the tyre pressure even when driving, have air pipes along the wings, an operation terminal with a regulating system in the tractor cabin and also an additional compressor. The costs for four wheels amount to 4.000 € to 6.000 € (excl. VAT). The additional costs for a tandem axle are between 1.100 € and 1.700 € (excl. VAT).
Figure 31: Tyre pressure – regulator systems
Tyre pressure –tyre inflation system
Enables the adjustment of tyre pressure
• Equipment for manual adjustment of tyre pressure
• Equipment for automatic adjustment of tyre pressure
Tyre inflation systems enable the optimal adjustment of the tyre pressure of tractors and trailers as circumstances demand.
43
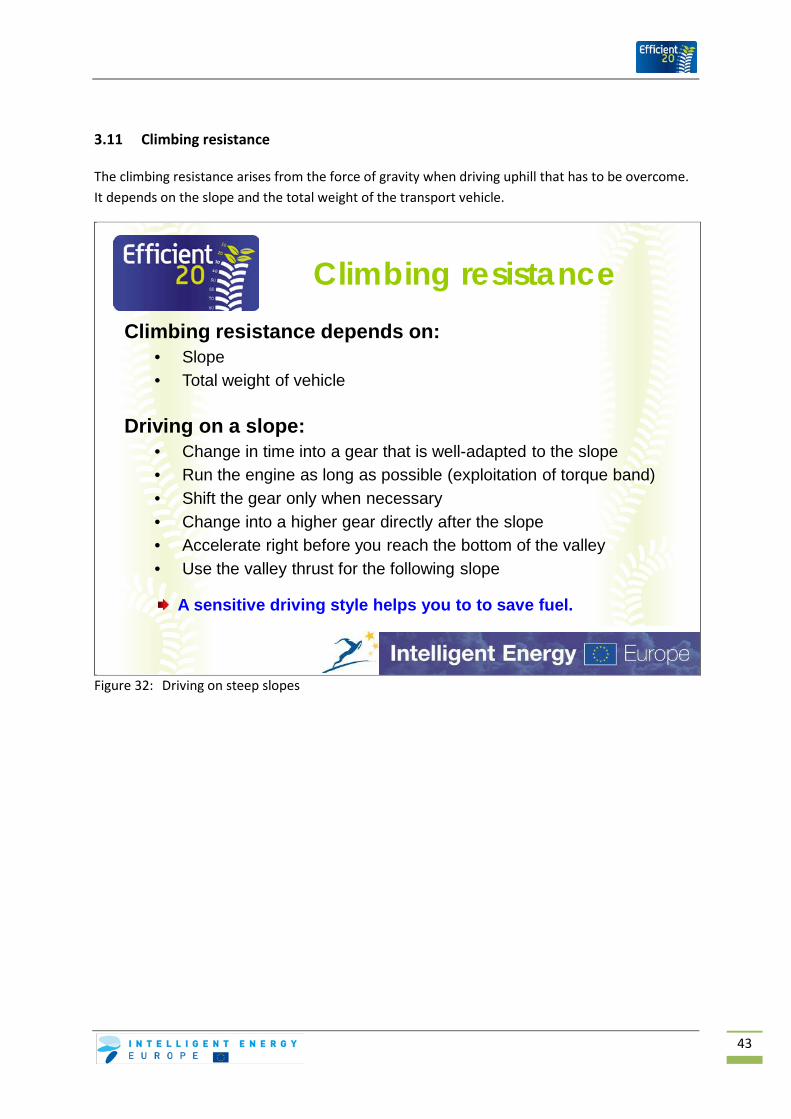
3.11 Climbing resistance
The climbing resistance arises from the force of gravity when driving uphill that has to be overcome. It depends on the slope and the total weight of the transport vehicle.
Figure 32: Driving on steep slopes
Climbing resistanceClimbing resistance depends on:
• Slope• Total weight of vehicle
Driving on a slope: • Change in time into a gear that is well-adapted to the slope• Run the engine as long as possible (exploitation of torque band) • Shift the gear only when necessary• Change into a higher gear directly after the slope• Accelerate right before you reach the bottom of the valley• Use the valley thrust for the following slope
A sensitive driving style helps you to to save fuel.
44
3.12 Ballasting of tractor
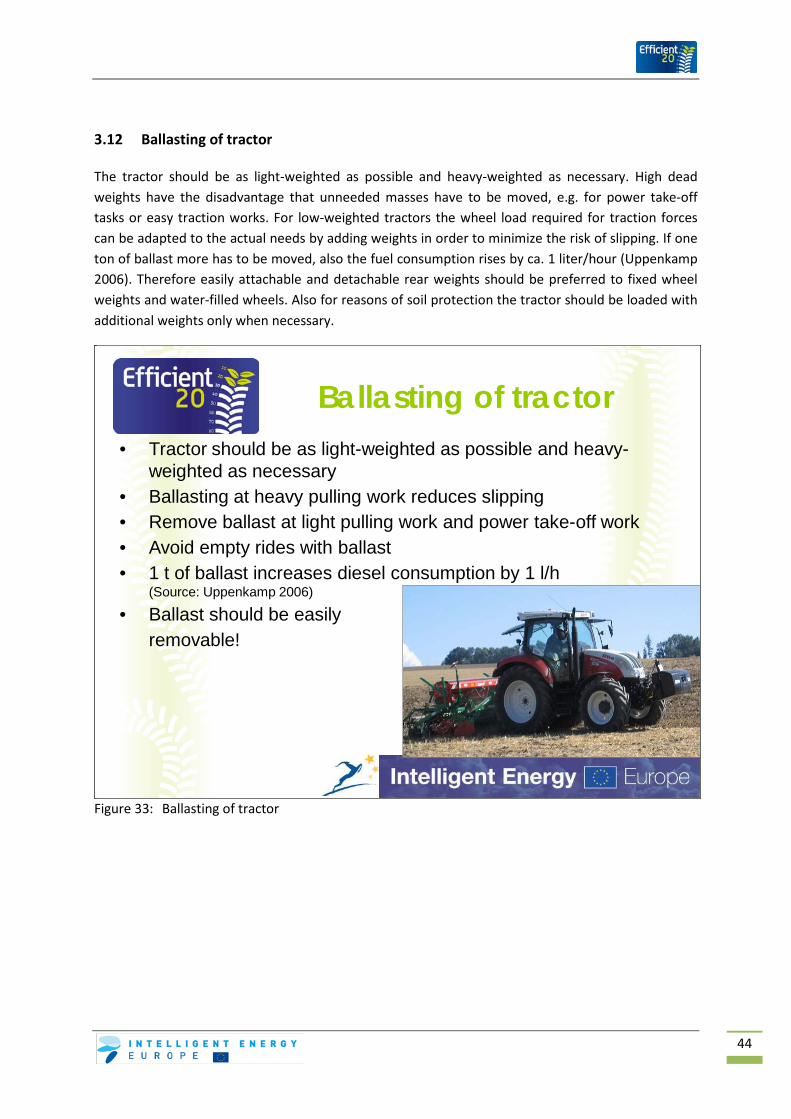
The tractor should be as light-weighted as possible and heavy-weighted as necessary. High dead weights have the disadvantage that unneeded masses have to be moved, e.g. for power take-off tasks or easy traction works. For low-weighted tractors the wheel load required for traction forces can be adapted to the actual needs by adding weights in order to minimize the risk of slipping. If one ton of ballast more has to be moved, also the fuel consumption rises by ca. 1 liter/hour (Uppenkamp 2006). Therefore easily attachable and detachable rear weights should be preferred to fixed wheel weights and water-filled wheels. Also for reasons of soil protection the tractor should be loaded with additional weights only when necessary.
Figure 33: Ballasting of tractor
Ballasting of tractor• Tractor should be as light-weighted as possible and heavy-
weighted as necessary• Ballasting at heavy pulling work reduces slipping• Remove ballast at light pulling work and power take-off work• Avoid empty rides with ballast• 1 t of ballast increases diesel consumption by 1 l/h
(Source: Uppenkamp 2006)
• Ballast should be easilyremovable!
45
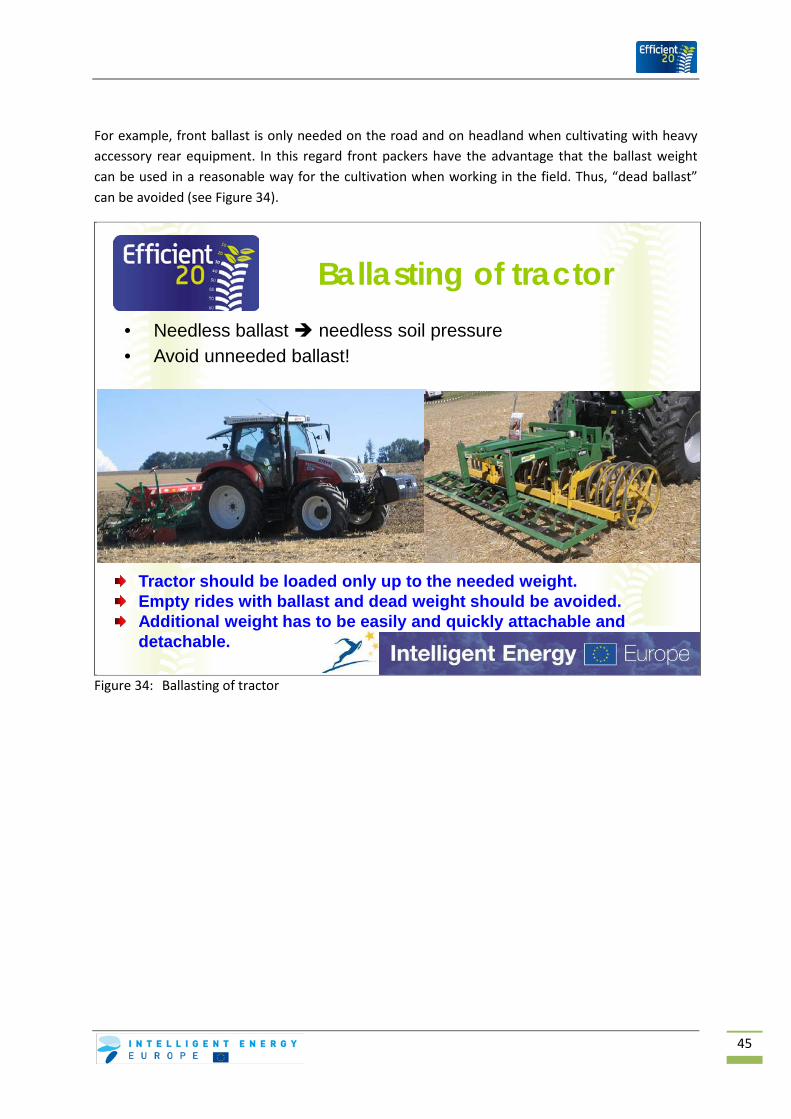
For example, front ballast is only needed on the road and on headland when cultivating with heavy accessory rear equipment. In this regard front packers have the advantage that the ballast weight can be used in a reasonable way for the cultivation when working in the field. Thus, “dead ballast” can be avoided (see Figure 34).
Figure 34: Ballasting of tractor
Ballasting of tractor• Needless ballast needless soil pressure• Avoid unneeded ballast!
Tractor should be loaded only up to the needed weight.Empty rides with ballast and dead weight should be avoided.Additional weight has to be easily and quickly attachable and detachable.

46
3.13 Maintenance of tractor
Only by a careful maintaining it can be assured that the efficiency of transforming energy out of the fuel will be as high as possible. An easy maintenance of the tractor should also be kept in mind when buying a tractor. Difficulties with regard to the maintenance can lead to a relatively low but also too high portion of air in the combustion chamber. The effects of different measures of maintaining are summarized in Figure 35 to 37.
An optimal lubrication of motor and gear system reduces friction losses. Thus, oils have to be controlled and changed at regular intervals.
Figure 35: Maintenance measures and their effect
Maintenance of tractor„Maintenance“ is an important precondition for the
optimal transformation of fuel energy into kinetic energy. Lack of maintenance not enough air in fuel-air-mixture recognizable by burnt air and loss of power
Reasons may be:• polluted air filter• leaky charge air pipe• too high injection amount• incorrect valve clearance

47
Figure 36: Preserving the engine power by maintaining
Figure 37: Performing of maintenance measures
Maintenance of tractor
Lack of maintenance too much air in fuel-air-mixture deterioration of efficiency
Reasons may be:• polluted fuel filter• too low injection amount• defect feed pump• leaky fuel pipes • failure of engine control system
The best way to keep up the engine power is a careful maintenance.Fuel energy can then be transformed most efficiently.
Maintenance of tractorFollowing measures of maintenance have to be taken:• Clean the oil cooler and air filter• Exchange polluted fuel filter• Repair leaky fuel pipes• Check valve clearances• Check fuel injection valves and injection pump• Oils have to be checked and changed at regular intervals!
By optimally lubricating motor and gear the friction losses can be reduced.
Savings potential by optimal maintenance: 5 – 10 %.

48
Self-cleaning systems can considerably reduce the efforts for maintaining. This can be achieved by pre-filters or by cooling ventilators with adjustable wings (for reversing the flow), which are able to change the flow direction and clean the cooling system. Axial wheels are equipped with a reversing mechanism which is able to adjust the wings mechanically by pushing a button (automatic thermal adjustment), so that the air flows into the opposite direction. Therefore dirt can directly be blown out of the cooler.
Figure 38: Paying attention to easy maintainability
Maintenance of tractor• Pay attention to an easy maintenance when buying a
tractor! • Examples:
• Accessibility of cooling systems• Example: Ventilator with adjustable wings
• Reversal of ventilation direction (dirt can be blown out of the cooler)
• Adjustment of power consumption by automatically shifting the wings depending on the cooler temperature
Changing ventilator for cleaning the cooler system (sucking - switching - blowing) [Source: „Cleanfix“ Fa. Hägele GmbH]
49
3.14 Conclusion
Evaluation of tractor motors
Data in brochures mostly refer to the minimal specific consumption (informative value is therefore limited).
Different measurement methods for evaluating tractor characteristics lead to different results (DIN, SAE, ISO, ECE).
Measurements according to OECD Code 2 have more practical relevance.
Motor characteristics – full load curves
Motors are determined by their characteristic curves.
Despite of an identical rated power two tractors can have different outputs and specific consumption curves over the total range.
A large constant power range facilitates fuel-saving driving.
Fuel consumption is on the lowest level at the speed of ca. 1.300 to 1.700 revolutions/min.
A good driver tries to drive exactly within this range.
Modern tractors with power bulge reach the rated power output even with a low engine speed. This enforces a fuel-saving driving style.
The specific consumption of small and large tractors at P.T.O. is identical (at empty drive).
The higher the engine speed, the more diesel has to be used.
Gear
A precise gear grading helps to reduce the fuel consumption.
With a powershift transmission or a continuously adjustable transmission the engine can always be driven at the optimal operating point.
The higher the range of part-load operation, the higher is the saving effect.
When driving on the road with the maximal driving speed and reduced engine speed and a continuously adjustable transmission, the fuel consumption can be reduced (not possible for all gears).
50
Power take-off
Under part-load operation it is favorable to use the economizing P.T.O.
Hydraulic system
Load-Sensing-Systems reduce the consumption of fuel.
Undercarriage, tyre pressure
Adapt the tyre pressure of the axle load to the operating speed.
In the field low tyre pressure
On the street high tyre pressure
When the tyre pressure in the field is reduced, the tractive power demand and track depth can be decreased.
High tyre pressure on the street low road resistance and fuel consumption
Regulator systems for the tyre pressure for tractor and trailer help to adapt the pressure as circumstances demand.
Driving on slopes
Change in time into a gear that is well-adapted to the slope.
Run the engine as long as possible (exploitation of torque band).
Shift the gear only when necessary.
Change into a higher gear directly after the slope.
Accelerate right before reaching the bottom of the valley.
Use the valley thrust for the following slope.
Ballasting of tractor
The tractor should be ballasted only up to the needed weight.
Avoid empty rides with ballast and dead freight.

51
Additional weight should be easily and quickly attachable and detachable.
1 ton of ballast increases diesel consumption by 1 liter/h.
Maintenance of tractor
„Maintenance“ is an important precondition for the optimal transformation of fuel energy into kinetic energy.
With an unfavorable maintenance there may not be enough air in the fuel-air-mixture (recognizable by burnt air and loss of power).
The best way to keep up the engine power is a preventive maintenance.
Savings effect by optimal maintenance: 5 – 10 %
By optimally lubricating the motor and the gear, friction losses can be reduced.
Pay attention to an easy maintenance when buying a tractor (accessibility of cooling system, ventilator with adjustable wings – reversal of ventilation direction)!

52
4. Impact of farm structure
4.1 Plot size
The bigger the plot, the shorter is the time needed for turnings in the field and the transfer between different fields. In this way fuel can also be saved.
In the figure below the effects of different plot sizes on fuel consumption are illustrated in case of a model farm with 20 ha silage maize, 10 ha rape, 60 ha winter grain and 10 ha fallow land. The biggest saving effect can be achieved if the plot size is enlarged from 1 ha to 2 ha and 5 ha respectively. Then a saving effect of 9% and 15% is possible. Furthermore it is even more positive if the plot size is enlarged for works which need less power (e.g. plant protection). If the plot is increased from 1 ha to 2 ha, the fuel consumption will be reduced to 77%. For works with a high power requirement (e.g. ploughing) it can be lowered only to 94%.
A classical method to enlarge the plot size is the officially authorized “re-plotting” of land. Besides there are different possibilities like a voluntary exchanging of plots, the additional lease of neighbour areas and virtual reallocation.
Figure 39: Impact of plot size on fuel consumption (Fröba as cited in Uppenkamp 2006)
Impact of plot size onfuel consumption
Fuel consumption during working Plot size
1 ha 2 ha 5 ha 10 ha 20 ha
High power requirement 100 % 94 % 90 % 89 % 88 %
Low power requirement 100 % 77 % 64 % 58 % 55 %
Example of a farm 100 % 91 % 85 % 82 % 81 %
The bigger the plots, the shorter the turning times.
Plot re-allocation, change of plots, additional lease of neighbour plots.
The best economical effect can be achieved with a plot size up to 5 ha.
Source: Fröba as cited in Uppenkamp 2006
Example of a farm: 20 ha silage maize (crop), 10 ha rape, 60 ha winter grain, 10 ha fallow land

53
4.2 Plot form
The impact of the plot form on the fuel consumption is shown in Figure 40. The optimal plot form is definitely the rectangle. The larger and continuous the plot form is, the less turning time will be needed. If the plot size is expanded, the positive effect of the plot form is decreasing.
Figure 40: Impact of plot form on fuel consumption (Bernhardt as cited in Uppenkamp 2006)
Impact of plot form on fuel consumption
Regular shape of the plots reduce turning time and fuel consumption.
The optimal plot form is the rectangle.
Plot form (rectangle = 100%) Plot size
1 ha 2 ha 5 ha 10 ha 20 ha
Square +18 % +16 % +12 % +9 % +7 %
Equal-sided triangle +15 % +14 % +13 % +10 % +8 %
Acute-sided triangle +24 % +23 % +19 % +16 % +13 %
Source: Bernhardt as cited in Uppenkamp 2006

54
4.3 Distances of plots
The larger the haul distances between the single fields and between farm and fields, the more fuel has to be consumed for transporting the goods.
For the transport of bulk goods a fuel consumption of 0,09 liters per ton and kilometer has to be expected (ÖKL 2008). Therefore, when transporting masses of 10 tons on a distance of 5 km between initial and end point of transport, about 4,5 liters of diesel are consumed (see Figure 41). This value also includes the fuel consumption for the empty ride back (5 km).
Figure 41: Diesel consumption when transporting bulk goods
Changing the plot size, the plot form and the distances between the different fields are medium-term and long-term actions. Apart from the conventional reallocation there are also measures like leasing of neighbour areas, voluntary changing of areas and virtual reallocation.
Impact of distance
Example:
10 t - 5 km distance = ca. 4,5 litres
10 t - 10 km distance = ca. 9 litres
20 t - 5 km distance = ca. 9 litres
20 t - 10 km distance = ca. 18 litres
For the transport with trailers an average fuel consumption of ca. 0,09 l per tons and km has to be calculated (Source: ÖKL 2008).For large field distances more fuel is needed.In case of short distances fuel can be saved.

55
4.4 Conclusion
Influence of plot size on fuel consumption
The bigger the plot, the shorter is the proportion of the turning times.
Re-allocation, change of areas, additional lease of neighbour areas
The best economical effect can be achieved with a plot size of 5 ha.
Influence of plot form on fuel consumption
The larger and continuous the plot forms, the less turning time is needed.
The optimal plot form is the rectangle.
Influence of distances between fields
For the transport of bulk goods an average fuel consumption of ca. 0,09 liters per ton and km has to be calculated.
Large haul distances need more fuel, short distances save fuel.
56
5. Specific measures of soil tillage
5.1 Reduction of energy-wasting cultivation procedures
By using mulch or direct sowing the fuel consumption can be reduced in an efficient way. Figure 42 illustrates how the fuel consumption can be reduced by 39% for stubble processing, basic and secondary processing and also sowing, if the method is changed from conventional cultivation with a plough to mulching including soil loosening. If the soil is not loosened, further 20% can be saved. The method of direct sowing needs only 11% of the fuel amount that is needed for the method including ploughing. For implementing the method of mulching and direct sowing, one has to consider some basic principles (Rosner et al 2007). Especially measures for avoiding Fusarium diseases have to be taken.
Figure 42: Fuel consumption for different cultivation methods (Brunette and Korte 2003)
Fuel consumption for different cultivation methods
Mulch seed or direct sowing reduces diesel consumption.
If possible, avoid ploughing!
Direct sowingStraw harrowSowing (rotary cultivator + seed drill)PloughDeep stubble processing (four-bar cultivator)Flat stubble processing (short disc harrow)
Fuel
con
sum
ptio
n [l/
ha]
Conventional with plough
Direct sowingMulch seed with soil loosening
Mulch seed without soil loosening
Cultivation system
Source: Brunotte and Korte 2003

57
5.2 Reduction of working processes – combination of tasks
Unnecessary operations should be avoided. For example only one single treatment with a seedbed combination needs 5-9 liters of diesel per ha (KTBL 2006). Further reference values with regard to fuel consumption for works can be found in Table 2 (Page 14).
When choosing working methods some operations could easily be combined. Under optimal conditions fuel can be saved. For example, if cereal is sowed in two separated working steps - and therefore the field has to be prepared two times with a seedbed combination – a new method in form of a combined cultivation with the rotary harrow can save 20% of fuel (see Figure 43). If grassland is mowed using the mower with a conditioner instead of the mower and a rotary tedder, the fuel consumption can be reduced by 24%.
By combining single working operations the number of operations can be reduced. But it has to be considered that for this reason the power needed for the equipment as well as the weight will be rising.
Figure 43: Fuel saving by combining of operations (KTBL 2006, own calculations)
Avoid unnecessary operations and combine them
• Avoid unnecessary operations (one single treatment with seedbed combination needs 5-9 litres diesel/ha)
• Combine operations!
Operation Method of operation Mechanization
Fuel consumption
[l/ha]
Sowing of cereals
separated seedbed combination (5 m, 67 kW, 2 treatments), seed drill (3 m, 45 kW) 14,8
combined rotary harrow with seed drill (3m, 67 kW) 11,6
- 20 %
Preparation of wilted silage
separated mower (2,8 m, 54 kW) and rotary tedder (5,5 m, 45 kW, one treatment) 7,8
combined mower with conditioner (2,8 m, 67 kW) 5,9
- 24 %
Source: KTBL 2006, own calculations
58
5.3 Avoiding of soil compaction
Soil compactions increase the power required and therefore also the fuel consumption. The Figure below exemplifies the impacts of soil compaction during ploughing. Slipping increases from 3,6% to 5,4% and the driving speed declines from 6,8 to 6,4 km/h. Fuel consumption rises from 13,2 to 15,3 l/ha on average.
Apart from the used technology (wheel load, contact surface pressure) the support capability of the soil and its moisture are decisive factors for the formation of soil compaction.
Avoiding soil compaction and flange grooves are the most important preconditions for a successful use of mulching or direct sowing.
Figure 44: Impact of soil compaction during ploughing (Moitzi 2006)
Impact of soil compaction during ploughing
Soil not compacted
Soil compacted
Speed [km/h] 6,8 6,4Slipping [%] 3,6 5,4Fuel consumption [l/h] 15,3 16,7Fuel consumption [l/ha] 13,2 15,3
+ 16 %Remark: 4-furrows reversible plough – 1,70 m working width, 20 cm working depth, autumnal tilling after grain maize, soil type: sandy loam with 14 % moisture
The best precondition for a healthy soil is to avoid compaction.Soil compaction requires more engine power and fuel.
Source: Moitzi 2006
59
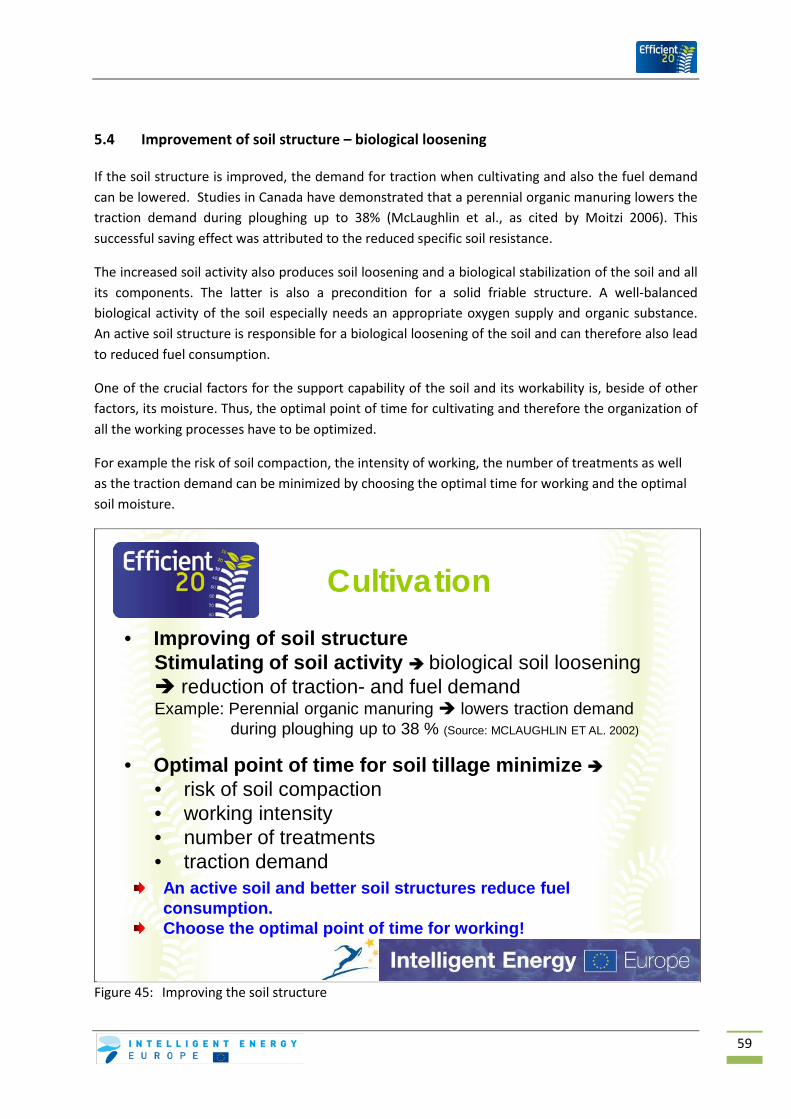
5.4 Improvement of soil structure – biological loosening
If the soil structure is improved, the demand for traction when cultivating and also the fuel demand can be lowered. Studies in Canada have demonstrated that a perennial organic manuring lowers the traction demand during ploughing up to 38% (McLaughlin et al., as cited by Moitzi 2006). This successful saving effect was attributed to the reduced specific soil resistance.
The increased soil activity also produces soil loosening and a biological stabilization of the soil and all its components. The latter is also a precondition for a solid friable structure. A well-balanced biological activity of the soil especially needs an appropriate oxygen supply and organic substance. An active soil structure is responsible for a biological loosening of the soil and can therefore also lead to reduced fuel consumption.
One of the crucial factors for the support capability of the soil and its workability is, beside of other factors, its moisture. Thus, the optimal point of time for cultivating and therefore the organization of all the working processes have to be optimized.
For example the risk of soil compaction, the intensity of working, the number of treatments as well as the traction demand can be minimized by choosing the optimal time for working and the optimal soil moisture.
Figure 45: Improving the soil structure
Cultivation• Improving of soil structure
Stimulating of soil activity biological soil loosening reduction of traction- and fuel demandExample: Perennial organic manuring lowers traction demand
during ploughing up to 38 % (Source: MCLAUGHLIN ET AL. 2002)
• Optimal point of time for soil tillage minimize • risk of soil compaction• working intensity• number of treatments• traction demandAn active soil and better soil structures reduce fuel consumption.Choose the optimal point of time for working!

60
5.5 Optimal working depth or cultivation
During cultivating about 150 tons of soil have to be moved per ha and cm of working depth. Therefore the fuel consumption rises with increasing working depth. Depending on the soil conditions between 0,5 and 1,4 liters more per cm of working depth and hectare are necessary for this process (Kalk and Hülsbergen 1999). When cultivating the soil, the rising fuel consumption is within a similar range (see Figure 46). Therefore it should never be cultivated deeper than the soil and the crop require. By adapting the working depth fuel can be saved even when the soil conditions are changing and the yield stays constant. On a farm or an areal with heterogeneous soil conditions more than 50% of fuel can be saved if sandy soils are cultivated in a more deeper way and loamy and clayey grounds in a more flat way (Sommer and Vosshenrich 2004).
Figure 46: Influence of working depth on fuel consumption (Mumme 2007, Kalk and Hülsbergen 1999)
Optimal working depth for cultivation
For working 1 cm deeper about 150 tons of soil / ha have to be moved.+ 1 cm working depth during ploughing ca. + 0,5 - 1,4 l diesel (Source: KALK and HÜLSBERGEN 1999)
8
10
12
14
16
18
20
22
8 10 12 14 16 18 20 22 24 26Bearbeitungstiefe Grubber [cm]
Treib
stof
fver
brau
ch [l
/ha]
Source: Mumme 2007
Four-bar cultivator, 3 m
Do not work deeper than your soil and crop require.
Working depth cultivator [cm]
Fuel
con
sum
ptio
n [l/
ha]
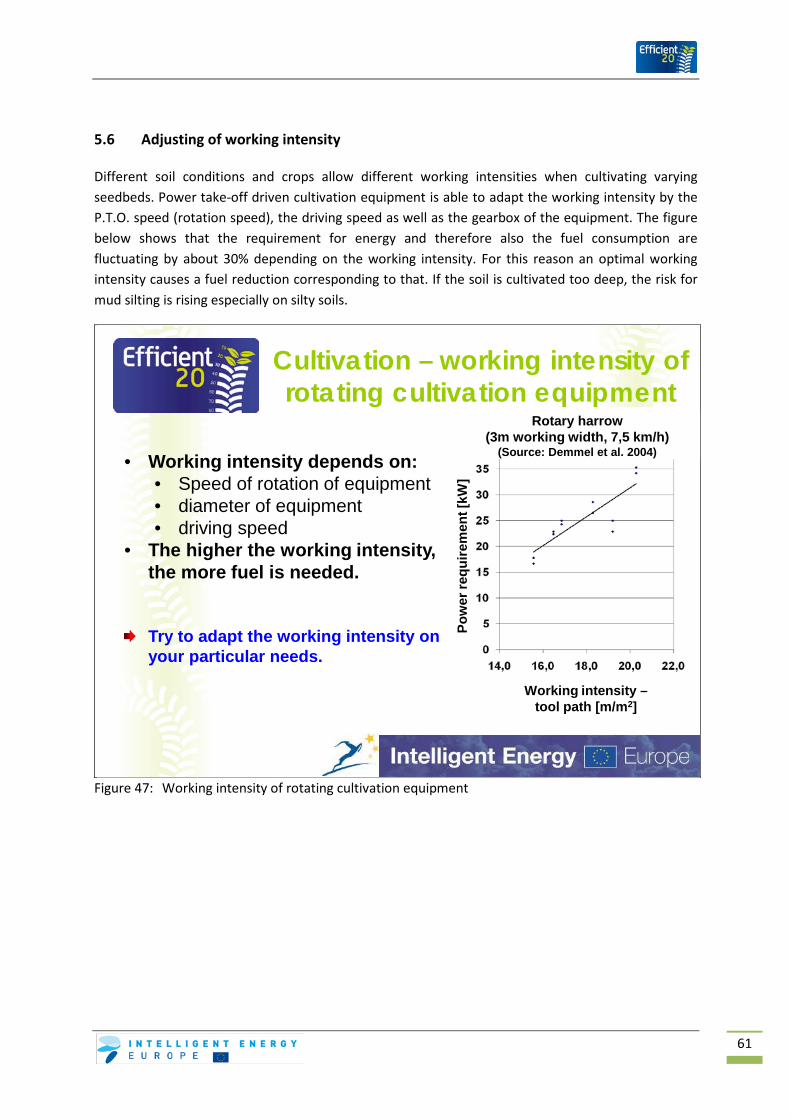
61
5.6 Adjusting of working intensity
Different soil conditions and crops allow different working intensities when cultivating varying seedbeds. Power take-off driven cultivation equipment is able to adapt the working intensity by the P.T.O. speed (rotation speed), the driving speed as well as the gearbox of the equipment. The figure below shows that the requirement for energy and therefore also the fuel consumption are fluctuating by about 30% depending on the working intensity. For this reason an optimal working intensity causes a fuel reduction corresponding to that. If the soil is cultivated too deep, the risk for mud silting is rising especially on silty soils.
Figure 47: Working intensity of rotating cultivation equipment
Cultivation – working intensity of rotating cultivation equipment
• Working intensity depends on:• Speed of rotation of equipment• diameter of equipment• driving speed
• The higher the working intensity, the more fuel is needed.
Try to adapt the working intensity on your particular needs.
Rotary harrow(3m working width, 7,5 km/h)
(Source: Demmel et al. 2004)
Working intensity –tool path [m/m2]
Pow
er re
quire
men
t [kW
]
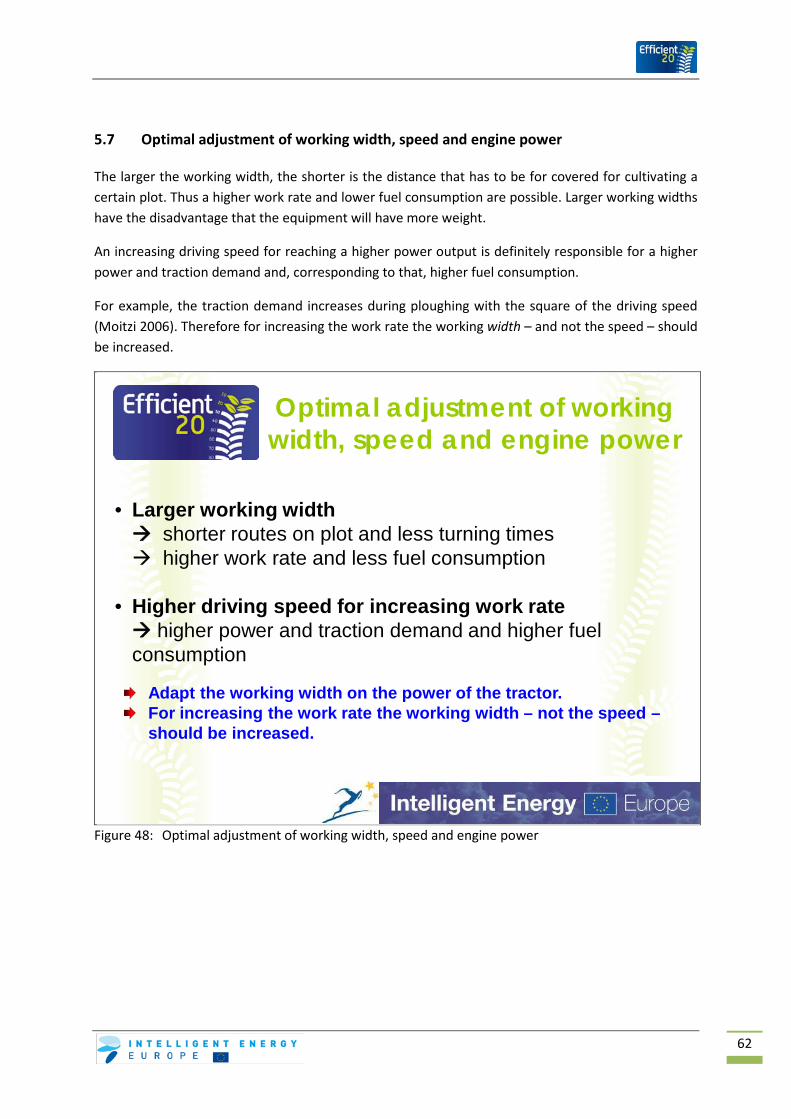
62
5.7 Optimal adjustment of working width, speed and engine power
The larger the working width, the shorter is the distance that has to be for covered for cultivating a certain plot. Thus a higher work rate and lower fuel consumption are possible. Larger working widths have the disadvantage that the equipment will have more weight.
An increasing driving speed for reaching a higher power output is definitely responsible for a higher power and traction demand and, corresponding to that, higher fuel consumption.
For example, the traction demand increases during ploughing with the square of the driving speed (Moitzi 2006). Therefore for increasing the work rate the working width – and not the speed – should be increased.
Figure 48: Optimal adjustment of working width, speed and engine power
Optimal adjustment of working width, speed and engine power
• Larger working width shorter routes on plot and less turning times higher work rate and less fuel consumption
• Higher driving speed for increasing work rate higher power and traction demand and higher fuel consumption
Adapt the working width on the power of the tractor. For increasing the work rate the working width – not the speed –should be increased.
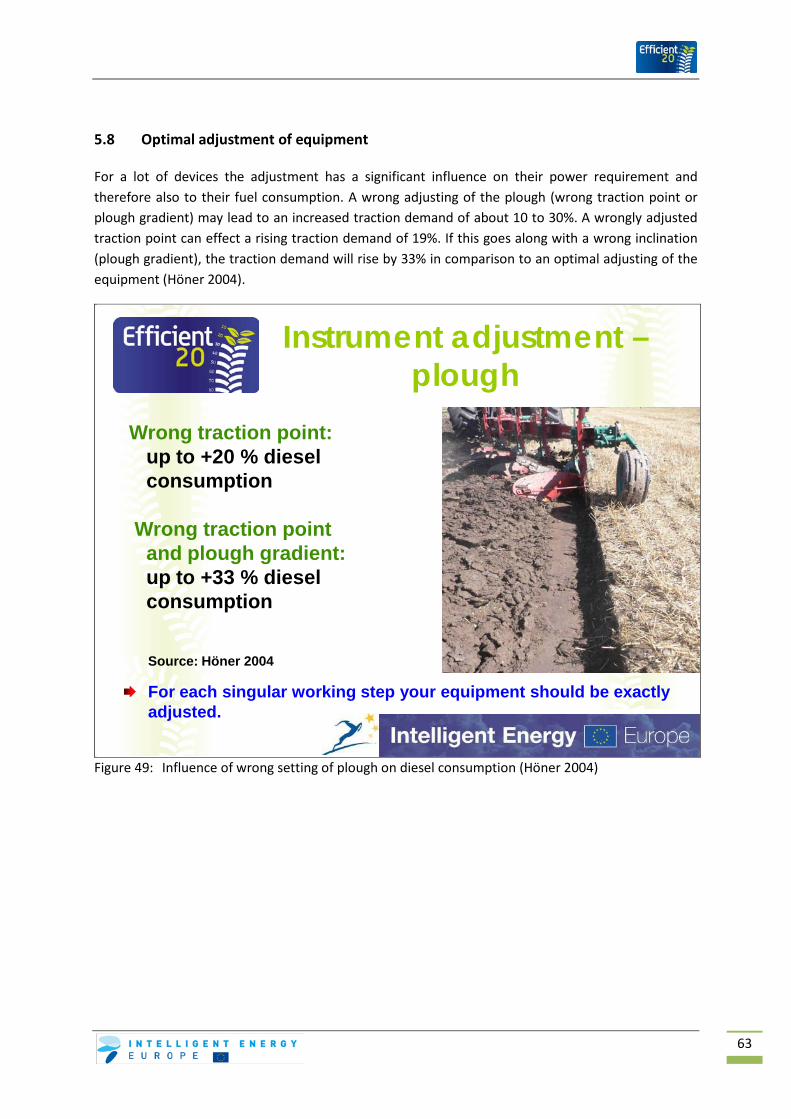
63
5.8 Optimal adjustment of equipment
For a lot of devices the adjustment has a significant influence on their power requirement and therefore also to their fuel consumption. A wrong adjusting of the plough (wrong traction point or plough gradient) may lead to an increased traction demand of about 10 to 30%. A wrongly adjusted traction point can effect a rising traction demand of 19%. If this goes along with a wrong inclination (plough gradient), the traction demand will rise by 33% in comparison to an optimal adjusting of the equipment (Höner 2004).
Figure 49: Influence of wrong setting of plough on diesel consumption (Höner 2004)
Instrument adjustment –plough
Wrong traction point:up to +20 % diesel consumption
Wrong traction point and plough gradient:up to +33 % diesel consumption
For each singular working step your equipment should be exactly adjusted.
Source: Höner 2004

64
5.9 Maintenance of equipment
Optimally maintained cultivating equipments have a positive fuel-saving effect. Often it is tried to enlarge the service life of these equipments by melding scrap metal parts on a plough share, another unit or a slatted mould board. This often leads to a pasting of soil and therefore also to an increased traction- and fuel demand. Besides, rust on the working instruments leads to a sticking of soil. For this reason the most important measures for a successful rust protection should be taken directly after the material has been used for cultivating.
Figure 50: Diesel consumption of four-furrows-plough with new wearing parts in comparison to unchanged plough body (Weiss 2003)
Maintenance of equipment Diesel consumption of a four furrows plough
(Source: Weiss 2003)
Reference100 % (20,2 l/ha)
Flat-bar steel welded on a slatted mouldboard
116 %
Used point welded on the point of a plough share
134 %
Do not just repair wear parts improperly, better change them.Welded wear parts increase the fuel consumption.
Welded double wedge 135 %
Landsides strengthened with steel plate
141 %
65
5.10 Conclusion
Diesel consumption for different cultivation methods
Mulching and direct sowing reduces diesel consumption. If possible, avoid working with the plough.
Avoid unnecessary working steps – better combine them
Avoid unnecessary operations.
Try to combine operations.
For one single treatment with a seedbed combination 5 – 9 liters diesel per ha are required.
Impact of soil compaction during ploughing
The best precondition to avoid soil compaction is a healthy soil.
A compacted soil requires more engine power and fuel.
Cultivation
An improved soil structure reduces fuel consumption.
More soil activity and a more friable and loose structure also reduce fuel consumption.
Choose the optimal point of time for working!
Optimal working depth for cultivation
Progressive curve of consumption in relation to rising working depth
Per cm working depth about 150 tons of soil per ha are moved.
Ploughing: for + 1 cm working depth ca. + 0.5 to 1.4 l diesel/ha more are needed.
Try not to work deeper than your soil and culture require.
Cultivation – adapt the working intensity
The higher the rotation speed of the cultivation equipment and the slower the operation speed, the higher is the power and the fuel consumption.
Adapt your working intensity on your particular needs.

66
Optimal adjustment of working width, speed and engine power
Adapt the working width on the engine power.
To expand the work rate, the working width and not the speed should be increased.
Instrument adjustment – plough
A wrong traction point and a wrong plough gradient require about 20–33 % more diesel.
An exact adjustment of your working equipment for each singular working step has to be made.
Maintenance of equipment
Do not repair wear parts improperly, but change them.
Wear parts that are simply welded on the cultivating equipment lead to an increased fuel consumption.
67
6. Specific measures of forage harvesting
6.1 Reduction of number of operations – combination of operations
When arranging the respective methods some operations may be combined. Under optimal basic conditions fuel can be saved. For example when preparing wilted silage, it is possible to save more than 20% of fuel, if – instead of mowing with following tedding procedure – the grass is only mowed with included conditioner and the tedding procedure is not performed anymore (see Figure 52).
By combining working steps the number of treatments will be reduced. At the same time the demand for power needed for the equipments as well as their weight is increasing.
Working steps that are not immediately necessary should be avoided. Reference values for fuel consumption can be found in Table 2.
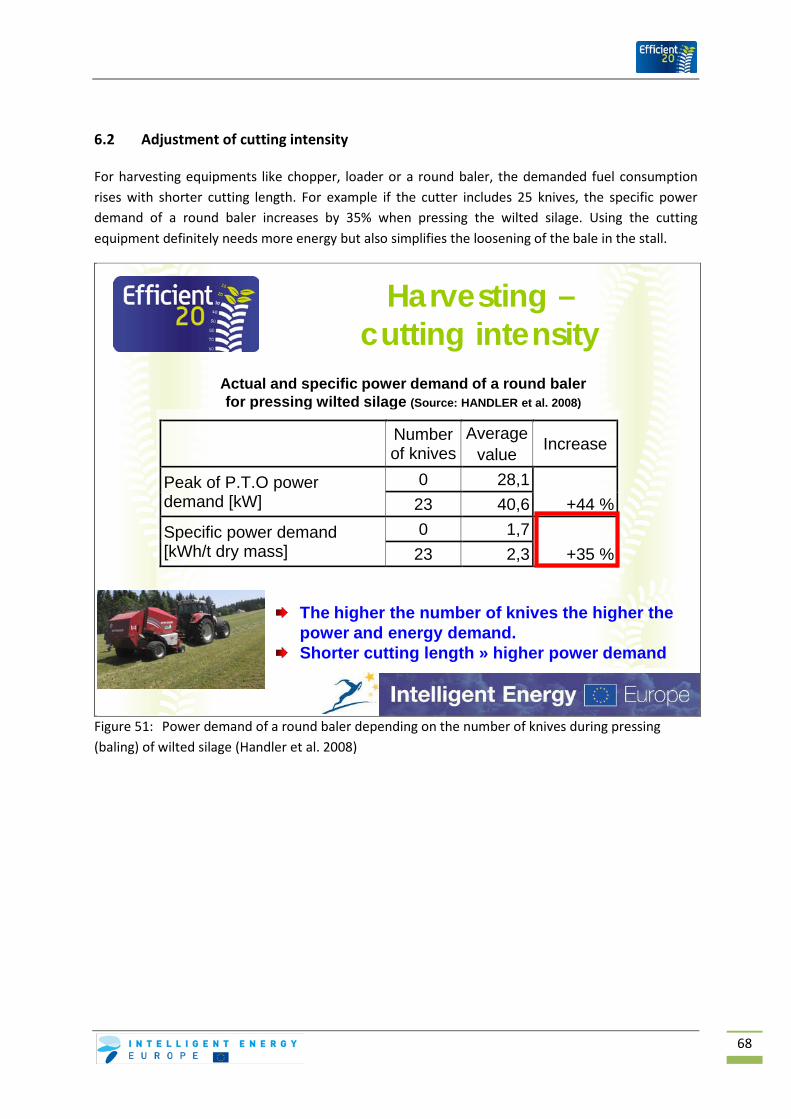
68
6.2 Adjustment of cutting intensity
For harvesting equipments like chopper, loader or a round baler, the demanded fuel consumption rises with shorter cutting length. For example if the cutter includes 25 knives, the specific power demand of a round baler increases by 35% when pressing the wilted silage. Using the cutting equipment definitely needs more energy but also simplifies the loosening of the bale in the stall.
Figure 51: Power demand of a round baler depending on the number of knives during pressing (baling) of wilted silage (Handler et al. 2008)
Harvesting –cutting intensity
Actual and specific power demand of a round balerfor pressing wilted silage (Source: HANDLER et al. 2008)
Number of knives
Average value Increase
Peak of P.T.O power demand [kW]
0 28,1 23 40,6 +44 %
Specific power demand [kWh/t dry mass]
0 1,7 23 2,3 +35 %
The higher the number of knives the higher the power and energy demand.Shorter cutting length » higher power demand

69
If the cutting length when harvesting silage maize is reduced from 13 to 10 mm, up to 13% more fuel is necessary (see Figure 52). Therefore the cutting length should not be shorter than needed.
Figure 52: Influence of cutting length on the fuel consumption at harvest of silage maize (Mölder 2005)
Harvesting –cutting intensity
-13 %
Longer cutting length reduces fuel consumption.The cutting length of the harvester should be adapted to the actual demand.
Influence of cutting length on fuel consumption when harvesting silage maize (forage harvester 445 kW) –
(Source: MÖLDER 2005)Theoretical cutting length
Working width [m]
Fuel
con
sum
ptio
n[l/
t fre
sh m
ass]
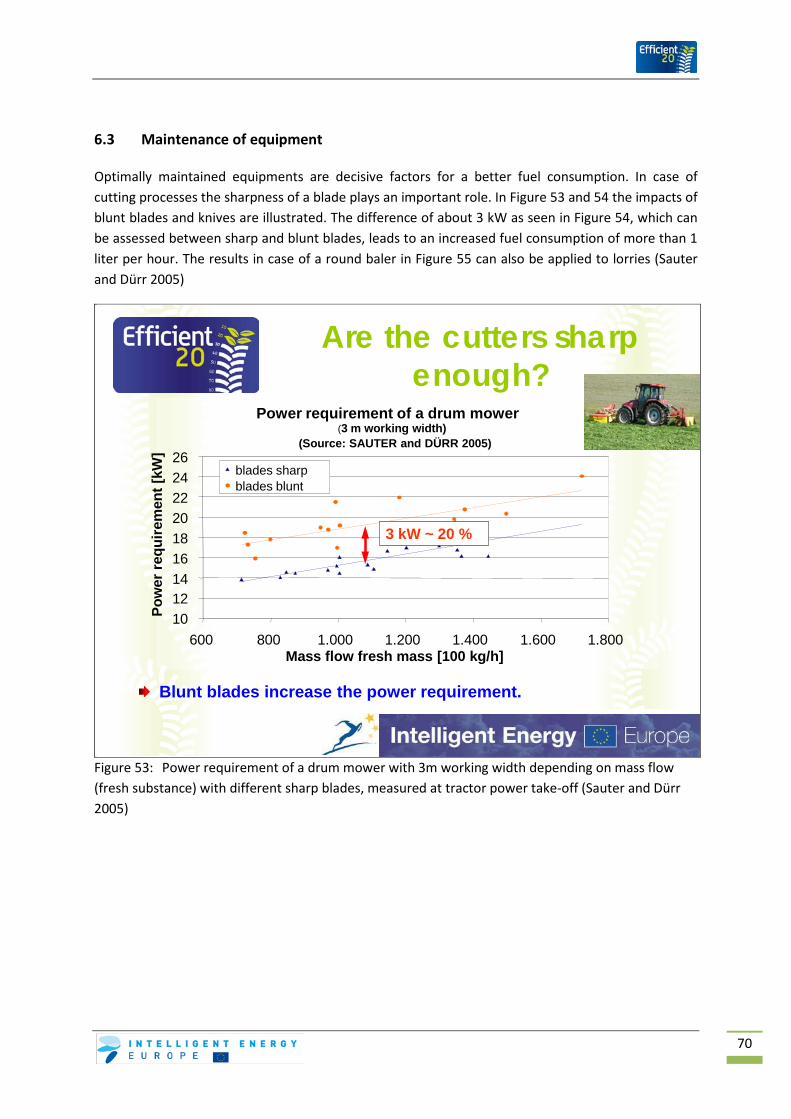
70
6.3 Maintenance of equipment
Optimally maintained equipments are decisive factors for a better fuel consumption. In case of cutting processes the sharpness of a blade plays an important role. In Figure 53 and 54 the impacts of blunt blades and knives are illustrated. The difference of about 3 kW as seen in Figure 54, which can be assessed between sharp and blunt blades, leads to an increased fuel consumption of more than 1 liter per hour. The results in case of a round baler in Figure 55 can also be applied to lorries (Sauter and Dürr 2005)
Figure 53: Power requirement of a drum mower with 3m working width depending on mass flow (fresh substance) with different sharp blades, measured at tractor power take-off (Sauter and Dürr 2005)
Power requirement of a drum mower (3 m working width)
(Source: SAUTER and DÜRR 2005)
101214161820222426
600 800 1.000 1.200 1.400 1.600 1.800Mass flow fresh mass [100 kg/h]
Pow
er re
quire
men
t [kW
]
blades sharpblades blunt
Are the cutters sharp enough?
3 kW ~ 20 %
Blunt blades increase the power requirement.
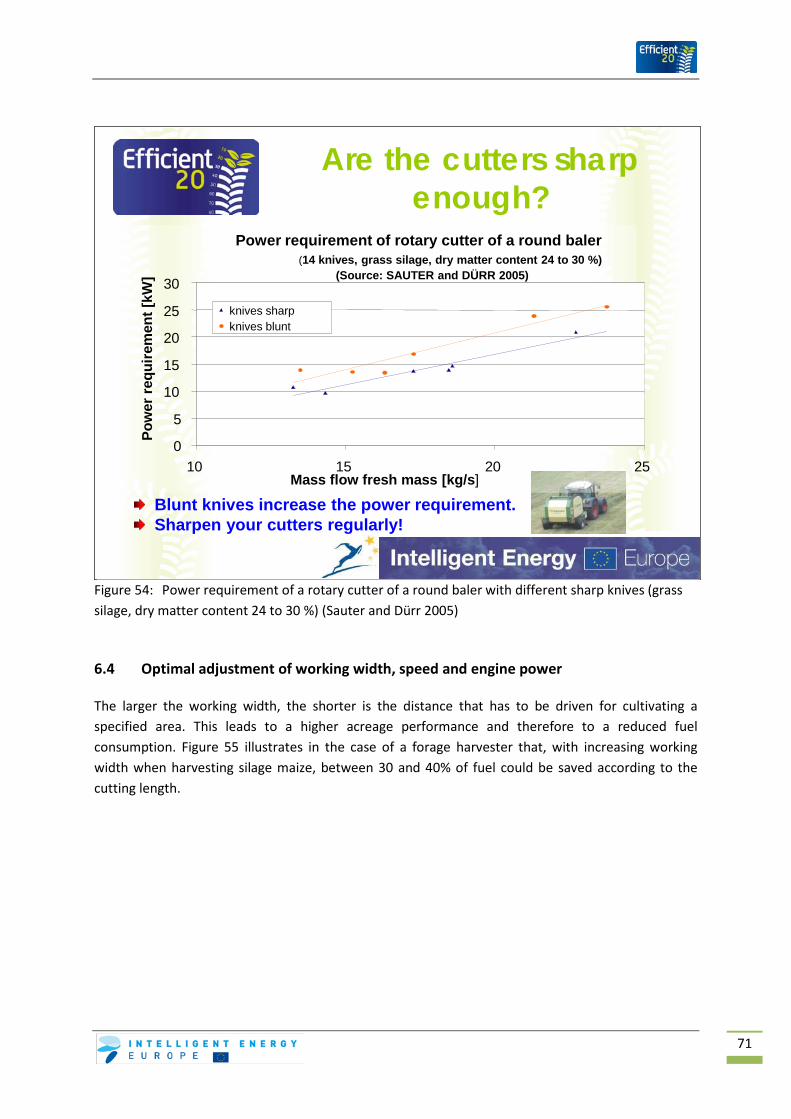
71
Figure 54: Power requirement of a rotary cutter of a round baler with different sharp knives (grass silage, dry matter content 24 to 30 %) (Sauter and Dürr 2005)
6.4 Optimal adjustment of working width, speed and engine power
The larger the working width, the shorter is the distance that has to be driven for cultivating a specified area. This leads to a higher acreage performance and therefore to a reduced fuel consumption. Figure 55 illustrates in the case of a forage harvester that, with increasing working width when harvesting silage maize, between 30 and 40% of fuel could be saved according to the cutting length.
Are the cutters sharp enough?
Blunt knives increase the power requirement.Sharpen your cutters regularly!
Power requirement of rotary cutter of a round baler (14 knives, grass silage, dry matter content 24 to 30 %)
(Source: SAUTER and DÜRR 2005)
0
5
10
15
20
25
30
10 15 20 25Mass flow fresh mass [kg/s]
Pow
er re
quire
men
t [kW
]
knives sharpknives blunt
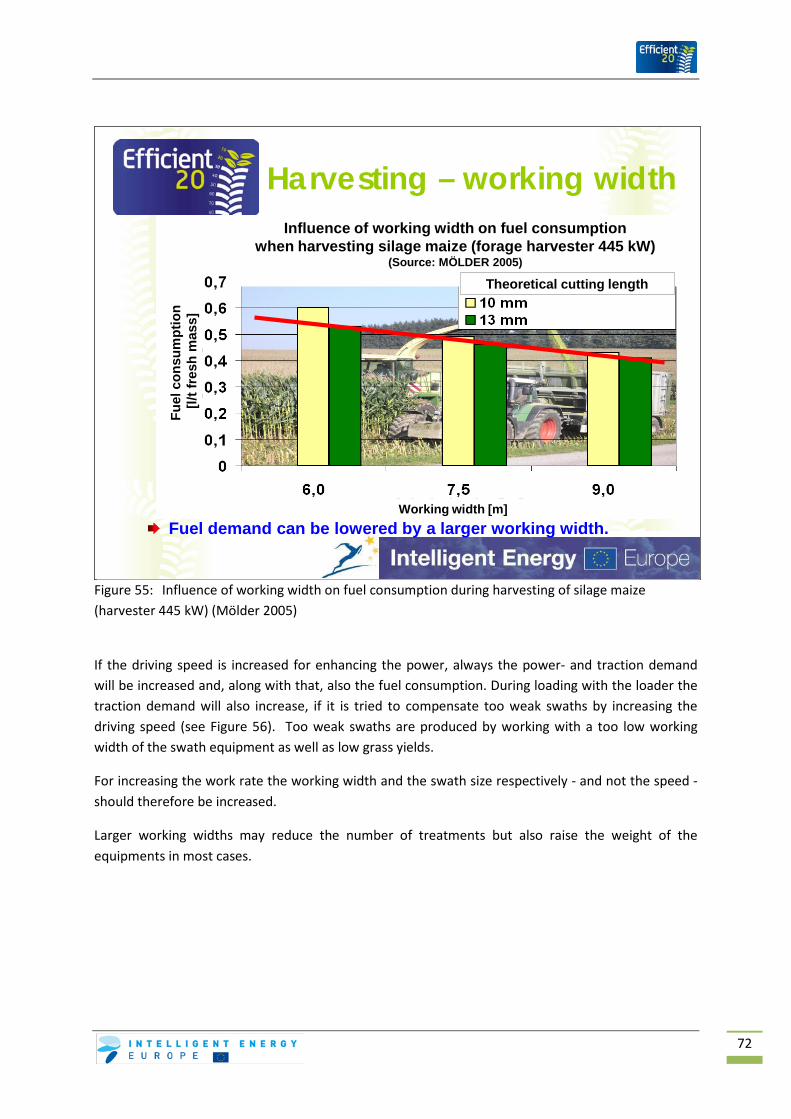
72
Figure 55: Influence of working width on fuel consumption during harvesting of silage maize (harvester 445 kW) (Mölder 2005)
If the driving speed is increased for enhancing the power, always the power- and traction demand will be increased and, along with that, also the fuel consumption. During loading with the loader the traction demand will also increase, if it is tried to compensate too weak swaths by increasing the driving speed (see Figure 56). Too weak swaths are produced by working with a too low working width of the swath equipment as well as low grass yields.
For increasing the work rate the working width and the swath size respectively - and not the speed - should therefore be increased.
Larger working widths may reduce the number of treatments but also raise the weight of the equipments in most cases.
Harvesting – working width
Fuel demand can be lowered by a larger working width.
Influence of working width on fuel consumption when harvesting silage maize (forage harvester 445 kW)
(Source: MÖLDER 2005)
Theoretical cutting length
Working width [m]
Fuel
con
sum
ptio
n[l/
t fre
sh m
ass]
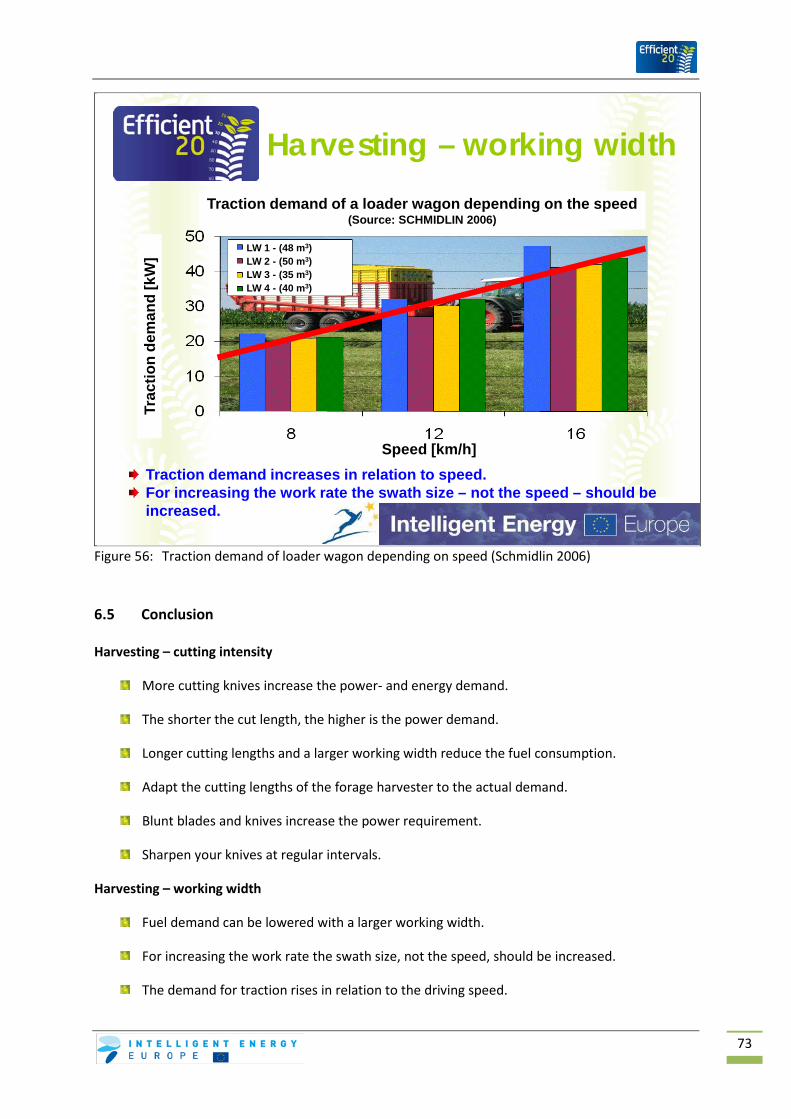
73
Figure 56: Traction demand of loader wagon depending on speed (Schmidlin 2006)
6.5 Conclusion
Harvesting – cutting intensity
More cutting knives increase the power- and energy demand.
The shorter the cut length, the higher is the power demand.
Longer cutting lengths and a larger working width reduce the fuel consumption.
Adapt the cutting lengths of the forage harvester to the actual demand.
Blunt blades and knives increase the power requirement.
Sharpen your knives at regular intervals.
Harvesting – working width
Fuel demand can be lowered with a larger working width.
For increasing the work rate the swath size, not the speed, should be increased.
The demand for traction rises in relation to the driving speed.
Harvesting – working width
Traction demand increases in relation to speed.For increasing the work rate the swath size – not the speed – should be increased.
Traction demand of a loader wagon depending on the speed (Source: SCHMIDLIN 2006)
LW 1 - (48 m3)LW 2 - (50 m3)LW 3 - (35 m3)LW 4 - (40 m3)
Speed [km/h]
Trac
tion
dem
and
[kW
]

74
7. Choice of transport vehicles
7.1 Influence of size of transport vehicle
According to the size of the farm the importance of transport is rising. Generally it can be said that the larger the vehicles are, the lower is the fuel consumption per transported unit. The differences grow larger with rising transport distances (see Figure below). The higher weights of large vehicles raise problems especially in relation to soil compactions. Therefore, driving in fields with very heavy vehicles should be avoided. Works in the field should be performed with relatively light weighted vehicles with suitable tyres. For separating field work and transport an additional process of reloading– with the exception of harvesting – is required, which will definitely be profitable in case of long transport distances. When field work and transport are separated, the transport vehicles should be equipped with tyres having a relatively small footprint and a high internal pressure. Therefore wearing and rolling resistance are minimized. Especially the latter helps to reduce fuel consumption.
Figure 57: Fuel consumption for transporting liquid manure in case of multi-stage systems (KTBL 2006, own calculations)
Size of transport vehicle
- 16 %
- 18 %
When goods are carried by road, the fuel consumption can be reduced by higher transport capacities or net loadings.
Diesel consumption for transporting liquid manure (Source: KTBL 2006, own calculations by FJ-BLT)
Distance field-farm
Die
sel c
onsu
mpt
ion
[l/10
0 m
3 ]
Transport tank 15 m3
Tractor 67 kWTransport tank 21 m3
Tractor 83 kWTransport tank 15 m3
Tractor 67 kWTransport tank 21 m3
Tractor 83 kW

75
Figure 58: Transport and fuel consumption
Transport• Farm size is growing transport distances increase• Larger vehicles higher mass (less fuel consumption per
transport unit) soil pressure rises
Separate field work and transport:lower tyre pressure and transport weight in the fieldhigher tyre pressure and transport weight on the road

76
7.2 Comparison tractor - lorry
Comparisons between lorries and tractors with a trailer have shown that the lorry generally needs less fuel related to the driven km and the transported weight than a tractor with trailer. The example is illustrated in Figure 59. The lorry definitely also needs a separation of field work and transport due to the fact that its tyres and the high tyre pressure may cause problems when driving in the field.
Figure 59: Comparison of fuel consumption of a lorry and a tractor with trailer
Comparison tractor – lorry for transport of liquid manure
Basic conditions: - asphalt roads- flat or hilly grounds
Diesel consumption average of outward run (full) and return run (empty)
[l/100 km] [l/100 km.t] fuel consumption per 100 km and ton net load
Tractors (120 – 199 kW) with tank trailer (18 m³) 46 – 63 2,6 – 3,5
Lorry (315 kW) with 21 m³ 30 – 35 1,4 – 1,7
Large consumption differences for different tractors and drivers.A lorry needs less fuel than a tractor with trailer » requires a separation of field work and transport.

77
7.3 Conclusion
Measures for transport
Avoid unnecessary rides.
Use a sensitive driving style – try to „coast“.
Avoid unnecessary speed-ups and slow-downs.
Try to change in time into a gear that is well-adapted to the slope.
Try not to shift the gear directly on a slope.
Size of vehicles
When goods are carried by road, the fuel consumption can be reduced by higher transport capacities or net loadings.
Separation of field work and transport
Low tyre pressure and low weight in the field
High tyre pressure and high weight on the road
Try to avoid unnecessary rides.
Comparison tractor - lorry
Large differences for different tractors and drivers
A lorry needs less fuel than a tractor with trailer but this requires a clear separation of field work and transport.
78
8. Crucial factor man
There is an immense number of recommendations, possibilities and tips how to save fuel. The target is to inform the keeper and driver of a vehicle in a comprehensive way. Now any driver has to decide for himself how all these advices are put into practice. Each single activity where the tractor is used has to be analyzed with regard to a practicable way for saving fuel. Only then it will be possible to reach a noticeable saving effect throughout the whole year.
Figure 60: Refreshment of fuel-saving measures is necessary
Crucial factor man
• Refreshment is necessary!• How is it possible to save fuel on my farm?• A periodical refreshment of fuel saving advices is essential.• Successful fuel-saving measures are helpful to internalize these
actions more and more.

79
Figure 61: The driver is responsible for the successful implementation of these fuel-saving measures.
8.1 Conclusion
Motivation is crucial
Competent clarification of possibilities to save fuel on the farm
A periodical refreshment of fuel-saving advices is essential.
Successful fuel-saving measures will help you to internalize these actions more and more.
Only a skilled and motivated driver can put these fuel-saving measures into practice!
Think of an economical and considerate exploitation of resources!
Crucial factor man
Only a skilled driver can put these fuel-saving measures into practice!
Economical and considerate exploitation of resources!
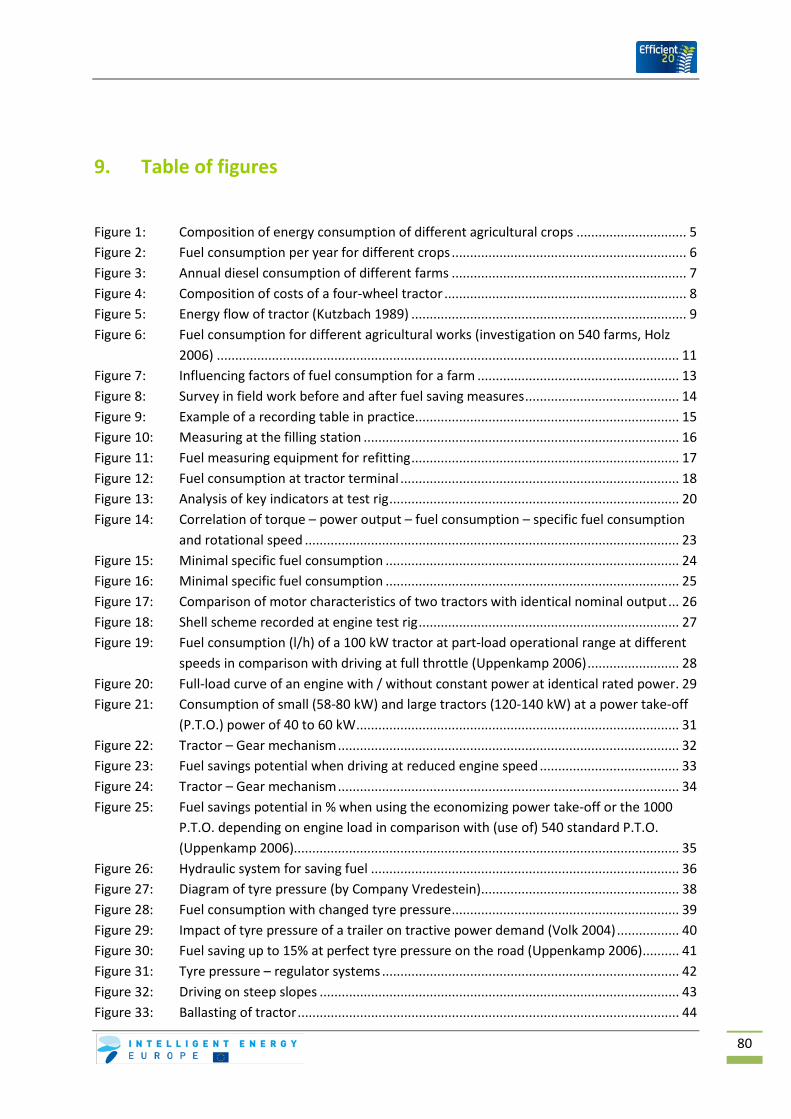
80
9. Table of figures
Figure 1: Composition of energy consumption of different agricultural crops .............................. 5Figure 2: Fuel consumption per year for different crops ................................................................ 6Figure 3: Annual diesel consumption of different farms ................................................................ 7Figure 4: Composition of costs of a four-wheel tractor .................................................................. 8Figure 5: Energy flow of tractor (Kutzbach 1989) ........................................................................... 9Figure 6: Fuel consumption for different agricultural works (investigation on 540 farms, Holz
2006) .............................................................................................................................. 11Figure 7: Influencing factors of fuel consumption for a farm ....................................................... 13Figure 8: Survey in field work before and after fuel saving measures .......................................... 14Figure 9: Example of a recording table in practice ........................................................................ 15Figure 10: Measuring at the filling station ...................................................................................... 16Figure 11: Fuel measuring equipment for refitting ......................................................................... 17Figure 12: Fuel consumption at tractor terminal ............................................................................ 18Figure 13: Analysis of key indicators at test rig ............................................................................... 20Figure 14: Correlation of torque – power output – fuel consumption – specific fuel consumption
and rotational speed ...................................................................................................... 23Figure 15: Minimal specific fuel consumption ................................................................................ 24Figure 16: Minimal specific fuel consumption ................................................................................ 25Figure 17: Comparison of motor characteristics of two tractors with identical nominal output ... 26Figure 18: Shell scheme recorded at engine test rig ....................................................................... 27Figure 19: Fuel consumption (l/h) of a 100 kW tractor at part-load operational range at different
speeds in comparison with driving at full throttle (Uppenkamp 2006) ......................... 28Figure 20: Full-load curve of an engine with / without constant power at identical rated power . 29Figure 21: Consumption of small (58-80 kW) and large tractors (120-140 kW) at a power take-off
(P.T.O.) power of 40 to 60 kW ........................................................................................ 31Figure 22: Tractor – Gear mechanism ............................................................................................. 32Figure 23: Fuel savings potential when driving at reduced engine speed ...................................... 33Figure 24: Tractor – Gear mechanism ............................................................................................. 34Figure 25: Fuel savings potential in % when using the economizing power take-off or the 1000
P.T.O. depending on engine load in comparison with (use of) 540 standard P.T.O. (Uppenkamp 2006) ......................................................................................................... 35
Figure 26: Hydraulic system for saving fuel .................................................................................... 36Figure 27: Diagram of tyre pressure (by Company Vredestein) ...................................................... 38Figure 28: Fuel consumption with changed tyre pressure .............................................................. 39Figure 29: Impact of tyre pressure of a trailer on tractive power demand (Volk 2004) ................. 40Figure 30: Fuel saving up to 15% at perfect tyre pressure on the road (Uppenkamp 2006) .......... 41Figure 31: Tyre pressure – regulator systems ................................................................................. 42Figure 32: Driving on steep slopes .................................................................................................. 43Figure 33: Ballasting of tractor ........................................................................................................ 44
81
Figure 34: Ballasting of tractor ........................................................................................................ 45Figure 35: Maintenance measures and their effect ........................................................................ 46Figure 36: Preserving the engine power by maintaining ................................................................ 47Figure 37: Performing of maintenance measures ........................................................................... 47Figure 38: Paying attention to easy maintainability ....................................................................... 48Figure 39: Impact of plot size on fuel consumption (Fröba as cited in Uppenkamp 2006) ............ 52Figure 40: Impact of plot form on fuel consumption (Bernhardt as cited in Uppenkamp 2006) ... 53Figure 41: Diesel consumption when transporting bulk goods ...................................................... 54Figure 42: Fuel consumption for different cultivation methods (Brunette and Korte 2003) ......... 56Figure 43: Fuel saving by combining of operations (KTBL 2006, own calculations) ....................... 57Figure 44: Impact of soil compaction during ploughing (Moitzi 2006) ........................................... 58Figure 45: Improving the soil structure ........................................................................................... 59Figure 46: Influence of working depth on fuel consumption (Mumme 2007, Kalk and Hülsbergen
1999) .............................................................................................................................. 60Figure 47: Working intensity of rotating cultivation equipment .................................................... 61Figure 48: Optimal adjustment of working width, speed and engine power ................................. 62Figure 49: Influence of wrong setting of plough on diesel consumption (Höner 2004) ................. 63Figure 50: Diesel consumption of four-furrows-plough with new wearing parts in comparison to
unchanged plough body (Weiss 2003) ........................................................................... 64Figure 51: Power demand of a round baler depending on the number of knives during pressing
(baling) of wilted silage (Handler et al. 2008) ................................................................ 68Figure 52: Influence of cutting length on the fuel consumption at harvest of silage maize (Mölder
2005) .............................................................................................................................. 69Figure 53: Power requirement of a drum mower with 3m working width depending on mass flow
(fresh substance) with different sharp blades, measured at tractor power take-off (Sauter and Dürr 2005) ................................................................................................... 70
Figure 54: Power requirement of a rotary cutter of a round baler with different sharp knives (grass silage, dry matter content 24 to 30 %) (Sauter and Dürr 2005) .......................... 71
Figure 55: Influence of working width on fuel consumption during harvesting of silage maize (harvester 445 kW) (Mölder 2005) ................................................................................ 72
Figure 56: Traction demand of loader wagon depending on speed (Schmidlin 2006) ................... 73Figure 57: Fuel consumption for transporting liquid manure in case of multi-stage systems (KTBL
2006, own calculations) ................................................................................................. 74Figure 58: Transport and fuel consumption .................................................................................... 75Figure 59: Comparison of fuel consumption of a lorry and a tractor with trailer ........................... 76Figure 60: Refreshment of fuel-saving measures is necessary ....................................................... 78Figure 61: The driver is responsible for the successful implementation of these fuel-saving
measures. ....................................................................................................................... 79 Tables: Table 1: Fuel consumption for different agricultural works ........................................................... 10Table 2: Fuel consumption for different agricultural works ........................................................... 12
82
10. List of references
BRUNOTTE, J. , KORTE K. (2003): Bewertung von Systemen der Bodenbearbeitung in Fruchtfolgen mit Körnerraps und Körnerleguminosen. Jahresbericht der Bundesforschungsanstalt für Landwirtschaft (FAL) 2003, Bundesforschungsanstalt für Landwirtschaft, Bundesallee 50, 38116 Braunschweig, ISSN 0171-5801.
DEMMEL, M., KIRCHMEIER, H. , GEISCHEDER, R. (2004): Untersuchung des Leistungsbedarfes und der
Zerkleinerungswirkung von Kreiseleggen mit unterschiedlichen Kreiseldurchmessern. Institut für Landtechnik, Bauwesen und Umwelttechnik, Vöttinger Str. 36, 85354 Freising.
FICK, A., RECKLEBEN, Y. (2008): Kraftstoffverbrauchsmessung mit Ackerschleppern im Vergleich.
Sonderdruck aus der Kartei für Rationalisierung, Rationalisierungs-Kuratorium für Landwirtschaft (RKL), 24768 Rendsburg, www.rkl-info.de.
HANDLER, F., NADLINGER, M., BLUMAUER, E., PAAR, J., PÖLLINGER A. (2008): Rundballenpressen mit
variabler Presskammer – Leistungsbedarf, Ballendichte und Bröckelverluste. Schriftenreihe der ART, Nr. 7, Landtechnik im Alpenraum, CH-8356 Tänikon, Mai 2008.
HOLZ, W. (2006): Möglichkeiten zur Kraftstoffeinsparung in der Landwirtschaft. Sonderdruck aus der
Kartei für Rationalisierung 2.1.2.1, RKL, 24768 Rendsburg, Juli 2006. HÖNER, G. (2004): Besser Pflügen und 30% Kraftstoff sparen. Top Agrar, Heft 10, 2004. KTBL (2006): Betriebsplanung Landwirtschaft 2006/07. KTBL, Bartningstr. 49, 64289 Darmstadt, ISBN-
13: 978-3-939371-07-6. KALK, W.-D., HÜLSBERGEN, K.-J. (1999): Dieselkraftstoffeinsatz in der Pflanzenproduktion.
Landtechnik 54 (6), 332-333. KUTZBACH, H-D. (1989): Lehrbuch Agrartechnik Band 1: Allgemeine Grundlagen – Ackerschlepper –
Fördertechnik; Verlag Paul Parey 1989. LAMPEL, H. (2006): Was sagen die Leistungsdaten eines Traktors aus? Landwirtschaftliches Tagebuch
2007, Helgu Verlag, 2006. LANDIS, M. (2005): Leistungsangaben bei Traktoren. Referat bei der Firmentagung 2005,
Forschungsanstalt Agroscope Reckenholz-Tänikon ART, CH-8356 Ettenhausen. MACK, G., KRÄNZLEIN T. (2006): Der Energieverbrauch der Schweizer Landwirtschaft im
internationalen Vergleich. Vortragsunterlagen zur Informationstagung Agrarökonomie am 14. September 2006, Forschungsanstalt Agroscope Reckenholz-Tänikon ART, CH-8356 Ettenhausen.
MACK, G., ZIMMERMANN, A., KRÄNZLEIN T. (2008): Energieaufwand für die Bereitstellung von
Grund- und Kraftfutter. In Energieeffizient Landwirtschaft, KTBL-Schrift 463, Darmstadt, ISBN978-3-939371-59-5.

83
McLAUGHLIN, N.B., GREGORICH E.G., DWYER L.M., Ma B.L. (2002): Effect of organic and inorganic
soil nitrogen amendments on mouldboard plow draft. Soil & Tillage Research, Volume 64, Number 3, March 2002, pp. 211-219, as cited in Moitzi 2006.
MOITZI, G. (2005): Kraftstoffeinsatz in der Pflanzenproduktion. Institut für Landtechnik, Department
für nachhaltige Agrarsysteme, Universität für Bodenkultur, Wien Peter-Jordan-Straße 82, 1190 Wien.
MOITZI, G. (2006): Möglichkeiten zur Kraftstoffeinsparung – Richtiger Einsatz von Maschinen und
Geräten im Ackerbau. Ländlicher Raum – Online-Fachzeitschrift des Bundesministeriums für Land- und Forstwirtschaft, Umwelt und Wasserwirtschaft, Jahrgang 2006.
MÖLDER, R. (2005): Was bringen größere Häcksellängen beim Silieren von Mais? Profi, Heft 3/2005,
Landwirtschaftsverlag GmbH, 48048 Münster. MUMME, M. (2007): Kraftstoffverbrauch und Schlagkraft bei verschiedenen Bodenbearbeitungs- und
Bestellverfahren. DLG-Testzentrum Groß-Umstadt, Manuskript zum Vortrag, Strickhof Ackerbautag 15.08.2007.
ÖKL (2008): ÖKL-Richtwerte für die Maschinenselbstkosten 2008. Österreichisches Kuratorium für
Landtechnik und Landentwicklung, Gusshausstr. 6, 1040 Wien. ROSNER, J., ZWATZ, E., KLICK, A. (2007): Aspekte der Minimalbodenbearbeitung. Tagungsband ALVA
– Jahrestagung 2007, Arbeitsgemeinschaft für Lebensmittel-, Veterinär- und Agrarwesen, ISSN 1606-612X.
SAUTER, J., DÜRR L. (2005): Einfluss der Messerschärfe auf den Leistungsbedarf von Mähwerken und
Ballenpressen. FAT-Bericht 625, Agroscope FAT Tänikon, Eidgenössische Forschungsanstalt für Agrarwirtschaft und Landtechnik, CH-8356 Ettenhausen, 2005.
SCHMIDLIN, S. (2006): Vier Ladewagen im Vergleich. Sonderdruck Landfreund, 12/2006. SOMMER, C., VOSSHENRICH, H.-H. (2004): Bodenbearbeitung und Bestellung. Kapitel 4.5 in Precision
Agriculture – Ergebnisse des Verbundprojektes pre agro, KTBL, Bartningstr. 49, 64289 Darmstadt.
STATISTIK AUSTRIA (2007): Gesamtenergiebilanz 1970 – 2006 – Bereich Diesel. Statistik Austria, 1110
Wien. UPPENKAMP, N. (2006): DLG – Merkblatt 339, Dieseleinsparung in der Landwirtschaft.
Herausgegeben von der DLG e.V., Testzentrum Technik und Betriebsmittel, Ausschuss für Technik in der Pflanzlichen Produktion. DLG e.V. (Deutsche Landwirtschafts-Gesellschaft), Eschborner Landstrasse 122, 60489 Frankfurt am Main.
WEISS, J. (2003): Zugkraftbedarf bei verschiedenen Pflugscharen und gängigen Abwandlungen an
Verschleissteilen. RKL-Schrift, Rationalisierungs-Kuratorium für Landwirtschaft, Am Kamp 13, 24768 Rendsburg, April 2003.
VOLK, L. (2004): Bodenschonung mit Reifenregler – Technik und Wirtschaftlichkeit. Fachhochschule
Südwestfalen, Agrarwirtschaft Soest, Vortrag bei der DLG Wintertagung 2004, Berlin, 14.1.2004.

84
VOLK, L. (2006): FH Südwestfalen Soest, as cited in Uppenkamp (2006), Reifenwahl – was bringen
neue Reifenkonzepte, Landwirtschaftskammer Westfalen-Lippe, Münster.