d bjgeo d a d egeo - scielo · brazil is one of the largest gem-producing countries in the world...
TRANSCRIPT

Abstractreflectance spectroscopy is a fast tool for mineral identification and classification. We conducted spectral characterization of elbaite samples (n = 30) from Seridó Pegmatite Province, Borborema Province, NE Brazil, using a FieldSpec portable instrument and geochemical data from electron probe microanalysis. Visual interpretation of reflectance spectra reveals the absorption features in the visible to near infrared (350–1,200 nm) range related to the electronic transition processes of iron (e.g., ~720, ~1,180 nm), copper (e.g., ~694, ~922 nm) and man-ganese (e.g., ~400, ~520 nm) ions. In general, electron probe microanalysis data show correlation with the absorption features related to chromophore elements (e.g., Cu, Fe, Mn), but the complex crystal structure of the tourmalines also accounts for the generation of absorption features. Vibrational processes in the short-wave infrared (1,200–2,500 nm) spectral range appear associated with Mn-OH, OH, Al-OH, H2O and B-OH bonds. A statistical approach, using principal component analysis, was chosen for distinguishing tourmalines of different compo-sition. We discriminated tourmalines characterized by green, blue, blue-green, red/purple colors, as well as the colorless ones. This included the Paraíba tourmaline, a high value variety of elbaite that is the focus of exploration carried out in Seridó Pegmatite Province.
KEYWORDS: Reflectance; FieldSpec™; tourmalines; chromophore elements; principal component analysis technique.
DOI: 10.1590/2317-4889201920180113
ARTICLE
INTRODUCTIONGemology and Spectral Geology are two important
geological subareas that focus on the characterization and identification of minerals. The term Spectral Geology is related to the measurement and analysis of electromag-netic spectrum portions to discriminate spectral features of a surface material (Bedell et al. 2009, Geoscience Australia 2018), including punctual analysis of mineral assemblages and imaging of mineral and rock samples using reflec-tance and imaging spectroscopy (e.g., Ducart et al. 2006, Tappert et al. 2011, Swayze et al. 2014, Coulter et al. 2017, Carrino et al. 2018).
Based on the use of reflectance spectroscopy, one of the first studies focused on the characterization of gemstones was carried out by Martin et al. (1989), with the investigation of alexandrite, beryl, garnet, and other minerals.
Reflectance spectroscopy studies the interaction of the electromagnetic radiation with the matter, by recording the reflected energy in different spectrum regions, including visible to short-wave infrared (IR) wavelengths (350 to 2,500 nm). It is a non-destructive method that allows a fast analysis, without sample preparation, unlike other spectroscopic techniques, such as the absorption spectroscopy (Hunt 1977, 1979, Clark 1999). The interaction of the electromagnetic radiation with the matter depends on the chemical composition and crys-talline structure of minerals and rocks. Absorption features in the visible to near IR (VNIR, 350–1,200 nm) and short-wave IR (SWIR, 1,200–2,500 nm) spectral range are asso-ciated with electronic transition and vibrational processes, respectively. Specifically, broad absorption features in the VNIR range are related to transition metals (e.g., Fe, Cr, Mn, Cu), while molecular vibrational processes (e.g., H-O-H, OH-, Al-OH, Mn-OH, Fe-OH, S-O, C-O) are responsible for sharp absorption features in the SWIR range (Hunt 1977, 1979, Hunt & Ashley 1979, Clark et al. 1990, Thompson et al. 1999, Pontual et al. 2008).
Spectroscopic techniques, such as ultraviolet-visible (UV-Vis), IR and Raman spectroscopy, are commonly applied for tourmaline characterization (e.g., Manning 1969, 1973, Mattson & Rossman 1987, Rossman et al. 1991, Taran et al. 1993, Merkel & Breeding 2009). However, studies focused on tourmaline characterization using reflectance spectroscopy are limited (e.g., Bierwirth 2008, Zhang et al. 2008).
Linking gemology and spectral geology: a case study of elbaites from Seridó Pegmatite Province, Northeastern BrazilThais Andressa Carrino1* , Sandra de Brito Barreto1 , Paula Jussara Azevedo de Oliveira1 , José Ferreira de Araújo Neto1 , Aldine Maria de Lima Correia1
Brazilian Journal of Geology
SOCI
EDAD
E BRASILEIRA DE GEOLOG
IA
DESDE 1946
BJGEO
© 2019 The autors. This is an open access article distributed under the terms of the Creative Commons license.
1Laboratory of Gemology, Department of Geology, Universidade Federal de Pernambuco – Recife (PE), Brazil. E-mail: [email protected]
*Corresponding author.
Supplementary data
Supplementary data associated with this article can be found in the online version: Supplementary Table A1, Supplementary Table A2, Supplementary Table A3, Supplementary Table A4 and Supplementary Table A5.
1

Bierwirth (2008) characterized elbaite, schorlite, and dravite tourmalines from Australia and identified the color variation related to chromophore elements (e.g., Fe, Mn, Cu) based on the absorption features in the VNIR range, includ-ing the discrimination between the three types of tourmalines through absorption features associated with molecular vibra-tional processes of water, OH-, metal-OH in the SWIR range. Zhang et al. (2008) used the reflectance spectroscopy (and other techniques, such as Mössbauer and IR spectroscopy) for characterizing tourmalines from pegmatites in northwestern China. Like Bierwirth (2008), Zhang et al. (2008) discrimi-nated tourmaline endmembers (elbaite, schorlite, and dravite) related to the compositional zoning of pegmatites, the contact zone, and the altered country rock by the variable contents of Fe2+, Fe3+, OH- and water molecules of tourmalines linked by the diagnostic absorption features of metals and molecules in the VNIR-SWIR range.
Brazil is one of the largest gem-producing countries in the world accounting for a large number of tourma-lines, exploited mainly from the Borborema Province (Almeida et al. 1981), located in northeastern Brazil (Fig. 1). The characterization and classification of gem-stones from this region are economically important mainly due to the presence of Paraíba tourmaline, marked by high-valued neon blue-green color (Rossman et al. 1991, Shigley et al. 2001).
This paper illustrates the spectral characterization of elbaite tourmalines from northeastern Brazil, focusing on the link between Gemology and Spectral Geology. For this purpose, reflectance spectroscopy was used to produce a spectral library of elbaites and complement previous studies (e.g., Bierwirth 2008, Zhang et al. 2008) on the relevance of this technique for gemstone characterization.
GEOLOGICAL SETTINGThe Borborema Province, located in Northeastern Brazil
(Fig. 1A), is a complex orogenic system formed by accretion of crustal fragments during the late Neoproterozoic as a result of Western Gondwana’s amalgamation process (Almeida et al. 1981). This province is made up of a Paleoproterozoic basement, Archean nuclei and Meso- to Neoproterozoic supracrustal rocks affected by deformational, metamorphic and magmatic events during the Brasiliano-Pan-African Cycle (650–500 Ma; Brito Neves et al. 2000, Van Schmus et al. 2008, Santos et al. 2010). The Borborema Province is conventionally subdivided into five sub-provinces, which are mostly bounded by lineaments and shear zones, from North to South: Médio Coreaú, Ceará Central, Rio Grande do Norte, Transversal and Meridional sub-provinces (Fig. 1B).
Within the Rio Grande do Norte Sub-province, the Seridó Fold Belt (SFB) is the main area of gem explora-tion (Fig. 1B). According to Santos et al. (2014), the SFB is an Ediacaran meta-sedimentary belt of the Seridó Group, composed of a meta-volcano-sedimentary unit (Serra dos Quintos Formation); a platform carbonaceous-metapelitic unit ( Jucurutu Formation); a quartzite and meta-conglom-erate unit (Equador Formation), and a sequence of schists of turbiditic nature (Seridó Formation) (Fig. 2). The Seridó Group was deformed and metamorphosed to lower amphi-bolite facies grade by the transcurrent Brasiliano Event and was intruded by numerous granites and pegmatites (Silva et al. 1995, Santos et al. 2014).
This geographic area with high concentration of pegma-tites constitutes the Seridó Pegmatite Province (Santos et al. 2014), which was previously known as Borborema Pegmatite Province (e.g., Beurlen et al. 2009) and was first described by Scorza (1944). Since then, many authors have described its
A: Amazon Craton; BP, NP, CP: Borborema, Nigeria and Cameroon provinces; K: Kalahari; RP: Rio de La Plata; SA: Sahara Metacraton; SFC: São Francisco/Congo Craton; WA: West Africa Craton (modified from Neves & Alcantara 2010).Figure 1. (A) Pre-rift reconstruction of Western Gondwana showing the main cratons and orogens. (B) Location of the Seridó Fold Belt (red area) in Rio Grande do Norte Sub-province of the Borborema Province, including the sampled region of the Seridó Pegmatite Province (modified from Van Schmus et al. 2008).
A B
2
Braz. J. Geol. (2019), 49(2): e20180113

potential for mineralization of Ta-Nb, Be, Sn, Li and gem-qual-ity minerals, such as tourmaline, euclase, and beryl (Silva et al. 1995, Santos et al. 2014). Silva et al. (1995) suggest that the majority of the mineralized pegmatites (~80%) intrude into quartz-biotite schists of the upper Seridó Formation, and 11% are intruded into the muscovite quartzites of the Equador Formation. However, most of these pegmatite bodies have an erratic distribution of gemstones and mineralization that explains why exploration in this area is predominantly per-formed by informal mining, i.e., garimpos.
The elbaite-bearing pegmatites described in this paper are Capoeiras, Quintos, Batalha, and Bulandeira (Fig. 2). They were emplaced in country rocks from the Equador Formation (quartz-ite and meta-conglomerate) and follow a general N-NW trend associated with regional shear zones (Barreto 1999).
The Capoeiras Pegmatite comprises heterogeneous bodies, with 3 to 9-m thickness, along azimuth 110–120º. The miner-alogical assemblages are composed of milky, pink and smoky quartz, albite, cleavelandite, muscovite, biotite, garnet, schor-lite, and elbaites (Barreto 1999). The zoning of pegmatites includes: the external intermediate zone I, with mineral assem-blage consisting of muscovite, quartz and albite; the interme-diate zone II, or albite zone, marked by centimeter scale albite crystals; and the inner zone, with massive milky quartz core. Replacement bodies occur in the intermediate zone II, near the contact with the quartz core. These bodies are composed of green muscovite, quartz, albite/cleavelandite and lepido-lite, as well as tourmaline with schorlite crystals arranged per-pendicular to the surrounding albite crystals (Barreto 1999, Soares et al. 2007). Red, green, blue, and blue-green elbaites (sometimes replaced by lepidolite) are situated in the inner
zone and in the contact of that and the intermediate zone II (Figs. 3A and 3B).
The Quintos Pegmatite is another heterogeneous tabular body like the Capoeiras pegmatite bodies (Soares et al. 2007). The intermediate zone I of the Quintos Pegmatite is composed of quartz, biotite, muscovite, and feldspar (microcline and albite). Centimeter to meter scale feldspar (microcline and albite) crystals occur in the intermediate zone II (Barreto 1999). The inner zone (core) comprises milky quartz, and replacement bodies marked by albite/cleavelandite, milky quartz, lepido-lite, microcline, spodumene, and green, blue, blue-green and pink elbaites (Barreto 1999). The elbaites are radially concen-trated in the core and in the contact between the core and the intermediate zone II, and they are commonly replaced by lep-idolite (Fig. 3C). Other minerals, such as gahnite, schorlite, columbite, apatite, and cookeite, were recognized by Soares (2004) and Soares et al. (2007).
The Batalha Pegmatite comprises parallel and subparallel tabular bodies, with 20 cm to 4 m thickness, along azimuth 120–130º (Barreto 1999). The bodies are homogeneous and kaolinized (Fig. 3D), and they are also composed of milky, hyaline, smoky and pink quartz, muscovite, lepidolite, schor-lite, and green, blue-green, blue, red, purple, colorless elbaites, as well as kaolinite and columbite/tantalite (Barreto 1999). The elbaite crystals are commonly fractured and replaced by lepidolite. Gemological crystals are associated with smoky quartz, lepidolite, and kaolinite pockets (Fig. 3E).
Located in the eastern margin of the Queimadas Ridge, the Bulandeira Pegmatite is a homogeneous and kaolinized body, with a general strike along azimuth 120º. It is mainly composed of pink and milky quartz, biotite, muscovite, albite, garnet (almandine), schorlite, and elbaites (e.g., green, red; Barreto 1999).
Elbaite tourmalinesTourmaline is a complex silicate containing boron and
aluminum, marked by trigonal crystal system and, commonly, by prismatic habit. The general chemical formula comprises XY3Z6[T6O18][BO3]3V3W, in which X = vacancy, Na+, K+, Ca2+, Pb2; Y = Li+, Mg2+, Fe2+, Mn2+, Cu2+, Al3+, V3+, Cr3+, Fe3+, Mn3+, Ti4+; Z = Mg2+, Fe2+, Al3+, V3+, Cr3+, Fe3+; T = Si4+, B3+, Al3+; B = B3+; V = OH-, O2-; W = OH-, F-, O2-. Specifically, elbaite tourma-line is the endmember characterized by Li and Al ions, occu-pying the Y site in a 1:1 ratio (Hawthorne & Dirlam 2011).
Elbaites from the Seridó Pegmatite Province were pre-viously studied by Barreto (1999), focusing on chemical, optical and structural characterization related to Capoeiras, Quintos, Batalha and Bulandeira pegmatites (Fig. 2). Barreto (1999) analyzed 70 elbaites samples from the four pegmatite bodies using UV-Vis and IR spectroscopy, thermo-gravimet-ric analysis and differential thermal analysis (TGA-DTA), electron probe microanalysis (EPMA), crystallographic structural refinement, and Raman spectroscopy. The author determined values of dominant wavelength and discussed the role of chromophore and non-chromophore elements (e.g., Fe, Mn, Cu, Zn) related to the main elbaite color groups: green, blue, blue-green, red, purple, and colorless.
Figure 2. Geological map of the study area (modified from Angelim et al. 2004 apud Silva 2009), including the location of the elbaite samples from Capoeiras, Quintos, Batalha and Bulandeira pegmatites, Rio Grande do Norte (RN) and Paraíba (PB) states, Brazil.
3
Braz. J. Geol. (2019), 49(2): e20180113

These color groups were defined based on the multivariate analysis of chemical data, which were later integrated with UV-Vis and IR absorption spectra interpretations for color discussion. The main considerations of Barreto (1999) are summarized in Table 1.
METHODOLOGYThirty elbaite tourmalines sampled by Barreto (1999) were
selected for the acquisition of reflectance spectroscopy measure-ments (Tab. 2). Reflectance spectra were measured using the FieldSpec®4 Standard Resolution spectroradiometer (Analytical
Spectral Devices) provided by the Institute of Geosciences of the Universidade Estadual de Campinas (UNICAMP), Brazil. The spectroradiometer records spectra in 2,151 channels with wavelengths ranging from 350 to 2,500 nm (VNIR-SWIR). The spectral resolution is 1.4 nm for the 350–1,000 nm range, and 1.1 nm for 1,001–2,500 nm (Malvern Panalytical 2018). We used a contact probe that has an internal light source and ~20 mm spot size, and the data were calibrated using a Spectralon® white plate.
Between 3 to 10 reflectance spectra measurements from vary-ing crystal faces were taken from each sample. Supplementary photos from sampled tourmalines were taken using a Canon
A
C
E
B
D
Source: photos provided by Prof. Sandra Barreto.Figure 3. Examples of Paraíba tourmalines (blue-green elbaites) partially replaced by lepidolite in the contact between the intermediate zone II and the milky quartz core of the Quintos Pegmatite (A), and in the inner zones of the Capoeiras (B) and Quintos pegmatites (C). The Batalha Pegmatite is marked by kaolinized body (D), and kaolinite and smoky quartz pockets (E), in which the best elbaite samples are found.
4
Braz. J. Geol. (2019), 49(2): e20180113

EOS 1100D digital camera, coupled to a Schneider gemological microscope (Stemi 2000-C) from the Gemological Laboratory of the Universidade Federal de Pernambuco (Fig. 4).
Mineral compositions were determined by Barreto (1999) using a CAMECA SX50 electron microprobe from the Scientific-Technical Services of Barcelona University. Accelerating voltage of 6 and 25 kV, sample current of 15 and 30 nA, and crystals TAP, PC3, LIF and PET were employed. Internal standards were produced by Barreto (1999) using ten optical homogeneous gemological elbaite samples with different colors from the same studied peg-matites, in order to guarantee a more accurate analysis. Each sample was divided into two parts: one used to obtain minor- and trace-element concentration by inductively coupled plasma mass spectrometry (ICP-MS) and other to construct the EPMA internal standard. A Perkin Elmer Elan 6000 ICP-MS from the Scientific-Technical Services of Barcelona University was used for the analysis of the ten elbaites samples (previously submitted to the acidic attack using HF, HClO4 and HNO3).
EPMA data were obtained for all tourmalines, except for the samples B4VA and C1VC. The detection limits using the elbaite internal standards were 0.005 wt.% TiO2, 0.0195 wt.% Bi2O3, 0.0066 wt.% MgO, 0.172 wt.% CaO, 0.0141 wt.% MnO, 0.0258 wt.% FeO total, 0.0115 wt.% CuO, 0.012 wt.% ZnO, and 0.0126 wt.% Na2O. The H2O values were quantified by the loss of water obtained from the TGA-DTA method, considering standard samples of structural chemical formulas. The TGA-DTA data were obtained in seven elbaites samples using the Netzsch Thermische Analyse STA 409 from the Department of Crystallography, Mineralogy and Mineral Deposits from Barcelona University. Although the scope of the present work is on the combined approach using chromophore element data
and reflectance spectroscopy, complete mineral chemistry data related to the 28 elbaites are shown due to unpublished data from Barreto (1999) (Suppl. Tabs. A1-A5).
Tourmaline samples were sub-divided into six color groups, using Barreto (1999) as a reference guide: blue, green, blue-green (Paraíba tourmaline), red, purple, colorless (Tab. 2). Average spectral curves were calculated for each sample, and the reflectance spectra investigation was done visually, with the interpretation of the main absorption features. As to the VNIR range, the main absorptions related to chromophore elements were associated with EPMA data. The continuum removal technique (hull quotient) was also applied to mea-sure the absorption depth of the chromophore element (e.g., Cu) and to estimate its relative content. This technique normalizes the reflectance spectrum using a mathematical function that defines a convex hull fitting the spectral curve. The continuum removal is carried out by dividing the reflec-tance values of the measured spectrum by that of the contin-uum hull, enhancing the absorption features (Clark & Roush 1984, Clark et al. 2003).
In addition to visual inspection of the reflectance spectra, a multivariate statistical analysis was carried out as a fast way to char-acterize and classify elbaites. The principal component analysis (PCA) is a useful tool to reduce many variables (Pearson 1901) and was used to simplify reflectance spectra data from the elbaites, grouping samples characterized by diagnostic absorptions features related to determined ions (Fe, Cu, Mn). PCA was performed on a correlation matrix of the original data, generating new uncor-related variables, which are also called principal components (PCs). In this process, each uncorrelated variable (PCs) is characterized by eigenvalues (% of variance) and eigenvector loadings, i.e., lin-ear combinations of weighted original data in the PCs. Thus, the PCA technique allows the orthogonal linear transformation of
Table 1. Summary of considerations done by Barreto (1999) on the color characterization of elbaites from the Seridó Pegmatite Province.
Absorption bands/features and color mechanism
Elbaite group Subgroup
Blue and green
Blue and greenish blueE//c spectra: two broad bands at 720 and 1,118–1,140 nm assigned to spin-allowed 5T2 5E transitions of Fe2+ ions, and/or to Zn2+ d sub-levels transitions, both located in Y site.E⊥c spectra: two broad bands at 720–730 and 1,120 nm attributed to interactions in Fe2+
Y-Fe3+Y and Zn2+
Y-Fe3+Y centers,
which intensify the transitions in the surrounding Fe2+Y ions or induce possible internal transitions in Zn2+ ions.
Weak bands, at 418 and 450 nm, attributed to Mn3+, and a band at 560 nm related to Fe2+Y-Fe3+
Y interactions.
Green (Fe-Mn-bearing elbaites)Weak bands located at 418 and 465 nm assigned, respectively, to Mn2+ and Fe3+ ions. Broad bands at 718-720 nm and 1,118-1,140 nm, in E//c polarization, were attributed, essentially, to 5T2 5E transitions of Fe2+ ions in the Y octahedral. In the E⊥c polarization, Fe2+
Y - Fe3+Y center was identified.
Turquoise-green and light-green (Cu-Mn-bearing elbaites)Bands at 700–718 nm and 930–940 nm related to spin-allowed 5T2 5E transitions of Cu2+ ions situated in Y octahedral sites.
RedMain bands at 480 nm (E//c) and 520–530 nm (E⊥c) attributed to d-d transitions of Mn3+ ions, located in the Y octahedral. Bands at 700–725 nm (E//c) and 725 nm (E⊥c) are related to d-d transitions of Fe2+ ions also in the Y octahedral. Weak bands at 450–460 and 725 nm attributed to transitions of Fe3+ in iron-bearing elbaites, or to color centers (electron trap) related to precursor Mn4+ ions that undergo transitions to Mn3+, in red elbaites marked by low contents of manganese and iron.
PurpleBands at 520 nm attributed to Mn3+ and at 720 and 920 nm assigned to d-d transitions of Cu2+ ions.
ColorlessAbsence of expressive absorption bands. Very weak bands at 420-450 nm and 720 nm, probably assigned to Mn2+/Fe2+ and Cu2+/Fe2+.
5
Braz. J. Geol. (2019), 49(2): e20180113

the original data into a new coordinate system, maximizing the variance in the PC1, characterized by the highest eigenvalue that decreases with the higher order of the PCs (Mather 2004). Elbaite main color groups can be identified through the new vari-ables (PCs) based on the interpretation of the high eigenvectors related to specific spectral bands that characterize the absorption features related to chromophore elements. Specifically, average reflectance spectra (n = 30) in the VNIR range (350–1,200 nm) were selected by characterizing the color due to the presence of absorption features associated with the chromophore elements.
RESULTS AND DISCUSSIONElbaite samples are shown in Figure 4. The reflectance spec-
tra allow the characterization of different types of tourmalines,
mainly by the interpretation of absorption features in the VNIR range (Figs. 5, 6, 7, 8, 9 and 10). The spectral characterization of the green, blue, blue-green, red, purple and colorless groups is described below.
VNIR range
Blue, green and blue-green elbaitesBlue elbaites have an average of 3.475 wt.% FeO, 0.901
wt.% ZnO, 0.001 wt.% CuO, and 1.232 wt.% MnO (Suppl. Tab. A1). Two broad absorption bands exhibit maximum absorption at 720–730 nm and ~1,180 nm (Fig. 5) related to electronic transitions of Fe2+ ions in the Y octahedral site (Faye et al. 1974, Smith 1978, Mattson & Rossman 1987, Taran et al. 1993, Barreto 1999). Additionally, weak absorption features
Table 2. Relation of elbaite samples and their color classification carried out by Barreto (1999) based on the Colored Stone Grading System (PANTONE GIA GemStet method). The main color groups considered in this article are also shown.
Sample Pegmatite Hue Intensity Saturation Color group used in this article (simplified from Barreto 1999)
B1VR*
Bulandeira
Bluish green Dark Slightly grayish Green
Slightly purplish red Light Slightly brownish Red
B2VO Yellowish green Medium dark Moderately strong Green
B4VA Bluish green Dark Slightly grayish Green
B5VA Strongly bluish green Medium Slightly grayish Green
B6VA Bluish green Dark Slightly grayish Green
B8Vr Strongly bluish green Very dark Slightly grayish Green
B11R Red Dark Slightly brownish Red
B14R Red Medium Brownish Red
C1VC
Capoeiras
Slightly bluish green Medium Slightly grayish Green
C1VC(r) Slightly bluish green Medium light Slightly grayish Green
C2VC Green Medium light Slightly grayish Green
C3VC Bluish green Light Slightly grayish Green
C4T Blue-green Medium light Moderately strong Blue-green**
C6A Greenish blue Very dark Grayish Blue
C7A Blue Very dark Slightly grayish Blue
C8A Blue Very dark Slightly grayish Blue
C9A Greenish blue Very dark Grayish Blue
C12R Reddish purple Light Moderately strong Red
C14T Blue-green Medium light Slightly grayish Blue-green**
Q2VQuintos
Green Medium Grayish Green
Q11A Blue Very dark Slightly grayish Blue
S6VA
São José da Batalha
Slightly greenish blue Very dark Slightly grayish Blue
S13R Red Medium Grayish Red
S14R Red Very light Brownish Red
S15R Red Light Slightly grayish Red
S18C Colorless - - Colorless
S19C Colorless - - Colorless
S20C Colorless - - Colorless
S25A Greenish blue Very dark Grayish Blue
S27L Purple Medium dark Moderately strong Purple
*Bicolor tourmaline: green slice was analyzed with reflectance spectroscopy; **blue-green color group is related to the turquoise green elbaites (Paraíba-type) identified by Barreto (1999).
6
Braz. J. Geol. (2019), 49(2): e20180113

Figure 5. Stacked reflectance spectra of the blue elbaites and indication of the main absorption features.
B: Bulandeira pegmatite; C: Capoeiras pegmatite; Q: Quintos pegmatite; S: Batalha pegmatite. Figure 4. Natural raw blue, green, blue-green, red, purple and colorless elbaite samples analyzed through reflectance spectroscopy. Dark-field illumination.
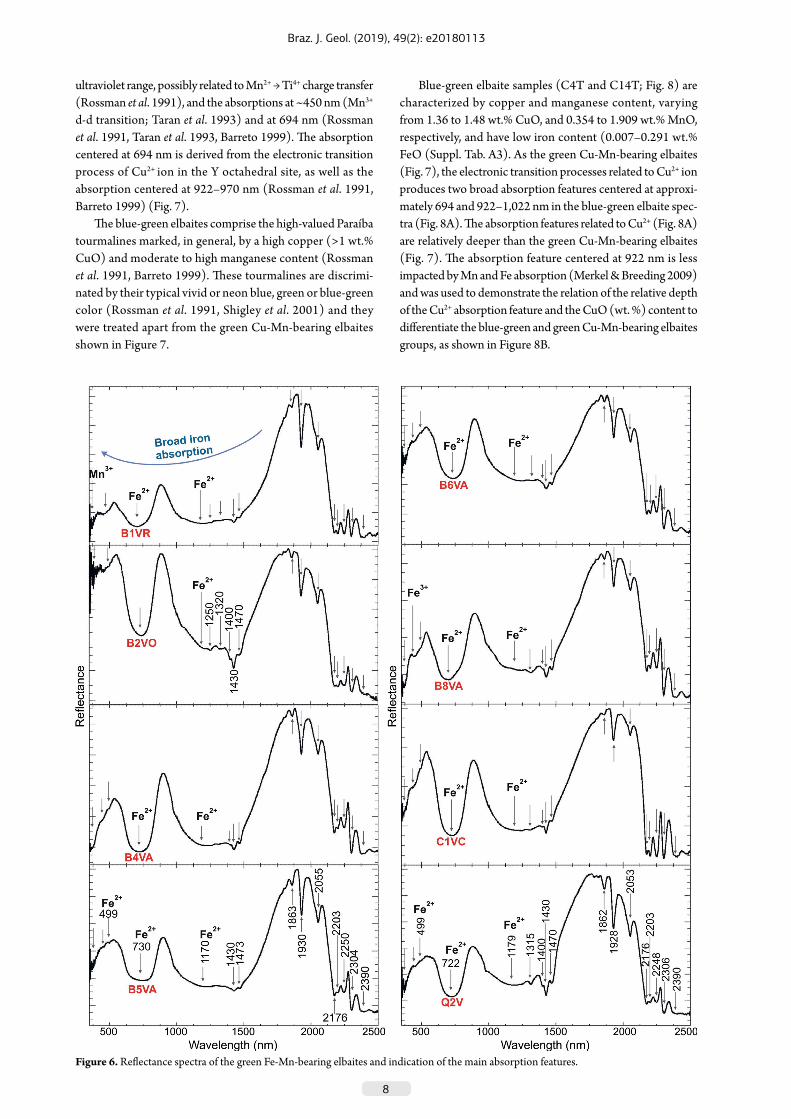
centered at ~415 and ~455 nm can be assigned to electronic transitions of Mn3+ ions (Taran et al. 1993, Barreto 1999), while Barreto (1999) attributed the feature centered at ~560 nm to Fe2+. Green group elbaites are subdivided into two types: green Fe-Mn-bearing elbaites, with average of 1.663 wt.% MnO, of 2.662 wt.% FeO, 0.010 wt.% CuO, and 0.068 wt.% ZnO; and green Cu-Mn-bearing elbaites, with average of 0.252 wt.% FeO, 0.220 wt.% ZnO, 0.970 wt.% CuO, and 2.377 wt.% MnO (Suppl. Tab. A2).
The reflectance spectra of the green Fe-Mn-bearing elbaites (Fig. 6) show similarities with the blue group (Fig. 5). The main deeper absorption features are at 722–730 and ~1,170–1,180 nm (Fe2+) and weak absorptions at ~465 and ~500 nm, which are possibly related to an electronic transition process of Fe3+ and Fe2+, respectively (Barreto 1999, Merkel & Breeding 2009). However, compared to the green Fe-Mn-bearing elbaites, the blue color elbaites (Fig. 5) have higher zinc content (up to 2.708 wt.% ZnO; Suppl. Tab. A1), which is an element that modifies the crystalline structural arrangement and occupancy of the Y site. This was previously observed by Barreto (1999), who identified the possible role of zinc as another relevant ele-ment (non-chromophore) influencing the mechanism for the blue color generation in ferric elbaites (Tab. 1).
For the green Cu-Mn-bearing elbaites, the green color is attributed to the high content of manganese and copper asso-ciated with: broad absorption feature centered at ~400 nm to
7
Braz. J. Geol. (2019), 49(2): e20180113
ultraviolet range, possibly related to Mn2+ → Ti4+ charge transfer (Rossman et al. 1991), and the absorptions at ~450 nm (Mn3+
d-d transition; Taran et al. 1993) and at 694 nm (Rossman et al. 1991, Taran et al. 1993, Barreto 1999). The absorption centered at 694 nm is derived from the electronic transition process of Cu2+ ion in the Y octahedral site, as well as the absorption centered at 922–970 nm (Rossman et al. 1991, Barreto 1999) (Fig. 7).
The blue-green elbaites comprise the high-valued Paraíba tourmalines marked, in general, by a high copper (>1 wt.% CuO) and moderate to high manganese content (Rossman et al. 1991, Barreto 1999). These tourmalines are discrimi-nated by their typical vivid or neon blue, green or blue-green color (Rossman et al. 1991, Shigley et al. 2001) and they were treated apart from the green Cu-Mn-bearing elbaites shown in Figure 7.
Blue-green elbaite samples (C4T and C14T; Fig. 8) are characterized by copper and manganese content, varying from 1.36 to 1.48 wt.% CuO, and 0.354 to 1.909 wt.% MnO, respectively, and have low iron content (0.007–0.291 wt.% FeO (Suppl. Tab. A3). As the green Cu-Mn-bearing elbaites (Fig. 7), the electronic transition processes related to Cu2+ ion produces two broad absorption features centered at approxi-mately 694 and 922–1,022 nm in the blue-green elbaite spec-tra (Fig. 8A). The absorption features related to Cu2+ (Fig. 8A) are relatively deeper than the green Cu-Mn-bearing elbaites (Fig. 7). The absorption feature centered at 922 nm is less impacted by Mn and Fe absorption (Merkel & Breeding 2009) and was used to demonstrate the relation of the relative depth of the Cu2+ absorption feature and the CuO (wt. %) content to differentiate the blue-green and green Cu-Mn-bearing elbaites groups, as shown in Figure 8B.
Figure 6. Reflectance spectra of the green Fe-Mn-bearing elbaites and indication of the main absorption features.
8
Braz. J. Geol. (2019), 49(2): e20180113
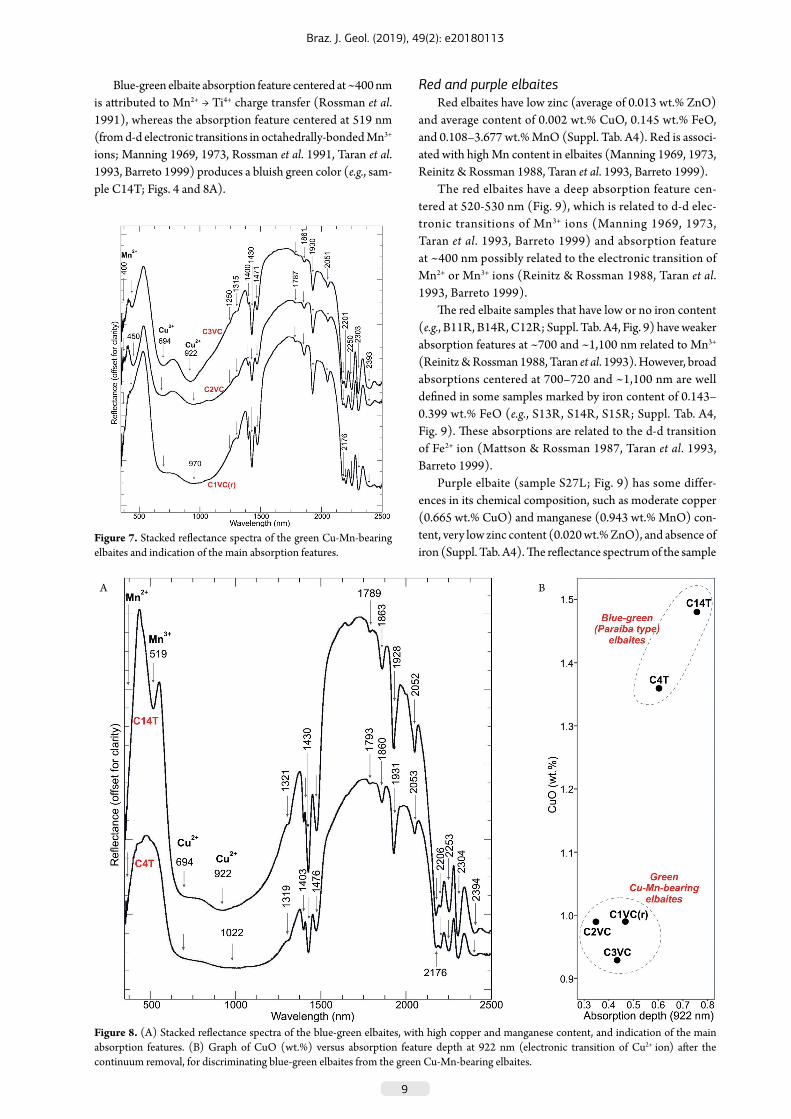
Figure 7. Stacked reflectance spectra of the green Cu-Mn-bearing elbaites and indication of the main absorption features.
Figure 8. (A) Stacked reflectance spectra of the blue-green elbaites, with high copper and manganese content, and indication of the main absorption features. (B) Graph of CuO (wt.%) versus absorption feature depth at 922 nm (electronic transition of Cu2+ ion) after the continuum removal, for discriminating blue-green elbaites from the green Cu-Mn-bearing elbaites.
A B
Blue-green elbaite absorption feature centered at ~400 nm is attributed to Mn2+ → Ti4+ charge transfer (Rossman et al. 1991), whereas the absorption feature centered at 519 nm (from d-d electronic transitions in octahedrally-bonded Mn3+ ions; Manning 1969, 1973, Rossman et al. 1991, Taran et al. 1993, Barreto 1999) produces a bluish green color (e.g., sam-ple C14T; Figs. 4 and 8A).
Red and purple elbaitesRed elbaites have low zinc (average of 0.013 wt.% ZnO)
and average content of 0.002 wt.% CuO, 0.145 wt.% FeO, and 0.108–3.677 wt.% MnO (Suppl. Tab. A4). Red is associ-ated with high Mn content in elbaites (Manning 1969, 1973, Reinitz & Rossman 1988, Taran et al. 1993, Barreto 1999).
The red elbaites have a deep absorption feature cen-tered at 520-530 nm (Fig. 9), which is related to d-d elec-tronic transitions of Mn3+ ions (Manning 1969, 1973, Taran et al. 1993, Barreto 1999) and absorption feature at ~400 nm possibly related to the electronic transition of Mn2+ or Mn3+ ions (Reinitz & Rossman 1988, Taran et al. 1993, Barreto 1999).
The red elbaite samples that have low or no iron content (e.g., B11R, B14R, C12R; Suppl. Tab. A4, Fig. 9) have weaker absorption features at ~700 and ~1,100 nm related to Mn3+ (Reinitz & Rossman 1988, Taran et al. 1993). However, broad absorptions centered at 700–720 and ~1,100 nm are well defined in some samples marked by iron content of 0.143–0.399 wt.% FeO (e.g., S13R, S14R, S15R; Suppl. Tab. A4, Fig. 9). These absorptions are related to the d-d transition of Fe2+ ion (Mattson & Rossman 1987, Taran et al. 1993, Barreto 1999).
Purple elbaite (sample S27L; Fig. 9) has some differ-ences in its chemical composition, such as moderate copper (0.665 wt.% CuO) and manganese (0.943 wt.% MnO) con-tent, very low zinc content (0.020 wt.% ZnO), and absence of iron (Suppl. Tab. A4). The reflectance spectrum of the sample
9
Braz. J. Geol. (2019), 49(2): e20180113
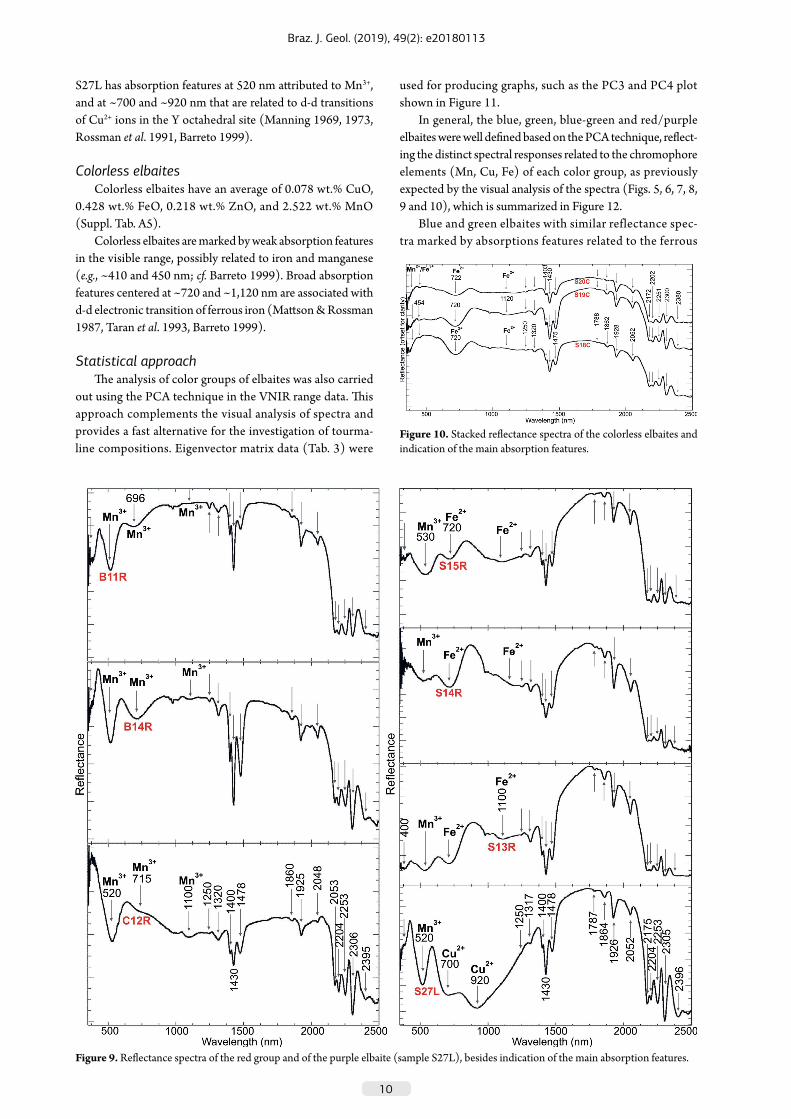
Figure 9. Reflectance spectra of the red group and of the purple elbaite (sample S27L), besides indication of the main absorption features.
Figure 10. Stacked reflectance spectra of the colorless elbaites and indication of the main absorption features.
S27L has absorption features at 520 nm attributed to Mn3+, and at ~700 and ~920 nm that are related to d-d transitions of Cu2+ ions in the Y octahedral site (Manning 1969, 1973, Rossman et al. 1991, Barreto 1999).
Colorless elbaitesColorless elbaites have an average of 0.078 wt.% CuO,
0.428 wt.% FeO, 0.218 wt.% ZnO, and 2.522 wt.% MnO (Suppl. Tab. A5).
Colorless elbaites are marked by weak absorption features in the visible range, possibly related to iron and manganese (e.g., ~410 and 450 nm; cf. Barreto 1999). Broad absorption features centered at ~720 and ~1,120 nm are associated with d-d electronic transition of ferrous iron (Mattson & Rossman 1987, Taran et al. 1993, Barreto 1999).
Statistical approachThe analysis of color groups of elbaites was also carried
out using the PCA technique in the VNIR range data. This approach complements the visual analysis of spectra and provides a fast alternative for the investigation of tourma-line compositions. Eigenvector matrix data (Tab. 3) were
used for producing graphs, such as the PC3 and PC4 plot shown in Figure 11.
In general, the blue, green, blue-green and red/purple elbaites were well defined based on the PCA technique, reflect-ing the distinct spectral responses related to the chromophore elements (Mn, Cu, Fe) of each color group, as previously expected by the visual analysis of the spectra (Figs. 5, 6, 7, 8, 9 and 10), which is summarized in Figure 12.
Blue and green elbaites with similar reflectance spec-tra marked by absorptions features related to the ferrous
10
Braz. J. Geol. (2019), 49(2): e20180113

Table 3. Eigenvector matrix produced by principal component analysis (PCA) technique applied in the VNIR reflectance data of 30 elbaite samples.
Sam
ple
PC1
PC2
PC3
PC4
PC5
PC6
PC7
PC8
PC9
PC10
PC11
PC12
PC13
PC14
PC15
PC16
PC17
PC18
PC19
PC20
PC21
PC22
PC23
PC24
PC25
PC26
PC27
PC28
PC29
PC30
B1V
R
0.33
7
0.91
8
0.03
8
-0.1
45
0.01
6
0.01
9
0.00
5
0.00
2
0.12
1
-0.0
02
0.04
2
0.02
9
0.04
9
-0.0
26
-0.0
17
-0.0
07
0.00
8
-0.0
01
-0.0
02
-0.0
02
0.00
2
-0.0
02
-0.0
03
-0.0
01
-0.0
02
0.00
1
-0.0
01
0.00
1
0.00
0
0.00
1
B2VO
0.84
4
0.47
4
0.13
8
-0.1
48
-0.0
76
0.00
4
-0.1
04
-0.0
20
0.01
4
-0.0
11
-0.0
23
-0.0
54
-0.0
08
-0.0
16
0.00
3
0.02
0
0.02
2
0.01
3
-0.0
09
0.00
0
0.00
2
0.00
4
-0.0
03
0.00
0
-0.0
01
-0.0
05
0.00
1
0.00
0
0.00
0
0.00
1
B4VA
0.41
8
0.87
4
-0.1
28
-0.0
89
-0.1
63
-0.0
81
0.03
4
0.05
5
-0.0
05
-0.0
09
-0.0
01
0.00
1
-0.0
15
0.01
4
-0.0
08
0.00
0
-0.0
03
-0.0
02
0.01
0
0.00
0
-0.0
05
-0.0
05
0.00
3
0.00
2
-0.0
01
-0.0
01
0.00
1
0.00
3
-0.0
03
0.00
6
B5VA
0.81
2
0.54
1
-0.0
23
-0.1
30
-0.0
98
-0.1
23
0.04
1
0.01
6
0.00
8
0.02
5
0.03
2
0.00
0
-0.0
09
0.02
9
-0.0
10
0.00
5
0.00
0
0.00
9
0.00
6
-0.0
05
0.00
7
-0.0
03
-0.0
01
0.00
3
-0.0
08
0.00
0
-0.0
04
-0.0
05
0.00
1
-0.0
03
B6VA
0.72
9
0.66
1
-0.0
32
-0.1
15
-0.0
97
-0.0
70
-0.0
17
0.03
3
-0.0
04
0.00
2
0.02
1
0.00
2
-0.0
14
0.00
8
-0.0
11
0.00
5
-0.0
03
-0.0
04
-0.0
17
0.00
3
0.00
3
-0.0
07
0.01
0
-0.0
07
0.00
8
0.00
3
0.00
0
0.00
3
0.00
0
-0.0
02
B8VA
0.26
9
0.93
6
-0.1
53
-0.0
49
-0.0
58
-0.0
17
0.10
6
0.03
2
0.07
3
0.00
5
-0.0
41
0.02
6
-0.0
20
0.00
5
0.02
5
-0.0
09
0.01
3
-0.0
18
-0.0
01
0.00
2
0.00
4
0.00
6
-0.0
06
-0.0
04
0.00
2
0.00
1
0.00
2
-0.0
03
0.00
1
0.00
0
B11R
-0.8
18
0.43
8
0.06
0
0.30
4
0.02
4
-0.1
66
-0.0
50
-0.0
46
0.07
4
0.04
9
0.02
6
-0.0
02
0.01
5
0.02
3
0.02
3
-0.0
02
0.00
8
0.01
4
0.00
3
-0.0
01
-0.0
07
0.00
8
0.00
6
0.00
1
0.00
3
0.00
3
-0.0
01
0.00
3
0.00
1
0.00
0
B14R
-0.1
34
0.25
6
0.52
9
0.75
4
-0.2
17
-0.1
12
0.04
5
0.03
2
0.01
6
0.02
3
-0.0
69
0.00
2
0.01
2
-0.0
02
-0.0
11
0.00
1
-0.0
12
0.00
0
-0.0
08
-0.0
01
0.00
4
-0.0
01
-0.0
04
0.00
2
0.00
0
-0.0
03
0.00
1
0.00
0
0.00
0
0.00
0
C1V
C
0.74
5
0.63
0
-0.1
48
-0.0
77
-0.0
71
0.03
5
-0.0
49
0.09
5
0.00
8
-0.0
06
-0.0
15
-0.0
41
0.00
6
-0.0
14
0.00
3
0.00
4
-0.0
04
0.00
3
0.00
8
0.00
0
0.00
6
0.00
2
0.00
0
-0.0
08
-0.0
05
-0.0
03
0.01
0
0.00
4
0.00
2
-0.0
01
C1V
C(r
)
0.91
2
-0.2
22
-0.3
17
0.10
5
0.01
1
0.04
6
0.04
2
0.03
2
0.02
9
0.03
2
0.01
2
-0.0
15
0.01
0
0.01
5
-0.0
02
-0.0
12
-0.0
10
0.00
0
0.00
7
-0.0
14
-0.0
10
-0.0
01
0.00
2
0.00
6
0.00
6
0.00
0
0.00
3
-0.0
03
0.00
2
-0.0
02
C2V
C
0.89
3
-0.3
01
-0.2
25
-0.0
02
-0.0
27
0.19
8
-0.0
10
0.04
7
0.12
1
-0.0
06
-0.0
53
0.01
4
0.00
1
0.01
9
0.00
4
0.01
4
-0.0
04
-0.0
05
-0.0
05
0.00
1
-0.0
05
0.00
0
0.00
0
0.00
9
-0.0
03
0.00
2
-0.0
04
0.00
4
0.00
2
0.00
0
C3V
C
0.82
5
-0.3
49
-0.3
59
0.17
9
-0.0
43
0.15
5
-0.0
67
0.00
3
0.05
6
0.01
4
0.04
0
0.01
4
0.00
4
0.01
9
-0.0
04
-0.0
09
-0.0
03
0.01
0
-0.0
04
0.00
5
0.00
4
0.00
6
-0.0
01
0.00
1
0.00
8
-0.0
05
0.00
0
-0.0
04
-0.0
03
0.00
1
C4T
0.93
5
-0.2
46
-0.1
17
0.12
3
0.00
6
0.04
5
0.16
5
-0.0
43
-0.0
48
0.03
0
0.01
6
-0.0
19
0.00
7
-0.0
03
-0.0
06
-0.0
05
-0.0
01
0.00
5
-0.0
02
0.00
3
0.00
1
0.00
1
0.00
3
-0.0
02
0.00
2
0.00
3
-0.0
03
-0.0
02
0.00
6
0.00
4
C6A
0.95
2
0.06
2
0.21
4
0.02
3
-0.1
33
0.06
7
0.11
7
-0.0
24
-0.0
82
-0.0
05
0.01
4
-0.0
04
-0.0
08
-0.0
06
0.01
1
-0.0
18
0.00
3
0.00
4
0.00
3
-0.0
07
0.00
5
0.00
4
-0.0
05
0.00
1
0.00
1
-0.0
03
-0.0
06
0.00
7
-0.0
01
-0.0
02
C7A
0.96
1
-0.1
04
0.20
0
0.02
5
0.08
1
-0.0
51
0.07
0
-0.0
78
0.00
4
-0.0
52
0.03
5
0.01
6
0.00
5
0.00
5
0.01
9
-0.0
05
-0.0
02
-0.0
05
-0.0
13
-0.0
03
-0.0
11
-0.0
05
0.00
6
0.00
0
-0.0
05
-0.0
09
0.00
2
-0.0
01
0.00
0
0.00
0
C8A
0.87
9
-0.2
95
0.29
3
-0.1
75
0.09
9
-0.0
31
0.33
7
-0.0
45
0.05
0
0.03
9
-0.0
58
0.04
1
0.00
0
-0.0
18
0.01
4
0.01
1
-0.0
05
0.00
8
0.01
4
-0.0
03
0.00
6
-0.0
07
0.00
6
-0.0
03
0.00
5
-0.0
04
-0.0
02
-0.0
01
0.00
0
0.00
0
Continue...
11
Braz. J. Geol. (2019), 49(2): e20180113

Sam
ple
PC1
PC2
PC3
PC4
PC5
PC6
PC7
PC8
PC9
PC10
PC11
PC12
PC13
PC14
PC15
PC16
PC17
PC18
PC19
PC20
PC21
PC22
PC23
PC24
PC25
PC26
PC27
PC28
PC29
PC30
C9A
0.95
8
0.04
4
0.20
9
-0.0
74
-0.0
11
-0.1
21
-0.0
81
0.02
1
-0.0
73
0.01
7
0.04
1
0.04
6
-0.0
03
-0.0
04
-0.0
14
0.01
4
-0.0
03
-0.0
08
0.00
5
0.00
5
-0.0
08
0.01
2
-0.0
07
0.00
3
0.00
3
-0.0
04
0.00
0
0.00
1
0.00
2
-0.0
01
C12
R
0.40
2
-0.4
48
0.78
2
-0.0
05
0.01
8
0.01
1
-0.0
30
0.11
0
-0.0
04
-0.1
04
0.00
1
-0.0
19
0.02
3
0.02
5
0.00
0
-0.0
02
0.01
1
-0.0
08
0.00
8
0.00
4
0.00
5
0.00
2
0.00
5
-0.0
01
0.00
3
0.00
1
-0.0
01
-0.0
01
0.00
0
0.00
0
C14
T
0.91
4
-0.2
45
-0.0
85
0.25
9
-0.0
20
-0.0
10
0.14
6
-0.0
51
0.00
9
0.06
3
0.00
6
-0.0
38
0.01
1
-0.0
10
-0.0
03
0.01
2
0.00
9
-0.0
15
0.00
7
0.00
8
-0.0
07
-0.0
01
0.00
3
-0.0
01
0.00
1
0.00
1
-0.0
02
-0.0
01
-0.0
04
-0.0
02
Q2V
0.53
5
0.82
4
-0.1
16
0.05
6
-0.0
40
-0.0
05
-0.1
16
-0.0
11
-0.0
18
-0.0
37
0.00
6
-0.0
19
0.00
7
-0.0
18
0.02
0
-0.0
03
-0.0
22
0.00
1
0.00
3
0.01
9
0.00
4
0.00
4
0.00
3
-0.0
01
-0.0
05
0.00
1
-0.0
03
0.00
0
0.00
0
0.00
0
Q11
A
0.92
6
-0.0
18
0.33
7
-0.0
37
-0.0
88
0.06
1
0.09
4
0.03
4
-0.0
34
-0.0
21
-0.0
35
0.03
3
-0.0
05
-0.0
06
-0.0
03
-0.0
07
0.00
6
0.02
2
-0.0
01
0.00
8
-0.0
10
0.00
1
0.00
0
-0.0
02
-0.0
02
0.00
8
0.00
4
-0.0
01
-0.0
01
-0.0
01
S6VA
0.94
5
-0.2
48
0.18
9
-0.0
25
0.06
3
-0.0
30
0.00
4
-0.0
43
-0.0
22
0.01
3
0.02
0
0.00
6
0.00
1
-0.0
06
0.00
8
0.00
8
-0.0
09
-0.0
07
-0.0
07
-0.0
13
0.01
0
0.01
0
0.00
5
0.00
6
-0.0
02
0.00
8
0.00
3
-0.0
01
-0.0
02
0.00
1
S13R
-0.6
21
0.73
6
0.10
1
0.16
2
-0.0
54
0.13
6
0.07
3
-0.0
72
-0.0
46
-0.0
14
0.04
5
0.01
5
-0.0
02
-0.0
01
0.00
7
0.00
9
0.00
7
0.00
1
0.00
5
0.00
7
0.00
6
-0.0
08
0.00
1
0.01
4
0.00
3
0.00
0
0.00
5
0.00
0
0.00
1
-0.0
01
S14R
0.16
1
0.75
6
0.55
3
-0.0
86
0.11
4
0.12
9
-0.0
66
-0.2
30
0.04
0
0.00
2
-0.0
28
-0.0
17
-0.0
11
0.02
0
-0.0
19
-0.0
07
-0.0
07
-0.0
05
0.00
4
-0.0
01
-0.0
03
0.00
2
-0.0
02
-0.0
03
0.00
0
0.00
1
0.00
1
0.00
0
0.00
0
0.00
0
S15R
-0.4
10
0.41
9
0.70
0
-0.0
45
0.32
9
0.12
7
0.04
4
0.16
1
0.02
8
0.09
8
0.04
0
-0.0
12
-0.0
18
-0.0
05
0.00
3
-0.0
01
-0.0
05
0.00
1
-0.0
04
0.00
3
-0.0
01
0.00
1
0.00
1
0.00
0
-0.0
02
-0.0
02
-0.0
01
0.00
0
0.00
0
0.00
1
S18C
0.81
6
0.29
6
-0.2
76
0.23
7
0.23
5
0.01
1
-0.1
88
0.01
5
-0.1
27
0.05
5
-0.0
52
0.01
6
0.00
7
0.00
6
-0.0
05
-0.0
15
0.01
6
-0.0
06
-0.0
01
0.00
1
0.00
2
-0.0
03
0.00
6
0.00
3
-0.0
03
0.00
0
0.00
0
0.00
0
0.00
0
0.00
0
S19C
-0.3
18
0.86
0
-0.0
97
0.31
2
0.01
3
0.19
3
-0.0
09
0.03
0
-0.1
09
-0.0
22
0.00
9
0.01
8
0.01
5
0.00
8
0.01
0
0.02
1
-0.0
02
0.00
1
0.00
1
-0.0
11
-0.0
04
0.00
0
-0.0
02
-0.0
10
0.00
0
0.00
1
-0.0
03
-0.0
01
-0.0
01
0.00
0
S20C
0.56
7
0.34
4
-0.3
19
0.38
9
0.52
6
-0.1
06
0.08
9
0.01
2
0.04
3
-0.0
92
-0.0
03
-0.0
05
-0.0
16
-0.0
06
-0.0
10
0.00
4
-0.0
01
0.00
6
0.00
2
-0.0
01
0.00
1
0.00
0
-0.0
03
0.00
1
0.00
2
0.00
1
-0.0
01
0.00
1
0.00
0
0.00
0
S25A
0.93
9
-0.2
31
0.15
5
-0.1
16
0.11
1
-0.0
83
-0.0
63
-0.0
08
-0.0
23
0.03
0
0.01
5
-0.0
16
0.01
6
0.01
6
0.01
9
-0.0
01
-0.0
04
0.00
0
-0.0
04
0.00
2
-0.0
01
-0.0
12
-0.0
17
0.00
1
0.00
3
0.00
5
0.00
1
0.00
0
-0.0
01
0.00
1
S27L
0.61
1
-0.4
94
0.17
0
0.53
2
-0.1
66
0.04
5
-0.1
70
0.00
0
0.07
8
-0.0
13
0.06
3
0.00
7
-0.0
33
-0.0
17
0.00
2
-0.0
04
0.00
7
-0.0
04
0.00
5
-0.0
04
-0.0
01
-0.0
06
-0.0
01
-0.0
04
-0.0
03
0.00
4
0.00
0
0.00
0
0.00
1
0.00
0
Table 3. Continuation.
iron and manganese ions (Figs. 5 and 6) were grouped in a unique cluster representative of the Fe-Mn-rich elbaites (Fig. 11).
Other green elbaites (samples C1VC(r), C2VC, and C3VC) were grouped with the blue-green (Paraíba type) elbaites due
to similar spectral responses related to the manganese and Cu2+ ions, forming the cluster of the Cu-Mn-rich elbaites (Fig. 11).
Colorless elbaites, marked by weaker VNIR absorption features in comparison with the other elbaite samples, were spectrally separated in another cluster, while red and purple
12
Braz. J. Geol. (2019), 49(2): e20180113
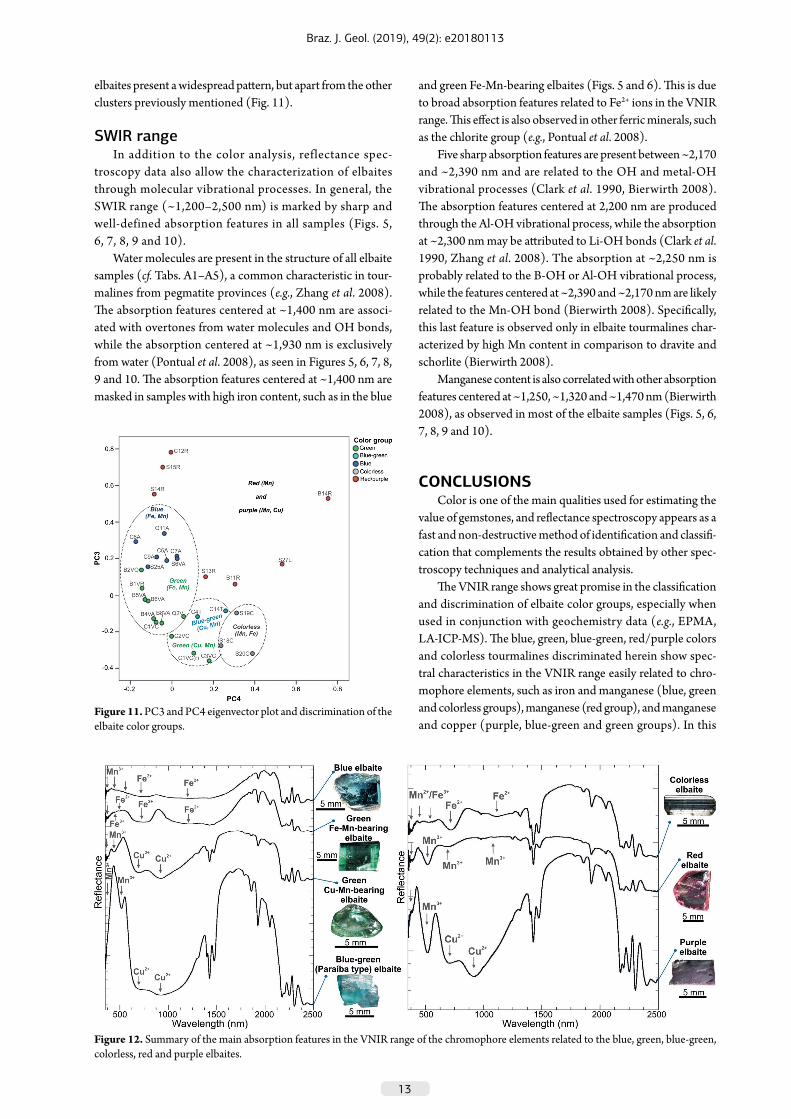
Figure 12. Summary of the main absorption features in the VNIR range of the chromophore elements related to the blue, green, blue-green, colorless, red and purple elbaites.
Figure 11. PC3 and PC4 eigenvector plot and discrimination of the elbaite color groups.
elbaites present a widespread pattern, but apart from the other clusters previously mentioned (Fig. 11).
SWIR rangeIn addition to the color analysis, reflectance spec-
troscopy data also allow the characterization of elbaites through molecular vibrational processes. In general, the SWIR range (~1,200–2,500 nm) is marked by sharp and well-defined absorption features in all samples (Figs. 5, 6, 7, 8, 9 and 10).
Water molecules are present in the structure of all elbaite samples (cf. Tabs. A1–A5), a common characteristic in tour-malines from pegmatite provinces (e.g., Zhang et al. 2008). The absorption features centered at ~1,400 nm are associ-ated with overtones from water molecules and OH bonds, while the absorption centered at ~1,930 nm is exclusively from water (Pontual et al. 2008), as seen in Figures 5, 6, 7, 8, 9 and 10. The absorption features centered at ~1,400 nm are masked in samples with high iron content, such as in the blue
and green Fe-Mn-bearing elbaites (Figs. 5 and 6). This is due to broad absorption features related to Fe2+ ions in the VNIR range. This effect is also observed in other ferric minerals, such as the chlorite group (e.g., Pontual et al. 2008).
Five sharp absorption features are present between ~2,170 and ~2,390 nm and are related to the OH and metal-OH vibrational processes (Clark et al. 1990, Bierwirth 2008). The absorption features centered at 2,200 nm are produced through the Al-OH vibrational process, while the absorption at ~2,300 nm may be attributed to Li-OH bonds (Clark et al. 1990, Zhang et al. 2008). The absorption at ~2,250 nm is probably related to the B-OH or Al-OH vibrational process, while the features centered at ~2,390 and ~2,170 nm are likely related to the Mn-OH bond (Bierwirth 2008). Specifically, this last feature is observed only in elbaite tourmalines char-acterized by high Mn content in comparison to dravite and schorlite (Bierwirth 2008).
Manganese content is also correlated with other absorption features centered at ~1,250, ~1,320 and ~1,470 nm (Bierwirth 2008), as observed in most of the elbaite samples (Figs. 5, 6, 7, 8, 9 and 10).
CONCLUSIONSColor is one of the main qualities used for estimating the
value of gemstones, and reflectance spectroscopy appears as a fast and non-destructive method of identification and classifi-cation that complements the results obtained by other spec-troscopy techniques and analytical analysis.
The VNIR range shows great promise in the classification and discrimination of elbaite color groups, especially when used in conjunction with geochemistry data (e.g., EPMA, LA-ICP-MS). The blue, green, blue-green, red/purple colors and colorless tourmalines discriminated herein show spec-tral characteristics in the VNIR range easily related to chro-mophore elements, such as iron and manganese (blue, green and colorless groups), manganese (red group), and manganese and copper (purple, blue-green and green groups). In this
13
Braz. J. Geol. (2019), 49(2): e20180113

context, a fast discrimination of high-valued variety elbaite comprises a critical step for targeting Paraíba tourmaline, and reflectance spectroscopy proves to be a strategic tool for this subject. The processing of reflectance spectral data using mul-tivariate statistics (e.g., PCA) is also a fast alternative for the statistical discrimination of the main color groups, based on the main chromophore elements (e.g., Mn, Fe, Cu) and their distinct spectral responses.
Spectral features related to the SWIR range are useful for identifying high iron content elbaites by the attenuation of the vibrational features at ~1,400 nm (OH/H-O-H), due to the influence of broad absorption of ferrous iron in the VNIR range.
The combined approach using Gemology and Spectral Geology, demonstrated with this case study of elbaites from the Seridó Pegmatite Province, represents a novel approach
for the systematic characterization of gemstones, which can also be applied to other types, such as euclases, beryls, and their varieties (e.g., emerald and aquamarine), also present in northeastern Brazil.
ACKNOWLEDGEMENTSWe would like to thank the Mineral and Rock Museum and
the Gemological Laboratory of the Department of Geology of the Universidade Federal de Pernambuco for the use of their facilities. We also thank the Institute of Geosciences of UNICAMP, Prof. Dr. Carlos R. Souza Filho and Dr. Rosa Elvira Correa Pabón for the use of the FieldSpec4™ spectro-radiometer, and Prof. Dr. Alvaro P. Crósta (UNICAMP) and an anonymous reviewer for their comments.
ARTICLE INFORMATIONManuscript ID: 20180113. Received on: 10/12/2018. Approved on: 03/20/2019.T. C. wrote the introduction, methodology, discussion and conclusion of the manuscript, applied the PCA technique to the reflectance data, and prepared Figures 1 to 12 and Table 3; S. B. provided geochemical data of elbaites, produced Tables 1 and 2, and wrote the methodology related to these data, discussion and conclusion in conjunction with the other authors; P. O. produced the first results of the reflectance spectra interpretation of the elbaites and prepared Tables A1 to A5; J. N. wrote the text of the manuscript (geological setting, methodology, discussion and conclusion) and aided the spectral interpretations; A. C. interpreted some geochemical data of the elbaites from the study area.Competing interests: The authors declare no competing interests.
Almeida F.F.M., Hasui Y., Brito Neves B.B., Fuck R.A. 1981. Brazilian Structural Provinces: an introduction. Earth Science Review, 17(1-2):1-29. https://doi.org/10.1016/0012-8252(81)90003-9
Angelim L.A.A., Vasconcelos A.M., Gomes J.R.C., Wanderley A.A., Forgiarini L.L., Medeiros M.F. 2004. Folha SB-24-Jaguaribe. In: Schobbenhaus C., Gonçalves J.H., Santos J.O.S., Abram M.B., Leão Neto R., Matos G.M.M., Vidotti R.M., Ramos M.A.B. (Eds.), Carta Geológica do Brasil ao Milionésimo, SIG. Programa Geologia do Brasil. Brasília, CPRM. CD-ROM.
Barreto S.B. 1999. Caracterização química, óptica e estrutural das turmalinas gamológicas dos pegmatitos Capoeiras, Quintos, Bulandeira e Batalha, Província Pegmatítica Boborema, Nordeste do Brasil. PhD Thesis, Departament de Cristal’lografia, Mineralogia i Dipòsits Minerals, Facultat de Geologia, Universitat de Barcelona, Barcelona, 561 p.
Bedell R., Crósta A.P., Grunsky E. (Eds.). 2009. Remote Sensing and Spectral Geology. Littleton, Society of Economic Geologists, 270 p.
Beurlen H., Barreto S., Martin R., Melgarejo J., Silva M.R.R., Souza Neto J.A. 2009. The Borborema Pegmatite Province, NE-Brazil revisited. Estudos Geológicos, 19(2):62-69. https://doi.org/10.18190/1980-8208/estudosgeologicos.v19n2p62-66
Bierwirth P.N. 2008. Laboratory and imaging spectroscopy of tourmaline - a tool for mineral exploration. In: Australasian Remote Sensing and Photogrammetry Conference, 14., Darwin. Proceedings…, 12p.
Brito Neves B.B., Santos E.J., Van Schmus W.R. 2000. Tectonic history of the Borborema Province. In: Cordani U., Milani E.J., Thomaz Filho A., Campos D.A. (Eds.), Tectonic Evolution of South America. Rio de Janeiro, 31st International Geological Congress, p. 151-182.
Carrino T.A., Crósta A.P., Toledo C.L.B., Silva A.M. 2018. Hyperspectral remote sensing applied to mineral exploration in southern Peru: a multiple data integration approach in the Chapi Chiara gold prospect. International Journal of Applied Earth Observation and Geoinformation, 64:287-300. http://dx.doi.org/10.1016/j.jag.2017.05.004
REFERENCES
Clark R.N. 1999. Spectroscopy of rocks and minerals, and principles of spectroscopy. In: Rencz A.N. (Ed.). Manual of remote sensing. Remote Sensing for the Earth Science, 3. New York, John Wiley and Sons, p. 3-58.
Clark R.N., King T.V.V., Klejwa M., Swayze G., Vergo N. 1990. High spectral resolution reflectance spectroscopy of minerals. Journal of Geophysical Research, 95(B8):12653-12680. https://doi.org/10.1029/JB095iB08p12653
Clark R.N. & Roush T.L. 1984. Reflectance spectroscopy: quantitative analysis techniques for remote sensing applications. Journal of Geophysical Research, 89(B7):6329-6340. https://doi.org/10.1029/JB089iB07p06329
Clark R.N., Swayze G.A., Livo K.E., Kokaly R.F., Sutley S.J., Dalton J.B., McDougal R.R., Gent C.A. 2003. Imaging spectroscopy: Earth and planetary remote sensing with the USGS Tetracorder and expert systems. Journal of Geophysical Research, 108(12):1-44. https://doi.org/10.1029/2002JE001847
Coulter D.W., Harris P.D., Wickert L.M., Zhou X. 2017. Advances in Spectral Geology and remote sensing: 2008-2017. In: Exploration 17, Decennial International Conference on Mineral Exploration, 6., Toronto. Proceedings…, p. 23-50.
Ducart D.F., Crósta A.P., Souza Filho C.R., Coniglio J. 2006. Alteration mineralogy at the Cerro La Mina epithermal prospect, Patagonia, Argentina: field mapping, shortwave infrared spectroscopy and ASTER images. Economic Geology, 101(5):981-996. https://doi.org/10.2113/gsecongeo.101.5.981
Faye G.H., Manning P.G., Gosselin J.R., Tremblay R.J. 1974. The optical absorption spectra of tourmaline: importance of charge-transfer processes. Canadian Mineralogist, 12(6):370-380.
Geoscience Australia. 2018. Spectral Geology. Available at: <http://www.ga.gov.au/scientific-topics/disciplines/spectral-geology#heading-1>. Acessed on: Jul. 12, 2018.
Hawthorne F.C. & Dirlam D.M. 2011. Tourmaline the indicator mineral: from atomic arrangement to viking navigation. Elements, 7(5):307-312. https://doi.org/10.2113/gselements.7.5.307
14
Braz. J. Geol. (2019), 49(2): e20180113

Hunt G.R. 1977. Spectral signatures of particulate minerals, in the visible and near-infrared. Geophysics, 42(3):501-513. https://doi.org/10.1190/1.1440721
Hunt G.R. 1979. Near-infrared (1.3-2.4 μm) spectra of alteration minerals – potential for use in remote sensing. Geophysics, 44(12):1974-1986. https://doi.org/10.1190/1.1440951
Hunt G.R. & Ashley R.P. 1979. Spectral of altered rocks in the visible and near infrared. Economic Geology, 74(7):1613-1629. https://doi.org/10.2113/gsecongeo.74.7.1613
Malvern Panalytical. 2018. ASD FieldSpec 4 Standard-Res Spectroradiometer. Malvern Panalytical. Available at: <https://www.asdi.com/products-and-services/fieldspec-spectroradiometers/fieldspec-4-standard-res/>. Accessed on: Jul. 19, 2018.
Manning P.G. 1969. Optical absorption spectra of chromium-bearing tourmaline, black tourmaline and buergerite. Canadian Mineralogist, 10(1):57-70.
Manning P.G. 1973. Effect of second-nearest-neighbour interaction on Mn3+ absorption in pink and black tourmalines. Canadian Mineralogist, 11(5):971-977.
Martin F., Mérigoux H., Zecchini P. 1989. Reflectance infrared spectroscopy in Gemology. Gems & Gemology, 25:226-231.
Mather P.M. 2004. Image transforms. In: Mather P.M. (Ed.), Computer processing of remotely-sensed images: an introduction. Chichester, John Wiley & Sons, p. 136-179.
Mattson S.M. & Rossman G.R. 1987. Fe2+-Fe+3 interactions in tourmalines. Physics and Chemistry of Minerals, 14(2):163-171. https://doi.org/10.1007/BF00308220
Merkel P.B. & Breeding C.M. 2009. Spectral differentiation between copper and iron colorants in gems tourmalines. Gems & Gemology, 45(2):112-119.
Neves S.P. & Alcantara V.C. 2010. Geochemistry of orthogneisses and metasedimentary rocks across a proposed terrane boundary in the Central Domain of Borborema Province, NE Brazil: geodynamic implications. Journal of South American Earth Sciences, 29(2):498-511. https://doi.org/10.1016/j.jsames.2009.08.002
Pearson K. 1901. On lines and planes of closest fit to systems of points in space. Philosophical Magazine Series, 2(11):559-572. https://doi.org/10.1080/14786440109462720
Pontual S., Merry N., Gamson P. 2008. Spectral interpretation - Field manual. GMEX. Spectral Analysis guides for mineral exploration. Victoria, AusSpec International Pty, 189 p.
Reinitz I. & Rossman G.R. 1988. Role of natural radiation in tourmaline coloration. American Mineralogist, 73(7-8):822-825.
Rossman G.R., Fritsch E., Shigley J.E. 1991. Origin of color in cuprian elbaite from São José de Batalha, Paraíba, Brazil. American Mineralogist, 76(9-10):1479-1484. http://orcid.org/0000-0002-4571-6884
Santos E.J., Souza Neto J.A., Silva M.R.R., Beurlen H., Cavalcanti J.A.D., Silva M.G., Dias V.M., Costa A.F., Santos L.C.M.L., Santos R.B. 2014. Metalogênese das porções norte e central da Província Borborema. In: Silva M.G., Rocha Neto M.B., Jost H., Kuyumijan R.M. (Eds.), Metalogênese das províncias tectônicas brasileiras. Belo Horizonte, CPRM, p. 343-388.
Santos E.J., Van Schmus W.R., Kozuch M., Brito Neves B.B. 2010. The Cariris Velhos tectonic event in Northeast Brazil. Journal of South American Earth Sciences, 29(1):61-76. https://doi.org/10.1016/j.jsames.2009.07.003
Scorza E.P. 1944. Província Pegmatítica da Borborema (Nordeste do Brasil). Boletim 112. Rio de Janeiro, DNPM/DGM, 55 p.
Shigley J.E., Cook B.C., Laurs B.M., Bernardes M.O. 2001. An update on “Paraiba” tourmaline from Brazil. Gems & Gemology, 37(4):260-276.
Silva M.R.R., Höll R., Beurlen H. 1995. Borborema Pegmatitic Province: geological and geochemical characteristics. Journal of South American Earth Sciences, 8(3-4):355-364. https://doi.org/10.1016/0895-9811(95)00019-C
Silva S.M.P. 2009. Espectroscopia de imageamento e gamaespectrometria aérea e terrestre de pegmatitos e granitos da porção sul da Província Pegmatítica da Borborema (PPB), Nordeste do Brasil. PhD Thesis, Institute of Geosciences, Universidade Estadual de Campinas, Campinas, 173 p.
Smith G. 1978. Evidence for absorption by exchange-coupled Fe2+-Fe3+ pairs in the near infrared spectra of minerals. Physics and Chemistry of Minerals, 3(4):375-383. http://dx.doi.org/10.1007/BF00311848
Soares D.R. 2004. Contribuição à petrologia de pegmatitos mineralizados em elementos raros e elbaítas gemológicas da Província Pegmatítica da Borborema, Nordeste do Brasil. PhD Thesis, Departamento de Geologia, Universidade Federal de Pernambuco, Recife, 170 p.
Soares D.R., Beurlen H., Ferreira A.C.M., Silva M.R.R. 2007. Chemical composition of gahnite and degree of pegmatite fractionation in the Borborema Pegmatitic Province, northeastern Brazil. Anais da Academia Brasileira de Ciências, 79(3):395-404. http://dx.doi.org/10.1590/S0001-37652007000300005
Swayze G.A., Clark R.N., Goetz A.F.H., Livo K.E., Breit G.N., Kruse F.A., Sutley S.J., Snee L.W., Lowers H.A., Post J.L., Stoffregen R.E., Ashley R.P. 2014. Mapping advanced argillic alteration at Cuprite, Nevada, using imaging spectroscopy. Economic Geology, 109(5):1179-1221. https://doi.org/10.2113/econgeo.109.5.1179
Tappert M., Rivard B., Giles D., Tappert R., Mauger A. 2011. Automated drill core logging using visible and near-infrared reflectance spectroscopy: a case study from the Olympic Dam IOCG Deposit, South Australia. Economic Geology, 106:289-296.
Taran M.N., Lebedev A.S., Platonov A.N. 1993. Optical absorption spectroscopy of synthetic tourmalines. Physics and Chemistry of Minerals, 20(3):209-220. https://doi.org/10.1007/BF00200123
Thompson A.J.B., Hauff P.L., Robitaille A.J. 1999. Alteration mapping in exploration: application of short-wave infrared (SWIR) spectroscopy. Society of Economic Geologist Newsletter, 39:15-17.
Van Schmus W.R., Oliveira E.P., Silva Filho A.F., Toteu F., Penaye J., Guimarães I.P. 2008. Proterozoic links between the Borborema Province, NE Brazil, and the Central African Fold Belt. Geological Society, London, Special Publication, 294:66-69. https://doi.org/10.1144/SP294.5
Zhang A., Wang R., Li Y., Hu H., Lu X., Ji J., Zhang H. 2008. Tourmalines from the Koktokay No.3 pegmatite, Altai, NW China: spectroscopic characterization and relationships with the pegmatite evolution. European Journal of Mineralogy, 20(1):143-154. https://doi.org/10.1127/0935-1221/2008/0020-1779
15
Braz. J. Geol. (2019), 49(2): e20180113