d buildertm for microsoft® ccess web edition
TRANSCRIPT

Dashboard BuilderTM for Microsoft® Access™ Web Edition
Application Guide Version 5.4 7.22.2018
This document is copyright © 2007-2018 OpenGate Software. The information contained in this document is subject to change without notice. If you find any problems in the documentation, please report them to us in writing. This document is not warranted to be error-free. Except as may be expressly permitted in your license agreement for these Programs, no part of these Programs may be reproduced or transmitted in any form or by any means, electronic or mechanical, for any purpose. Dashboard Builder is a trademark of OpenGate Software Inc. Microsoft and the Office logo are trademarks or registered trademarks of Microsoft Corporation in the United States and/or other countries.

Dashboard BuilderTM for Access – Application Guide
Copyright © 2018 OpenGate Software 2
http://www.opengatesw.net
TABLE OF CONTENTS
DASHBOARD BUILDERTM FOR MICROSOFT® ACCESS™ ............................................................. 1
WEB EDITION ............................................................................................................................................. 1
1 INTRODUCTION ............................................................................................................................... 3
1.1 INSTALLATION ............................................................................................................................... 3
2 CREATING WEB DASHBOARDS ................................................................................................... 3
2.1 CREATING A WEB DASHBOARD...................................................................................................... 3 2.1.1 General Settings ....................................................................................................................... 4 2.1.2 Dashboard Layouts ................................................................................................................... 5 2.1.3 Displayed Graphs ..................................................................................................................... 5 2.1.4 Displayed Metrics ..................................................................................................................... 6
3 PUBLISHING WEB DASHBOARDS ............................................................................................... 7
3.1 FTP PROFILE SETUP ...................................................................................................................... 7 3.2 WEB DASHBOARD STRUCTURE ...................................................................................................... 8 3.3 SECURITY RECOMMENDATIONS ..................................................................................................... 8 3.4 GRAPH RENDERING TROUBLESHOOTING ....................................................................................... 9
4 ADVANCED OPTIONS...................................................................................................................... 9
4.1 CUSTOMIZING MENU AND GRAPH LOOK AND FEEL ....................................................................... 9 4.2 PUBLISHING MULTIPLE DASHBOARDS AT ONCE .............................................................................10 4.3 TIME SORTING ..............................................................................................................................10 4.4 AUTOMATICALLY REFRESHING USER'S DASHBOARDS IN THE BROWSER ......................................10
5 KNOWN ISSUES WITH GOOGLE VISUALIZATION API ........................................................11
6 UPGRADING DASHBOARD BUILDER ........................................................................................11
6.1 METHOD 1: AUTOMATIC UPGRADE ..............................................................................................11 6.2 METHOD 2: MANUAL UPGRADE ...................................................................................................11
RELEASE HISTORY .................................................................................................................................13

Dashboard BuilderTM for Access – Application Guide
Copyright © 2018 OpenGate Software 3
http://www.opengatesw.net
1 Introduction Dashboard Builder - Web edition allows you to publish special web-enabled dashboards to local directories, and FTP the files to any web directory. The HTML files will render with any standard, up-to-date browser (Internet Explorer, Firefox, Chrome, Safari). Dashboard Builder relies on the Google Visualization API to render charts directly in your browser.
Security Note No date is passed to Google when rendering charts. All data remains in the user's browser.
1.1 INSTALLATION Dashboard Builder - Web Edition functions in the same manner as the other Dashboard Builder editions in terms of installation. Specifically, Dashboard Builder can be run in a "stand-alone" mode where you link or import your data into the Dashboard Builder file. Alternatively, you can choose to integrate Dashboard Builder directly into your existing Access database(s). Please refer to the Professional Edition User's Guide for general deployment steps. For the Web Edition of Dashboard Builder, there is one additional step necessary for your deployment. You must ensure the folder /dbhtml/ that is included in the download zip file is placed in the same folder as your Dashboard Builder database. The /dbhtml/ folder contains four essential files needed to publish your web dashboards.
2 Creating Web Dashboards
2.1 CREATING A WEB DASHBOARD To create a new web dashboard, simply select the “Create a New Dashboard” button from the Dashboard Builder Main Menu screen. Supply a name for your dashboard, and you are ready to begin choosing graphs and metric dashboards to include in your web dashboard.

Dashboard BuilderTM for Access – Application Guide
Copyright © 2018 OpenGate Software 4
http://www.opengatesw.net
Figure 1: Web Dashboard Administration
2.1.1 GENERAL SETTINGS
Local Folder Choose the folder (on your PC or a file-server) where the web dashboard files should be stored.
FTP Profile Optional. See section 3.1 below. If no FTP profile is set up, Dashboard Builder will only generate the web dashboard files to the Local Folder specified.
Layout Type See section 2.1.2 below.
Include in Auto Publish Dashboard Builder - Web Edition includes a function fPublishAllDashboards() that, when called, will automatically publish your dashboards based on their defined FTP profiles. Checking this box will include this web dashboard in the publishing process.
Graph Width The width of graphs in pixels. 600 px is recommended for the Left-Menu layout, and 300-400px for Side-by-Side Comparison layout.

Dashboard BuilderTM for Access – Application Guide
Copyright © 2018 OpenGate Software 5
http://www.opengatesw.net
Logo Choose a logo file to display. You can choose a local file, or paste in a URL.
2.1.2 DASHBOARD LAYOUTS
Dashboard Builder supports two layouts: “Left-Menu" and "Side-by-Side Compare."
The Left Menu layout appears as follows:
Figure 2: Left-Menu Layout
The Side-by-Side Comparison view displays two charts side-by-side to allow for comparison. We recommend setting the chart size to between 300 and 400px for the side-by-side layout.
2.1.3 DISPLAYED GRAPHS
Choose the graphs you want to display on your dashboard. They will appear in the menu in the order you select them. Double-click any graph name to open the
graph definition. Click the icon to search and select one of your existing graphs. You can choose to display a different caption on the menu for each graph by entering your own text value in the "Caption" field. You can choose to display a data table below the chart by choosing "Graph and Table" in the
"Display What" field. Lastly, you may optionally click the icon to add descriptive text that will appear at the bottom of the dashboard item as shown below.
Dashboard BuilderTM for Access – Application Guide
Copyright © 2018 OpenGate Software 6
http://www.opengatesw.net
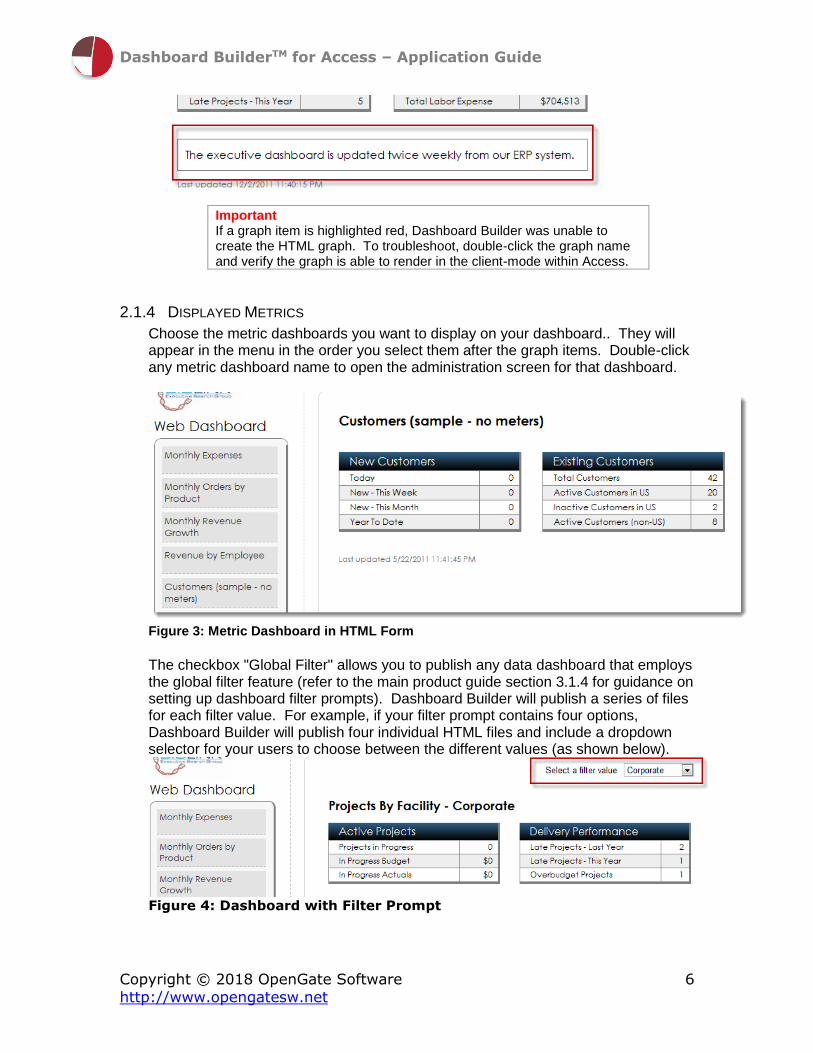
Important If a graph item is highlighted red, Dashboard Builder was unable to create the HTML graph. To troubleshoot, double-click the graph name and verify the graph is able to render in the client-mode within Access.
2.1.4 DISPLAYED METRICS
Choose the metric dashboards you want to display on your dashboard.. They will appear in the menu in the order you select them after the graph items. Double-click any metric dashboard name to open the administration screen for that dashboard.
Figure 3: Metric Dashboard in HTML Form
The checkbox "Global Filter" allows you to publish any data dashboard that employs the global filter feature (refer to the main product guide section 3.1.4 for guidance on setting up dashboard filter prompts). Dashboard Builder will publish a series of files for each filter value. For example, if your filter prompt contains four options, Dashboard Builder will publish four individual HTML files and include a dropdown selector for your users to choose between the different values (as shown below).
Figure 4: Dashboard with Filter Prompt
Dashboard BuilderTM for Access – Application Guide
Copyright © 2018 OpenGate Software 7
http://www.opengatesw.net
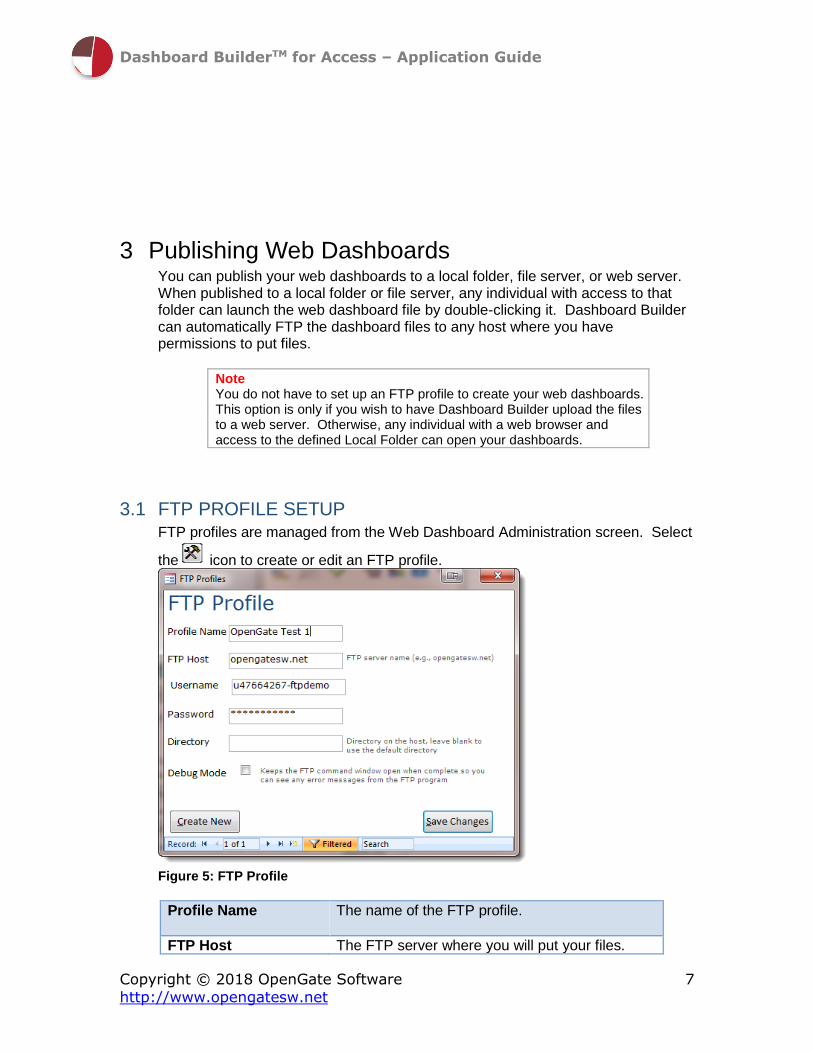
3 Publishing Web Dashboards You can publish your web dashboards to a local folder, file server, or web server. When published to a local folder or file server, any individual with access to that folder can launch the web dashboard file by double-clicking it. Dashboard Builder can automatically FTP the dashboard files to any host where you have permissions to put files.
Note You do not have to set up an FTP profile to create your web dashboards. This option is only if you wish to have Dashboard Builder upload the files to a web server. Otherwise, any individual with a web browser and access to the defined Local Folder can open your dashboards.
3.1 FTP PROFILE SETUP FTP profiles are managed from the Web Dashboard Administration screen. Select
the icon to create or edit an FTP profile.
Figure 5: FTP Profile
Profile Name The name of the FTP profile.
FTP Host The FTP server where you will put your files.

Dashboard BuilderTM for Access – Application Guide
Copyright © 2018 OpenGate Software 8
http://www.opengatesw.net
Username The username for the FTP account on the host.
Password The password for the FTP account on the host.
Directory Optional subdirectory on the FTP host. If the subdirectory does not exist, Dashboard Builder will create it.
Debug Mode If checked, Dashboard Builder will pause after attempting to FTP your dashboard. This allows you to view any errors in the FTP console.
Important! The FTP password is obscured on the screen, however it is not encrypted or obscured in the local table where the profile is stored. It is also not encrypted when the FTP script file is created temporarily to upload your files. The FTP script file is immediately deleted after uploading files, except in debug mode.
3.2 WEB DASHBOARD STRUCTURE Dashboard Builder creates several files when publishing any web dashboard. The files are published to the folder you specified in the "Local Folder" field of the web dashboard definition.
File Folder
[Dashboard Name].htm Root folder
master_style.css /resources/
[Graph Name].htm /graphs/
[Metric Dashboard Name].htm /graphs/
3.3 SECURITY RECOMMENDATIONS The FTP password is obscured on the screen, however it is not encrypted or obscured in the local table where the profile is stored. It is also not encrypted when the FTP script file is created temporarily to upload your files. The FTP script file is immediately deleted after uploading files, except in debug mode. We strongly recommend creating a special FTP user account on your host that only allows the user to publish to a specific directory on the server.

Dashboard BuilderTM for Access – Application Guide
Copyright © 2018 OpenGate Software 9
http://www.opengatesw.net
Lastly, if you wish to secure dashboards such that your clients can only see their own data, we recommend creating separate graphs specific to each client. Then create unique web dashboards that each publish to separate subfolders on your server. You can then set up user security on each folder on the server (.htaccess files or the equivalent for your server platform) such that each client can only access their dashboard(s) using a username/password.
3.4 GRAPH RENDERING TROUBLESHOOTING If a graph is highlighted in red, Dashboard Builder was unable to create the graph. The best way to troubleshoot will be to double-click the red highlighted graph name. In the Graph Administration screen, choose the "Save to HTML" option at the bottom. Dashboard Builder will indicate the reason why the graph could not be created. Typically it will be due to parameters in any query the graph is using. Contact mailto:[email protected] if you are unable to resolve the issue by fixing the graph data source.
4 Advanced Options
4.1 CUSTOMIZING MENU AND GRAPH LOOK AND FEEL The graphs and menus created by Dashboard Builder can be modified if needed to adjust the color scheme and layout. The following files contained in the /dbhtml/ folder drive the look and feel of graphs and menus:
File What it Defines
master_style.css • Menu layout
• Border colors
• Font colors
• Menu font (size/color/family)
google_graph_template.htm • Chart labeling
• Chart fonts (size/color/family)
left_menu_template.htm • Menu layout
• Chart iFrame size
compare_menu_template.htm • Menu layout
• Chart iFrame sizes
Important! Changing the files listed above can cause the menus and/or graphs to fail to render in the browser. We recommend you create a backup copy of the /dbhtml/ folder before making any changes, and that you are familiar with CSS and HTML.

Dashboard BuilderTM for Access – Application Guide
Copyright © 2018 OpenGate Software 10
http://www.opengatesw.net
Dashboard Builder automatically copies the master_style.css file to your dashboard folder location. If you publish your dashboard via FTP, a copy of the master_style.css is loaded to your FTP location. If you would like to prevent Dashboard Builder from overwriting the master_style.css file that is stored in your dashboard's folder (in the resources directory), open the table "tblAppInfo_Advanced" and add a new entry with the Attribute-Name field set to "Keep Custom CSS" and the Attribute-Numeric value equal to -1.
4.2 PUBLISHING MULTIPLE DASHBOARDS AT ONCE Dashboard Builder - Web edition includes a function fPublishAllDashboards() that, when executed, will attempt to publish (and FTP if configured) all web dashboards with the "Include in Auto Publish" check box checked. You can call fPublishAllDashboards() from any other VB routine or using a macro with the RunCode command.
4.3 TIME SORTING Time sorting is handled by the table "ogsDashboardTimeSorting." The table stores a list of all possible time series values and their corresponding sort order. The table is pre-loaded with time intervals from January 1999 to 2020. To load additional time intervals, simply run fLoadTimeTable() after modifying the line: For intYear = 1999 To 2020 The table is configured to deny duplicate values, so there will be no issue if you run the function over time periods already loaded.
4.4 AUTOMATICALLY REFRESHING USER'S DASHBOARDS IN THE BROWSER To automatically refresh a user's browser page when they are viewing a dashboard, you can replace the file "google_graph_template.htm" contained in the dbhtml folder with the file "google_graph_template_jscriptrefresh.htm." To do so simply delete or rename "google_graph_template.htm" then rename "google_graph_template_jscriptrefresh.htm" to "google_graph_template.htm" By default the jscriptrefresh.htm file is set to refresh the browser every 60 seconds, you can open the HTML file using Notepad and edit the value "timedRefresh(60000)" to any other interval value. Note that 1000 is equal to one second.
Important! You must still publish updates from your Access database for the user's browser to see the new data, using either the fPublishAllDashboards() method, or by publishing an individual dashboard.
Dashboard BuilderTM for Access – Application Guide
Copyright © 2018 OpenGate Software 11
http://www.opengatesw.net
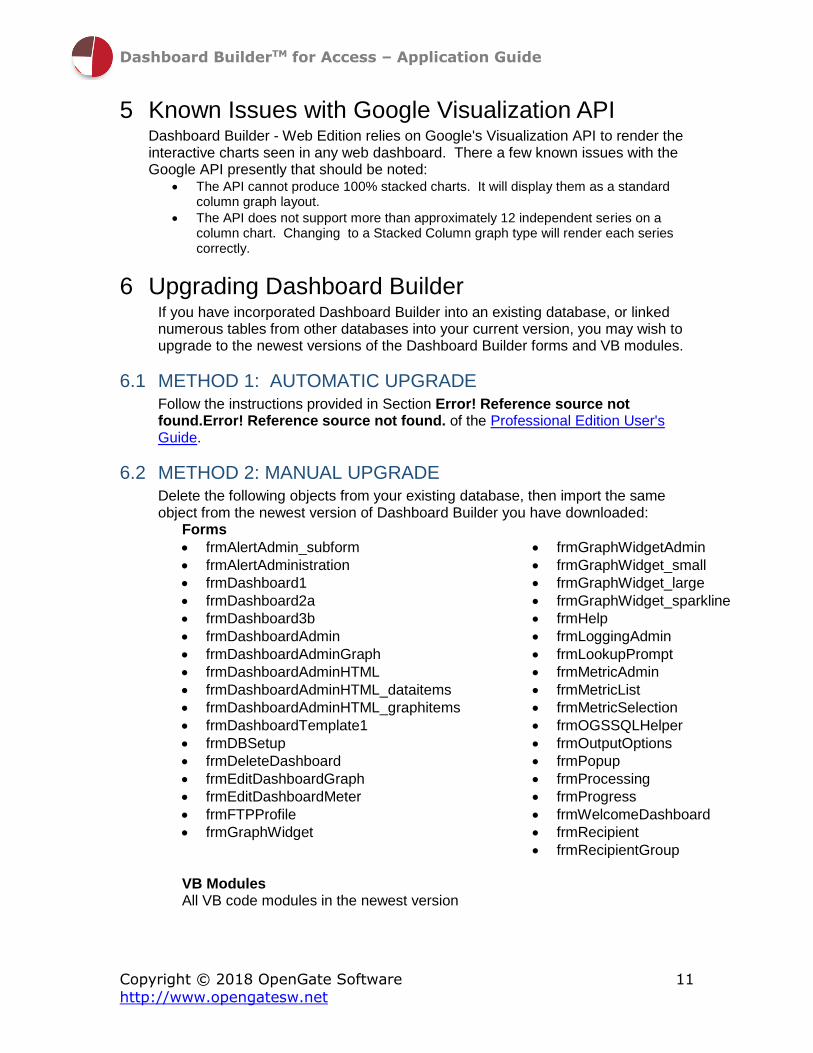
5 Known Issues with Google Visualization API Dashboard Builder - Web Edition relies on Google's Visualization API to render the interactive charts seen in any web dashboard. There a few known issues with the Google API presently that should be noted:
• The API cannot produce 100% stacked charts. It will display them as a standard column graph layout.
• The API does not support more than approximately 12 independent series on a column chart. Changing to a Stacked Column graph type will render each series correctly.
6 Upgrading Dashboard Builder If you have incorporated Dashboard Builder into an existing database, or linked numerous tables from other databases into your current version, you may wish to upgrade to the newest versions of the Dashboard Builder forms and VB modules.
6.1 METHOD 1: AUTOMATIC UPGRADE Follow the instructions provided in Section Error! Reference source not found.Error! Reference source not found. of the Professional Edition User's Guide.
6.2 METHOD 2: MANUAL UPGRADE Delete the following objects from your existing database, then import the same object from the newest version of Dashboard Builder you have downloaded:
Forms
• frmAlertAdmin_subform
• frmAlertAdministration
• frmDashboard1
• frmDashboard2a
• frmDashboard3b
• frmDashboardAdmin
• frmDashboardAdminGraph
• frmDashboardAdminHTML
• frmDashboardAdminHTML_dataitems
• frmDashboardAdminHTML_graphitems
• frmDashboardTemplate1
• frmDBSetup
• frmDeleteDashboard
• frmEditDashboardGraph
• frmEditDashboardMeter
• frmFTPProfile
• frmGraphWidget
• frmGraphWidgetAdmin
• frmGraphWidget_small
• frmGraphWidget_large
• frmGraphWidget_sparkline
• frmHelp
• frmLoggingAdmin
• frmLookupPrompt
• frmMetricAdmin
• frmMetricList
• frmMetricSelection
• frmOGSSQLHelper
• frmOutputOptions
• frmPopup
• frmProcessing
• frmProgress
• frmWelcomeDashboard
• frmRecipient
• frmRecipientGroup
VB Modules All VB code modules in the newest version

Dashboard BuilderTM for Access – Application Guide
Copyright © 2018 OpenGate Software 12
http://www.opengatesw.net
External Files Replace the contents of your local /dbhtml/ folder with the newest versions.
Dashboard BuilderTM for Access – Application Guide
Copyright © 2018 OpenGate Software 13
http://www.opengatesw.net
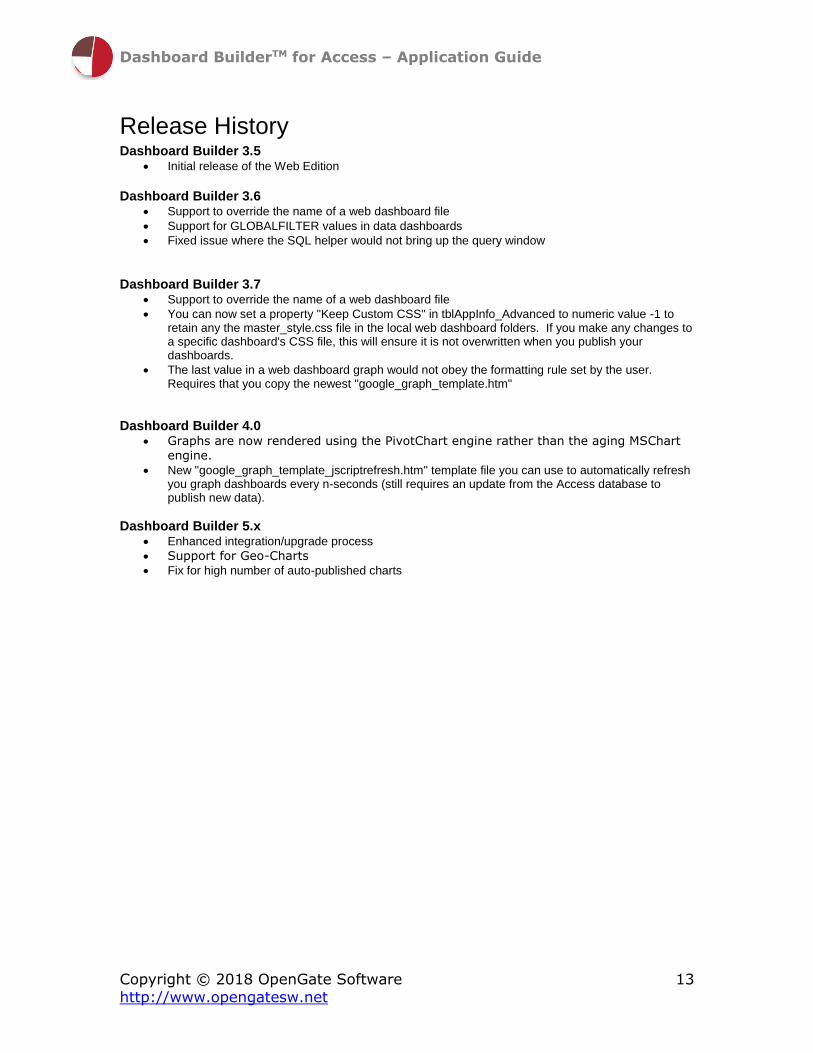
Release History Dashboard Builder 3.5
• Initial release of the Web Edition
Dashboard Builder 3.6
• Support to override the name of a web dashboard file
• Support for GLOBALFILTER values in data dashboards
• Fixed issue where the SQL helper would not bring up the query window
Dashboard Builder 3.7
• Support to override the name of a web dashboard file
• You can now set a property "Keep Custom CSS" in tblAppInfo_Advanced to numeric value -1 to retain any the master_style.css file in the local web dashboard folders. If you make any changes to a specific dashboard's CSS file, this will ensure it is not overwritten when you publish your dashboards.
• The last value in a web dashboard graph would not obey the formatting rule set by the user. Requires that you copy the newest "google_graph_template.htm"
Dashboard Builder 4.0 • Graphs are now rendered using the PivotChart engine rather than the aging MSChart
engine.
• New "google_graph_template_jscriptrefresh.htm" template file you can use to automatically refresh you graph dashboards every n-seconds (still requires an update from the Access database to publish new data).
Dashboard Builder 5.x • Enhanced integration/upgrade process
• Support for Geo-Charts
• Fix for high number of auto-published charts