d e m e t e r d e m e t e r project co-funded by the european commission evg1-ct-2002-00078 dem e...
TRANSCRIPT
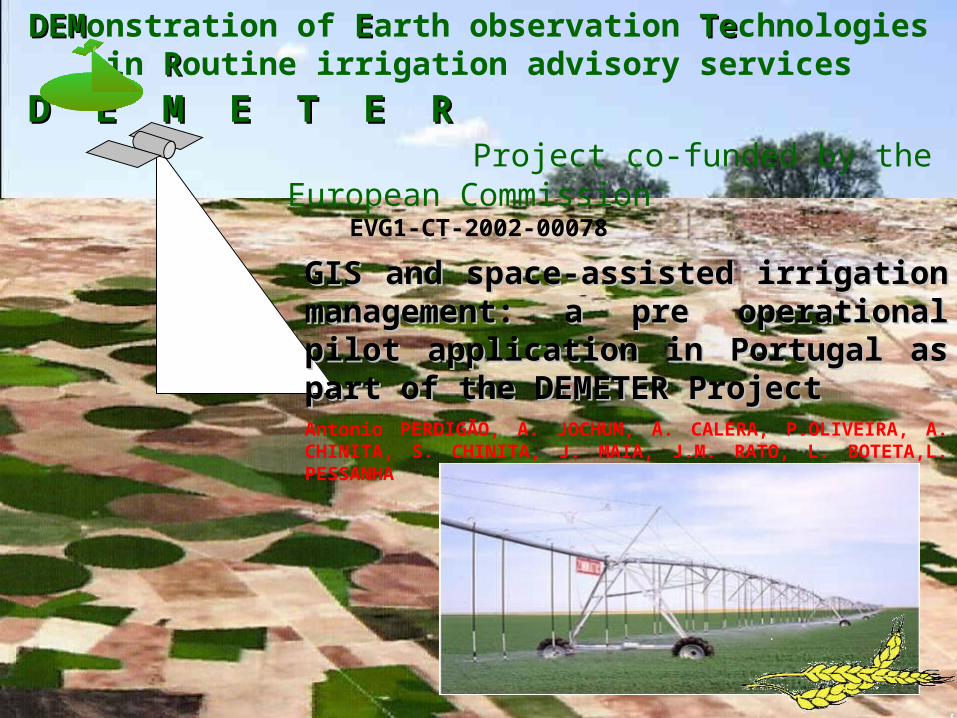
D E M E T E R D E M E T E R Project co-funded by the European Commission
EVG1-CT-2002-00078
DEMDEMonstration of EEarth observation TeTechnologies in RRoutine irrigation advisory services
GIS and space-assisted irrigation GIS and space-assisted irrigation management: a pre operational pilot management: a pre operational pilot application in Portugal as part of the application in Portugal as part of the DEMETER ProjectDEMETER Project Antonio PERDIGÃO, A. JOCHUM, A. CALERA, P.OLIVEIRA, A. CHINITA, S. CHINITA, J. MAIA, J.M. RATO, L. BOTETA,L. PESSANHA
DEMonstration of Earth observation TEchnologiesin Routine irrigation advisory services
D E M E T E RD E M E T E R
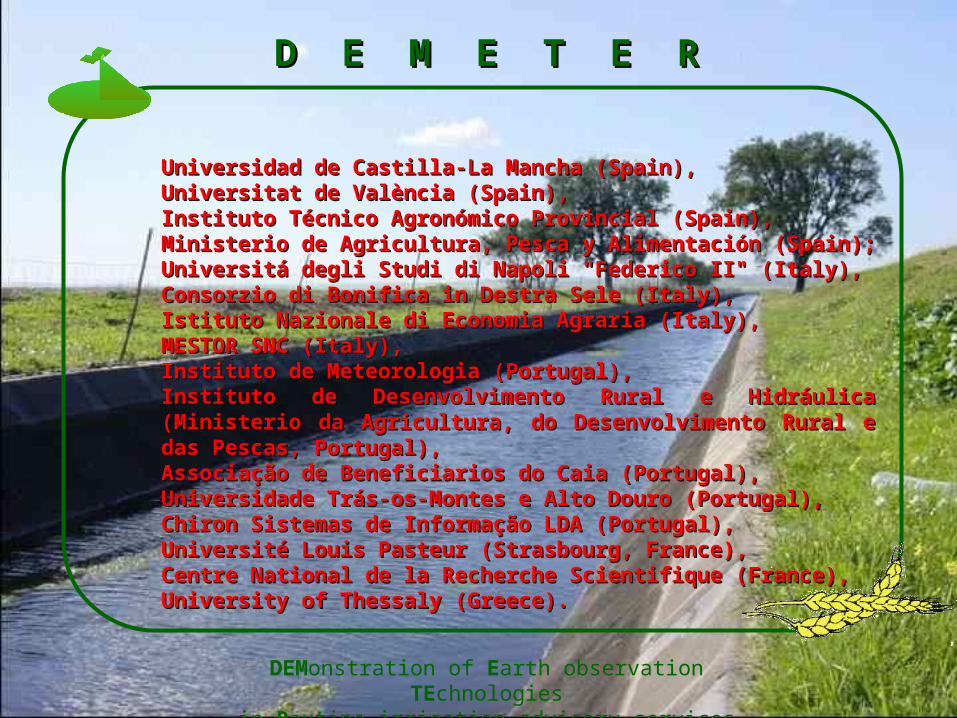
Universidad de Castilla-La Mancha (Spain), Universidad de Castilla-La Mancha (Spain), Universitat de València (Spain), Universitat de València (Spain), Instituto Técnico Agronómico Provincial (Spain), Instituto Técnico Agronómico Provincial (Spain), Ministerio de Agricultura, Pesca y Alimentación (Spain); Ministerio de Agricultura, Pesca y Alimentación (Spain); Universitá degli Studi di Napoli "Federico II" (Italy), Universitá degli Studi di Napoli "Federico II" (Italy), Consorzio di Bonifica in Destra Sele (Italy), Consorzio di Bonifica in Destra Sele (Italy), Istituto Nazionale di Economia Agraria (Italy), Istituto Nazionale di Economia Agraria (Italy), MESTOR SNC (Italy), MESTOR SNC (Italy), Instituto de Meteorologia (Portugal), Instituto de Meteorologia (Portugal), Instituto de Desenvolvimento Rural e Hidráulica (Ministerio Instituto de Desenvolvimento Rural e Hidráulica (Ministerio da Agricultura, do Desenvolvimento Rural e das Pescas, da Agricultura, do Desenvolvimento Rural e das Pescas, Portugal), Portugal), Associação de Beneficiarios do Caia (Portugal),Associação de Beneficiarios do Caia (Portugal),Universidade Trás-os-Montes e Alto Douro (Portugal), Universidade Trás-os-Montes e Alto Douro (Portugal), Chiron Sistemas de Informação LDA (Portugal), Chiron Sistemas de Informação LDA (Portugal), Université Louis Pasteur (Strasbourg, France), Université Louis Pasteur (Strasbourg, France), Centre National de la Recherche Scientifique (France), Centre National de la Recherche Scientifique (France), University of Thessaly (Greece).University of Thessaly (Greece).
D E M E T E RD E M E T E R
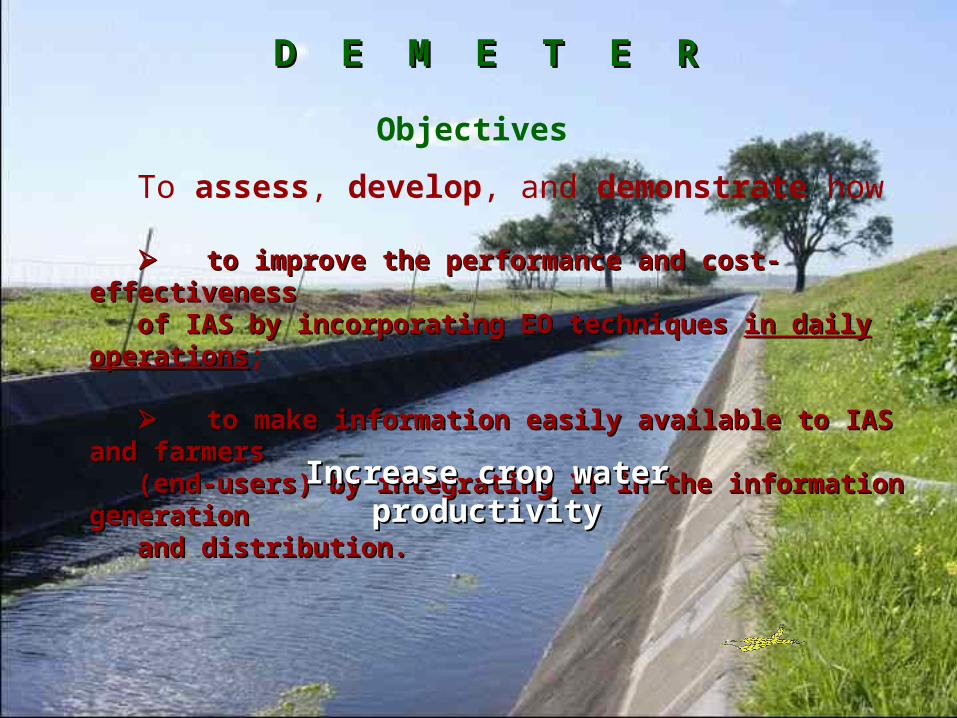
Objectives
To assess, develop, and demonstrate how
to improve the performance and cost-effectiveness to improve the performance and cost-effectiveness of IAS by incorporating EO techniques of IAS by incorporating EO techniques in daily operationsin daily operations;
to make information easily available to IAS and farmers to make information easily available to IAS and farmers (end-users) by integrating IT in the information generation (end-users) by integrating IT in the information generation and distribution.and distribution.
Increase crop water productivityIncrease crop water productivity
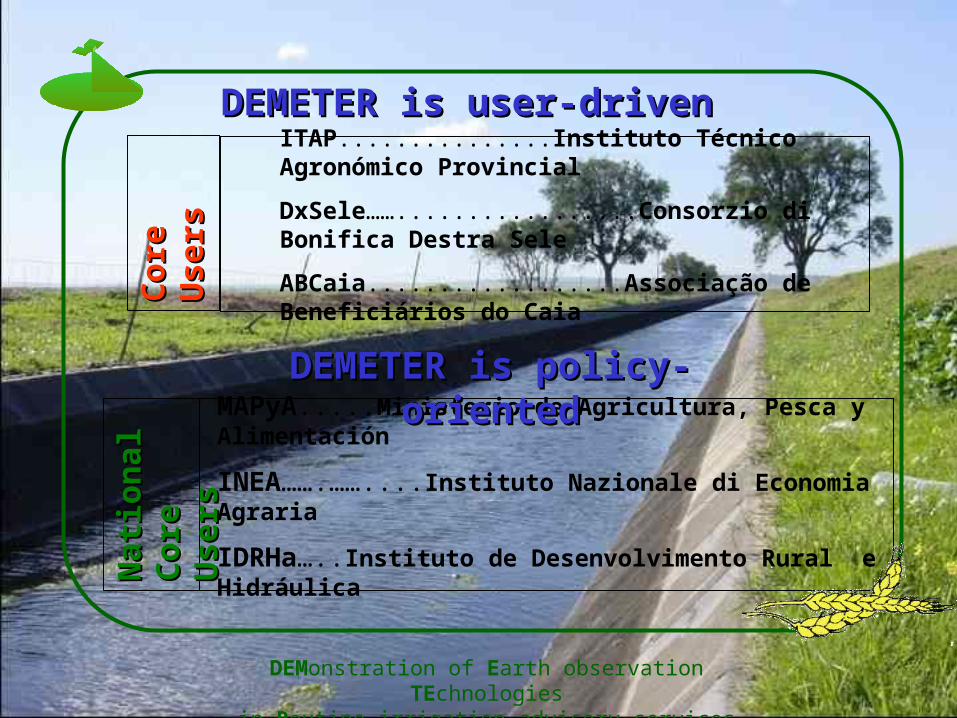
MAPyA.....Ministerio de Agricultura, Pesca y Alimentación
INEA…….……....Instituto Nazionale di Economia Agraria
IDRHa…..Instituto de Desenvolvimento Rural e Hidráulica
DEMETER is user-drivenDEMETER is user-drivenC
ore
Co
reU
sers
Use
rsITAP...............Instituto Técnico Agronómico Provincial
DxSele…….................Consorzio di Bonifica Destra Sele
ABCaia..................Associação de Beneficiários do Caia
DEMonstration of Earth observation TEchnologiesin Routine irrigation advisory services
DEMETER is policy-orientedDEMETER is policy-oriented
Nat
ion
al
Nat
ion
al
Co
re U
sers
Co
re U
sers
DEMonstration of Earth observation TEchnologiesin Routine irrigation advisory services
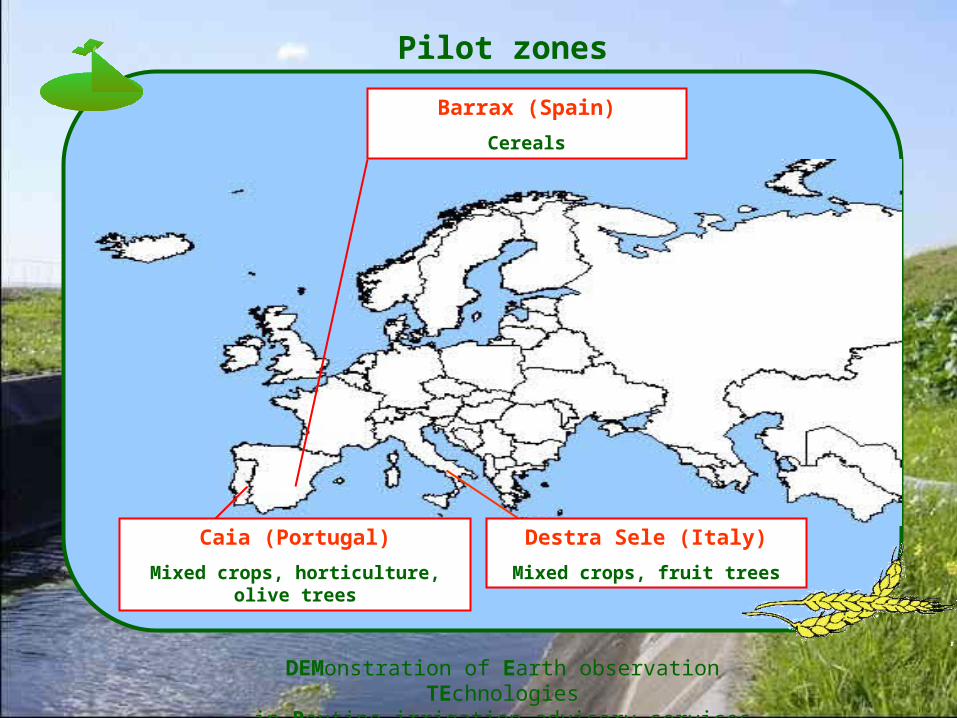
Caia (Portugal)
Mixed crops, horticulture, olive trees
Barrax (Spain)
Cereals
Destra Sele (Italy)
Mixed crops, fruit trees
Pilot zones
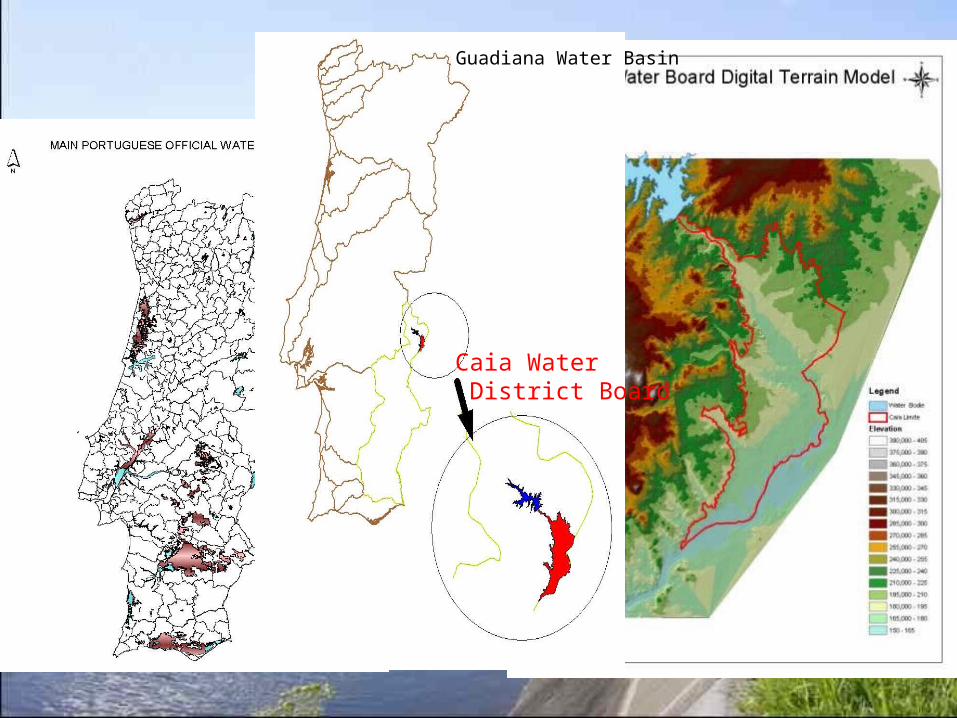
Guadiana Water Basin
Caia Water District Board
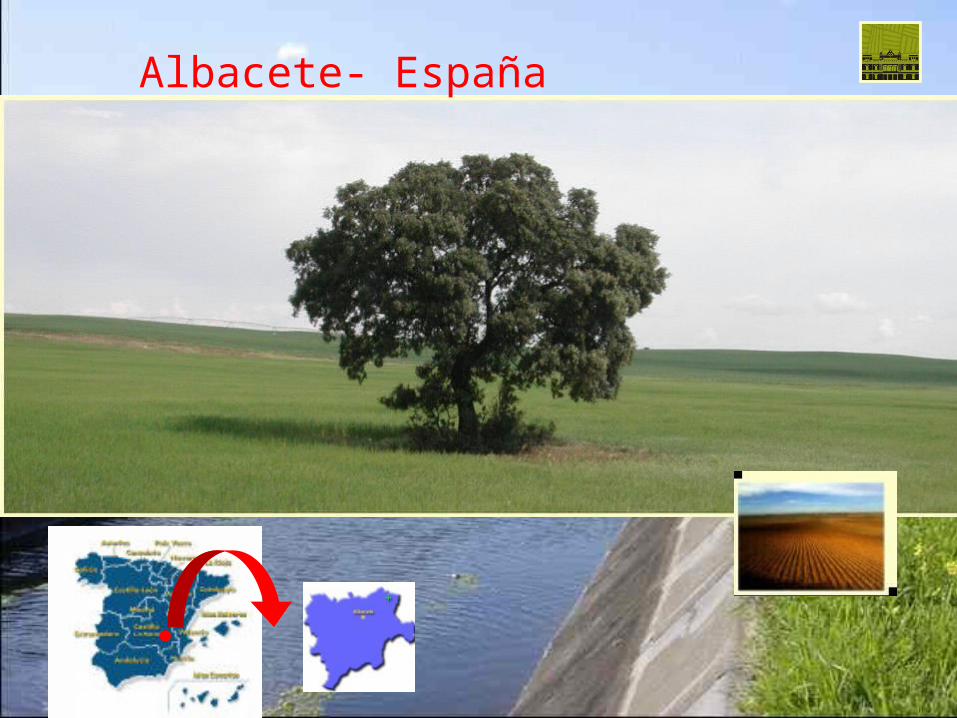
Albacete- España
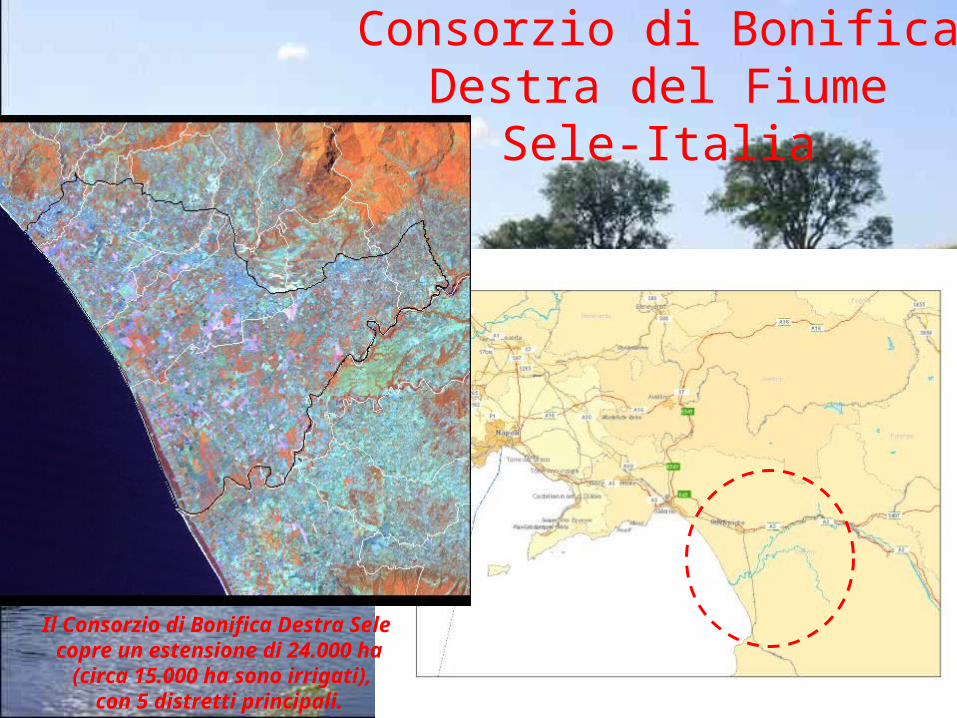
Il Consorzio di Bonifica Destra Sele copre un estensione di 24.000 ha (circa 15.000 ha sono irrigati),
con 5 distretti principali.
Consorzio di Bonifica Destra del Fiume Sele-
Italia
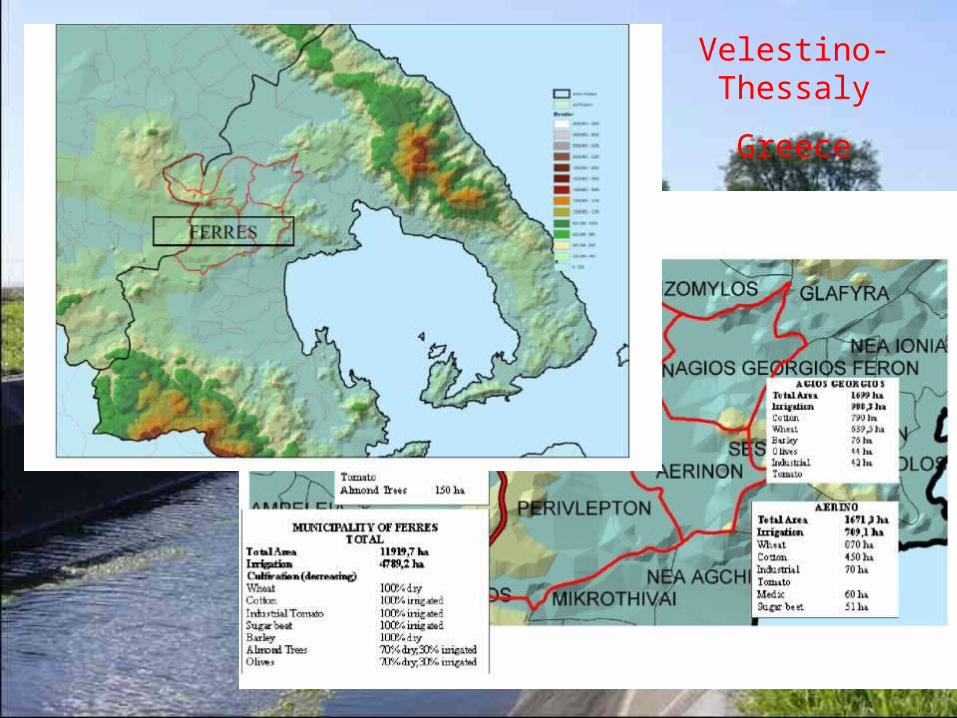
Velestino- Thessaly
Greece
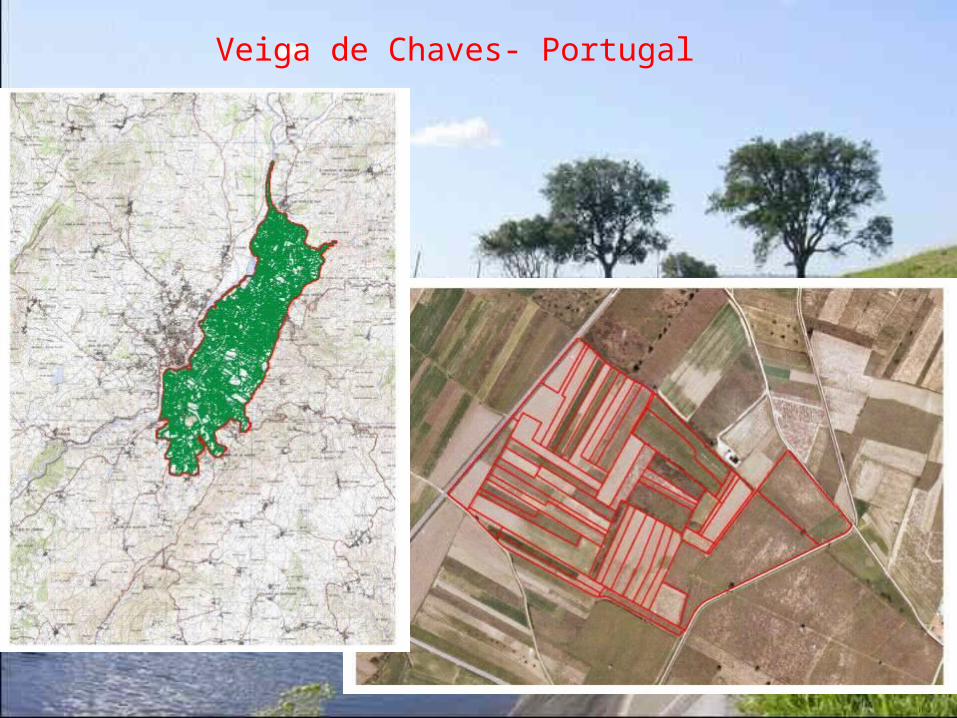
Veiga de Chaves- Portugal
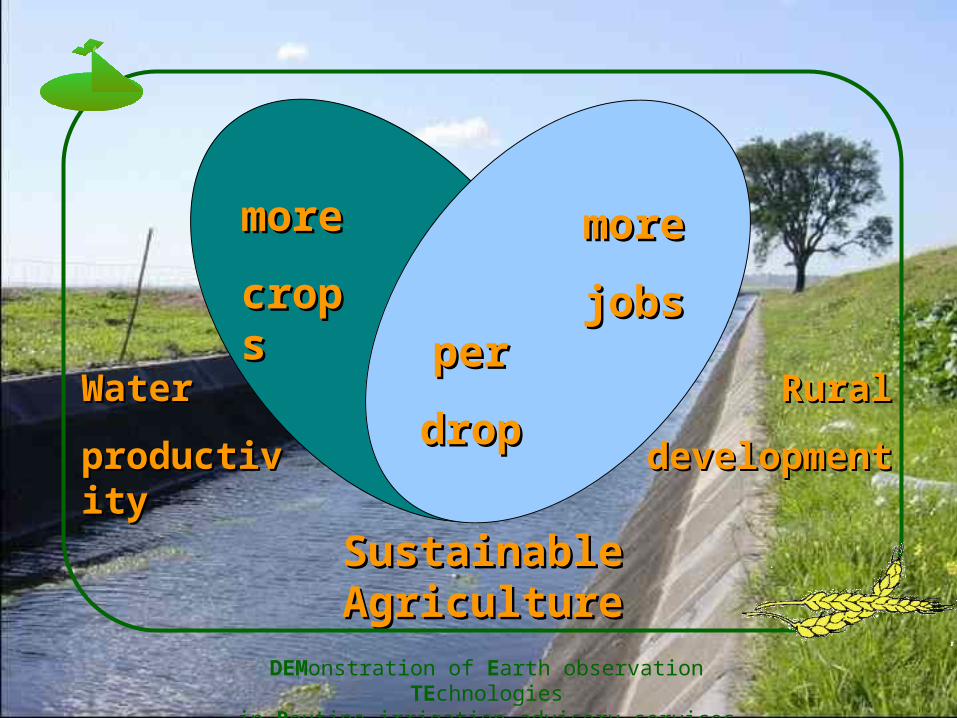
moremore
cropcropss
mormoree
jobsjobsperper
dropdropWaterWater
productiviproductivityty
Sustainable Sustainable AgricultureAgriculture
RuralRural
developmentdevelopment
DEMonstration of Earth observation TEchnologiesin Routine irrigation advisory services

DEMonstration of Earth observation TEchnologiesin Routine irrigation advisory services
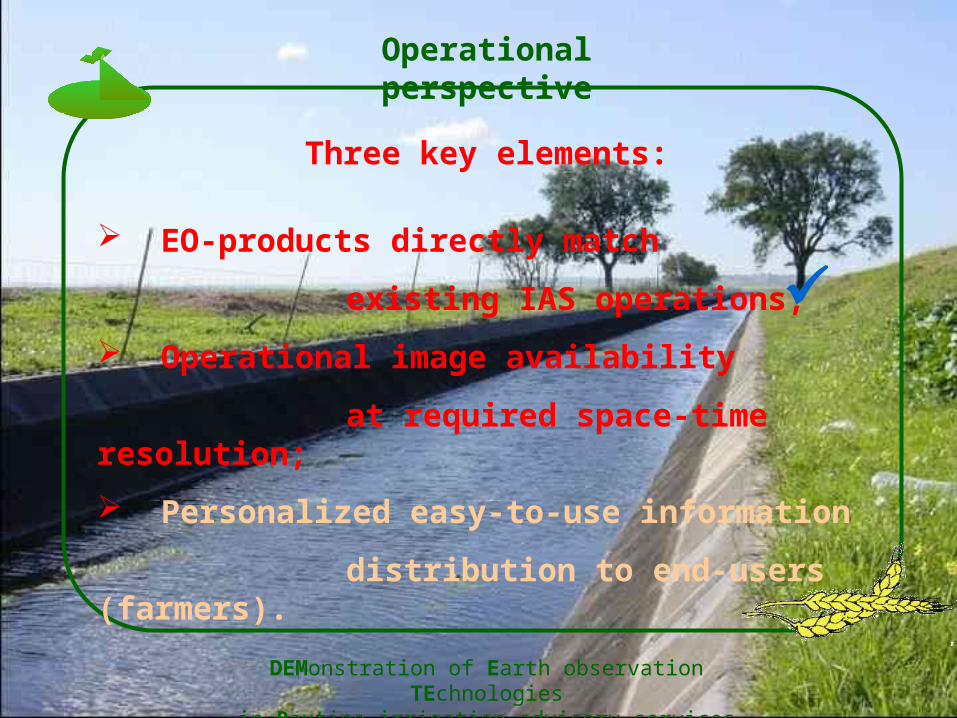
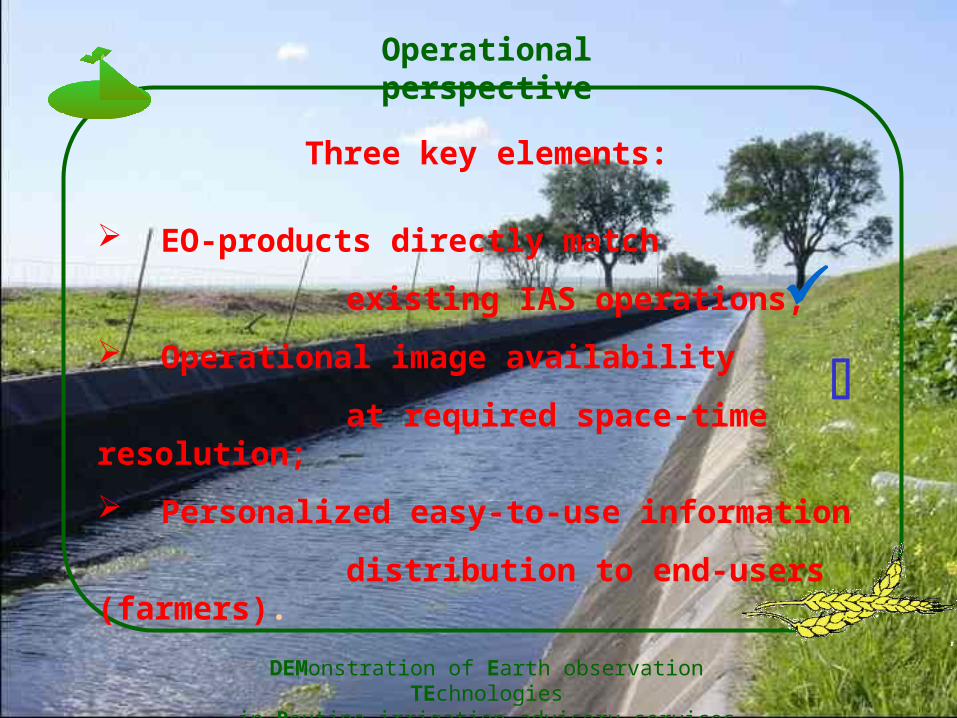
Operational perspective
Three key elements:
EO-products directly match
existing IAS operations;
Operational image availability
at required space-time resolution;
Personalized easy-to-use information
distribution to end-users (farmers).
DEMonstration of Earth observation TEchnologiesin Routine irrigation advisory services
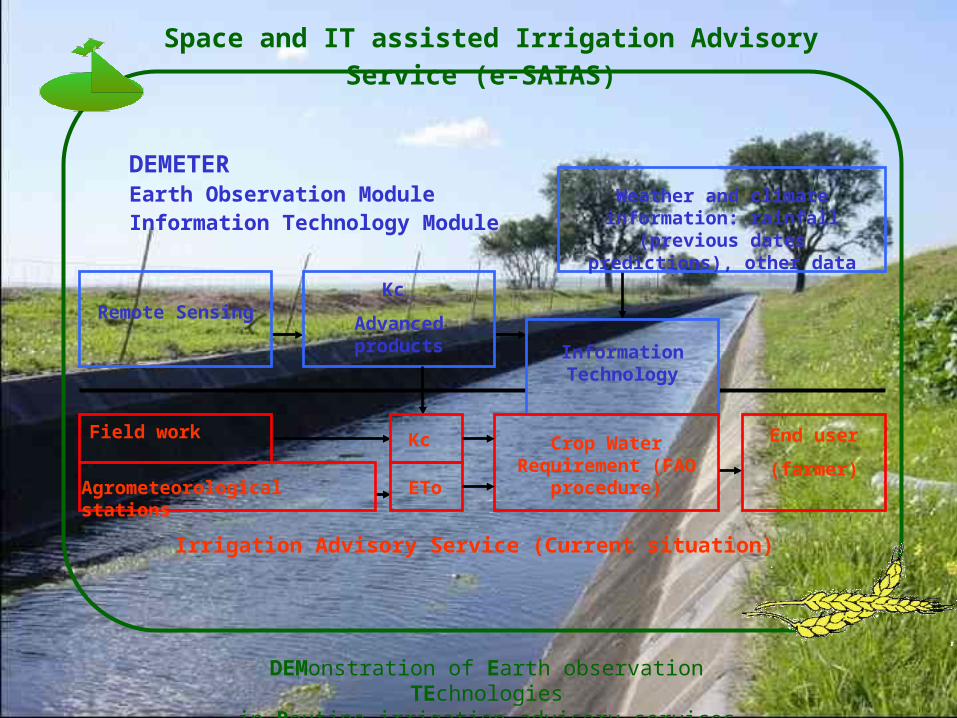
Space and IT assisted Irrigation Advisory Service (e-SAIAS)
Irrigation Advisory Service (Current situation)
DEMETER
Information Technology ModuleWeather and climate information:
rainfall (previous dates predictions), other data
Information Technology
Earth Observation Module
Kc
Advanced productsRemote Sensing
Field work
Agrometeorological stations
Kc
ETo
Crop Water Requirement (FAO
procedure)
End user
(farmer)
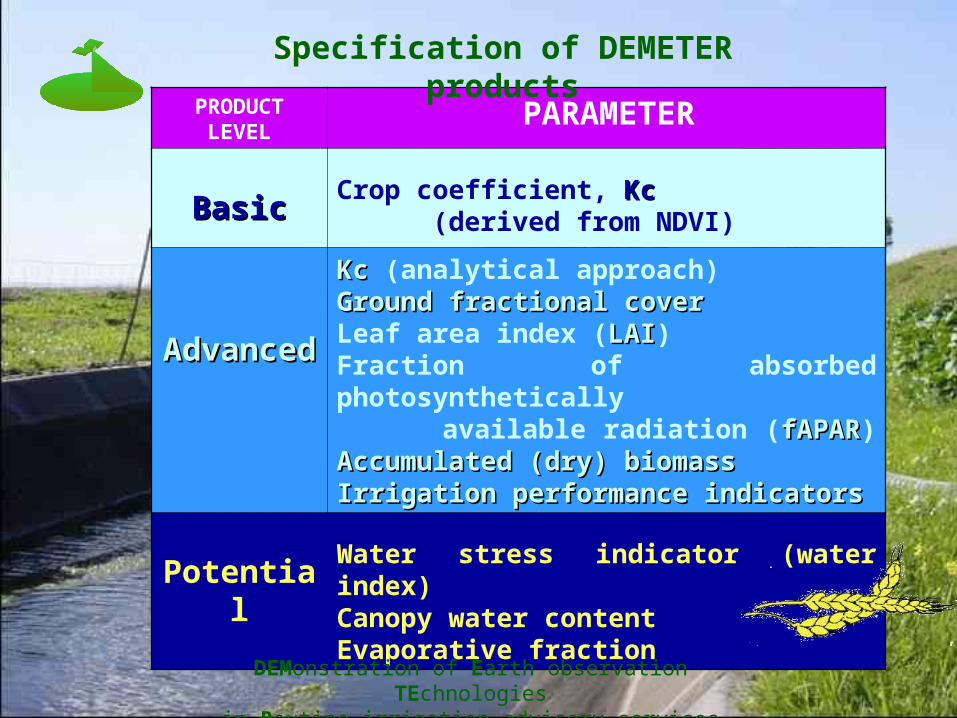
PRODUCT LEVEL
PARAMETER
BasicBasicCrop coefficient, KcKc (derived from NDVI)
AdvancedAdvanced
KcKc (analytical approach) Ground fractional coverGround fractional cover Leaf area index (LAILAI) Fraction of absorbed photosynthetically available radiation (fAPARfAPAR) Accumulated (dry) biomassAccumulated (dry) biomass Irrigation performance indicatorsIrrigation performance indicators
PotentialWater stress indicator (water index) Canopy water content Evaporative fraction
DEMonstration of Earth observation TEchnologiesin Routine irrigation advisory services
Specification of DEMETER products
DEMonstration of Earth observation TEchnologiesin Routine irrigation advisory services
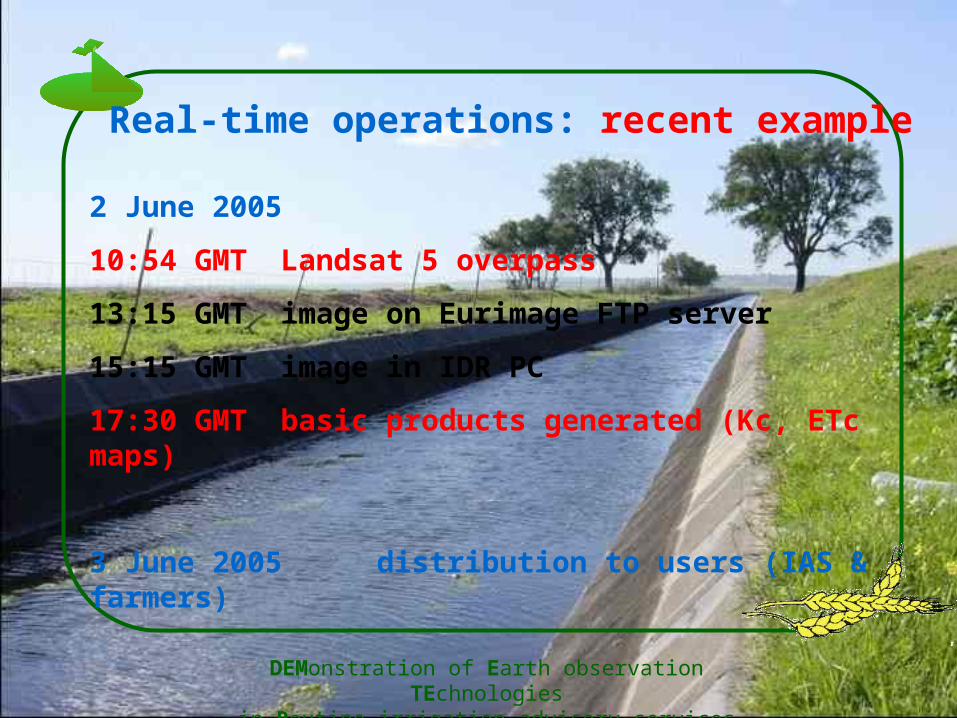
Real-time operations: recent example
2 June 2005
10:54 GMT Landsat 5 overpass
13:15 GMT image on Eurimage FTP server
15:15 GMT image in IDR PC
17:30 GMT basic products generated (Kc, ETc maps)
3 June 2005 distribution to users (IAS & farmers)
DEMonstration of Earth observation TEchnologiesin Routine irrigation advisory services
Operational perspective
Three key elements:
EO-products directly match
existing IAS operations;
Operational image availability
at required space-time resolution;
Personalized easy-to-use information
distribution to end-users (farmers).
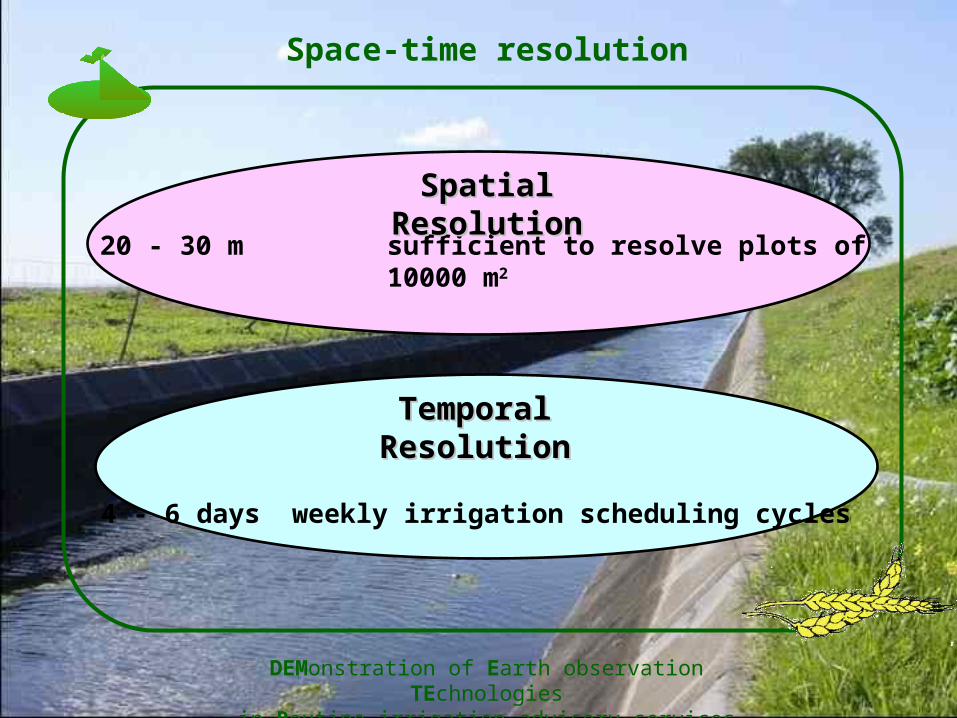
20 - 30 m sufficient to resolve plots of 10000 m2
4 - 6 days weekly irrigation scheduling cycles
DEMonstration of Earth observation TEchnologiesin Routine irrigation advisory services
Space-time resolution
Spatial ResolutionSpatial Resolution
Temporal ResolutionTemporal Resolution
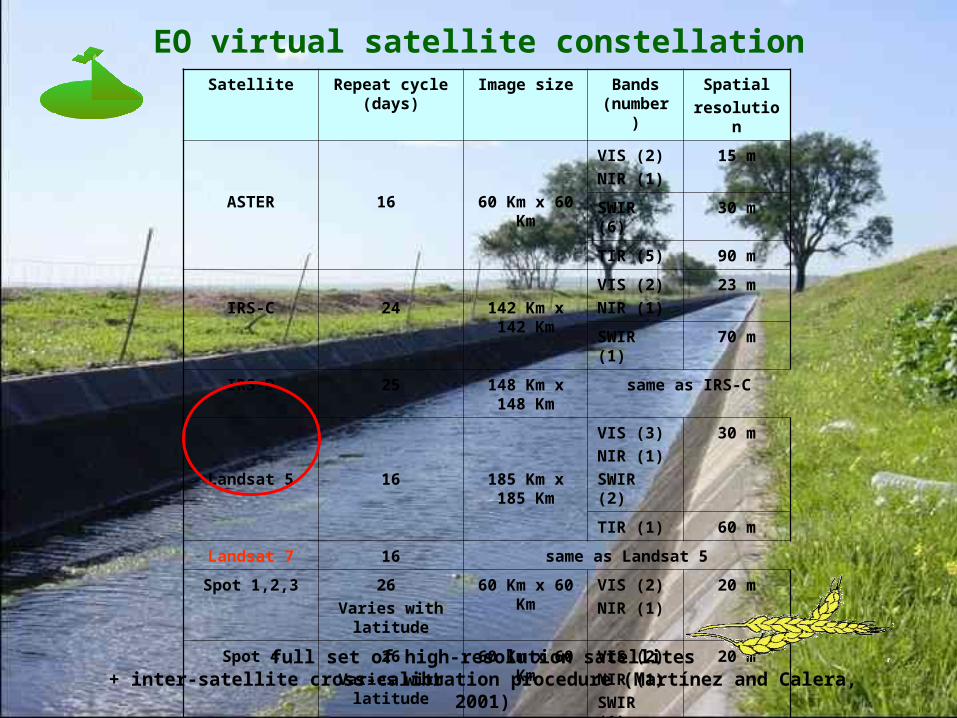
EO virtual satellite constellationSatellite Repeat cycle
(days)Image size Bands
(number)Spatial
resolution
ASTER 16 60 Km x 60 Km
VIS (2)
NIR (1)
15 m
SWIR (6) 30 m
TIR (5) 90 m
IRS-C 24 142 Km x 142 Km
VIS (2)
NIR (1)
23 m
SWIR (1) 70 m
IRS-D 25 148 Km x 148 Km
same as IRS-C
Landsat 5 16 185 Km x 185 Km
VIS (3)
NIR (1)
SWIR (2)
30 m
TIR (1) 60 m
Landsat 7 16 same as Landsat 5
Spot 1,2,3 26
Varies with latitude
60 Km x 60 Km
VIS (2)
NIR (1)
20 m
Spot 4 26
Varies with latitude
60 Km x 60 Km
VIS (2)
NIR (1)
SWIR (1)
20 m
full set of high-resolution satellites+ inter-satellite cross-calibration procedure (Martínez and Calera, 2001)
0.00
0.20
0.40
0.60
0.80
1.00
1.20
1.40
1.60
1-M
ar
15-M
ar
29-M
ar
12-A
pr
26-A
pr
10-M
ay
24-M
ay
7-J
un
21-J
un
5-J
ul
19-J
ul
2-A
ug
16-A
ug
30-A
ug
13-S
ep
27-S
ep
11-O
ct
25-O
ct
dates
Kc
maize
wheat
IRS
LANDSAT 7
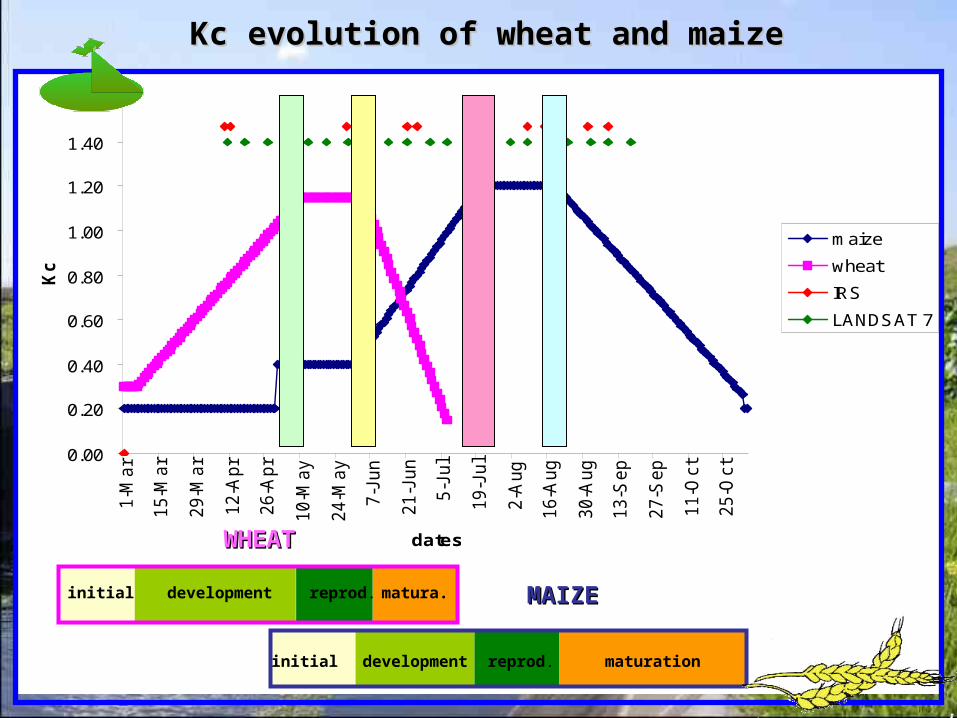
Kc evolution of wheat and maizeKc evolution of wheat and maize
initial development reprod. maturation
initial matura.reprod.development
WHEATWHEAT
MAIZEMAIZE
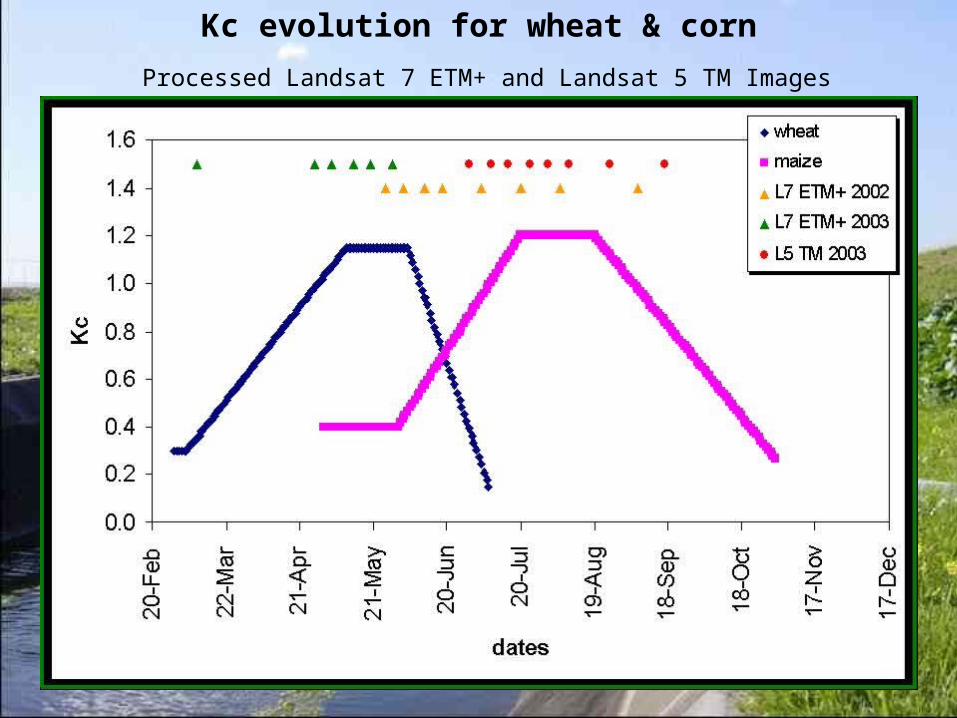
Kc evolution for wheat & corn
Processed Landsat 7 ETM+ and Landsat 5 TM Images
0
1
2
3
4
5
6
140 160 180 200 220 240 260 280 300
LA
I
DOY
0
0.2
0.4
0.6
0.8
1
140 160 180 200 220 240 260 280 300
gre
en f
c
DOY
0
0,5
1
1,5
2
2,5
3
140 160 180 200 220 240 260 280 300
Bio
mas
s (K
g/m
2)
DOY
0
0.5
1
1.5
2
2.5
140 160 180 200 220 240 260 280 300
Hei
gh
t (m
)
DOY
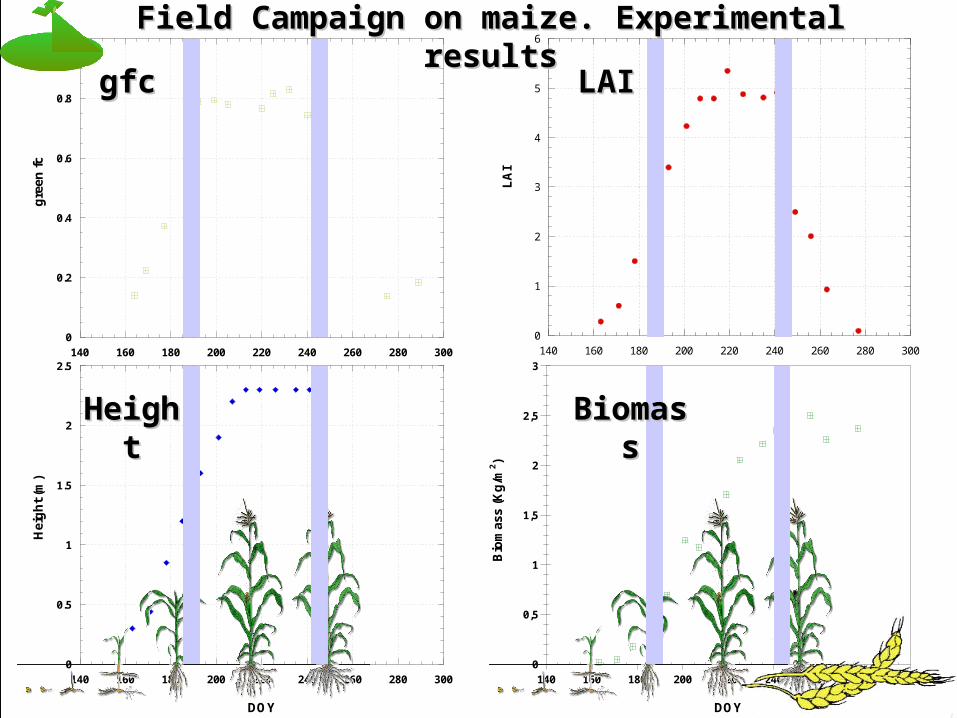
LAILAI
BiomassBiomassHeightHeight
gfcgfc
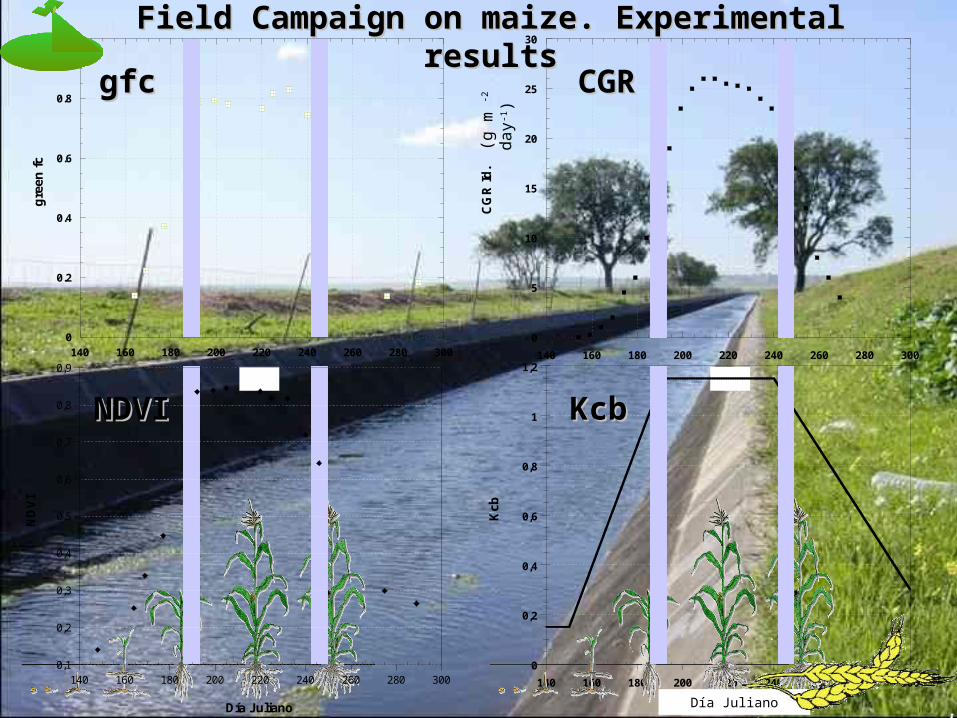
Field Campaign on maize. Experimental resultsField Campaign on maize. Experimental results
0
0.2
0.4
0.6
0.8
1
140 160 180 200 220 240 260 280 300
gre
en f
c
DOY
0
5
10
15
20
25
30
140 160 180 200 220 240 260 280 300
CG
R Id
.
DOY
0
0,2
0,4
0,6
0,8
1
1,2
140 160 180 200 220 240 260 280 300
Kcb
DOY
(g m
-2 d
ay-1)
0,1
0,2
0,3
0,4
0,5
0,6
0,7
0,8
0,9
140 160 180 200 220 240 260 280 300
ND
VI
Día Juliano Día Juliano
NDVINDVI
gfcgfc CGRCGR
KcbKcb
Field Campaign on maize. Experimental resultsField Campaign on maize. Experimental results
0
0.2
0.4
0.6
0.8
1
0
0.2
0.4
0.6
0.8
1
1.2
1.4
150 200 250 300
NDVINDVI
Kcb
DOY
Kcb
0
0.2
0.4
0.6
0.8
1
0
0.2
0.4
0.6
0.8
1
1.2
1.4
150 200 250 300
NDVINDVI
Kcb
DOY
Kcb
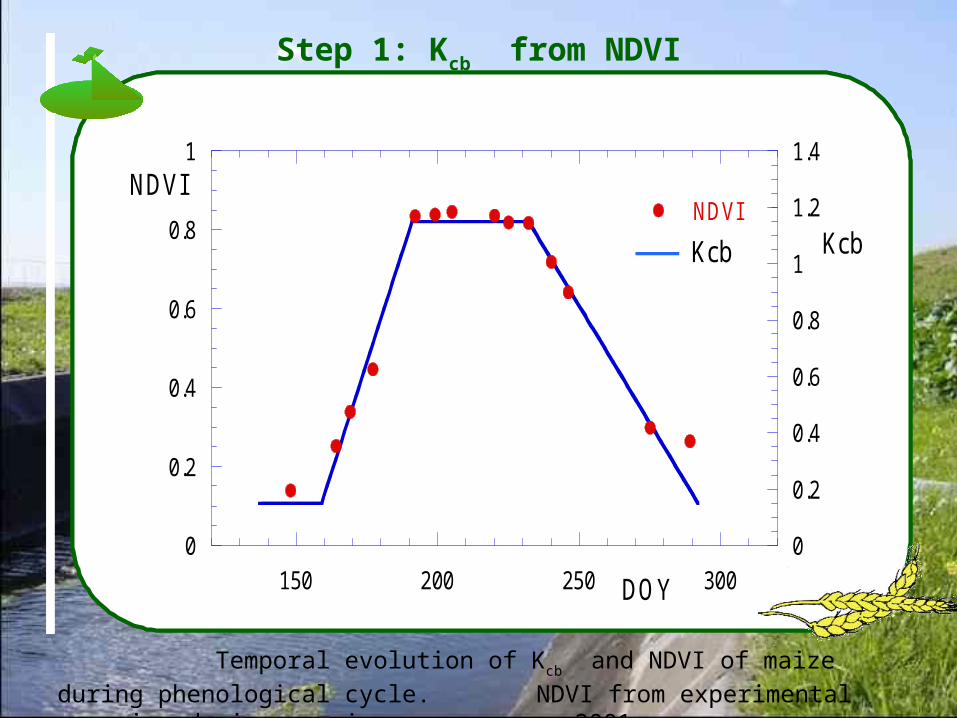
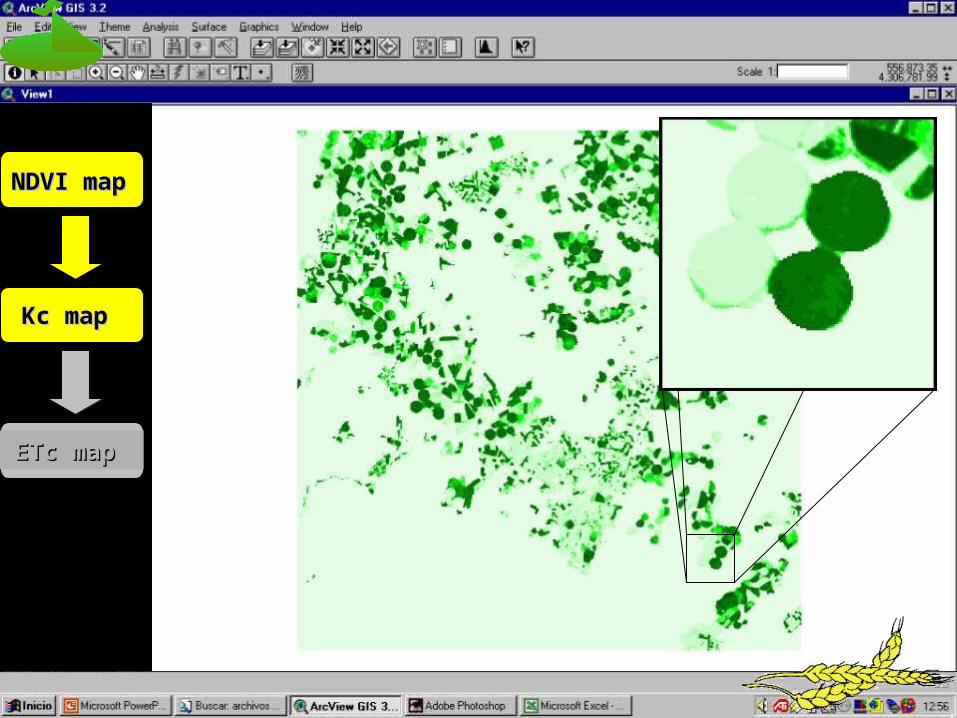
Step 1: Kcb from NDVI
Temporal evolution of Kcb and NDVI of maize during phenological cycle.
NDVI from experimental campaign during growing season year 2001.
DEMonstration of Earth observation TEchnologiesin Routine irrigation advisory services
Operational perspective
Three key elements:
EO-products directly match
existing IAS operations;
Operational image availability
at required space-time resolution;
Personalized easy-to-use information
distribution to end-users (farmers).
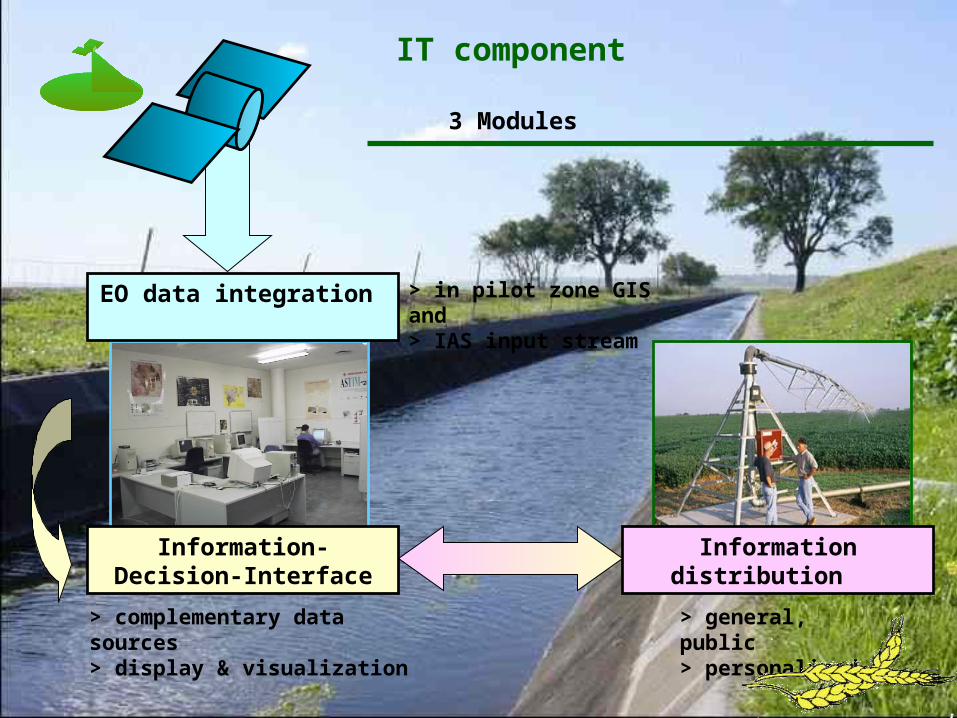
3 Modules
IT component
> in pilot zone GIS and > IAS input stream
> complementary data sources> display & visualization
> general, public > personalized
Information-Decision-Interface
Information distribution s
EO data integration s
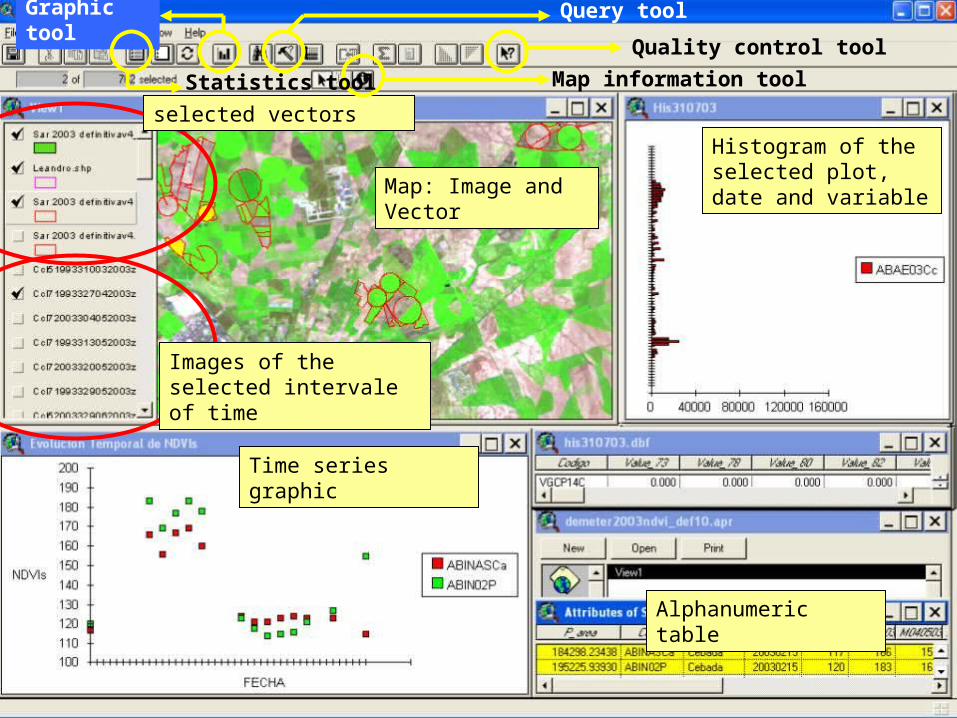
Images of the selected intervale of time
selected vectors
Map: Image and Vector
Histogram of the selected plot, date and variable
Time series graphic
Alphanumeric table
Map information tool
Query toolGraphic tool
Quality control tool
Statistics tool
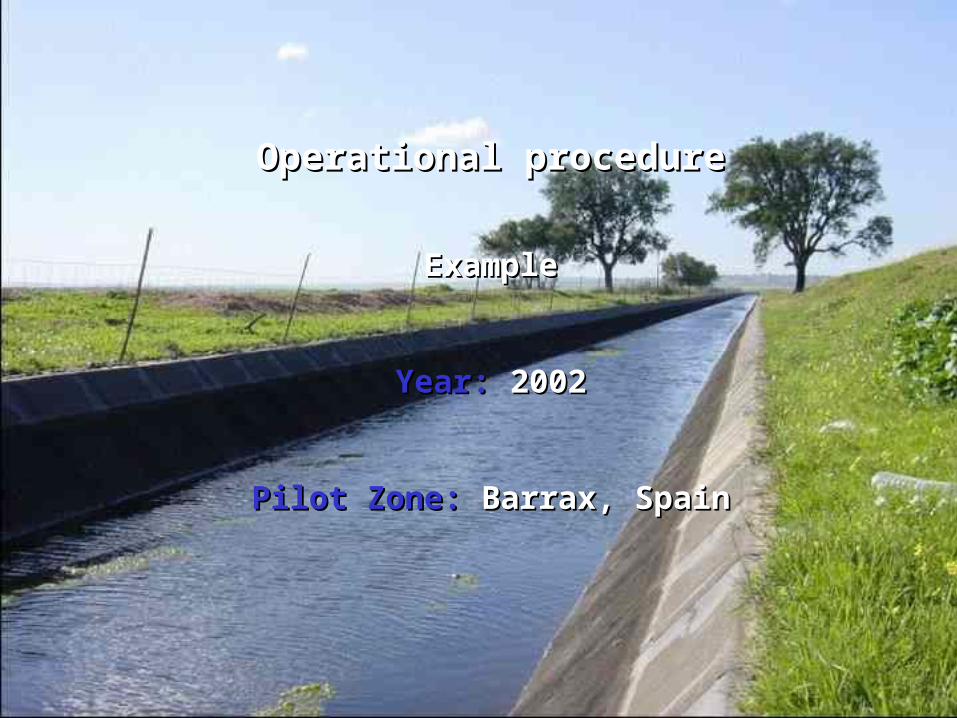
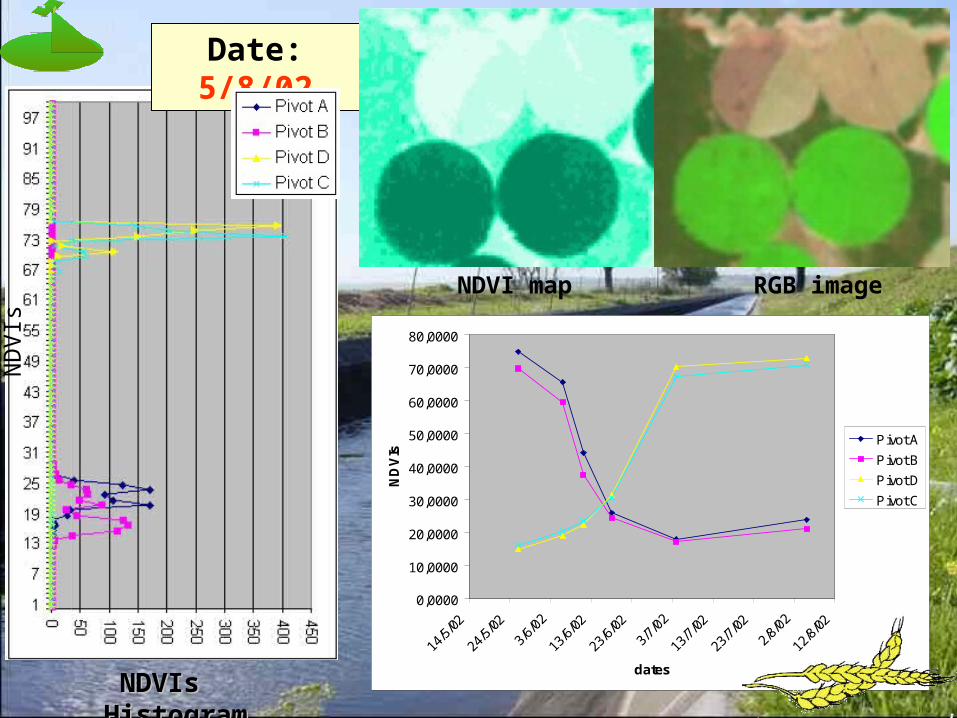
Operational procedureOperational procedure
ExampleExample
Year:Year: 20022002
Pilot Zone:Pilot Zone: Barrax, SpainBarrax, Spain
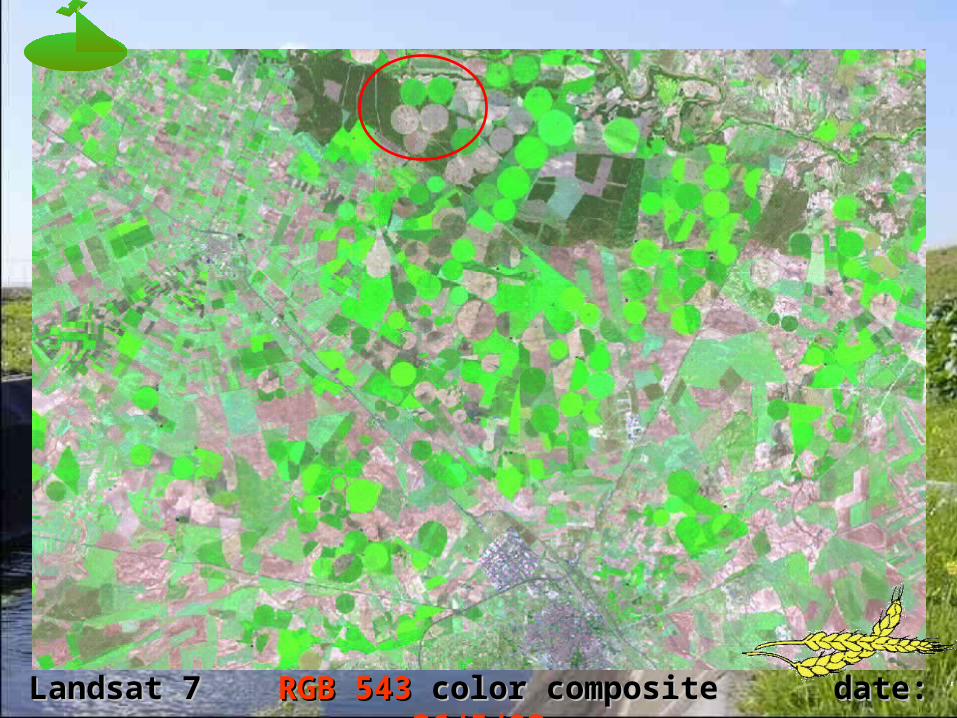
Landsat 7 Landsat 7 RGB 543RGB 543 color composite date: color composite date: 26/5/0226/5/02
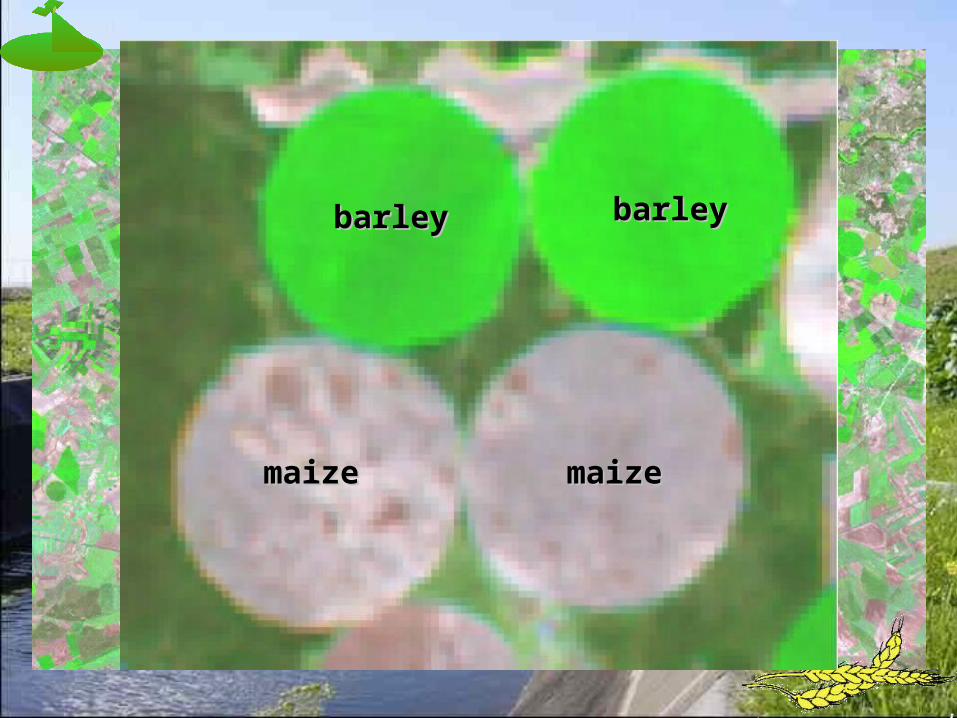
barleybarley barleybarley
maizemaize maizemaize
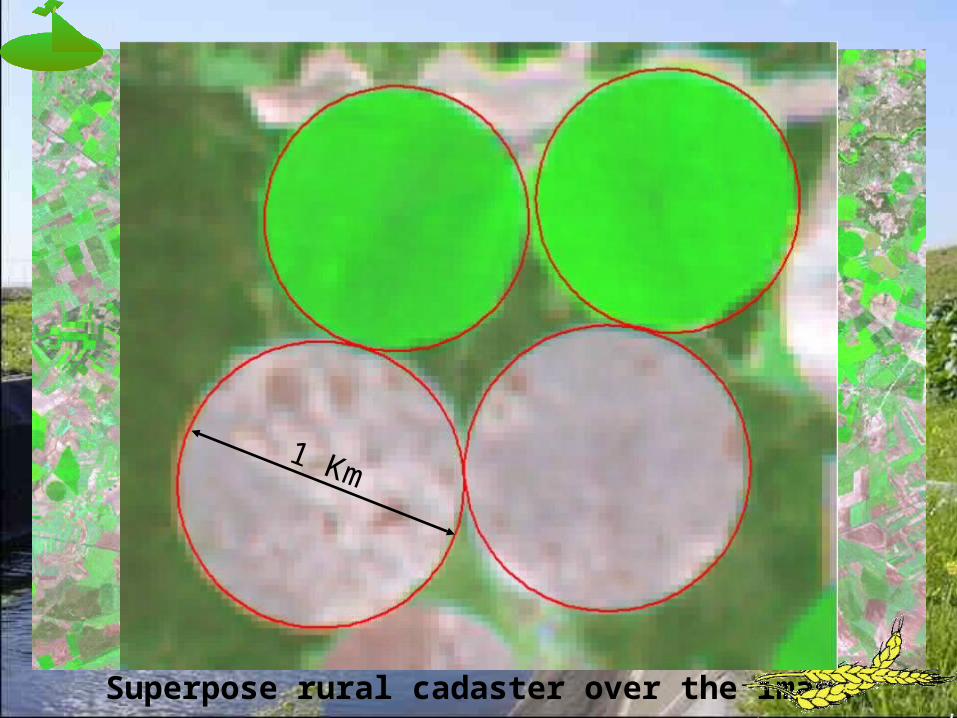
Superpose rural cadaster over the image
1 Km
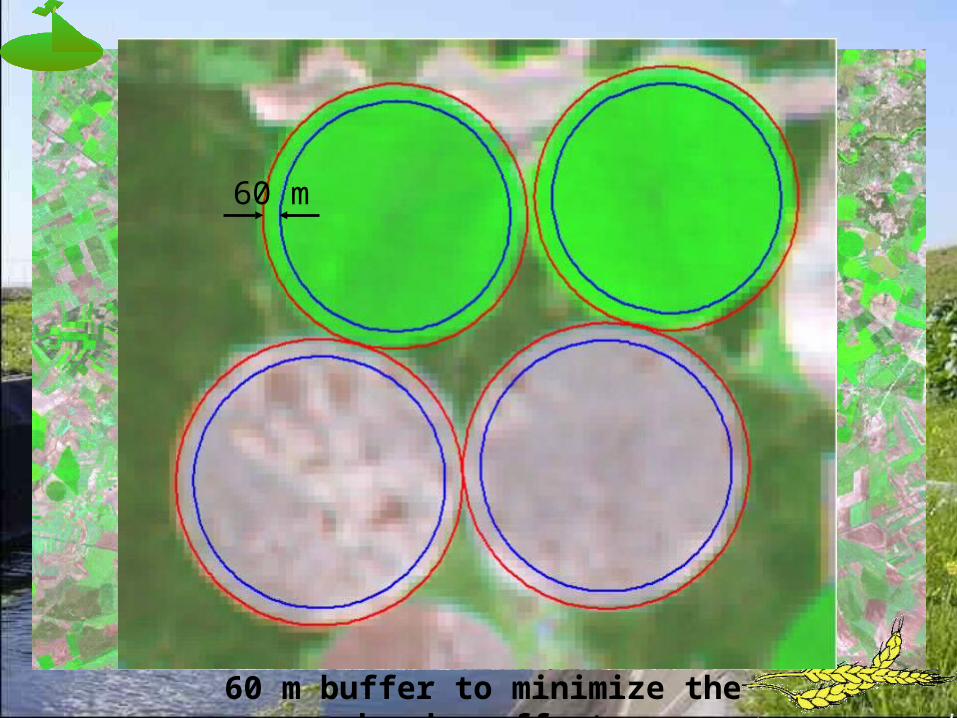
60 m buffer to minimize the border effect
60 m
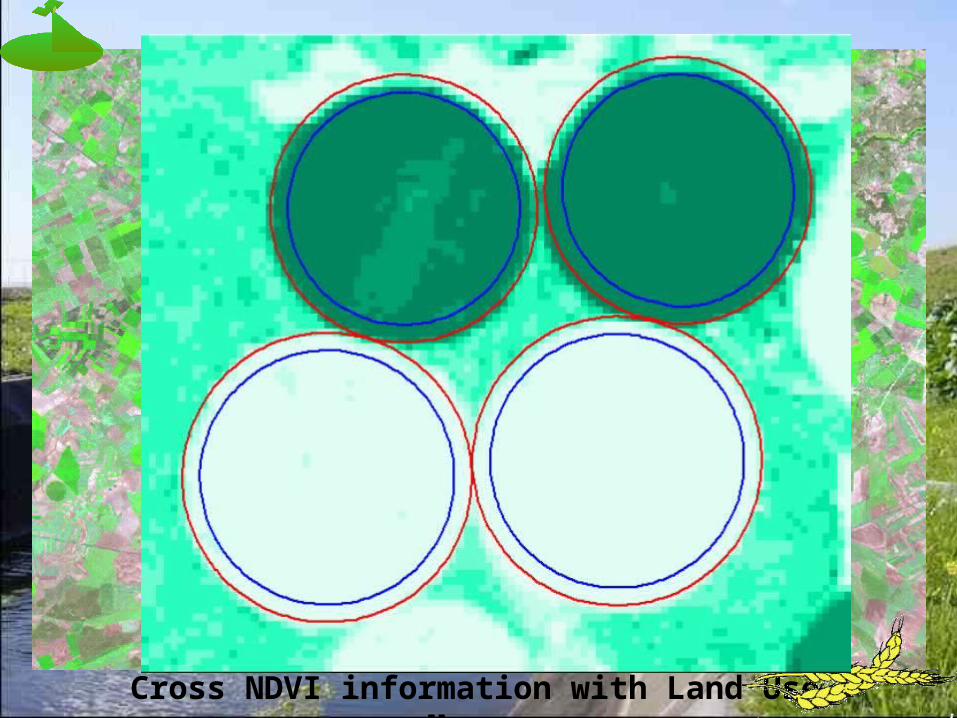
Cross NDVI information with Land Use Maps
0.0000
10.0000
20.0000
30.0000
40.0000
50.0000
60.0000
70.0000
80.0000
dates
ND
VIs
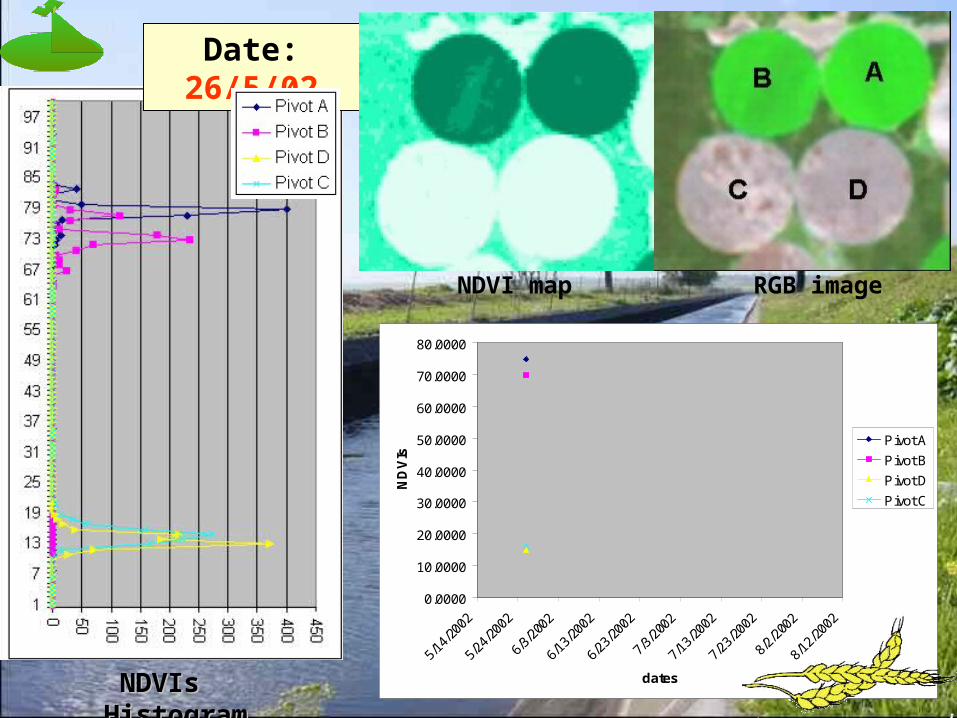
Pivot A
Pivot B
Pivot D
Pivot C
NDVIs HistogramNDVIs Histogram
Date: 26/5/02
NDVI map RGB image
0,0000
10,0000
20,0000
30,0000
40,0000
50,0000
60,0000
70,0000
80,0000
dates
ND
VIs
Pivot A
Pivot B
Pivot D
Pivot C
NDVIs HistogramNDVIs Histogram
Date: 5/8/02N
DV
Is
NDVI map RGB image
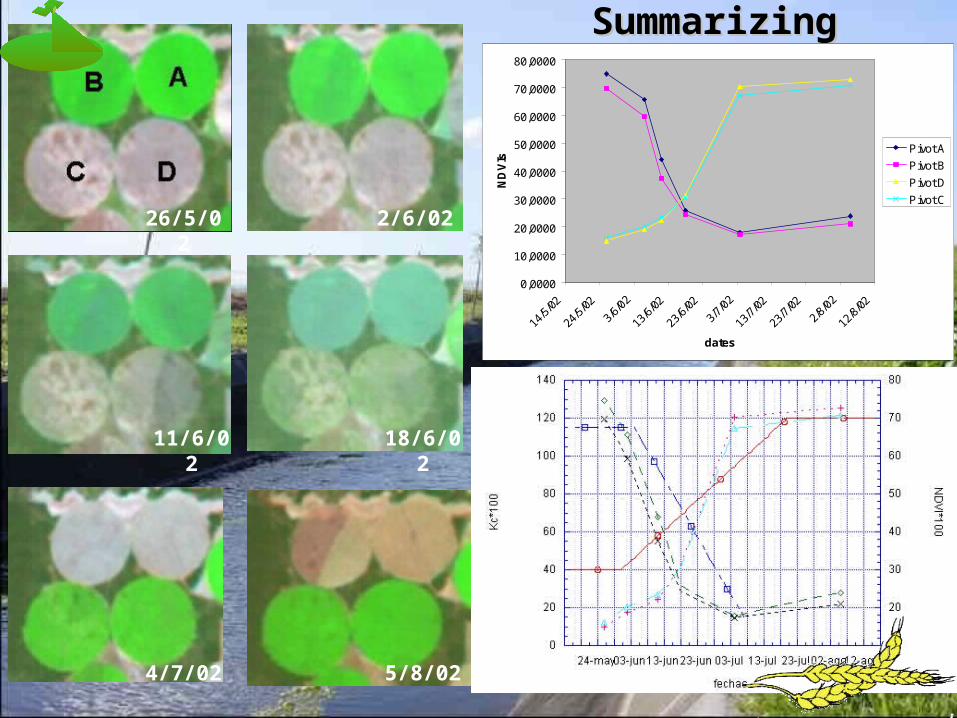
26/5/02 2/6/02
11/6/02 18/6/02
4/7/02 5/8/02
SummarizingSummarizing
0,0000
10,0000
20,0000
30,0000
40,0000
50,0000
60,0000
70,0000
80,0000
dates
ND
VIs
Pivot A
Pivot B
Pivot D
Pivot C
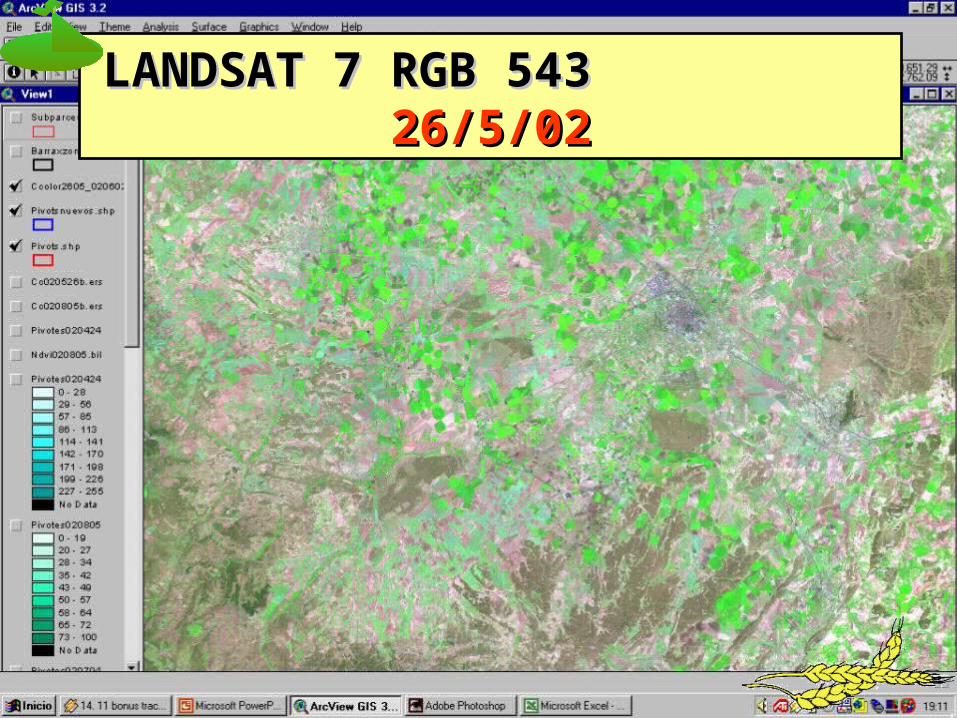
LANDSAT 7 RGB 543 LANDSAT 7 RGB 543 26/5/0226/5/02
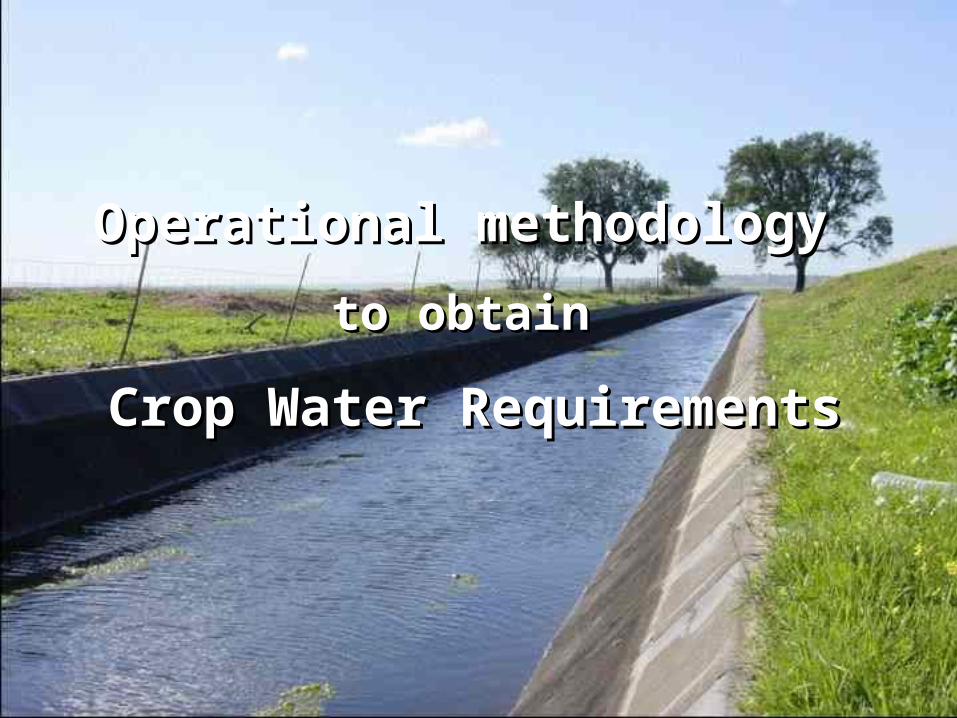
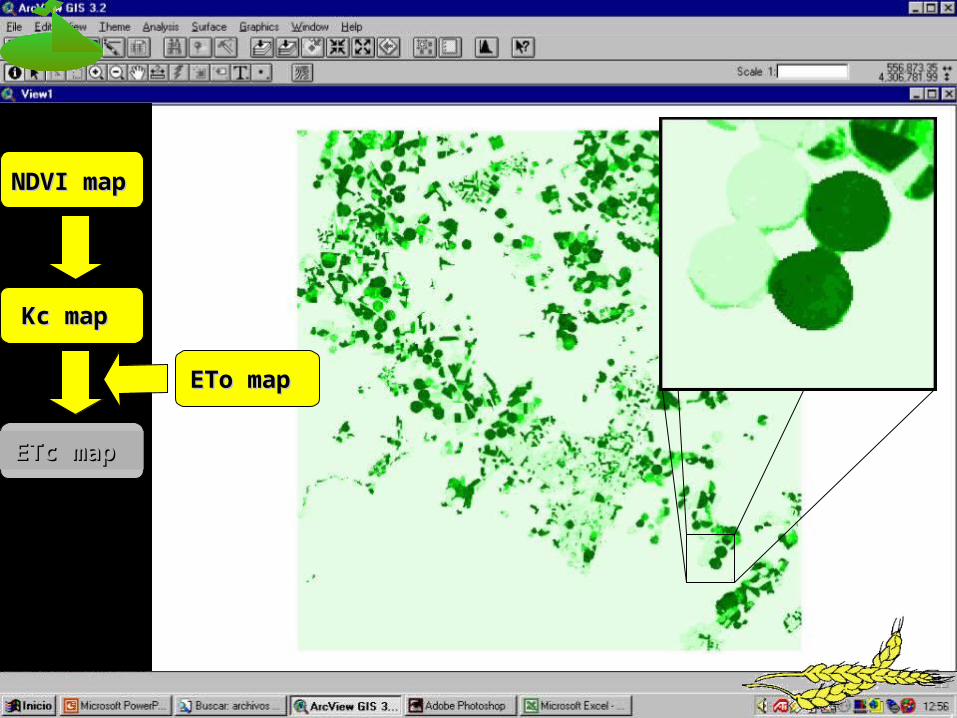
Operational methodologyOperational methodology
to obtain to obtain
Crop Water RequirementsCrop Water Requirements
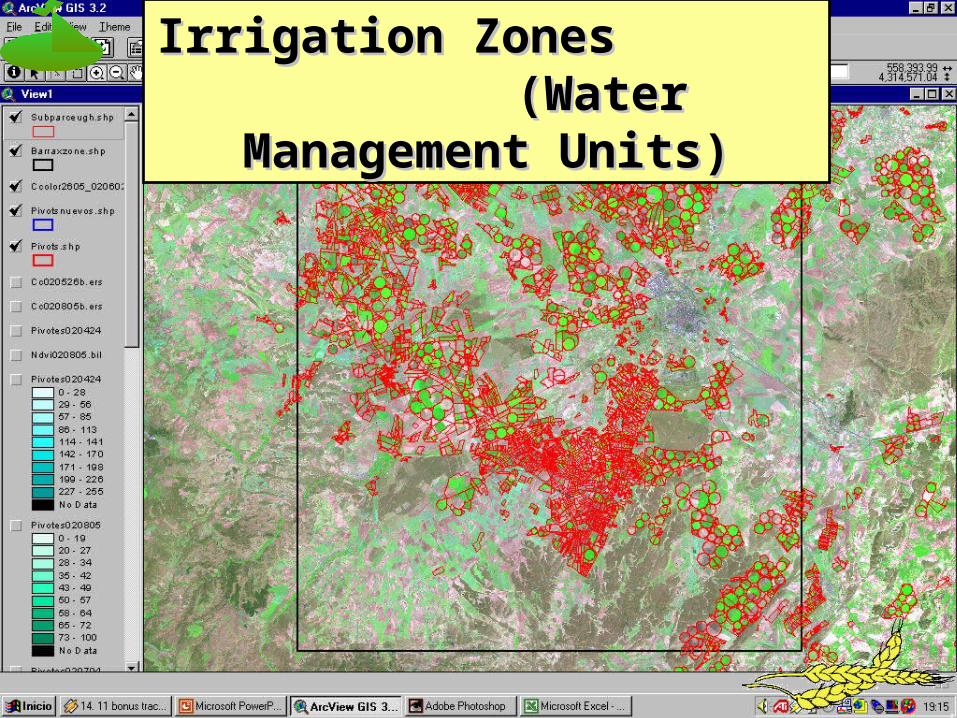
Irrigation Zones Irrigation Zones (Water Management Units)(Water Management Units)
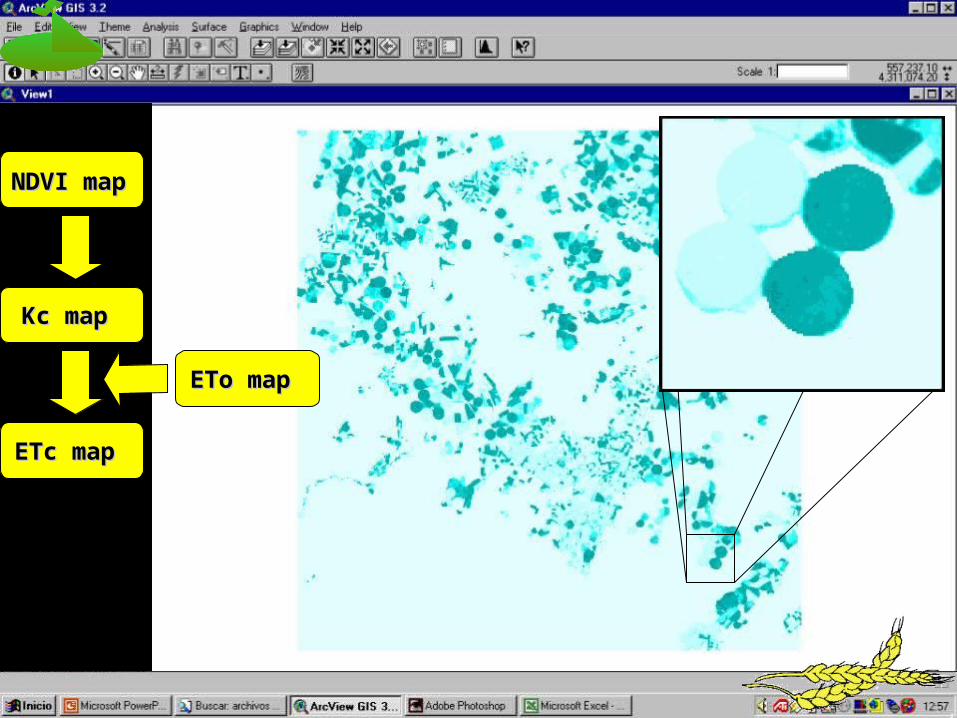
Kc mapKc map
ETc mapETc map
NDVI mapNDVI map
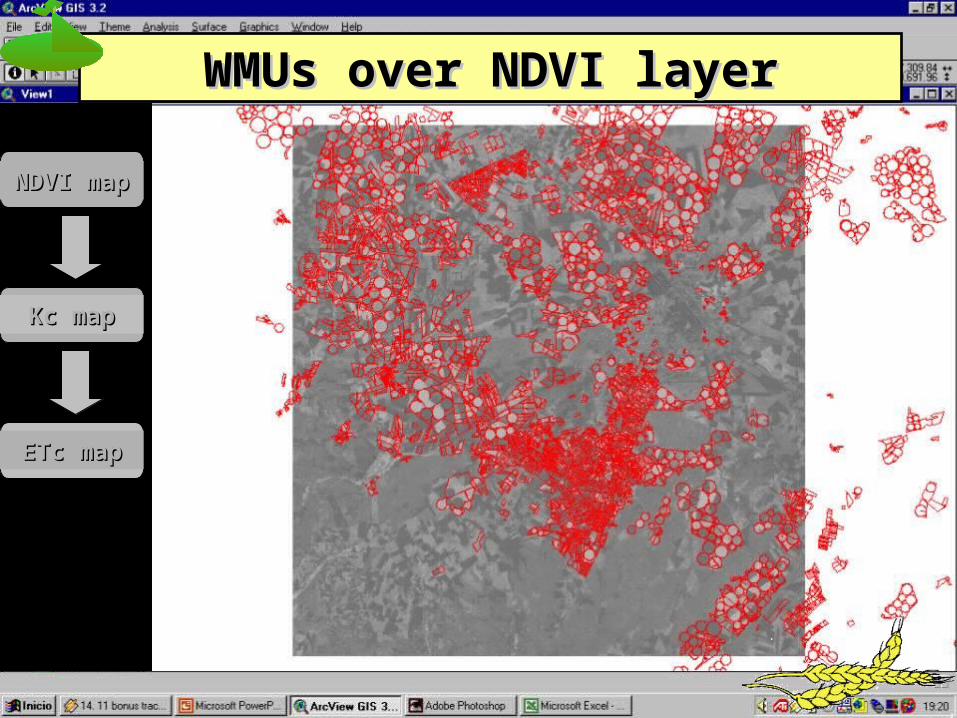
WMUs over NDVI layerWMUs over NDVI layer
NDVI mapNDVI map
Kc map Kc map
ETc map ETc map
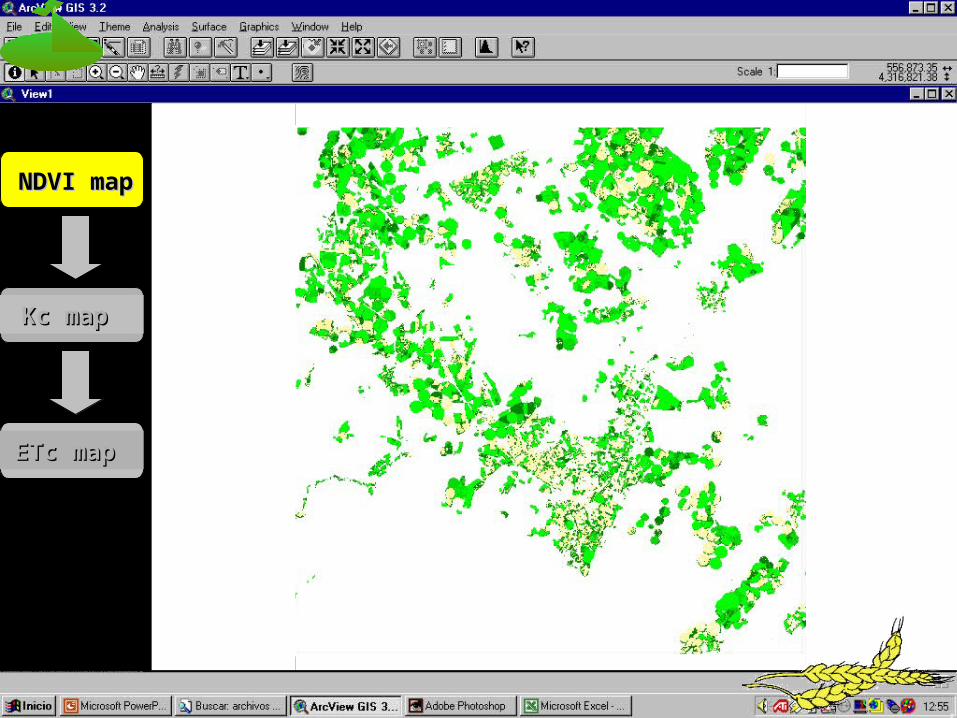
NDVI map NDVI map
Kc map Kc map
ETc map ETc map
NDVI map NDVI map
Kc map Kc map
ETc map ETc map
ETo map ETo map
NDVI map NDVI map
Kc map Kc map
ETo map ETo map
Mapa ETcMapa ETcETc map ETc map
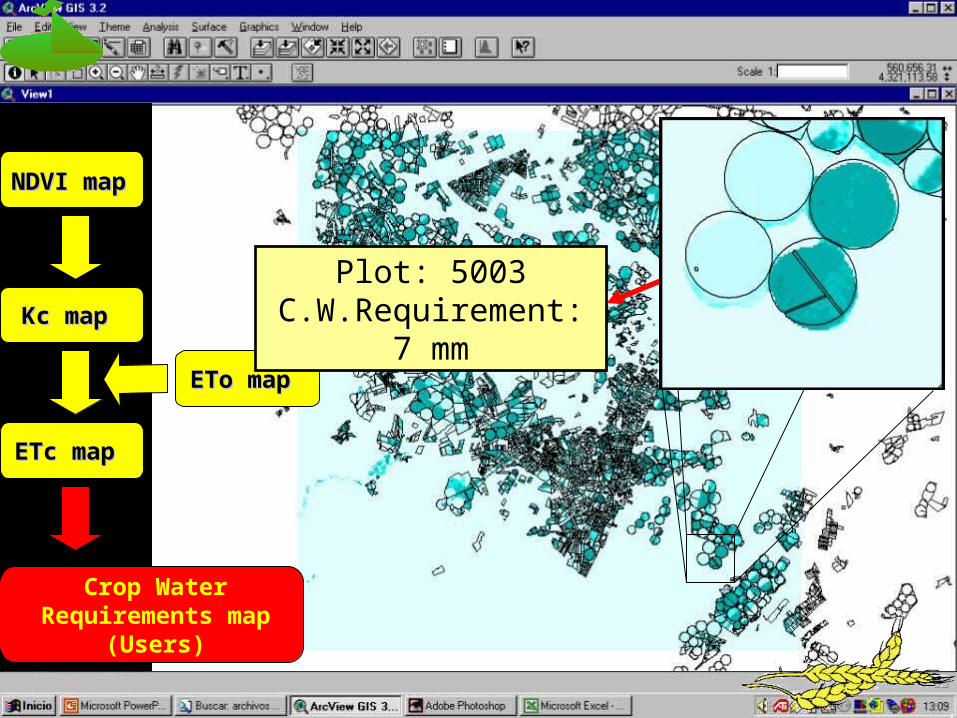
NDVI map NDVI map
Kc map Kc map
Crop Water Requirements map
(Users)
ETc map ETc map
ETo map ETo map
Plot: 5003 C.W.Requirement: 7 mm
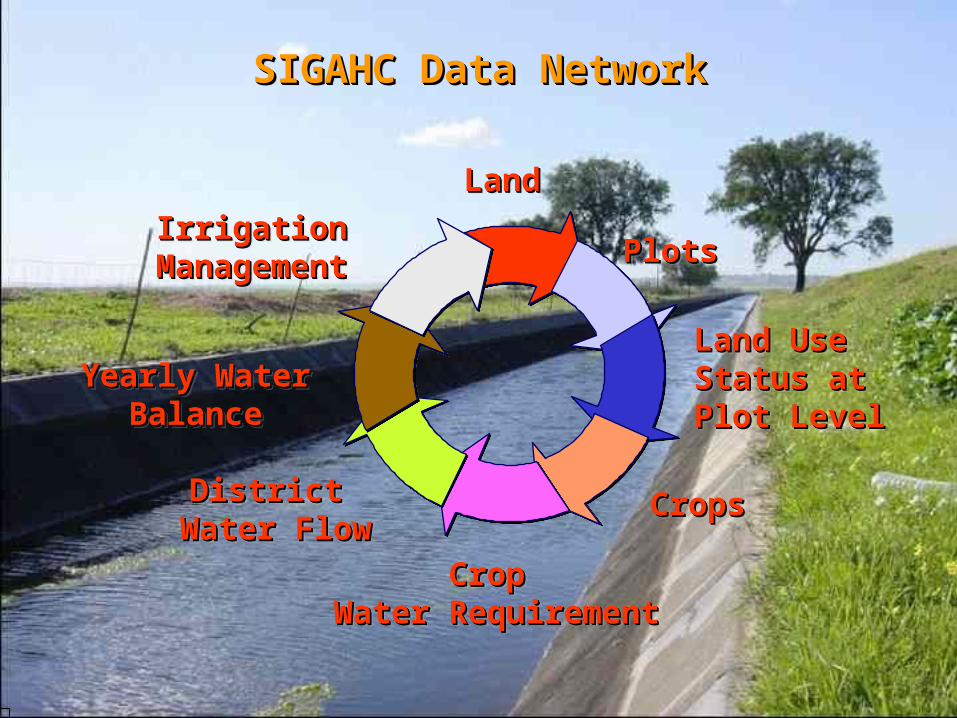
LandLand LandLand
PlotsPlots PlotsPlots
Land Use Land Use Status at Status at Plot LevelPlot Level
Land Use Land Use Status at Status at Plot LevelPlot Level
CropsCropsCropsCrops
Crop Crop Water RequirementWater Requirement
Crop Crop Water RequirementWater Requirement
District District Water FlowWater Flow
District District Water FlowWater Flow
Yearly WaterYearly Water BalanceBalance
Yearly WaterYearly Water BalanceBalance
Irrigation Irrigation ManagementManagement
Irrigation Irrigation ManagementManagement
SIGAHC Data NetworkSIGAHC Data NetworkSIGAHC Data NetworkSIGAHC Data Network
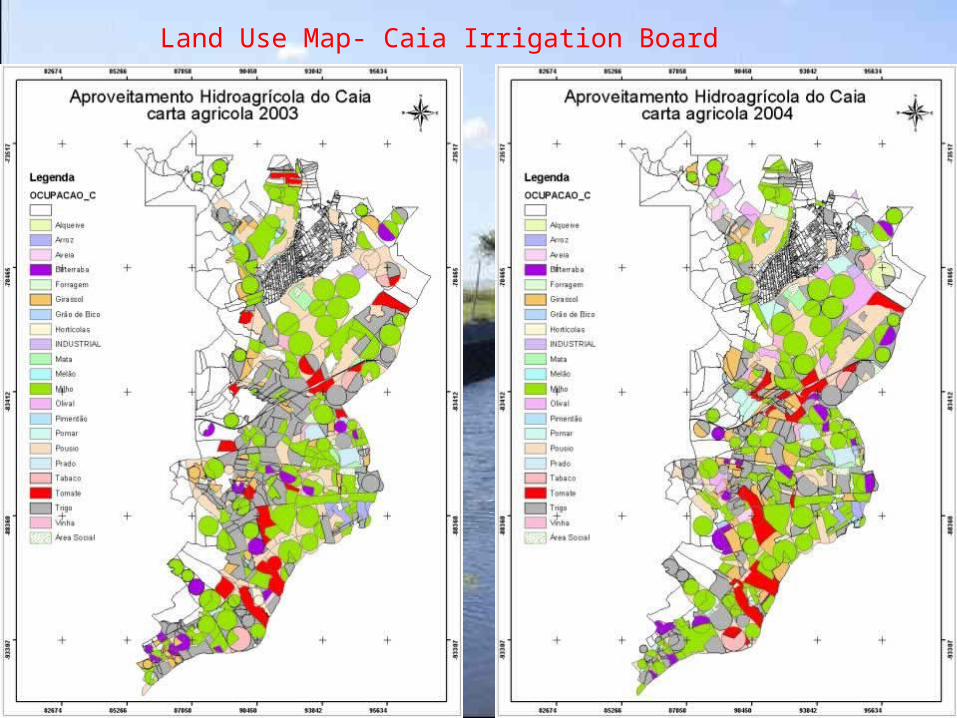
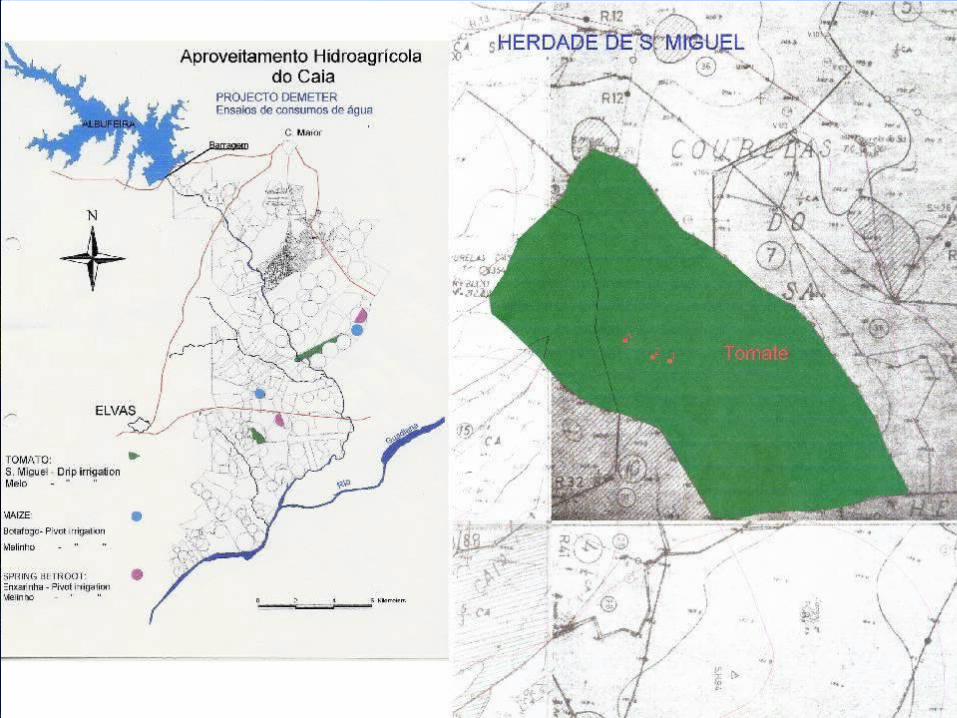
Land Use Map- Caia Irrigation Board
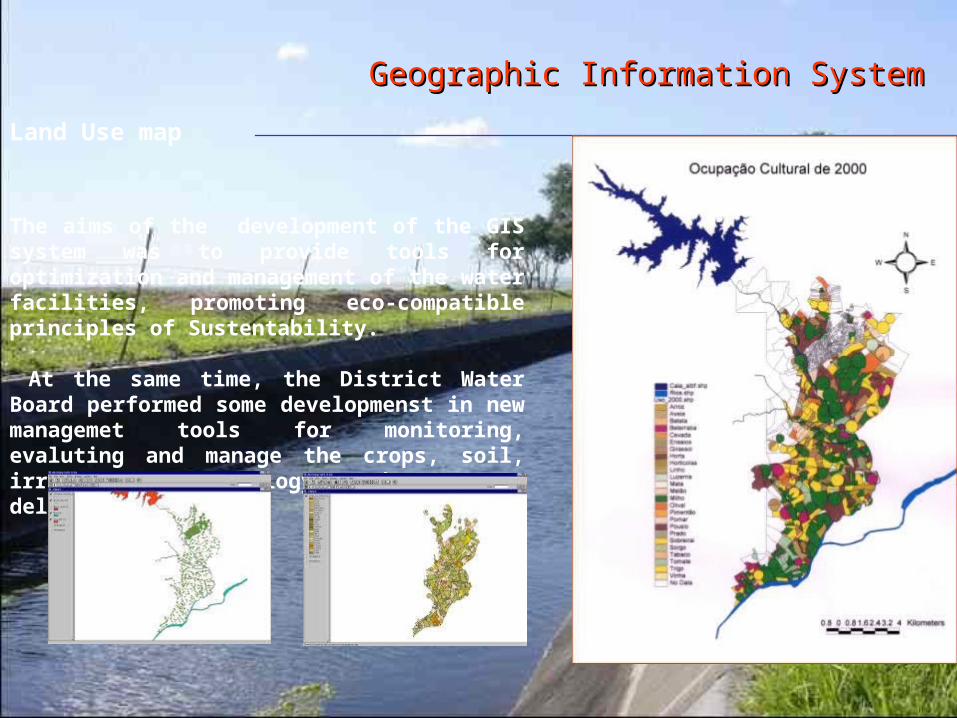
Geographic Information SystemGeographic Information System
The aims of the development of the GIS system was to provide tools for optimization and management of the water facilities, promoting eco-compatible principles of Sustentability.
At the same time, the District Water Board performed some developmenst in new managemet tools for monitoring, evaluting and manage the crops, soil, irrigation techonology and water delevery efciciency.
Land Use map
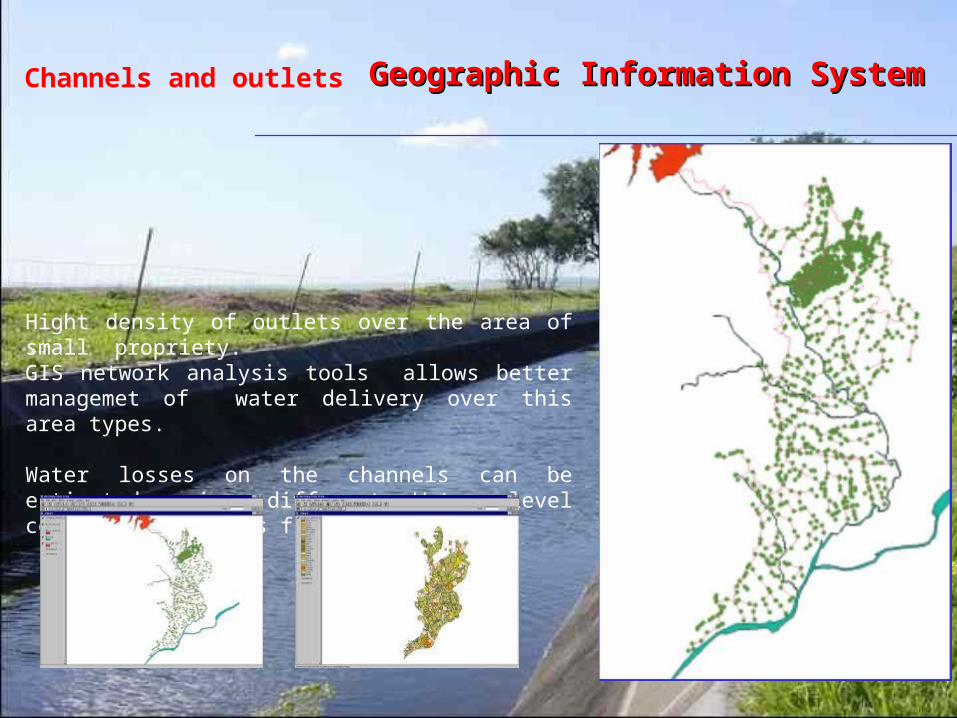
Hight density of outlets over the area of small propriety. GIS network analysis tools allows better managemet of water delivery over this area types.
Water losses on the channels can be estimated using different Water level control and outlets flux.
Channels and outlets Geographic Information SystemGeographic Information System
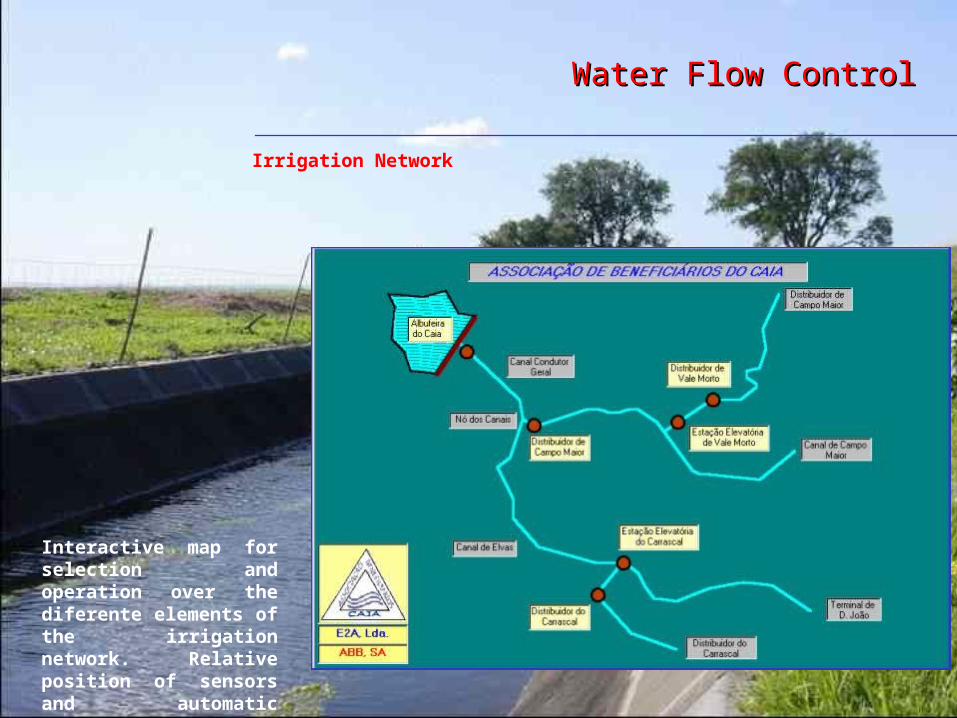
Water Flow ControlWater Flow Control
Irrigation Network
Interactive map for selection and operation over the diferente elements of the irrigation network. Relative position of sensors and automatic elements. .
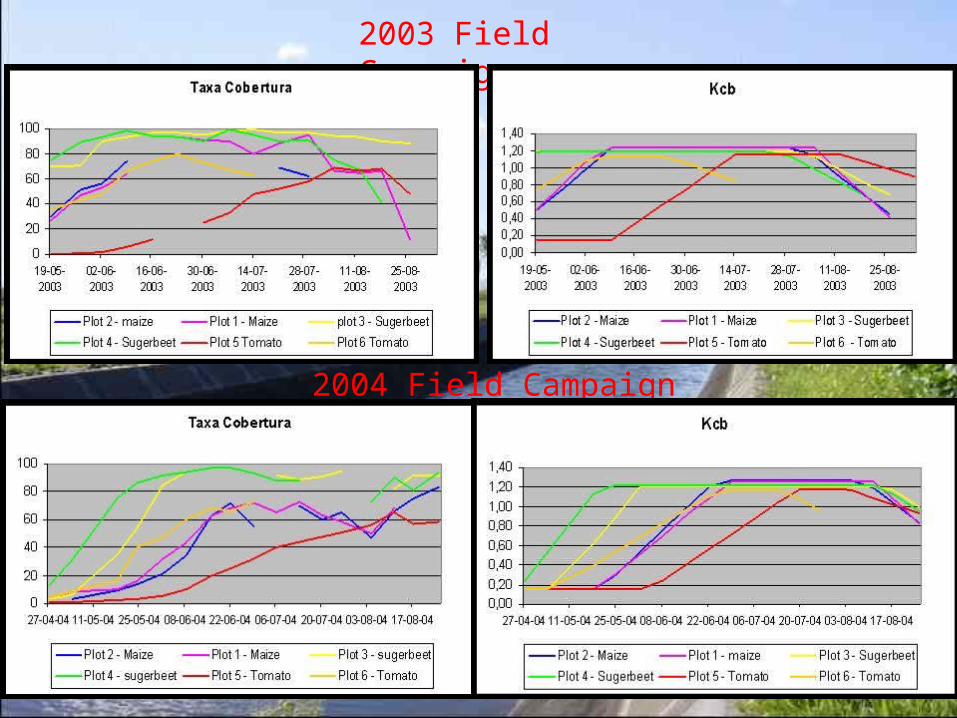
2004 Field Campaign
2003 Field Campaign
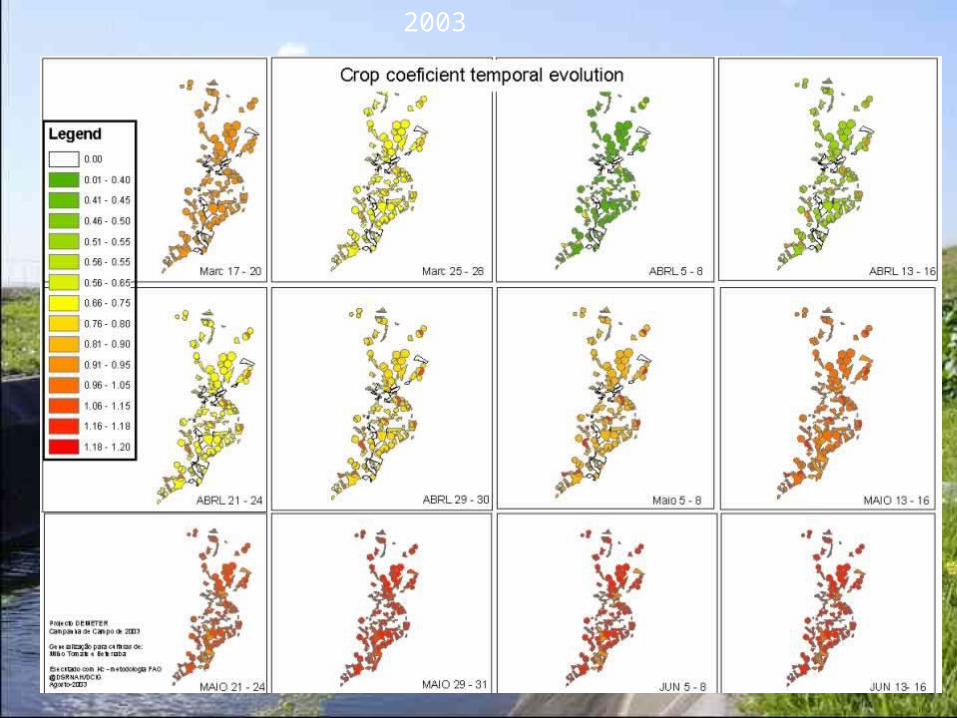
2003
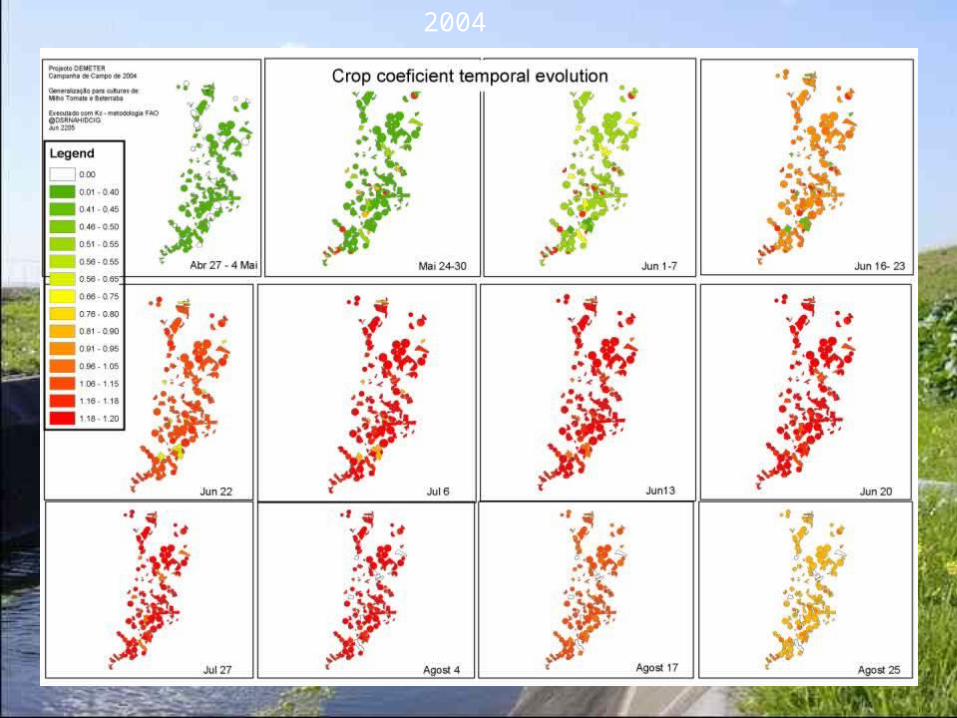
2004
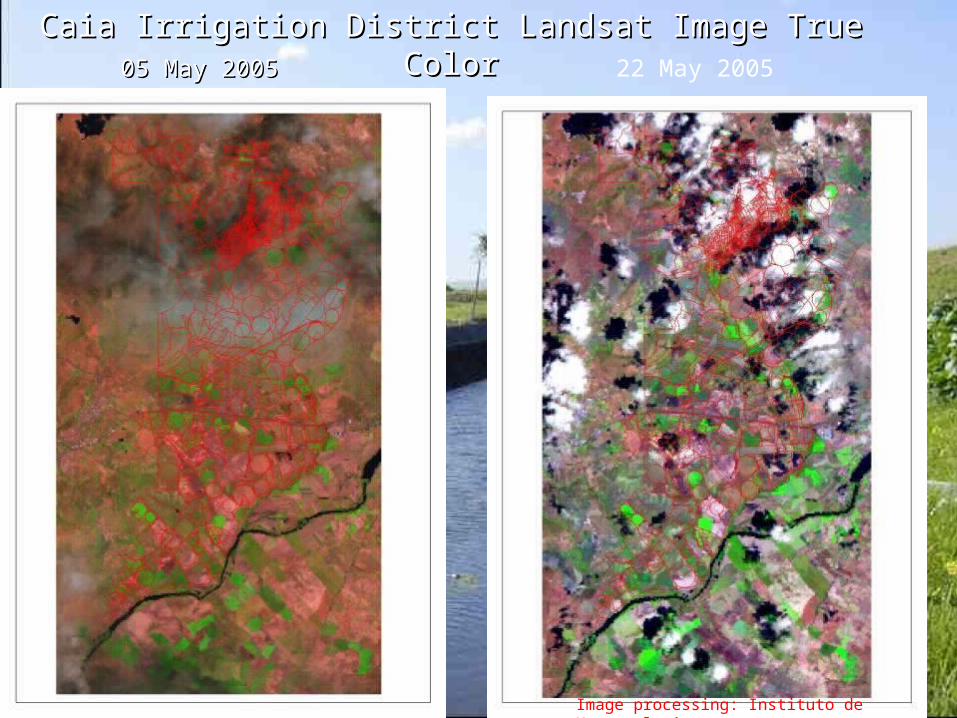
Caia Irrigation District Landsat Image True ColorCaia Irrigation District Landsat Image True Color05 May 200505 May 2005 22 May 2005
Image processing: Instituto de Meteorologia
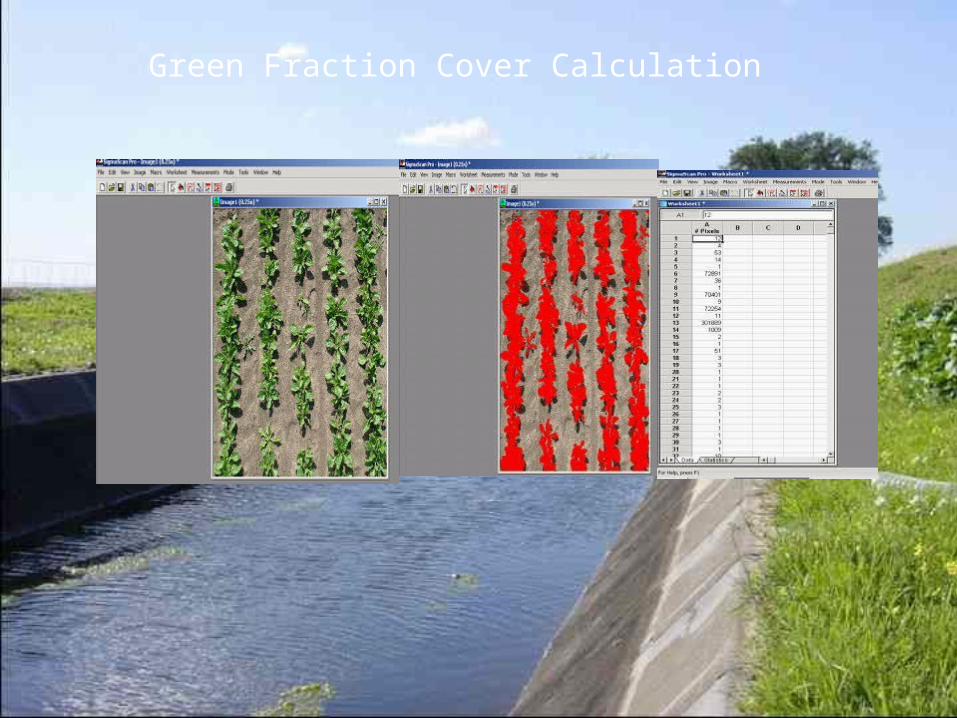
Green Fraction Cover Calculation
DEMonstration of Earth observation TEchnologiesin Routine irrigation advisory services
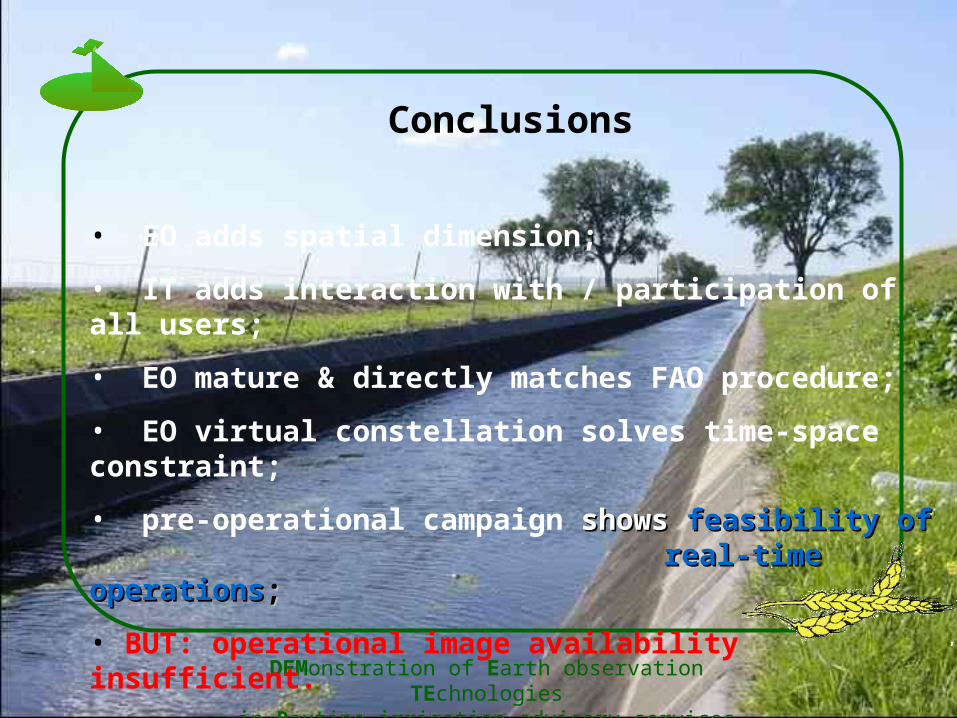
Conclusions
• EO adds spatial dimension;
• IT adds interaction with / participation of all users;
• EO mature & directly matches FAO procedure;
• EO virtual constellation solves time-space constraint;
• pre-operational campaign showsshows feasibility of feasibility of real-time operationsreal-time operations;;
• BUT: operational image availability insufficient.