d-isproportionate representatio n of lino rity students in...
TRANSCRIPT

VoL 70, No. 2, pp. 185-199.@2004 Councilfor Exceptional Children.
D-isproportionateRepresentatio n of lino rityStudents in Special ducatin:Academic, Demographi canEconomic Predictors
JOHN L. HOSPt
University of Utah
DANIEL J. RESCHLY
Vanderbilt University
ABSTRACT: Research on variables that predict disproportionate representation of minority studentsin special education has often ignored an important variable-academic achievement. This study
examined the prediction of representation of students from various minority racial/ethnic groupsusing district-level academic, demographic, and economic blocks of variables. The relative strengthof these blocks was tested using weighted multiple least squares regression. The results show thatacademic achievement added significantly to predictive models for various racial/ethnic groups anddisability categories. Implications and directionsforffuture research are also discussed,
rior research has established thestatistical significance of severalpredictors of disproportionaterepresentation of children fromcertain minority groups in spe-
cial education programs for students with mentalretardation and emotional -disturbance (e.g.,Finn, 1982; Oswald, Coutinho, Best, & Singh,1999). The variables investigated thus far can beclassified into two broad categories: demographicand economic characteristics of children and/orschool districts. Educators have little control overthese variables. A significant weakness in the re-
search is the exclusion of variables that are moredirectly related to special education eligibility de-cision making and to factors that are alterablethrough the efforts of educators. In this study,
achievement variables were added to the demo-graphic and economic variables used previouslyin an effort to better understand patterns of dis-proportionate representation of minority studentsin special education. Moreover, additional racial/ethnic groups (i.e., American Indian, Asian/Pa-cific Islander, and Latino) were added in thisanalysis as well as the disability category of learn-
Exceptional Children 185

ing disabilities (LD), the most prevalent of allspecial education disabilities.
Th4e d roportionate representation
of minority students in special educationhas been a constant and consistentconcernfor nearly 4 decades.
PATTERNS OF DISPROPORTION-
ATE REPRESENTATION
The disproportionate representation of minoritystudents in special education has been a constantand consistent concern for nearly 4 decades. Na-tional patterns of disproportionality have beendocumented and demonstrated to be robust andsteady over time. Using the Elementary and Sec-ondary Schools Civil Rights Compliance Reportof the U.S. Department of Education's Office ofCivil Rights (OCR), the patterns have been docu-mented every other year since 1968 (see Chinn &Hughes, 1987; Donovan & Cross, 2002). Witheach updated OCR survey, African American stu-dents are found to be overrepresented in the cate-gories of mental retardation (MR) and emotionaldisturbance (ED); American Indian students areoverrepresented in the learning disability (LD)category; Asian/Pacific Islander students are un-derrepresented in almost every category; andAfrican American, Latino, and American Indianstudents are underrepresented in the gifted andtalented (GT) category. In addition, in 1998, theOffice of Special Education Programs began col-lecting these data and the patterns found in themcorroborate those from the OCR survey (Dono-van & Cross).
The consistency of the findings, despitevariations in sampling procedure and more than25 years of attention to the issue, demonstrates itsimportance and the urgency with which solutionsare needed. Calls to shift the focus of research inthis area away from documenting patterns towardtaking action and developing solutions have beenincreasing (see Donovan & Cross, 2002; Heller,Holtzman, & Messick, 1982; Markowitz, Garcia,& Eichelberger, 1997; Serna, Forness, & Nielsen,
1998). Most of the solutions proposed address theprovision of appropriate and preventive interven-tions for students who are experiencing difficultyin school and improving teacher training in work-ing with students from culturally and linguisti-cally diverse backgrounds.
Although solutions and interventions arecertainly desirable, developing them based on thecurrent body of research on disproportionate rep-resentation may be problematic. Most examina-tions of disproportionate representation focus ongeneral patterns. What is often missing from thediscussions, however, is an analysis of the variablesthat produce or are related to the overrepresenta-tion patterns (MacMillan & Reschly, 1998). Inorder to develop effective and efficient strategiesto address disproportionate representation, adeeper understanding of the variables that may af-fect it is needed. Some researchers (Artiles,Aguirre-Munoz, & Abedi, 1998; Coutinho &Oswald, 1998; Finn, 1982; Hosp & Reschly,2002) have done this using various levels of data(e.g., state, individual) and focusing on specificcategories (e.g., learning disability, mental retarda-tion). Oswald et al. (1999), however, have con-ducted a more comprehensive analysis using thelevel that has most commonly been used to exam-ine representation patterns, the unit of analysisused in the OCR survey-the district level.
Oswald et al. (1999) used the 1992 OCRCompliance Report to examine community- anddistrict-level variables that previous research hadindicated relate to identification patterns and dis-proportionate representation of African Americanstudents in the categories of ED and MR. Theyused two blocks of variables in their predictivemodels: (a) an economic block and (b) a raceblock. The block of economic variables accountedfor a significant portion of the variation in bothED and MR classification, even without consider-ing the effects of race. The block of race variablesadded significantly to both models. The authorsconcluded that although "poverty" (i.e., the blockof economic variab'les) was a strong predictor ofdisproportionate representation in special educa-tion, race added a significant amount of incre-mental validity to that prediction. Although thesefindings corroborate the research base on the rela-tion of poverty and race to eligibility for andplacement in special education (Barona &
Winter 2004186

Faykus, 1993; Handy, 1999; Mittler, 1999), the (the three grades in which the NAEP is adminis-impact of differential group performance in acad- tered), and are present even when parent incomeemic achievement on disproportionate representa- and housing value are controlled for (Meece &tion is neglected. Kurtz-Costes, 2001). Moreover, these group dif-
ferences in preacademic and academic skills areapparent at the beginning of kindergarten, further
AMchieveinez is one of the, most .,.t $ substantiating the potential importance ofachievement in special education eligibility deci-
i tmportant lredictors >fidentzfitzon i 'sions (West, Denton, & Reaney, 2000).
firs.pecial educadtion ser-vices-,!,,for special educaon services. ¢ - One consideration that should be takeninto account when examining this issue is the in-teractions between the conceptual blocks (i.e., de-
ACADEMIC ACHIEVEMENT mographic, economic, and academic variables).Demographic and econornic variables have often
Achievement is one of the most important predic- been demonstrated to be related (Griffin, 1995).tors of identification for special education services Some groups (particularly racial/ethnic minori-(Gresham, MacMillan, & Bocian, 1997; MacMil- ties) experience greater degrees of poverty thanlan & Forness, 1998). Achievement is a strong others (Proctor & Dalaker, 2002)-the relationpredictor of referral for assessment or interven- being such that some researchers propose thattion, with approximately 55% of students referred ethnicity can serve as a proxy for socioeconomicprimarily for academic problems and 33% re- status (SES; MacMillan & Reschly, 1998; Wag-ferred with academic problems as a secondary ne,19)Alhuhcomiaddmgrpcissue (Del'Homme, Kasari, Forness, & Bagley, variables sharema degree ot ar1996). Once a student has been referred, it is variables share a degree of variablity, they are not1996. Oce stuenthasbee refrre, i isalways interchangeable. For example, althoughlikely that he or she will be found eligible for spe- alwan Amercans as a For exple althoughcial education (Artiles & Trent, 1994; Ysseldyke African Americans as a gtoup experience a greater& Algozinne, 1983; Ysseldyke, Vanderwood, & rate of poverty than do other racial/ethnic groups,Shriner, 1997). more than 77% of African Americans do not live
Because referral is such a strong predictor of in poverty (Proctor & Dalaker). Economic andspecial education eligibility and most students are demographic variables, while sharing variance,referred for academic problems (either primarily also contribute unique variance in the predictionor secondarily), if there were mean differences in of outcomes. This was demonstrated by Oswaldachievement between groups within the applicant et al. (1999).pool (i.e., the students in the population), differ- In addition, both demographic and eco-ential rates of identification for special education nomic variables have been demonstrated to be re-would be expected to occur. For example, if lated to academic achievement (Gottlieb, Alter,African American students perform significantly Gottlieb, & Wishner, 1994; Johnson & Neal,lower on achievement measures than White stu- 1998). As conceptualized by the National Re-dents, even consistentiy applied selection criteria search Council (Donovan & Cross, 2002), indi-will "overidentify" African American students. vidual student achievement is an outcome of
Results from the National Assessment of factors that affect the child, the teacher, and theEducational Progress (NAEP) show that, on aver- cassroom. 'When aggregatng to the district level,age, both African American and Latino students these influences are still active, but the conceptu-perform significantly lower than White students alization must also be expanded to incude policyin reading (Donahue, Voelkl, Campbell, & influence at teso ditrctand th c ommu-Mazzeo, 1999), writing (Greenwald, Persky, Camp-Inuences at the school district and the commu-bell, & Mazzeo, 1999), and math and nity, state, and national level. The conceptual(Campbell, Hombo, & Mazzeo, 2000). These blocks used in this study are proxies (i.e., collec-patterns are consistent in 4th, 8th, and 12th grade tions of interrelated variables) for societal influ-
ences that may affect the patterns of
Exceptional Children 187

representation of minority students in special ed-ucation. Although demographic and economicinfluences have been examined elsewhere (seeCoutinho &c Oswald, 1998; Oswald et al., 1999),differences in the group academic performancehave not.
Mean achievement differences betweengroups of students would lead to disproportionaterates of identification even if the processes of re-ferral, assessment, and certification were perfectlynonbiased. Therefore, a comprehensive examina-tion of disproportionate representation in specialeducation eligibility must address mean differ-ences in achievement levels disaggregated by race.The following research questions were addressedby this study:
1. What proportion of the variance in ratios ofrepresentation rates is accounted for by blocksof academic, demographic, and economicvariables both independently and incremen-tally?
2. Does academic achievement account for sig-nificant proportions of that variance?
METHOD
DATA SOURCES
Data were gathered from three sources. The firstsource was the Elementary and Secondary SchoolsCivil Rights Compliance Report (OCR data set;U.S. Department of Education, 2000). The OCRdata for this study came from the fall 1998 surveybecause this was the most recent version available.Twenty-five variables were coded: the number ofstudents from each of the five federal race/ethnic-ity categories (African American, American In-dian, Asian/Pacific Islander, Latino, White) ineach of three categories reported (Learning Dis-ability, Emotional Disturbance, Mental Retarda-tion) and the total number enrolled. For example,one of the 25 variables coded was "Number ofWhite students identified as having a LearningDisability."
The enrollment and eligibility data fromthe OCR data set were used to compute relativerisk ratios. Separate ratios were calculated for eachdisability category (MR, ED, LD) comparingeach racial category to White students using thefollowing formula:
Relative Risk =
# of students ofXethnicityin disability category Y
# of students of Xethnicityin student population
# of White studentsin disability category Y
# of White studentsin student population
This produced four sets of ratios for eachdisability category, for a total of 12 relative riskindices. These ratios and their abbreviations arepresented in Table 1.
The second source of data was the Com-mon Core of Data (CCD; National Center forEducational Statistics, 2000). It and its predeces-sors were designed to compile demographic andfiscal data on every public school and district inthe United States into a list that could be madeavailable to the public. Variables collected were(a) percentage of children in the community whohave limited English proficiency, (b) medianhousing value of the community, (c) median in-come of households in the community with chil-dren, (d) percentage of adults in the communitywho have a 12th grade education or less, without adiploma, (e) percentage of children who are atrisk, and (f) percentage of student enrollmentidentified as having a disability. A variable thathas been included in prior analyses (percentage ofchildren below poverty level) was excluded fromthe present analysis because its correlation withmedian income (r = .907) exceeded the criterionfor collinearity (r > .9; Tabachnick & Fidell,2001).
Data from the 1997-1998 school year wereused because the 1998-1999 survey incorporatedseveral changes that delayed release of the dataand were therefore unavailable (John Sietsema,personal communication, 2/5/02). Although thisis not the same school year as the year in whichthefFall 1998 OCR data were collected, there aretwo reasons to assume that the differences are notgreat. First, several variables are from census dataand are only updated in the CCD every 10 years(i.e., 2000 data will replace 1990 data). Thismeans that these data are identical for the 1997-1998 and 1998-1999 data sets. Second, district-level variables (such as those used from the CCD)are relatively stable from one year to the next(Owens, 1997).
Winter2004188

TABLE I
Relative Risk Ratios Computed
African American to White, Mental Retardation (BCMR)African American to White, Emotional Disturbance (BCED)African American to White, Learning Disability (BCLD)Latino to White, Mental Retardation (HCMR)Latino to White, Emotional Disturbance (HCED)Latino to White, Learning Disability (HCLD)Asian/Pacific Islander to White, Mental Retardation (ACMR)Asian/Pacific Islander to White, Emotional Disturbance (ACED)Asian/Pacific Islander to White, Learning Disability (ACLD)American Indian to White, Mental Retardation (ICMR)American Indian to White, Emotional Disturbance (ICED)American Indian to White, Learning Disability (ICLD)
The third source of data was district-levelachievement data. Because there is no nationalachievement test that is given annually to all stu-dents (the NAEP is administered to a sample ofstudents from a sample of districts within eachstate), achievement data were collected from eachstate individually. As of 1997, 45 states had amandatory, active, statewide assessment, withmost districts in the remaining five states con-ducting some assessment of their own (McLaugh-lin, Drori, & Ross, 2000). Achievement data werecollected by contacting each state's Department ofEducation in order to gather results fromstatewide assessments for each district in the state.These results were disaggregated by race/ethnicity.All 50 states and the District of Columbia werecontacted by e-mail and/or phone and their Websites were searched for the necessary data. Usabledata in the appropriate form were available andcollected from 16 states. Data were collected fromArizona (number of districts, n= 106), Colorado(n = 75), Connecticut (n = 77), Delaware (n =17), Maine (n = 95), Maryland (n = 24), Massa-chusetts (n = 102), Michigan (n = 171), NorthCarolina (n= 72), Ohio (n = 159), Oregon (n=85), South Carolina (n = 75), Texas (n = 461),Virginia (n = 127), Washington (n = 94), andWisconsin (n = 127). These 16 states representeach region of the United States. They also in-clude 2 states (Ohio & Texas) of the "7-pack"-the 7 largest states in the United States (as well asMichigan, which is 8th).
The form of these data was the percentageof students from each racial/ethnic category pass-ing each subject at each grade level (e.g., the per-centage ofWhite third-grade students passing thereading assessment). Reading, math, and writingwere the three subjects targeted; however, writingassessments were not administered consistentlyacross states and therefore were not included inthe analyses. In addition, because the number ofgrade levels assessed varied from state to state,three levels were used to calculate a mean perfor-mance for each group in each category. Of thegrade levels available for a specific state, the low-est, highest, and median were used. For example,if a state administered the assessment in Grades 3through 9, then Grades 3, 6, and 9 were used. Forstates with three or fewer grade levels of assess-ment data, all available grade levels were used.
DATA ANALYSIS
A series of 12 multiple weighted least squares re-gression models were analyzed using the relativerisk ratios listed in Table 1 as the response vari-ables. Predictor variables were included in one ofthree blocks: (a) academic (percentage of Whitestudents proficient in reading, percentage ofWhite students proficient in math, percentage ofthe racial/ethnic group being.compared proficientin reading, and percentage of the racial/ethnicgroup being compared proficient in math), (b)demographic (base rate of White students, baserate of the racial/ethnic group being compared,percentage of students with limited English profi-
Exceptional Children 189
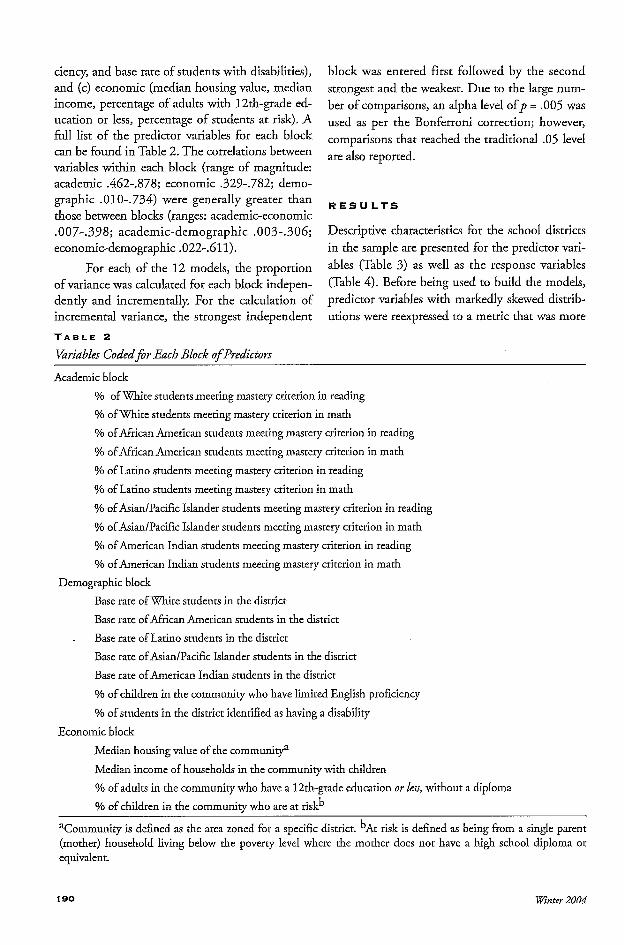
ciency, and base rate of students with disabilities),and (c) economic (median housing value, medianincome, percentage of adults with 12th-grade ed-ucation or less, percentage of students at risk). Afull list of the predictor variables for each blockcan be found in Table 2. The correlations betweenvariables within each block (range of magnitude:academic .462-.878; economic .329-.782; demo-graphic .010-.734) were generally greater thanthose between blocks (ranges: academic-economic.007-.398; academic-demographic .003-.306;economic-demographic .022-.61 1).
For each of the 12 models, the proportionof variance was calculated for each block indepen-dently and incrementally. For the calculation ofincremental variance, the strongest independent
TABLE 2
Variables Codedfor Each Block ofPredictors
block was entered first followed by the secondstrongest and the weakest. Due to the large num-ber of comparisons, an alpha level ofp = .005 wasused as per the Bonferroni correction; however,comparisons that reached the traditional .05 levelare also reported.
RES U LTS
Descriptive characteristics for the school districtsin the sample are presented for the predictor vari-ables (Table 3) as well as the response variables(Table 4). Before being used to build the models,predictor variables with markedly skewed distrib-utions were reexpressed to a metric that was more
Academic block
% of White students meeting mastery criterion in reading
% of White students meeting mastery criterion in math
% of African American students meeting mastery criterion in reading
% ofAfrican American students meeting mastery criterion in math
% of Latino students meeting mastery criterion in reading
% of Latino students meeting mastery criterion in math
% of Asian/Pacific Islander students meeting mastery criterion in reading
% ofAsian/Pacific Islander students meeting mastery criterion in math
% of American Indian students meeting mastery criterion in reading
% of American Indian students meeting mastery criterion in math
Demographic block
Base rate of White students in the district
Base rate of African American students in the district
Base rate of Latino students in the district
Base rate of Asian/Pacific Islander students in the district
Base rate of American Indian students in the district
% of children in the community who have limited English proficiency
% of students in the district identified as having a disability
Economic block
Median housing value of the communiya
Median income of households in the community with children
% of adults in the community who have a 12th-grade education or less, without a diploma
% of children in the community who are at riskb
Winter 2004
aCommnity is defined as the area zoned for a specific district. bAt risk is defined as being from a single parent(mother) household living below the poverty level where the mother does not have a high school diploma orequivalent.
190

TABLE 3
Descriptive Characteristics ofPredictor Variablesfor Final Full-Data Set
Variable
Median income
Median housing value
% at risk
% adult education
% LEP'
% SWD
% White students
% African American students
% Latino students
% Asian/Pacific Islander students
% American Indian students
% proficient White reading
% proficient African American reading
% proficient Latino reading
% proficient Asian/Pacific Islander reading
% proficient American Indian reading
% proficient White math
0/o proficient African American math
% proficient Latino math
% proficient Asian/Pacific Islander math
% proficient American Indian math
Note: LEP = Limited English proficiency. SWD = Studenrs with disabilities.
normalized (see Hosp, 2002 for a more thoroughdiscussion of this procedure). Response variableswere subjected to a natural log transformation asis necessary when using rate ratios such as relativerisk (Fleiss, 1994).
Table 5 shows the proportion of variancethat each block of predictors accounts for inde-pendently and incrementally for each of the re-sponse variables. As can be seen, the percentage ofvariance accounted for by all three blocks of vari-ables ranges from 13.7 to 47.2-indicating thatbetween approximately 1/7 and 112 of the total vari-ance was accounted for in each of the models. Foreach racial/ethnic group, the mean percentage ofvariance accounted for averaged across disabilitycategories was African American (40.3%), Ameri-can Indian (22.4%), Asian/Pacific Islander(27.8%), and Latino (25.8%). For each disabilitygroup, the mean percentage of variance accountedfor averaged across racial/ethnic groups was Emo-tional Disturbance (30.1%), Learning Disability(24.4%), and Mental Retardation (32.8%).
Independently, each block of variables ac-counts for a significant portion of the variance ineach of the 12 models. However, in addition tothe unique variance accounted for by each block,there is a degree of variance that is shared with theother blocks. Therefore, the incremental varianceaccounted for by each block (i.e., the variance ac-counted for after controlling for stronger inde-pendent blocks) must be examined for anindication of the relative strength and importanceof the blocks to emerge. The demographic blockwas the strongest independent block for 7 of the12 models. For each of the models that it was notthe strongest predictor for, it accounted for a sig-nificant amount of variance-even when the aca-demic and/or economic blocks were controlled for.
The economic block was the strongest in-dependent block for three of the models. For themodels for which it was not the strongest predic-tor, it accounted for a significant amount of thevariance for five of the remaining nine models.For four of the models, most of the variance ac-
Exceptional Children
N
1822
1821
1822
1822
1822
1869
1867
1867
1867
1867
1867
1752
964
1031
621
447
1748
960
1031
620
450
Minimum
$4,605
$10,504
.01
1.70
.01
.01
.00
.00
.00
.00
.00
2.00
.00
.00
.00
.00
.00
.00
.00
.00
.00
Maximum$130,211
$465,633
52.00
80.50
20.90
100.00
100.00
100.00
99.88
30.84
100.00
100.00
100.00
100.00
100.00
100.00
100.00
100.00
100.00
100.00
100.00
M
$34,660.39
$74,182.65
3.41
27.69
1.36
13.40
74.15
11.56
11.29
1.59
1.42
71.04
52.40
57.43
65.30
46.02
63.51
44.91
51.22
63.49
38.84
SD
$11,649.82
$47,872.28
3.83
12.59
2.39
6.34
25.64
18.23
19.40
2.68
7.5420.18
25.23
26.02
26.88
28.44
25.05
27.74
30.62
29.21
30.47
191

TABLE 4
Descriptve Characteristics ofDependent VariablesforFinal Data Set
Variable N Minimum Maximum M SD Weighted M WeightedSD
BCMR 940 .02 535.57 9.72 29.57 3.69 4.66
BCED 942 .01 41.00 1.85 2.56 1.80 1.21
BCLD 943 .00 5.98 1.35 .70 1.34 .50
HCMR 996 .01 116.05 3.41 8.36 2.03 3.71
HCED 997 .01 56.00 .99 3.53 .84 1.72
HCLD 999 .00 678.42 2.11 22.39 1.22 .97
ACMR 604 .00 88.24 1.84 6.60 1.62 4.54
ACED 604 .01 3.61 .25 .46 .45 .53
ACLD 604 .00 5.38 .31 .37 .51 .68
ICMR 398 .01 326.33 3.57 17.70 4.91 15.85
ICED 398 .01 83.95 1.30 4.68 7.85 16.05
ICLD 398 .00 94.37 1.30 4.77 1.62 .65Note: BCMR African American to White, Mental Retardation. BCED = African American to White, EmotionalDisturbance. BCLD = African American to White, Learning Disability. HCMR = Latino to White, Mental Retar-dation. HCED = Latino to White, Emotional Disturbance. HCLD = Latino to White, Learning Disability.ACMR = Asian/Pacific Islander to White, Mental Retardation. ACED = Asian/Pacific Islander to White, Emo-tional Disturbance. ACLD = Asian/Pacific Islander to White, Learning Disability. ICMR = American Indian toWhite, Mental Retardation. ICED = American Indian to White, Emotional Disturbance. ICLD = American In-dian to White, Learning Disability.
counted for by the economic block independentlywas in fact shared with the demographic and/oracademic blocks, (i.e., the economic block con-tributed a nonsignificant amount of unique vari-ance).
The academic block was the strongest inde-pendent blpck for two of the models. For the 10models that it was not the strongest predictor for,it accounted for a significant amount of variancefor six of the models. For the remaining fourmodels, the academic block did not contribute asignificant amount of unique variance.
DISCUSSION
Only within the past 5 years has research on dis-proportionate representation of minority studentsin special education begun to consistently exam-ine variables that may predict representation pat-terns. This study sought to extend that researchby providing confirmation of previous findings
and adding findings in an area not yet explored(i.e., academic achievement).
Economic and demographic predictors, as agroup, are important to consider in discussions ofdisproportionate representation because race/eth-nicity has often been considered a proxy for eco-nomic status (Hodgkinson, 1995; MacMillan &Reschly, 1998). This supports the work of Oswaldet al. (1999), who found that an environmentalblock of variables (similar to the economic blockused here) as well as a racial block of variables(similar to the demographic block used here) ac-counted for a significant portion of variance inthe overrepresentation patterns of African Ameri-can students (as compared to non-African Ameri-can students) in the disability categories of MRand ED. Oswald et al. also found that the envi-ronmental and racial blocks were differentiallypredictive for MR and ED. That finding is alsosupported by the results of the present analysis-as well as extended to the category of LD. Aswould be expected, the influence of economic sta-
9Wnter2004192

TABLE 5
Proportion of Variance (R2) Accountedfor by Blocks of.Academic, Demographic, and Economic Variables
Block of VariablesIndependent Variance
Incremental Variance (order entered)
Academic Demographic Economic Total
BCMR .222 .217 .270.135 (2)** .067 (3)** .270 (1)** .472
BCED .158 .193 .128 -.150 (2)** .193 (1)** .023 (3)** .367
BCLD
HCMR
HCED
HCLD
ACMR
.228.228 (1)**
.033.028 (3)**
.111.007 (3)*
.031.036 (2)**
.171.005 (3)
.055.043 (2)**
.137.137 (1)*M
.017.013 (3)
.069.013 (3)
.078.054,(2)**
ACED
ACLD
ICMR
ICED
ICLD
.188.135 (2)*
.189.051 (2)**
.313.313 (1)**
.093.093 (1)*
.247.247 (1
.140.140 (1
.125.105 (2)**
.146.041 (2)**
.259.259 (1
.079.079 (1)**
.081.006 (3)
.210.210 (1)**
.148.031 (2)**
.021.007 (3)
.246.086 (2)*'
.026.019 (3*
.080.052 (3)**
.162.162 (1)**
.139.013 (2)
.069.040 (3)"
.369
.288
1 _
.350
.137
.337
.202
.295
.215
.285
.173
Note. Academic = % passing reading White, % passing reading <other>, % passing math White, % passingmath <otier>; Demographic = Base rate White, base rate <other>, % ELL, % SWD; Economic = Medianhousing value, median income, % adults with high school diploma, % at risk.*P < .05. ** p < .005; for all independent variance figures,p < .005.
tus and demographic patterns for African Ameri-can students is different for the various categoriesof disability-the demographic block being astronger predictor for both the ED and the LDmodels.
When examining the patterns of relativestrength of the blocks across categories of disabil-ity, a clear trend emerges. For the MR models, theeconomic block was generally the strongest pre-dictor across racial/ethnic groups. This trend maybe due to the strong relation between poverty andintellectual ability/performance (Duncan &
Brooks-Gunn, 1997; Richardson, 1981;Sameroff, 2000). For the ED models, the demo-graphic block was generally the strongest predic-tor. This trend may be due to the importance ofthe reference group in judging behavior and refer-ring students for behavioral concerns (Hosp &Hosp, 2001; Shinn, Tindal, & Spira, 1987). Forthe LD models, the academic block was generallythe strongest predictor. This may be due to a pri-mary factor of identification as LD being poorachievement (Fletcher, Francis, Rourke, Shaywitz,& Shaywitz, 1992; Peterson & Shinn, 2002).
Exceptional Children 193

Another way the current study extendedthe findings of Oswald et al. (1999) was to exam-ine additional racial/ethnic groups. As would beexpected, environmental variables also have a dif-ferential impact on students of Asian/Pacific Is-lander, Latino, and American Indianbackgrounds. For Asian/Pacific Islander students,the demographic block was a stronger predictorfor all three disability categories. For Latino andAmerican Indian students, the demographic blockwas a stronger predictor for the ED and LDmodels-a similar pattern as was found forAfrican American students. Disaggregating analy-ses by racial/ethnic background, as well as cate-gory of disability, appears to be important forunderstanding the disproportionality issue.
Although the blocks and methods used inthe present analysis were slightly different thanthose used by Oswald et al. (1999), both the eco-nomic and the demographic blocks (similar to theenvironmental and racial blocks) contributed toprediction in 8 of the 12 models. Although therelative strength of the two varied from model tomodel (see previous discussion), these findingsseem to support the notion that both constructscontribute to the prediction of disproportionaterepresentation.
It should also be noted that, although usedas blocks of conceptually related variables, the in-dividual variables in each block may not alwaysact as a group. Some evidence exists that suggeststhat the individual variables may be differentiallypredictive for different disability categories as wellas different racial/ethnic groups (Coutinho & Os-wald, 1998; Hosp, 2002).
Academic predictors, as a group, are impor-tant to consider in discussions of disproportionaterepresentation because academic achievement is astrong predictor of referral and eventual place-ment in special education. Differences in acade-mic achievement between racial/ethnic groupsshould be expected to lead to differences in refer-ral and placement rates for special education. Theacademic block of variables added significantly toprediction for 8 of the 12 models. This indicatesthat differences in group performance on acade-mic achievement measures (i.e., reading andmath) also contribute to disproportionate repre-sentation of racial/ethnic groups in different cate-gories of special education eligibility. As noted
A::cadlemic predictors,; (as: a:g7oup, ar0;|ttyftl:ll0ffleSlytimortnt to cnider 1i7n discussins ofdisproportionat.e rpresentation beau:seacadeic ahevbem?ent is a strongpredictor ofreferaand eventualplacement mi speia euca.ti on.
above, the academic block was differentially pre-dictive for different categories of disability. It alsodiffered in relative strength of prediction for dif-ferent racial/ethnic groups, being stronger forAfrican American and Asian/Pacific Islander stu-dents than for Latino or American Indian stu-dents.
Across racial/ethnic groups and categoriesof disability, the academic block of predictors wasgenerally the weakest of the three blocks. We pro-pose two explanations for this trend. First, be-cause of the relations between blocks ofpredictors, a degree of the variability in academicperformance may be explained by the influencesof demographic and economic variables on acade-mic achievement. Once these influences are ac-counted for, the amount of unique variance thatthe academic predictors contribute is reduced. Asecond explanation for the relative weakness ofthe academic block is that the variables in the aca-demic block were all more strongly correlatedthan were the variables in the other blocks. Thismeans that there was more shared variance amongthe academic predictors, leaving less unique vari-ance to predict disproportionate representation. Itshould be noted, however, that although the acad-emic block was the weakest of the three relativelyspeaking, it did contribute significantly to 8 ofthe 12 models. This suggests that all three blocksof predictors are important to consider. Beforediscussing the implications of these findings forpractice and future research, a couple of factorsthat potentially limit the generalizability of the re-sults from this study should be taken into consid-eration.
First, 1,869 of the more than 13,000 publicschool districts in the United States were repre-sented in the final data set. Substantive differ-ences between the sample and the population of
Winter 2004194

school districts may exist. This is especially truebecause the sample of 1,869 was selected from asample of nearly 5,500 that was selected from thepopulation of 13,000. It is possible that there wasan additive effect of sampling error. Sixteen of the50 states were represented. Although the stateswere representative of the iegions of the UnitedStates, there is no guarantee that the excludedstates do not differ on some fundamental vari-ables. Within each of the states represented, be-tween 25% and 100% of the districts within thestate were included in this analysis. Overall, 47%of the districts within these 16 states were in-cluded. However, this represents 73% of the stu-dent population, despite the fact that districtswith low frequencies in one or more of the groupswere likely to be excluded (see following discus-sion).
Second, the method of determining dispro-portionate representation (relative risk) might notbe appropriate for use with smaller districts. Thesmaller a group's representation is in a district, themore individuals influence the relative risk ratiofor that district. For example, in a district withonly five African American students, if one ofthose students is identified as MR, the rate forAfrican American students is 20%. Therefore, rel-ative risk is a more stable indicator in districtswith larger numbers of students in each groupbeing compared. For this study, districts with lowfrequencies of students in one of the groups wereless likely to be included in the final data set. Thiswas because achievement data for a district werenot reported if there were fewer than 5 to 16 stu-dents of a particular group assessed (dependingon the state's criterion). For example, a districtwith fewer than five African American studentstested in the third grade oh reading would not re-port a percentage passing for African Americanstudents on the third-grade reading exam. This isdue to issues of confidentiality (i.e., not beingable to identify individuals from the reported re-sults). Districts with smaller enrollments are morelikely to be rural and less likely to have minoritystudents-minimizing the effect of their exclu-sion from this analysis. Despite these potentiallimitations, the findings have implications forboth practice and future research.
However,ducators are able toiouence the academic 4chievement-oftIi~ rtudents-i 14J, ia ' their ' e rprimary-role.
IMPLICATIONS FOR PRACTICE
Most of the predictor variables used in this andother studies of disproportionate representationof minority students in special education are be-yond the influence-of the educators in a localschool district. The teachers in a school will notbe able to influence the demographic characteris-tics of the district or various socioeconomic vari-ables of the surrounding community. However,educators are able to influence the academicachievement of their students-in fact, it is theirprimary role.
The results of this study do not indicatethat achievement differences cause disproportion-ate representation-they only indicate that thetwo are related. There are undoubtedly manyother variables that are related to both academicachievement and disproportionate representation.These variables differentially affect students whoare from various racial/ethnic groups and areidentified in various categories of disability. How-ever, because achievement can be influenced byeducators, it provides a logical place to start devel-oping interventions that educators can implementthat may reduce disproportionate representation.This may be accomplished through prevention orearly intervention.
Prevention of educational problems hasbeen proposed as both viable and cost-effective(Artiles & Trent, 1994). Serna et al. (1998) de-scribed prevention as having an emphasis on uni-versal interventions that can be provided to allstudents within a school. These universal inter-ventions provide training in some skill or abilitythat serves as a protective factor against futureproblems (Forness, Kavale, MacMillan, Asarnow,& Duncan, 1996). Related to prevention is earlyintervention. This includes universal screeningprocedures that may serve to identify childrenwho are not responding sufficiently to preventiontechniques and might therefore be at risk for fLu-
Exceptional Children 195

ture failure (Donovan & Cross, 2002). By shift-ing attention and resources to earlier stages in theprocess of education, evidence suggests that inter-ventions can lead to improved outcomes com-pared to those experienced in the current "wait-to-fail" system (Reynolds, Temple, Robertson, &Mann, 2001; Schweinhart, Barnes, Weikart, Bar-nett, & Epstein, 1993). By being cognizant of theacademic performance of different groups of stu-dents and taking steps to improve achievement ofall groups, educators can influence the alterablevariables that predict disproportionate representa-tion. Whether this translates into actually reduc-ing or preventing disproportionality remains to beseen.
BY beigcgiatoh acdemiperjbrmane ofd2ffierent rusostdet antakigsest improv
achevment opfal oigru eductr canpredict disRoprtio:ate272 ; rereetat:ion.t;tt
IMPLICATIONS FOR FUTURE
R ESEARCH
Results from the current study indicate that acad-emic, demographic, and economic variables areall important to consider in examinations of dis-proportionate representation at the district level.Although the three blocks of variables are all re-lated, they also contribute unique variance afteraccounting for the variance they share. In addi-tion, the blocks vary in the relative strength oftheir relation to disproportionality across bothracial/ethnic groups and categories of disability.Additional variables that predict disproportionaterepresentation must continue to be examined andconfirmed. Although many variables related toeconomic status, demographics, and academicshave been examined and confirmed, there aremany more within these areas that need to be ex-plored.
The data for this study were at the districtlevel, which has been the most common level ofaggregation for analyses. Analyses have also been
conducted at the state level of aggregation. Al-though both of these levels are important to ex-amine, ultimately, research needs to be extendedto the individual level. Few studies to date haveexamined disproportionate representation at theindividual level. Translating research across levelsof aggregation will require more complex analysismethods. Methods will be required that accountfor variance and influence at each level of aggrega-tion when examining implications at a specificlevel such as hierarchical linear modeling (HLM;Raudenbush & Bryk, 2002) or Classification andRegression Tree Analysis (CART; Steinberg &Colla, 1995).
CONCLUSIONS
The literature on disproportionate representationof minority students in special education has along history of describing national trends of rep-resentation patterns. Only recently have re-searchers started examining additional variables,which may help predict those patterns. This studyprovides a rationale for including academicachievement as a predictor in models of dispro-portionate representation. The importance ofacademic achievement in the prediction of dispro-portionality may provide an impetus to developinterventions that will address the issue.
Although calls for developing solutionsrather than documenting patterns have been in-creasing in recent years, developing interven-tions-and more importantly-implementingthem, has been slow. Achievement is an impor-tant predictor of disproportionate representationand is the key variable in special education eligi-bility for most students. Efforts to change pat-terns of disproportionate representation mustfocus on this crucial, alterable variable as opposedto merely reporting economic and demographicrelations. In doing so, schools will address in-equalities that have existed in American schoolsfor more than 300 years. By including a multi-tude of perspectives using varied methods, hope-fully, these long-held practices and beliefs can beexposed, examined, and corrected where neces-sary.
Winter20041 96

REFERENCES
Artiles, A. J., Aguirre-Munoz, Z., & Abedi, J. (1998).Predicting placement in learning disabilities programs:Do predictors vary by ethnic group? Exceptional Chil-dren, 64, 543-559.
Artiles, A. J., & Trent, S. C. (1994). Overrepresenta-tion of minority students in special education: A con-tinuing debate. Journal of Special Education, 27,410-437.
Barona, A., & Faykus, S. (1993). The simultaneous ef-fects of sociocultural variables and WISC-R factors onMR, LD, and non-placement of ethnic minorities inspecial education. Education and Training in Mental Re-tardation, 28, 66-74.
Campbell, J. R., Hombo, C. M., & Mazzeo, J. (2000).NAEP 1999 trends in academic progress: Three decades ofstudentperformance. Washington, DC: National Centerfor Educational Statistics (NCES No. 2000-469).
Chinn, P. C., & Hughes, S. (1987). Representation ofminority students in special education classes. Remedialand SpecialEducation, 8(4), 41-46.
Coutinho, M. J., & Oswald, D. P. (1998). Understand-ing identification, placement and school completionrates for children with disabilities: The influence ofeconomic, demographic, and educational variables. InK. D. Gadow & I. Bailer (Eds.), Advances in learningand behavioral disabilities (Vol., 12, pp. 43-78). Green-wich, CT: JAI Press.
Del'Homme, M., Kasari, C., Forness, S. R., & Bagley,R. (1996). Prereferral intervention and students at-riskfor emotional or behavioral disorders. Education andTreatment of Children, 19, 272-285.
Donahue, P. L., Voelkl, K. E., Campbell, J. R., &Mazzeo, J. (1999). The NAEP 1998 reading report cardfor the nation and the states. Washington, DC: NationalCenter for Educational Statistics (NCES No. 1999-500).
Donovan, M. S., & Cross, C. T (Eds.). (2002). Minor-ity students in special and gifted education. Washington,DC: National Academies Press.
Duncan, G. J., & Brooks-Gunn, J. (Eds.). (1997).Consequences of growing up poor. New York: RussellSage Foundation.
Finn, J. D. (1982). Patterns in special education place-ment as revealed by the OCR survey. In K. A. Heller,W. Holtzman, & S. Messick (Eds.), Placing children inspecial education: A strategy for equity (pp. 322-381).Washington, DC: National Academies Press.
Fleiss, J. L. (1994). Measures of effect size for categori-cal data. In H. Cooper & L. V. Hedges (Eds.), Thehandbook of research synthesis (pp. 245-260). New York:Russell Sage Foundation.
Fletcher, J. M., Francis, D. J., Rourke, B. P., Shaywitz,S. E., & Shaywitz, B. A. (1992). The validity of dis-crepancy-based definitions of reading disability. JournalofLearningDisabilities, 25, 555-561.
Forness, S. R., Kavale, K. A., MacMillan, D. L.,Asarnow, J. R, & Duncan, B. B. (1996). Early detec-tion and prevention of emotiorial or behavioral disor-ders: Developmental aspects of systems of care.Behavioral Disorders, 21, 226-240.
Gottlieb, J., Alter, M., Gottlieb, B., & Wishner, J.(1994). Special education in urban America: It's notjustifiable for many. The Journal of Special Education,27, 453-465.
Greenwald, E. A., Persky, H. R., Campbell, J. R., &Mazzeo, J. (1999). The NAEP 1998 writing report cardfor the nation and states. Washington, DC: NationalCenter for Educational Statistics (NCES No. 1999-462).
Gresham, E M., MacMillan, D. L., & Bocian, K. M.(1997). Teachers as "tests": Differential validity ofteacher judgments in identifying students at-risk forlearning difficulties. School Psychology Review, 26, 47-60.
Griffin, M. D. (1995). African American householdsand comsmunity effects on economic deprivation. In C.K. Jacobson (Ed.), American families: Issues in race andethnicity (pp. 301-322). New York: Garland.
Handy, A. J. (1999). Ethnocentrism and black studentswith disabilities: Bridging the cultural gap, volume LNew York Vantage Press.
Heller, K., Holtzman, W., & Messick, S. (Eds.).(1982). Placement of children in special education: Astrategy for equity. Washington, DC: National AcademyPress.
Hodgkinson, H. L. (1995). What should we call peo-ple? Race, class, and the Census for 2000. Phi DeltaKappan, 77, 173-179.
Hosp, J. L. (2002). Disproportionate representation ofminority students in special education: Academic, eco-nomic, and demographicpredictors. Unpublished doc-toral dissertation, Vanderbilt University, Nashville.
Hosp, J. L., & Hosp, M. K. (2001). Behavior differ-ehces between African American and Caucasian stu-dents: Issues for assessment and intervention. Educationand Treatment of Children, 24, 336-350.
Hosp, J. L., & Reschly, D. J. (2002). Predictors of re-strictiveness of placement for African American andCaucasian students. Exceptional Children, 68, 225-238.
Individuals with Disabilities Education Act. (1997,1999). 20 U. S. C 1400 et. Seq. (Statute). 34 CFR.300 (Regulations)
Exceptional Children 197

Johnson, W R., & Neal, D. (1998). Basic skills and theblack-white earnings gap. In C. Jencks & M. Phillips(Eds.), The black-white test score gap (pp. 480-497).Washington, DC: Brookings Institution Press.
MacMillan, D. L., & Forness, S. R. (1998). The role ofIQ in special education placement decisions: Primaryand determinative or peripheral and inconsequential.Remedial and Special Education, 19, 239-253.
MacMillan, D. L., & Reschly, D. J. (1998). Overrepre-sentation of minority students: The case for greaterspecificity of the variables examined. The Journal ofSpecialEducation, 32, 15-24.
Markowitz, J., Garcia, S. B., & Eichelberger, J. (1997).Addressing the disproportionate representation of studentsfrom racial and ethnic minority groups in special educa-tion: A resource document (ERIC Document Reproduc-tion Service No. ED 406810).
McLaughlin, D., Drori, G., & Ross, M. (2000). Schoollevel correlates of academic achievement: Student assess-ment score in SASS public schools. Washington DC: Na-tional Center for Educational Statistics (NCES No.2000-303).
Meece, J. L., & Kurtz-Costes, B. (2001). Introduction:The schooling of ethnic minority children and youth.Educational Psychologist, 36, 1-7.
Mirtler, P. (1999). Equal opportunities-for whom?British Journal ofSpecialEducation, 26, 3-7.
National Center for Educational Statistics. (2000).Common core of data (CCD): School years 1993-1994Through 1997-1998 [CD-ROM]. Washington, DC:U.S. Department of Education.
Oswald, D. P., Coutinho, M. J., Best, A. M., & Singh,N. N. (1999). Ethnic representation in special educa-tion: The influence of school-related economic and de-mographic variables. The Journal of Special Education,32, 194-206.
Owens, S. (1997). Coverage evaluation of the 1994-95common core of data: Public elementary/secondary educa-tion universe survey. Washington, DC: U.S. Depart-ment of Education, National Center for EducationalStatistics (NCES No. 97-505).
Peterson, K. M. H, & Shinn, M. R. (2002). Severe dis-crepancy models: Which best explains school identifi-cation practices for learning disabilities? SchoolPsychology Review, 31, 459-476.
Proctor, B. D., & Dalaker, J. (2002). Poverty in theUnited States: 2001 (U.S. Census Bureau, Current Pop-ulation Reports P60-219). Washington, DC: U.S. Gov-ernment Printing Office.
Raudenbush, S. W., & Bryk, A. S. (2002). Hierarchicallinear modeling: Applications and data analysis methods(2nd ed.). Newbury Park, CA: Sage.
Reynolds, A., Temple, J. A., Robertson, D. L., &Mann, E. A. (2001). Long-term effects of an earlychildhood intervention on educational achievementand juvenile arrest. Journal of the American Medical As-sociation, 285,2339-2346.
Richardson, S. (1981). Family characteristics associatedwith mild mental retardation. In M. Begab, H. C. Hay-wood, & H. Graber (Eds.), Psychosocial influences in re-tarded performance (Vol. II, pp. 29-43). Baltimore:University Park Press.
Sameroff, A. (2000). Ecological perspectives on devel-opmental risk. In J. D. Osofsky & H. E. Fitzgerald(Eds.), WAIMH handbook of infant mental health, vol.4: Infant mental health in groups at high risk (pp. 3-33).New York: John Wiley & Sons.
Schweinhart, L., Barnes, H., Weikart, D., Barnett, W.S., & Epstein, A. S. (1993). Significant benefits: TheHigh/Scope Perry preschool study through age 27. InMonographs of the High/Scope Educational ResearchFoundation, Number 10. Ypsilanti, MI: TheHigh/Scope Press.
Serna, L. A., Forness, S. R., & Nielsen, M. E. (1998).Intervention versus affirmation: Proposed solutions tothe problem of disproportionate minority representa-tion in special education. The Journal of Special Educa-tion, 32, 48-51.
Shinn, M. R., Tindal, G. A., & Spira, D. A. (1987).Special education referrals as an index of teacher toler-ance: Are teachers imperfect tests? Exceptional Children,54, 32-40.
Steinberg, D., & Colla, P. (1995). CART Tree-struc-tured non-parametric data analysis. San Diego, CA: Sal-ford Systems.
Tabachnick, B. G., & Fidell, L. S. (2001). Using multi-variate statistics (4th ed.) Boston: Allyn and Bacon.
U.S. Department of Education, Office of Civil Rights.(2000). Elementary and secondary school civil rights com-pliance report [CD-ROM]. Washington, DC: Author.
Wagner, M. (1995). The contributions ofpoverty andethnic background to the participation ofsecondary schoolstudents in special education. Washington, DC: U.S. Of-fice of Special Programs.
West, J., Denton, K, & Reaney, L. M. (2000). Thekindergarten year: Findings from the Early Childhood
198 VVinter 2004

Longitudinal Study, kindergarten class of 1998-99. Wash-
ington, DC: National Center for Education Statistics
(NCES No. 2001023).
Ysseldyke, J. E., & Algozinne, B. (1983). LD or notLD? That's not the question! Journal of Learning Dis-
abilities, 16, 29-31.
Ysseldyke, J. E., Vanderwood, M. L., & Shriner, J.(1997). Changes over the past decade in special educa-tion referral to placement probability: An incredibly re-liable practice. Diagnostique, 23, 193-203.
ABOUT THE AUTHORS
JOHN L. HOSP, Assistant Professor, Special Ed-ucation, University of Utah, Salt Lake City.DANIEL J. RESCHLY, Professor and Chair,Special Education, Peabody College, VanderbiltUniversity, Nashville, Tennessee.
Correspondence concerning this manuscript maybe addressed to John Hosp, University of Utah,1705 E. Campus Center Drive, Room 221, SaltLake City, UT 84112. E-mail: [email protected]
This study was supported in part by funding froma John T. Merck Training Scholarship through theJohn F. Kennedy Center for Research on HumanDevelopment at Peabody College of VanderbiltUniversity and from a Leadership Training Grantfrom the Office of Special Education Programs tothe Department of Special Education at PeabodyCollege of Vanderbilt University.
Manuscript received January 2003; accepted May2003.
199Exceptional Children
CECs NEW ONtLINPROFESSIONAL DEVELOPMENT PROGRAM
Why spend your time and money traveling to professional development events when youcan get the training you need in the convenience of your home, school, or office?You'll be able to register online, begin the courses whenever you wish, and completethem at your own pace. Our new online courses will be available anytime from anycomputer with Internet access. Plus you can earn continuing education units (CEUs) foreach course completed.
A few of the online topics coming soon:
Council for * Curriculum adaptations. Large scale assessments
Exceptional * Behavior managementChildren e Secondary transition
. Teaching English language learners
More information availablesoon. For details and registration information, watch upcoming issues of Exceptional Children,TEACHING Exceptional Children, and CEC Today. Or visit us at www.cec.sped.org/pd/ or contact [email protected].

COPYRIGHT INFORMATION
TITLE: Disproportionate Representation of Minority Students inSpecial Education: Academic, Demographic andEconomic Predictors
SOURCE: Except Child 70 no2 Wint 2004WN: 0436003306004
The magazine publisher is the copyright holder of this article and itis reproduced with permission. Further reproduction of this article inviolation of the copyright is prohibited. To contact the publisher:http://www.cec.sped.org/
Copyright 1982-2004 The H.W. Wilson Company. All rights reserved.