contents · d =pipe inside diameter, in. reynolds number and moody friction factor the reynolds...
TRANSCRIPT
Pressure drop evaluation along pipelines
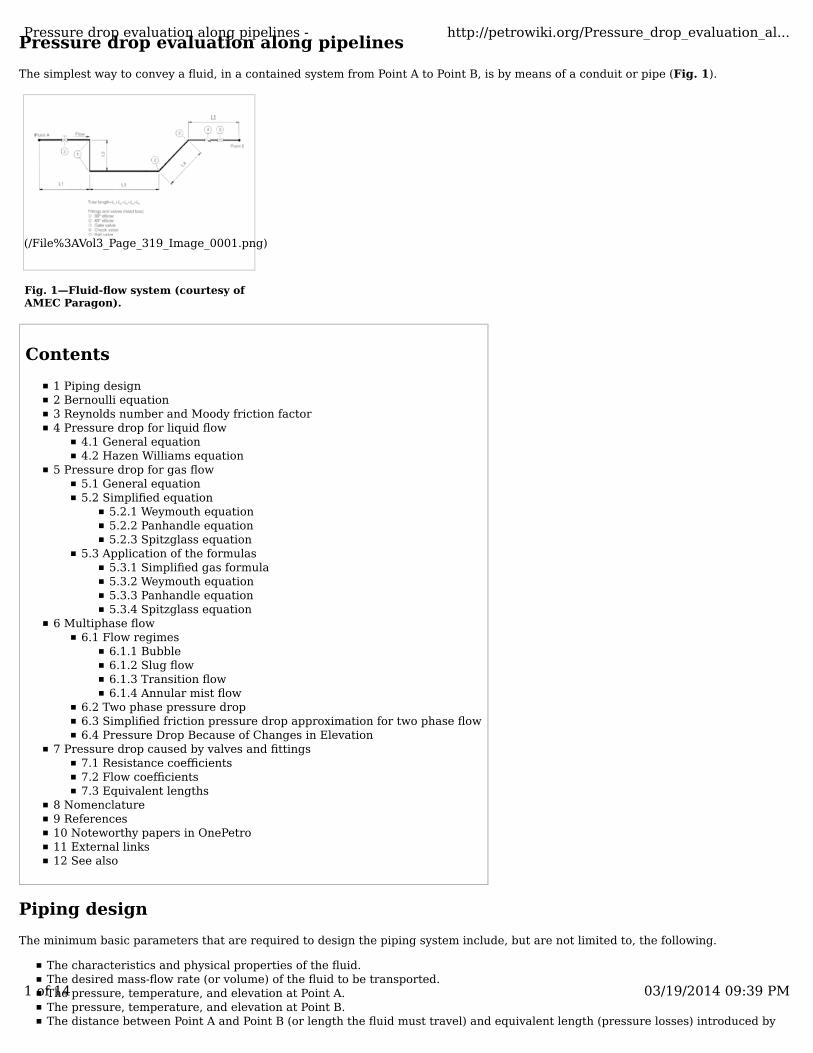
The simplest way to convey a fluid, in a contained system from Point A to Point B, is by means of a conduit or pipe (Fig. 1).
(/File%3AVol3_Page_319_Image_0001.png)
Fig. 1—Fluid-flow system (courtesy ofAMEC Paragon).
Contents
1 Piping design2 Bernoulli equation3 Reynolds number and Moody friction factor4 Pressure drop for liquid flow
4.1 General equation4.2 Hazen Williams equation
5 Pressure drop for gas flow5.1 General equation5.2 Simplified equation
5.2.1 Weymouth equation5.2.2 Panhandle equation5.2.3 Spitzglass equation
5.3 Application of the formulas5.3.1 Simplified gas formula5.3.2 Weymouth equation5.3.3 Panhandle equation5.3.4 Spitzglass equation
6 Multiphase flow6.1 Flow regimes
6.1.1 Bubble6.1.2 Slug flow6.1.3 Transition flow6.1.4 Annular mist flow
6.2 Two phase pressure drop6.3 Simplified friction pressure drop approximation for two phase flow6.4 Pressure Drop Because of Changes in Elevation
7 Pressure drop caused by valves and fittings7.1 Resistance coefficients7.2 Flow coefficients7.3 Equivalent lengths
8 Nomenclature9 References10 Noteworthy papers in OnePetro11 External links12 See also
Piping design
The minimum basic parameters that are required to design the piping system include, but are not limited to, the following.
The characteristics and physical properties of the fluid.The desired mass-flow rate (or volume) of the fluid to be transported.The pressure, temperature, and elevation at Point A.The pressure, temperature, and elevation at Point B.The distance between Point A and Point B (or length the fluid must travel) and equivalent length (pressure losses) introduced by
Pressure drop evaluation along pipelines - http://petrowiki.org/Pressure_drop_evaluation_al...
1 of 14 03/19/2014 09:39 PM
valves and fittings.
These basic parameters are needed to design a piping system. Assuming steady-state flow, there are a number of equations, which arebased upon the general energy equation, that can be employed to design the piping system. The variables associated with the fluid (i.e.,liquid, gas, or multiphase) affect the flow. This leads to the derivation and development of equations that are applicable to a particularfluid. Although piping systems and pipeline design can get complex, the vast majority of the design problems encountered by theengineer can be solved by the standard flow equations.
Bernoulli equation
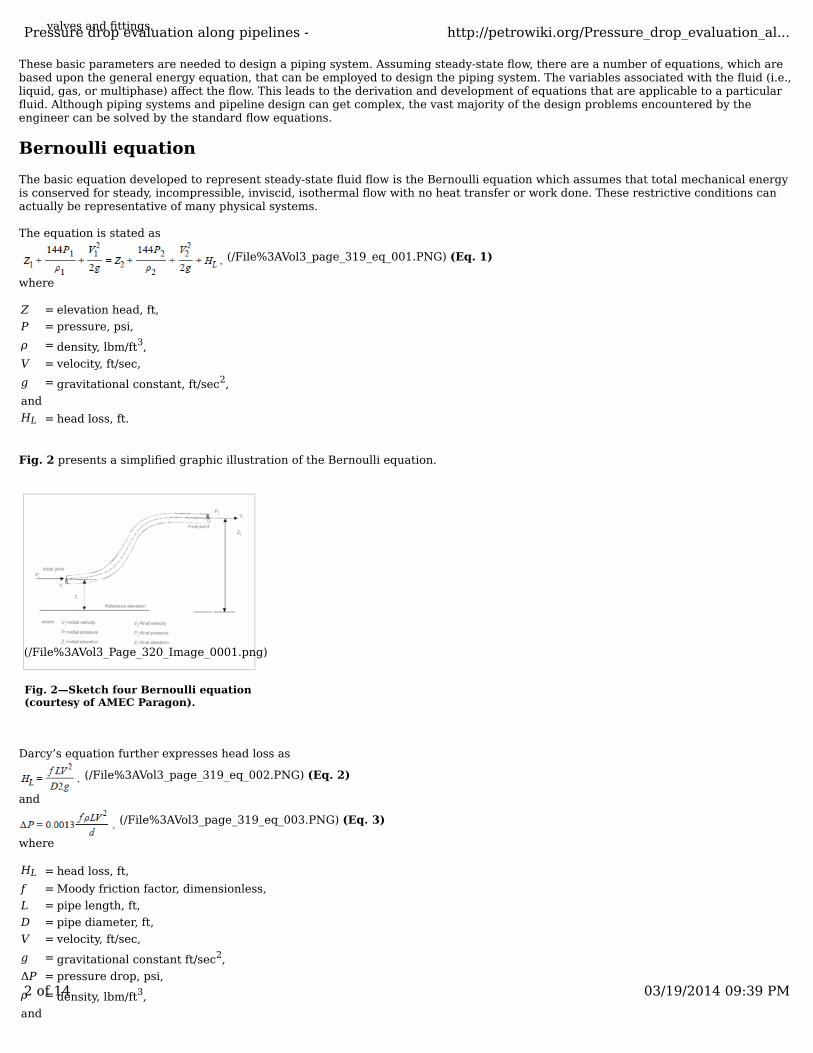
The basic equation developed to represent steady-state fluid flow is the Bernoulli equation which assumes that total mechanical energyis conserved for steady, incompressible, inviscid, isothermal flow with no heat transfer or work done. These restrictive conditions canactually be representative of many physical systems.
The equation is stated as
(/File%3AVol3_page_319_eq_001.PNG) (Eq. 1)
where
Z = elevation head, ft,
P = pressure, psi,
ρ = density, lbm/ft3,
V = velocity, ft/sec,
g = gravitational constant, ft/sec2,
and
HL = head loss, ft.
Fig. 2 presents a simplified graphic illustration of the Bernoulli equation.
(/File%3AVol3_Page_320_Image_0001.png)
Fig. 2—Sketch four Bernoulli equation(courtesy of AMEC Paragon).
Darcy’s equation further expresses head loss as
(/File%3AVol3_page_319_eq_002.PNG) (Eq. 2)
and
(/File%3AVol3_page_319_eq_003.PNG) (Eq. 3)
where
HL = head loss, ft,
f = Moody friction factor, dimensionless,
L = pipe length, ft,
D = pipe diameter, ft,
V = velocity, ft/sec,
g = gravitational constant ft/sec2,
ΔP = pressure drop, psi,
ρ = density, lbm/ft3,
and
Pressure drop evaluation along pipelines - http://petrowiki.org/Pressure_drop_evaluation_al...
2 of 14 03/19/2014 09:39 PM
d = pipe inside diameter, in.
Reynolds number and Moody friction factor
The Reynolds number is a dimensionless parameter that is useful in characterizing the degree of turbulence in the flow regime and isneeded to determine the Moody friction factor. It is expressed as
(/File%3AVol3_page_320_eq_001.PNG) (Eq. 4)
where
ρ = density, lbm/ft3,
D = pipe internal diameter, ft,
V = flow velocity, ft/sec,
and
μ = viscosity, lbm/ft-sec.
The Reynolds number for liquids can be expressed as
(/File%3AVol3_page_320_eq_002.PNG) (Eq. 5)
where
μ = viscosity, cp,
d = pipe inside diameter, in.,
SG = specific gravity of liquid relative to water (water = 1),
Ql = liquid-flow rate, B/D,
and
V = velocity, ft/sec.
The Reynolds number for gases can be expressed as
(/File%3AVol3_page_321_eq_001.PNG) (Eq. 6)
where
μ = viscosity, cp,
d = pipe inside diameter, in.,
S = specific gravity of gas at standard conditions relative to air (molecular weight divided by 29),
and
Qg = gas-flow rate, MMscf/D.
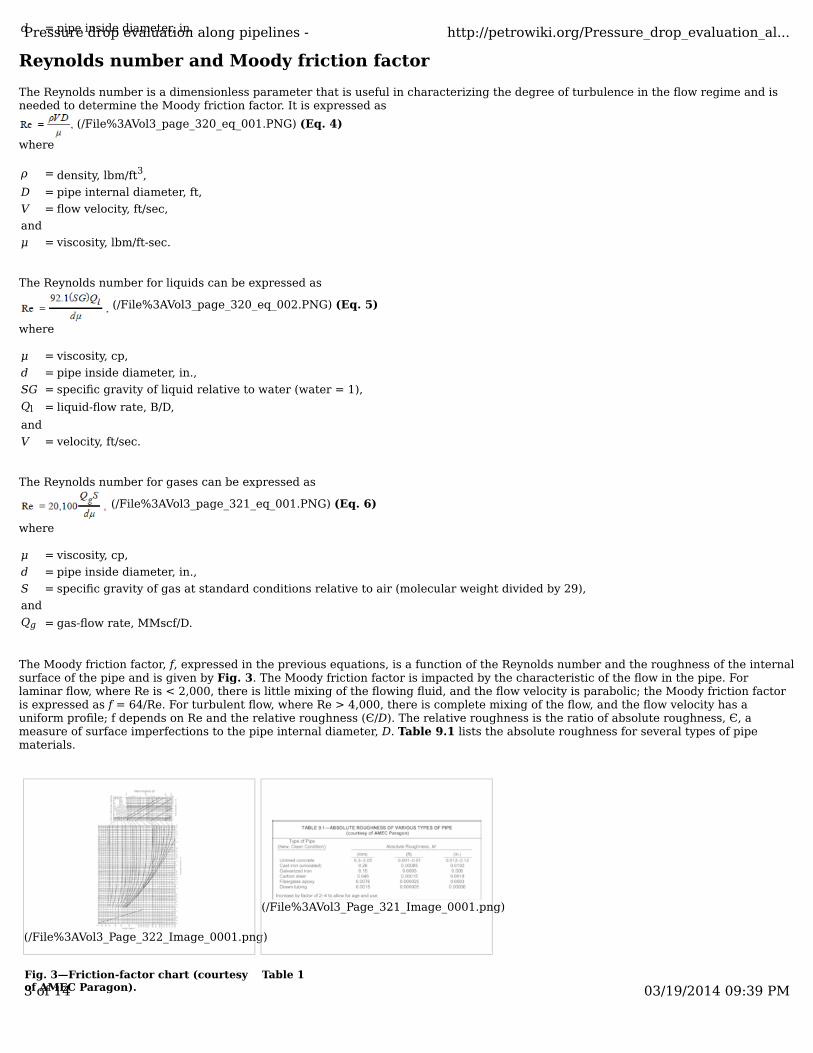
The Moody friction factor, f, expressed in the previous equations, is a function of the Reynolds number and the roughness of the internalsurface of the pipe and is given by Fig. 3. The Moody friction factor is impacted by the characteristic of the flow in the pipe. Forlaminar flow, where Re is < 2,000, there is little mixing of the flowing fluid, and the flow velocity is parabolic; the Moody friction factoris expressed as f = 64/Re. For turbulent flow, where Re > 4,000, there is complete mixing of the flow, and the flow velocity has auniform profile; f depends on Re and the relative roughness (Є/D). The relative roughness is the ratio of absolute roughness, Є, ameasure of surface imperfections to the pipe internal diameter, D. Table 9.1 lists the absolute roughness for several types of pipematerials.
(/File%3AVol3_Page_322_Image_0001.png)
Fig. 3—Friction-factor chart (courtesyof AMEC Paragon).
(/File%3AVol3_Page_321_Image_0001.png)
Table 1
Pressure drop evaluation along pipelines - http://petrowiki.org/Pressure_drop_evaluation_al...
3 of 14 03/19/2014 09:39 PM
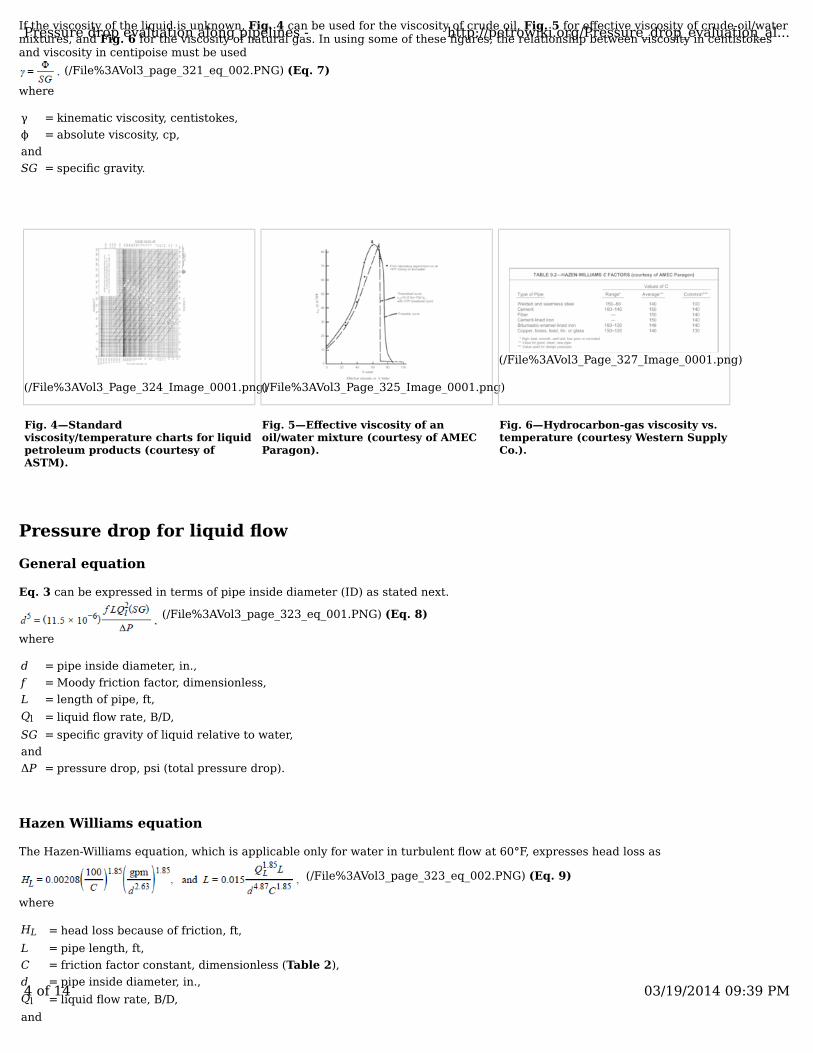
If the viscosity of the liquid is unknown, Fig. 4 can be used for the viscosity of crude oil, Fig. 5 for effective viscosity of crude-oil/watermixtures, and Fig. 6 for the viscosity of natural gas. In using some of these figures, the relationship between viscosity in centistokesand viscosity in centipoise must be used
(/File%3AVol3_page_321_eq_002.PNG) (Eq. 7)
where
γ = kinematic viscosity, centistokes,
ϕ = absolute viscosity, cp,
and
SG = specific gravity.
(/File%3AVol3_Page_324_Image_0001.png)
Fig. 4—Standardviscosity/temperature charts for liquidpetroleum products (courtesy ofASTM).
(/File%3AVol3_Page_325_Image_0001.png)
Fig. 5—Effective viscosity of anoil/water mixture (courtesy of AMECParagon).
(/File%3AVol3_Page_327_Image_0001.png)
Fig. 6—Hydrocarbon-gas viscosity vs.temperature (courtesy Western SupplyCo.).
Pressure drop for liquid flow
General equation
Eq. 3 can be expressed in terms of pipe inside diameter (ID) as stated next.
(/File%3AVol3_page_323_eq_001.PNG) (Eq. 8)
where
d = pipe inside diameter, in.,
f = Moody friction factor, dimensionless,
L = length of pipe, ft,
Ql = liquid flow rate, B/D,
SG = specific gravity of liquid relative to water,
and
ΔP = pressure drop, psi (total pressure drop).
Hazen Williams equation
The Hazen-Williams equation, which is applicable only for water in turbulent flow at 60°F, expresses head loss as
(/File%3AVol3_page_323_eq_002.PNG) (Eq. 9)
where
HL = head loss because of friction, ft,
L = pipe length, ft,
C = friction factor constant, dimensionless (Table 2),
d = pipe inside diameter, in.,
Ql = liquid flow rate, B/D,
and
Pressure drop evaluation along pipelines - http://petrowiki.org/Pressure_drop_evaluation_al...
4 of 14 03/19/2014 09:39 PM

gpm = liquid flow rate, gal/min.
(/File%3AVol3_Page_327_Image_0001.png)
Table 2
Pressure drop can be calculated from (/File%3AVol3_page_323_eq_003.PNG) (Eq. 10)
Pressure drop for gas flow
General equation
The general equation for calculating gas flow is stated as
(/File%3AVol3_page_323_eq_004.PNG) (Eq. 11)
where
w = rate of flow, lbm/sec,
g = acceleration of gravity, 32.2 ft/sec2,
A = cross-sectional area of pipe, ft2,
V1‘ = specific volume of gas at upstream conditions, ft3/lbm,
f = friction factor, dimensionless,
L = length, ft,
D = diameter of the pipe, ft,
P1 = upstream pressure, psia,
and
P2 = downstream pressure, psia.
Assumptions: no work performed, steady-state flow, and f = constant as a function of the length.
Simplified equation
For practical pipeline purposes, Eq. 11 can be simplified to
(/File%3AVol3_page_327_eq_001.PNG) (Eq. 12)
where
P1 = upstream pressure, psia,
P2 = downstream pressure, psia,
S = specific gravity of gas,
Qg = gas flow rate, MMscf/D,
Z = compressibility factor for gas, dimensionless,
T = flowing temperature, °R,
f = Moody friction factor, dimensionless,
Pressure drop evaluation along pipelines - http://petrowiki.org/Pressure_drop_evaluation_al...
5 of 14 03/19/2014 09:39 PM
d = pipe ID, in.,
and
L = length, ft.
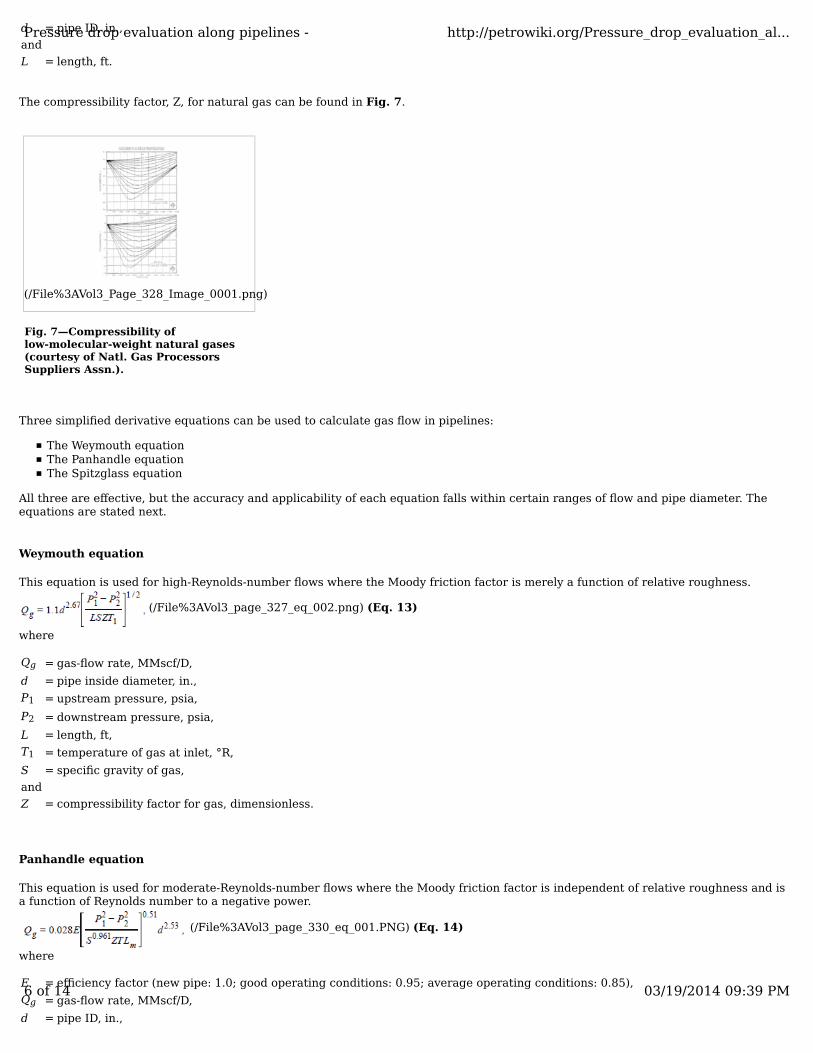
The compressibility factor, Z, for natural gas can be found in Fig. 7.
(/File%3AVol3_Page_328_Image_0001.png)
Fig. 7—Compressibility oflow-molecular-weight natural gases(courtesy of Natl. Gas ProcessorsSuppliers Assn.).
Three simplified derivative equations can be used to calculate gas flow in pipelines:
The Weymouth equationThe Panhandle equationThe Spitzglass equation
All three are effective, but the accuracy and applicability of each equation falls within certain ranges of flow and pipe diameter. Theequations are stated next.
Weymouth equation
This equation is used for high-Reynolds-number flows where the Moody friction factor is merely a function of relative roughness.
(/File%3AVol3_page_327_eq_002.png) (Eq. 13)
where
Qg = gas-flow rate, MMscf/D,
d = pipe inside diameter, in.,
P1 = upstream pressure, psia,
P2 = downstream pressure, psia,
L = length, ft,
T1 = temperature of gas at inlet, °R,
S = specific gravity of gas,
and
Z = compressibility factor for gas, dimensionless.
Panhandle equation
This equation is used for moderate-Reynolds-number flows where the Moody friction factor is independent of relative roughness and isa function of Reynolds number to a negative power.
(/File%3AVol3_page_330_eq_001.PNG) (Eq. 14)
where
E = efficiency factor (new pipe: 1.0; good operating conditions: 0.95; average operating conditions: 0.85),
Qg = gas-flow rate, MMscf/D,
d = pipe ID, in.,
Pressure drop evaluation along pipelines - http://petrowiki.org/Pressure_drop_evaluation_al...
6 of 14 03/19/2014 09:39 PM
P1 = upstream pressure, psia,
P2 = downstream pressure, psia,
Lm = length, miles,
T1 = temperature of gas at inlet, °R,
S = specific gravity of gas,
and
Z = compressibility factor for gas, dimensionless.
Spitzglass equation
(/File%3AVol3_page_330_eq_002.PNG) (Eq. 15)
where
Qg = gas-flow rate, MMscf/D,
ΔhW = pressure loss, inches of water,
and
d = pipe ID, in.
Assumptions:
f = (1+ 3.6/ d + 0.03 d ) (1/100),
T = 520°R,
P1 = 15 psia,
Z = 1.0,
and
ΔP = < 10% of P 1 .
Application of the formulas
As previously discussed, there are certain conditions under which the various formulas are more applicable. A general guideline forapplication of the formulas is given next.
Simplified gas formula
This formula is recommended for most general-use flow applications.
Weymouth equation
The Weymouth equation is recommended for smaller-diameter pipe (generally, 12 in. and less). It is also recommended for shorterlengths of segments ( < 20 miles) within production batteries and for branch gathering lines, medium- to high-pressure (+/–100 psig to> 1,000 psig) applications, and a high Reynolds number.
Panhandle equation
This equation is recommended for larger-diameter pipe (12-in. diameter and greater). It is also recommended for long runs of pipe ( >20 miles) such as cross-country transmission pipelines and for moderate Reynolds numbers.
Spitzglass equation
The Spitzglass equation is recommended for low-pressure vent lines < 12 in. in diameter (ΔP < 10% of P1).
The petroleum engineer will find that the general gas equation and the Weymouth equation are very useful. The Weymouth equation isideal for designing branch laterals and trunk lines in field gas-gathering systems.
Multiphase flow
Pressure drop evaluation along pipelines - http://petrowiki.org/Pressure_drop_evaluation_al...
7 of 14 03/19/2014 09:39 PM
Flow regimes
Fluid from the wellbore to the first piece of production equipment (separator) is generally two-phase liquid/gas flow.
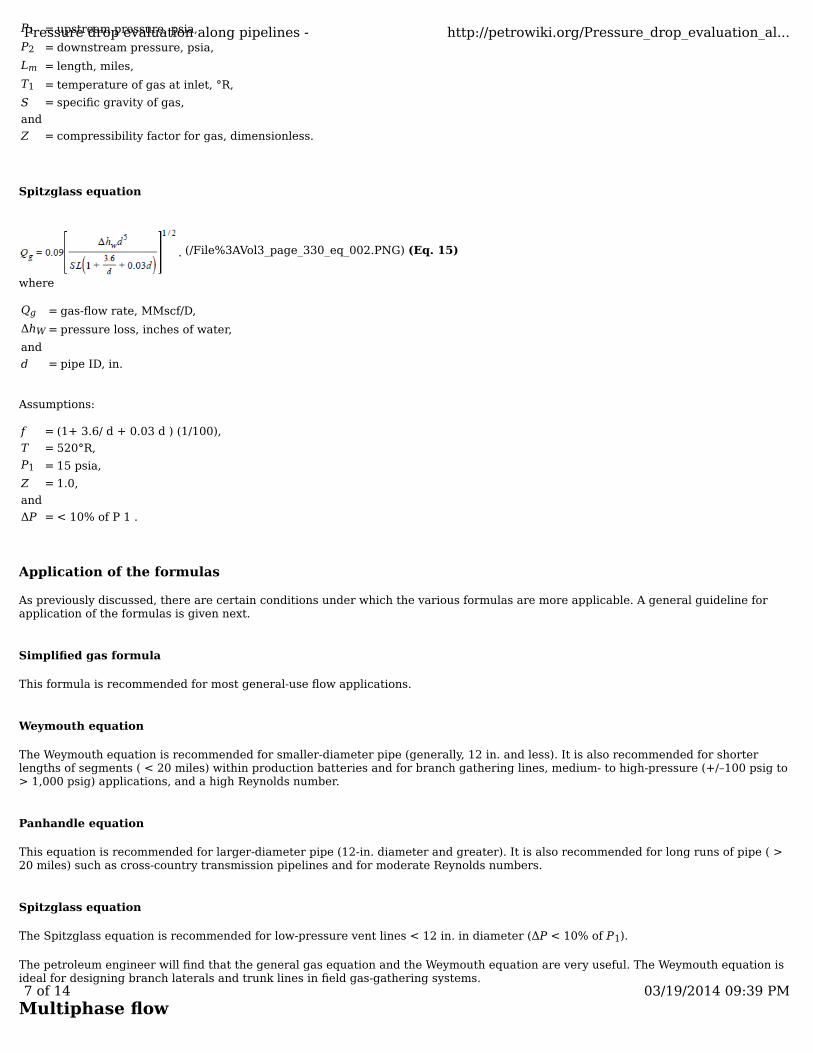
The characteristics of horizontal, multiphase flow regimes are shown in Fig. 8. They can be described as follows:
Bubble: Occurs at very low gas/liquid ratios where the gas forms bubbles that rise to the top of the pipe.Plug: Occurs at higher gas/liquid ratios where the gas bubbles form moderate-sized plugs.Stratified: As the gas/liquid ratios increase, plugs become longer until the gas and liquid flow in separate layers.Wavy: As the gas/liquid ratios increase further, the energy of the flowing gas stream causes waves in the flowing liquid.Slug: As the gas/liquid ratios continue to increase, the wave heights of the liquid increase until the crests contact the top of thepipe, creating liquid slugs.Spray: At extremely high gas/liquid ratios, the liquid is dispersed into the flowing-gas stream.
(/File%3AVol3_Page_331_Image_0001.png)
Fig. 8—Two-phase-flow patterns inhorizontal flow (courtesy of AMECParagon).
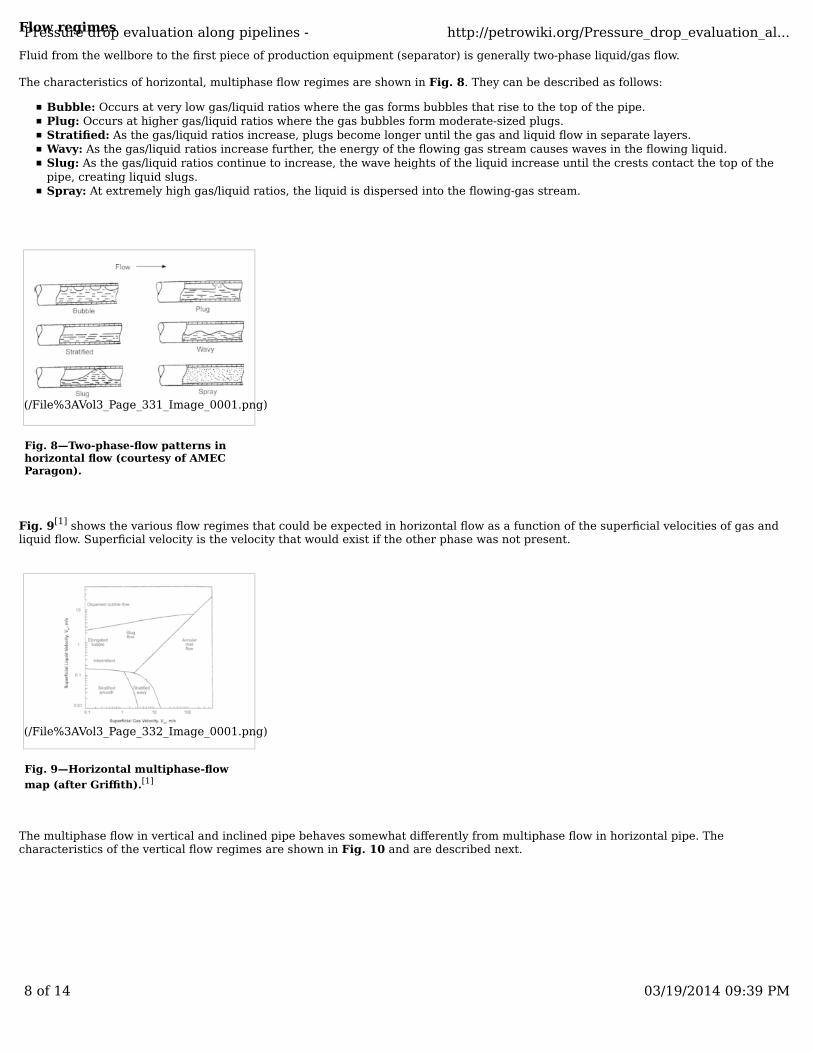
Fig. 9[1] shows the various flow regimes that could be expected in horizontal flow as a function of the superficial velocities of gas andliquid flow. Superficial velocity is the velocity that would exist if the other phase was not present.
(/File%3AVol3_Page_332_Image_0001.png)
Fig. 9—Horizontal multiphase-flow
map (after Griffith).[1]
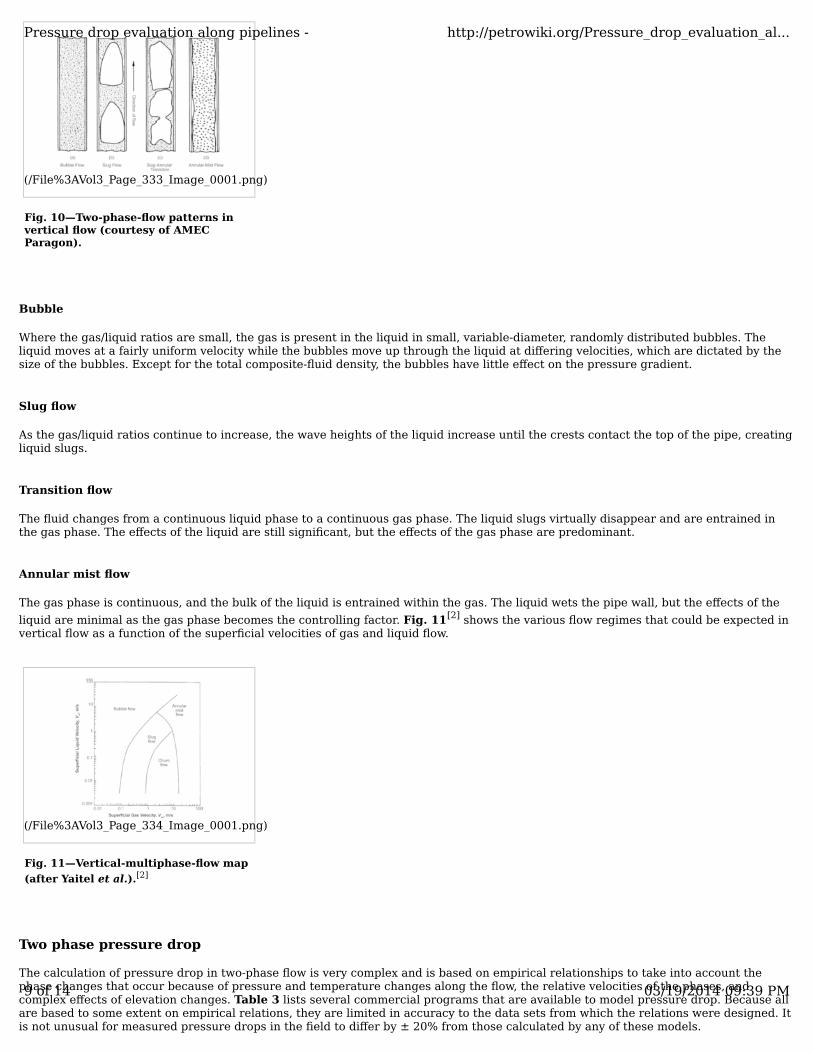
The multiphase flow in vertical and inclined pipe behaves somewhat differently from multiphase flow in horizontal pipe. Thecharacteristics of the vertical flow regimes are shown in Fig. 10 and are described next.
Pressure drop evaluation along pipelines - http://petrowiki.org/Pressure_drop_evaluation_al...
8 of 14 03/19/2014 09:39 PM
(/File%3AVol3_Page_333_Image_0001.png)
Fig. 10—Two-phase-flow patterns invertical flow (courtesy of AMECParagon).
Bubble
Where the gas/liquid ratios are small, the gas is present in the liquid in small, variable-diameter, randomly distributed bubbles. Theliquid moves at a fairly uniform velocity while the bubbles move up through the liquid at differing velocities, which are dictated by thesize of the bubbles. Except for the total composite-fluid density, the bubbles have little effect on the pressure gradient.
Slug flow
As the gas/liquid ratios continue to increase, the wave heights of the liquid increase until the crests contact the top of the pipe, creatingliquid slugs.
Transition flow
The fluid changes from a continuous liquid phase to a continuous gas phase. The liquid slugs virtually disappear and are entrained inthe gas phase. The effects of the liquid are still significant, but the effects of the gas phase are predominant.
Annular mist flow
The gas phase is continuous, and the bulk of the liquid is entrained within the gas. The liquid wets the pipe wall, but the effects of the
liquid are minimal as the gas phase becomes the controlling factor. Fig. 11[2] shows the various flow regimes that could be expected invertical flow as a function of the superficial velocities of gas and liquid flow.
(/File%3AVol3_Page_334_Image_0001.png)
Fig. 11—Vertical-multiphase-flow map
(after Yaitel et al.).[2]
Two phase pressure drop
The calculation of pressure drop in two-phase flow is very complex and is based on empirical relationships to take into account thephase changes that occur because of pressure and temperature changes along the flow, the relative velocities of the phases, andcomplex effects of elevation changes. Table 3 lists several commercial programs that are available to model pressure drop. Because allare based to some extent on empirical relations, they are limited in accuracy to the data sets from which the relations were designed. Itis not unusual for measured pressure drops in the field to differ by ± 20% from those calculated by any of these models.
Pressure drop evaluation along pipelines - http://petrowiki.org/Pressure_drop_evaluation_al...
9 of 14 03/19/2014 09:39 PM

(/File%3AVol3_Page_335_Image_0001.png)
Table 3
Simplified friction pressure drop approximation for two phase flow
Eq. 16 provides an approximate solution for friction pressure drop in two-phase-flow problems that meet the assumptions stated.
(/File%3AVol3_page_333_eq_001.PNG) (Eq. 16)
where
ΔP = friction pressure drop, psi,
f = Moody friction factor, dimensionless,
L = length, ft,
W = rate of flow of mixture, lbm/hr,
ρM = density of the mixture, lbm/ft3,
and
d = pipe ID, in.
The formula for rate of mixture flow is (/File%3AVol3_page_333_eq_002.PNG) (Eq. 17)
where
Qg = gas-flow rate, MMscf/D,
QL = liquid flow rate, B/D,
S = specific gravity of gas at standard conditions, lbm/ft3 (air = 1),
and
SG = specific gravity of liquid, relative to water, lbm/ft3.
The density of the mixture is given by
(/File%3AVol3_page_334_eq_001.PNG) (Eq. 18)
where
P = operating pressure, psia,
R = gas/liquid ratio, ft3/bbl,
T = operating temperature, °R,
SG = specific gravity of liquid, relative to water, lbm/ft3,
S = specific gravity of gas at standard conditions, lbm/ft3 (air = 1),
and
Z = gas compressibility factor, dimensionless.
The formula is applicable if the following conditions are met:
ΔP is less than 10% of the inlet pressure.Bubble or mist exists.There are no elevation changes.There is no irreversible energy transfer between phases.
Pressure drop evaluation along pipelines - http://petrowiki.org/Pressure_drop_evaluation_al...
10 of 14 03/19/2014 09:39 PM

Pressure Drop Because of Changes in Elevation
There are several notable characteristics associated with pressure drop because of elevation changes in two-phase flow. The flowcharacteristics associated with the elevation changes include:
In downhill lines, flow becomes stratified as liquid flows faster than gas.The depth of the liquid layer adjusts to the static pressure head and is equal to the friction pressure drop.There is no pressure recovery in the downhill line.In low gas/liquid flow, the flow in uphill segments can be liquid "full" at low flow rates. Thus, at low flow rates, the total pressuredrop is the sum of the pressure drops for all of the uphill runs.With increased gas flow, the total pressure drop may decrease as liquid is removed from uphill segments.
The pressure drop at low flow rates associated with an uphill elevation change may be approximated with Eq. 19. (/File%3AVol3_page_335_eq_001.PNG) (Eq. 19)
where
ΔPZ = pressure drop because of elevation increase in the segment, psi,
SG = specific gravity of the liquid in the segment, relative to water,
and
ΔZ = increase in elevation for segment, ft.
The total pressure drop can then be approximated by the sum of the pressure drops for each uphill segment.
Pressure drop caused by valves and fittings
One of the most important parameters affecting pressure drop in piping systems is pressure loss in the fittings and valves, which isincorporated in the system. For piping systems within production facilities, the pressure drop through fittings and valves can be muchgreater than that through the straight run of pipe itself. In long pipeline systems, the pressure drop through fittings and valves canoften be ignored.
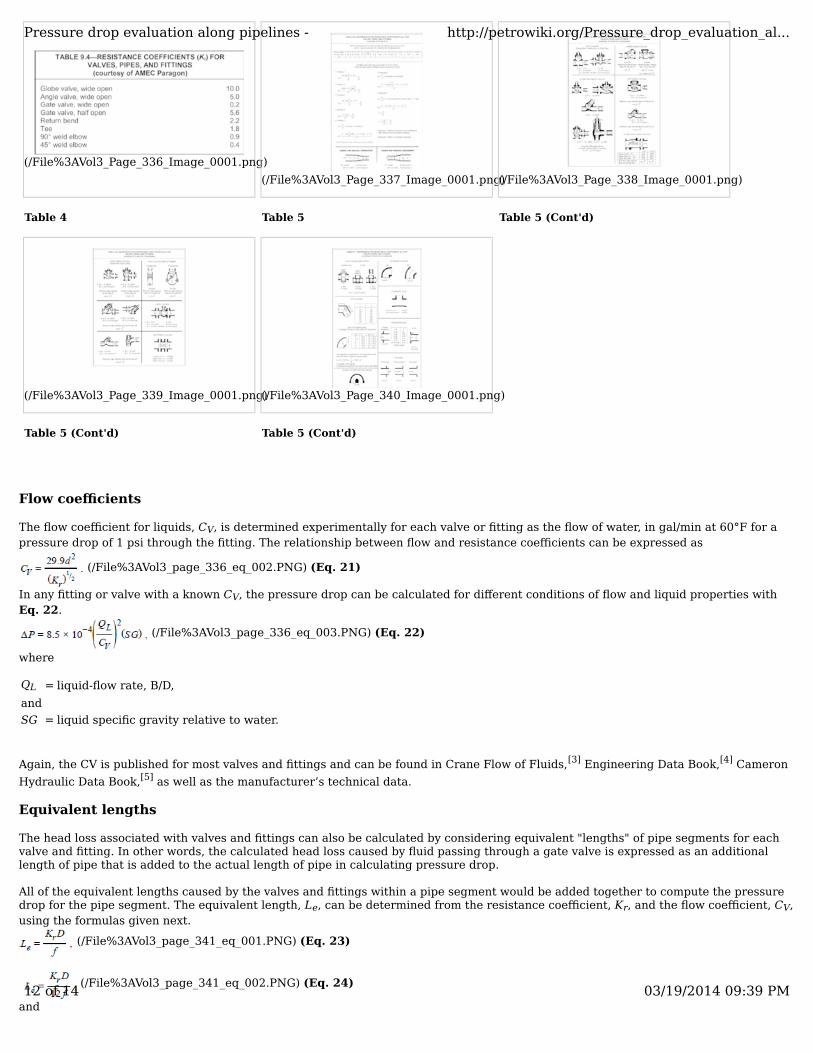
Resistance coefficients
The head loss in valves and fittings can be calculated with resistance coefficients as
(/File%3AVol3_page_336_eq_001.PNG) (Eq. 20)
where
HL = head loss, ft,
Kr = resistance coefficient, dimensionless,
D = pipe ID, ft,
and
V = velocity, ft/sec.
The total head loss is the sum of all Kr V2/2g.
The resistance coefficients Kr for individual valves and fittings are found in tabular form in a number of industry publications. Mostmanufacturers publish tabular data for all sizes and configurations of their products. One of the best sources of data is the Crane Flow
of Fluids, technical paper No. 410. [3] The Natural Gas Processors Suppliers Assn. (NGPSA) Engineering Data Book[4] and Ingersoll-
Rand’s Cameron Hydraulic Data Book[5] are also good sources of references for the information. Some examples of resistancecoefficients are listed in Tables 4 and 5.
Pressure drop evaluation along pipelines - http://petrowiki.org/Pressure_drop_evaluation_al...
11 of 14 03/19/2014 09:39 PM
(/File%3AVol3_Page_336_Image_0001.png)
Table 4
(/File%3AVol3_Page_337_Image_0001.png)
Table 5
(/File%3AVol3_Page_338_Image_0001.png)
Table 5 (Cont'd)
(/File%3AVol3_Page_339_Image_0001.png)
Table 5 (Cont'd)
(/File%3AVol3_Page_340_Image_0001.png)
Table 5 (Cont'd)
Flow coefficients
The flow coefficient for liquids, CV, is determined experimentally for each valve or fitting as the flow of water, in gal/min at 60°F for apressure drop of 1 psi through the fitting. The relationship between flow and resistance coefficients can be expressed as
(/File%3AVol3_page_336_eq_002.PNG) (Eq. 21)
In any fitting or valve with a known CV, the pressure drop can be calculated for different conditions of flow and liquid properties withEq. 22.
(/File%3AVol3_page_336_eq_003.PNG) (Eq. 22)
where
QL = liquid-flow rate, B/D,
and
SG = liquid specific gravity relative to water.
Again, the CV is published for most valves and fittings and can be found in Crane Flow of Fluids,[3] Engineering Data Book,[4] Cameron
Hydraulic Data Book,[5] as well as the manufacturer’s technical data.
Equivalent lengths
The head loss associated with valves and fittings can also be calculated by considering equivalent "lengths" of pipe segments for eachvalve and fitting. In other words, the calculated head loss caused by fluid passing through a gate valve is expressed as an additionallength of pipe that is added to the actual length of pipe in calculating pressure drop.
All of the equivalent lengths caused by the valves and fittings within a pipe segment would be added together to compute the pressuredrop for the pipe segment. The equivalent length, Le, can be determined from the resistance coefficient, Kr, and the flow coefficient, CV,using the formulas given next.
(/File%3AVol3_page_341_eq_001.PNG) (Eq. 23)
(/File%3AVol3_page_341_eq_002.PNG) (Eq. 24)
and
Pressure drop evaluation along pipelines - http://petrowiki.org/Pressure_drop_evaluation_al...
12 of 14 03/19/2014 09:39 PM

(/File%3AVol3_page_341_eq_003.PNG) (Eq. 25)
where
Kr = resistance coefficient, dimensionless,
D = diameter of the pipe, ft,
f = Moody friction factor, dimensionless,
d = pipe ID, in.,
and
CV = flow coefficient for liquids, dimensionless.
Table 6 shows equivalent lengths of pipe for a variety of valves and fittings for a number of standard pipe sizes.
(/File%3AVol3_Page_342_Image_0001.png)
Table 6
Nomenclature
Z = elevation head, ft,
P = pressure, psi,
ρ = density, lbm/ft3,
V = velocity, ft/sec,
g = gravitational constant, ft/sec2,
HL = head loss, ft.
f = Moody friction factor, dimensionless,
L = pipe length, ft,
D = pipe diameter, ft,
ΔP = pressure drop, psi,
μ = viscosity, lbm/ft-sec.
SG = specific gravity of liquid relative to water (water = 1),
Ql = liquid-flow rate, B/D,
S = specific gravity of gas at standard conditions relative to air (molecular weight divided by 29),
Qg = gas-flow rate, MMscf/D.
γ = kinematic viscosity, centistokes,
ϕ = absolute viscosity, cp
Ql = liquid flow rate, B/D,
w = rate of flow, lbm/sec
P1 = upstream pressure, psia
P2 = downstream pressure, psia.
ΔhW = pressure loss, inches of water,
W = rate of flow of mixture, lbm/hr,
ρM = density of the mixture, lbm/ft3
P = operating pressure, psia,
R = gas/liquid ratio, ft3/bbl,
T = operating temperature, °R,
ΔPZ = pressure drop because of elevation increase in the segment, psi,
ΔZ = increase in elevation for segment, ft.
Pressure drop evaluation along pipelines - http://petrowiki.org/Pressure_drop_evaluation_al...
13 of 14 03/19/2014 09:39 PM
HL = head loss, ft,
Kr = resistance coefficient, dimensionless
CV = flow coefficient for liquids, dimensionless.
Kr = resistance coefficient, dimensionless,
References
↑ 1.0 1.1 Griffith, P. 1984. Multiphase Flow in Pipes. J Pet Technol 36 (3): 361-367. SPE-12895-PA. http://dx.doi.org/10.2118/12895-PA (http://dx.doi.org/10.2118/12895-PA).
1.
↑ 2.0 2.1 Taitel, Y., Bornea, D., and Dukler, A.E. 1980. Modelling flow pattern transitions for steady upward gas-liquid flow invertical tubes. AIChE J. 26 (3): 345-354. http://dx.doi.org/10.1002/aic.690260304 (http://dx.doi.org/10.1002/aic.690260304).
2.
↑ 3.0 3.1 Crane Flow of Fluids, Technical Paper No. 410. 1976. New York City: Crane Manufacturing Co.3.
↑ 4.0 4.1 Engineering Data Book, ninth edition. 1972. Tulsa, Oklahoma: Natural Gas Processors Suppliers Assn.4.
↑ 5.0 5.1 Westway, C.R. and Loomis,A.W. ed. 1979. Cameron Hydraulic Data Book, sixteenth edition. Woodcliff Lake, New Jersey:Ingersoll-Rand.
5.
Noteworthy papers in OnePetro
Use this section to list papers in OnePetro that a reader who wants to learn more should definitely read
External links
Use this section to provide links to relevant material on websites other than PetroWiki and OnePetro
See also
Piping and pipeline systems (/Piping_and_pipeline_systems)
Pipelines (/Pipelines)
Pipeline pigging (/Pipeline_pigging)
Pipeline design consideration and standards (/Pipeline_design_consideration_and_standards)
PEH:Piping and Pipelines (/PEH%3APiping_and_Pipelines)
Pressure drop evaluation along pipelines - http://petrowiki.org/Pressure_drop_evaluation_al...
14 of 14 03/19/2014 09:39 PM