d. winter 1940/41 a climatic research delight a. bad boys
TRANSCRIPT

105
D. Winter 1940/41 a climatic research delight
a. Bad boys in navy blue and climate experts without a clou?
The scientific thrilling highlight of the 2nd war winter for making progress in earth science had been the exceptionaly cold winter conditions in Southern Norway and the whole Skagerrak area. This rather small area even if only viewed in context with northern Europe got a record cold spell in January 1940, in a generally extreme cold winter (D/J/F), which was much colder than the long-term average, but slightly less cold than the 1st and the 3rd war winter of WWII. But that did not apply to the Skagerrak area that faced record conditions as of today. But even if one is reluctant to view every record in depth, it seems too ignorant and unscientific, ignoring the fact that only a few months earlier the entire German Kriegsmarine sailed to Norwegian shores to ambush and occupy the country, with all available means, by land, in the air and at sea. From April to June 1940 the Norwegians defended their country with shore batteries, sea mines, and surface vessels. Britain and other nations contributed to their defence. During the remaining months until the record cold January 1940, German and Allied naval forces met in numerous encounters along the entire Norwegian coast up to the Barents Sea. Amazingly enough, the matter has drawn little, if any attention from the scientific community.
aa. Two Norwegian meteorologists Although that happened long ago, winter conditions in the early 1940s, and the record January 1941 for Norway have only briefly been compiled in one paper, as far as I know. The Norwegian meteorologists Hesselberg and Birkeland had been working on climate variations in Norway1, with a concluding supplement for the years 1940-1950 (Hesselberg, 1956). There are only a few pages on the war winters 1940, 1941 and 1942, and one table on temperatures in January 1941, from which two experts are quoted, as a prelude, and more details will be given later (below: sec. b-dd):
• __“6. The Three Cold Winters 1940-42. After rapidly rising winter temperatures in the 1930-years the three cold winters 1940-42 initiated a period with somewhat lower temperatures. It therefore may be of interest to look a little more at the meteorological conditions during these years. As they were approximately the same for the whole period, these three years can meteorologically be treated together by studying the mean values during the 1940-42”.
The significant deviation in Oslo during the three winters is shown in the next Figure. Concerning January 1941 (see D-8) the authors say:
1 Submitted 1940 to: NDF, Geofysike Publikasjoner, Vol.14, no.4 (Text in German: Säkulare Schwankungen des Klimas von Norwegen) on ‚air temperature’; 1941 on ‚precipitation’; 1943 on ‘air pressure’; and 1944 on ‘humidity’.
Figure D-1; Battle ship and destroyer in a Norwegian fjord

106 D. Winter 1940/41 a climatic research delight?
• __“As an illustration of the cold winter we give a table over the lowest minimum observed in January 1941 (Table C). The coordinates of the stations are found in the Norwegian Meteorological Year-books. The coldest periods were January 1.-3. 16.-20. Some of the minimum temperatures in January 1941 are the coldest ones ever observed at the station. The cold temperatures in January and February caused difficulties due to ice in February.”
That is all they have to tell about one of the most extraordinary winters in Norwegian’s climatological history. No ideas, no imagination, no interest, no curiosity why it happened so suddenly, and so unexpectedly. There had been no natural cause in sight anywhere, but a lot of unprecedented naval activities in the marine environment of the Skagerrak and along Norwegian coast and fjords. No questions asked and no progress in science. That is science as it should not have been, even many decades ago. More in section: b-dd.
To get more motion into this matter, the Norwegian Campaign and the winter in Norway and the Skagerrak region will be in focus with only a brief presentation of the general weather and winter situation in 1940/41.
bb. Shaken seas 1940 – the Norwegian Campaign – and other
forces.
Considering a link between the severities of the extreme cold war winter in WWII and naval activities does not go without a bit naval history. Like in any other experiment the means to carry out an experiment must be named. Fortunately, this can and needs to be done only in very general terms, if at all. On one hand one has to cover a naval war in action over a period of several months in 1940 which preceded the winter season 1940/41 and may have contributed to its
unusual conditions. On the other hand man’s activities in the marine environment had been so extremely numerous, that the matter can not be addressed here at all, except by greatly generalizing, (a) the general naval warfare situation, (b) the North Sea as major battle field, and (c) the special naval operation codenamed “Weserübung” (Norwegian Campaign) to occupy Norway. (a) Beyond the waters of the North Sea the world saw many naval activities around the globe, with three complex events in the immediate vicinity of the European continent. They are only mentioned in order to present a fairly complete picture. There had been, for example, numerous naval warfare activities in the Mediterranean since Italy declared war on Britain and France on June 10, 1940. For each side control and safe use of the sea-lane for supplies was vital. The fact that this had an impact on the Mediterranean Sea and subsequently the weather, should not be completely rejected, although this investigation did not make any attempt in this respect, due to two major reasons:
Figure D-2/-3/-4; Oslo annual and seasonal temperature 1880-1985
D. Winter 1940/41 a climatic research delight 107
__even during the winter season the sun is still very influential on sea surface conditions, and __the water masses involved are of oceanic dimension (with an average depth of 1,500 m), and a considerably different vertical temperature structure over the entire depth of max. 5,267 m, and temperatures not lower than 10°C.
(b) In course of the invasion of France since May 10, 1940, the Germans swept westwards through Holland, Luxembourg and Belgium with 140 divisions (about 3.3 Million men) using about 7,000 guns, 5,500 aircraft and 2,500 tanks until they controlled French sea ports, which was the case on June 22. Now the Germans could use facilities in Brest, Lorient, St. Nazaire, La Pallice and Bordeaux for U-boats and bomber mission in the Atlantic. In July German bombers attacked ships in the English Channel destroying 40 ships (about 75,000 tons). From July until October 1940, over 220 allied ships were sunk, and about another hundred until the end of the year. Temporary success was due to a coordinated attack of several U-boats on a single convoy, known as ‘Wolfpack’ tactics. This way a group of 10 U-Boats caught the fast moving convoy HX90 in early December and torpedoed 13 ships, of which ten were sunk and three damaged. The “Atlantic Battle” and the commencement a global cooling is discussed in Chapter G.
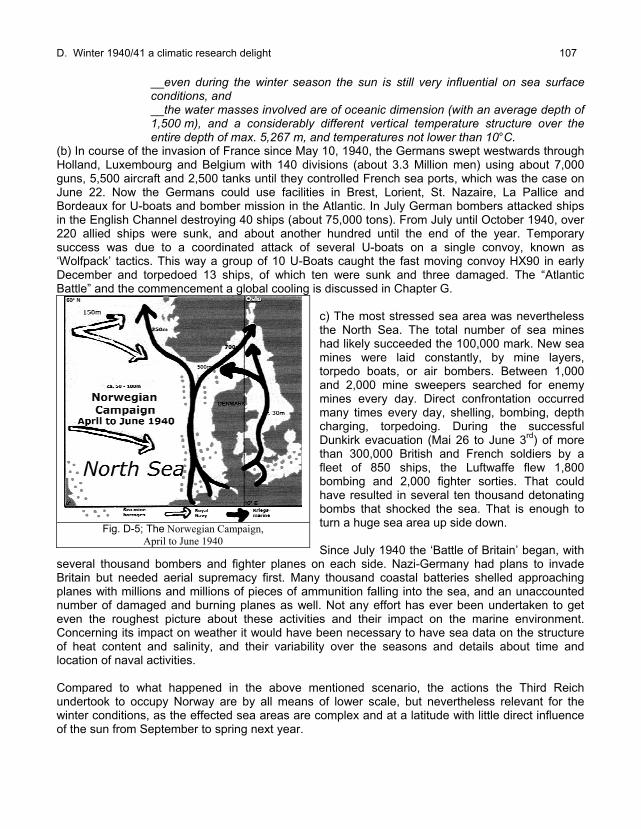
c) The most stressed sea area was nevertheless the North Sea. The total number of sea mines had likely succeeded the 100,000 mark. New sea mines were laid constantly, by mine layers, torpedo boats, or air bombers. Between 1,000 and 2,000 mine sweepers searched for enemy mines every day. Direct confrontation occurred many times every day, shelling, bombing, depth charging, torpedoing. During the successful Dunkirk evacuation (Mai 26 to June 3rd) of more than 300,000 British and French soldiers by a fleet of 850 ships, the Luftwaffe flew 1,800 bombing and 2,000 fighter sorties. That could have resulted in several ten thousand detonating bombs that shocked the sea. That is enough to turn a huge sea area up side down. Since July 1940 the ‘Battle of Britain’ began, with
several thousand bombers and fighter planes on each side. Nazi-Germany had plans to invade Britain but needed aerial supremacy first. Many thousand coastal batteries shelled approaching planes with millions and millions of pieces of ammunition falling into the sea, and an unaccounted number of damaged and burning planes as well. Not any effort has ever been undertaken to get even the roughest picture about these activities and their impact on the marine environment. Concerning its impact on weather it would have been necessary to have sea data on the structure of heat content and salinity, and their variability over the seasons and details about time and location of naval activities. Compared to what happened in the above mentioned scenario, the actions the Third Reich undertook to occupy Norway are by all means of lower scale, but nevertheless relevant for the winter conditions, as the effected sea areas are complex and at a latitude with little direct influence of the sun from September to spring next year.
Fig. D-5; The Norwegian Campaign,
April to June 1940

108 D. Winter 1940/41 a climatic research delight?
Invasion plans: The invasion was to take place from Oslo to Narvik in one move. A minimum of six locations were targeted, Oslo, Narvik, Kristiansand, Stavanger, Bergen, and Trondheim, covering a distance about 2,000 km, with numerous fjords, bights, islands and rocks. Naval Forces: During the campaign until June 1940, presumably 80 to 120 naval vessels and approximately 1,000 airplanes had been available and in service for the parties at war. Although the Norwegian Navy was small, it was able to lay sea mines with their fleet consisting of a dozen mine layers and utilising installed coastal batteries at a number of locations. A well-known act by the Norwegian Navy is the sinking of the heavy cruiser Blücher with old 28cm guns and torpedoes when she attempted to enter the Oslo fjord. First battle: In the First Battle of Narvik on April 10th, 1940, five Royal Navy destroyers entered the harbour of Narvik where five destroyers of the Kriegsmarine were seriously damaged, thereof two sunk. Six other German ships were also sunk, as well as two British destroyers. Support vessels: Equipment and ammunition required by German forces were to be transported to various locations by about 50 vessels, with a total capacity of 250,000 tons. Loss of ships and tonnage amounted to about 20% of the total available ships/tonnage including two tank ships of 6,000 tons during the campaign. Military activities: The Number of activities or events really runs into many thousands. Rohwer’s “Seekrieg”2 has listed about 100 major events. The Allies, consisting of British, French and Polish personnel, were shipped in considerable numbers to Norway. Following the occupation of Narvik by German troops, 25,000 Allied soldiers were evacuated in early June. Three major encounters took place at Narvik and approaches (Vestfjorden) to the port on April 10 – 13 and on June 8 involving up to two dozen larger naval vessels each time, with severe losses on both sides. To illustrate that for instance, the encounter of the air craft carrier HMS Glorious with the battle ships Scharnhorst and Gneisenau about 400 km west of the Lofoten on June 8th should be recalled. The German battleships shelled the Glorious and the escorting destroyer Acasta and Ardent, which returned the fire, at ranges of 15 and 24 km. Within two hours all three ships sunk with the total crew of 1,519. Only 40 crew members survived. The Norwegian Campaign ended on June 10, with a total loss during two months of about 34 naval vessels with 500,000 tons including 9 submarines, 19 destroyers or bigger ships, which were sunk or damaged. The loss of naval vessels was equal on both sides.
b. Meteorological Situation in Northern Europe
aa. Introduction to Winter 1940/41 One of the most remarkable aspects of the winter 1940/41, is that this winter ranks only in third place of the three war winters in question, except in the Skagerrak region where it climbed to the 2nd rank. Here the winter 1939/40 ranked 3rd, and winter 1941/42 was the coldest of the three and ranks 1st. By all means the winter was very cold, it did not equal that of 1939/40 (Germany, Holland, Britain) or the third war winter of 1941/42, particularly in Sweden, Denmark and Holland. In Germany the winter of 1940/41 ranked 20 among about 150; in Holland it ranked 33 among about 150 ‘ice winters’ between 1706 and 1946; and in Sweden it ranked 23rd among the cold winters since 1757, while the winter of 1939/40 was in place 9 or 10 (Oestman, 1941). The slightly lower severity of the winter 1940/41 is a logical consequence of the naval operation area prior to the winter season, and a relevant piece of evidence. A reasonable explanation for the less severe winter 1940/41 is that the Baltic was not used as a battle ground during 1940, and was left ‘undisturbed by major military operation since the armistice between Finland and Russia in March 1940. The water body of the Baltic stored and released heat as it has
2 „Chronik des Seekrieges 1939-1945“, http://www.wlb-stuttgart.de/seekrieg/chronik.htm

D. Winter 1940/41 a climatic research delight 109
Temperature map 8 (TM8); Fig. D-6; online: www.seaclimate.com..

110 D. Winter 1940/41 a climatic research delight?
always done. Instead the North Sea had to bear the burden of main regional sea war activities, which had obviously a significant impact on record cold air temperatures in the countries around the Skagerrak. Only the region covering areas which includes northern Denmark (including Copenhagen), and southern Norway (including Trondheim) made it to the 2nd rank among the three war winters.
bb. Summer and autumn 1940 In Sweden the winter of 1939/40 was over by the end of March with lively cyclone activities and ample precipitation. End of April to mid June saw fine weather with no rain, followed by cyclone activities with plenty of rain in September. After some varying air pressures with the start of the next winter a mighty high pressure ridge was established over Scandinavia which controlled the weather until the end of that year. In Great Britain May, June, August & September were all dry months, with a cool and showery July (around 190% of the all-series mean). August and early September were dominated by cool and moist weather after which the conditions were not far from average until the end of November, which was the coldest (up to that date) of the century, at Greenwich the lowest for 75 years (Dines, 1942).
NOTE: The last week of May, and the first week of June, 1940, the weather in the eastern Channel was unusually quiet, during which the huge evacuation of Allied troops took place. This allowed the about 750 'little' ships to operate across the Strait of Dover in conditions for which they were not designed. Was the noticeably calm weather a result of bombing, shelling, depth charging, and ship movement, which ensured that cold water was forced to the sea surface, that kept air dynamics low? Usually the condition in such a small region is absolutely determined by the general air pressure condition, but not necessarily in all situations.
In Germany the North and East showed a negative deviation of 1.4°C from the long-term annual average, the West and South only 0.9°C, particularly due to the cold January and February. Compared to the months of August and September (North Germany only), October and December were 1-3°C colder than average. Only July and November showed positive anomalies. Precipitation was high in South and West Germany; in March, July, and September and November with 200% at times and in July even 300% above average. North Germany, particularly the Eastern part, was extremely dry in some cases. In summary it seems quite obvious that war conditions ‘forced’ the autumn weather into a similar pattern as during the first few war months in late 1939, creating continental conditions over Southern Scandinavia and Northern Germany. Due to activities in the North Sea and Baltic, during which the seas released more vapour than usual, the result was the penetration by north-easterly winds that pushed the humid air to regions further south. Another result: the ongoing war in southwest Europe (producing condensation nuclei) together with pushing of heavier continental air southward, forcing the atmosphere to precipitate much more than normal. This situation is similar to that in autumn of 1939 and therefore does not need to be repeated here.
cc. Winter 1940/41 weather The severity of this winter is due to low temperatures in December 1940 and January 1941. The close to normal conditions in Western and Central Europe in February 1941, prevented this winter to do better than rank three, with the exception of southern Scandinavia from the Norwegian Atlantic coast to the Bay of Bothnia.
December 1940
Sweden, December 1940: During the first few days of the month a number of depressions moved in an easterly direction north of Scandinavia. On the 5th a strong cyclone moved to Götaland

D. Winter 1940/41 a climatic research delight 111
(South Sweden) and strengthened there with plenty of rain all over the country. This was followed by a mighty anti-cyclone over Scandinavia for the rest of the month. For December 21 it is recorded: A very mighty high pressure area (1045mb) over South Norway (Oslo -17°, Copenhagen -11°, Hamburg -11°, Gdansk -1°, Helsinki -5°C), covers the whole European continent. Due to cyclonic activities in the north, a high pressure area temporarily moved south followed by the formation of a secondary low pressure over middle Sweden on 29th bringing abundant snowfall to southern Norrland. Denmark, December 1940: Frost that began just before the middle of December causing icing, which started at the Northern coast of Lolland and a little bit later, among others, at some fjords in Eastern Jutland and in the Isefjord. However, no noticeable harm to shipping was observed anywhere during this month. Five light vessels in service in the Kattegat and Belts reported freezing temperatures on most days from December 12 until the end of the month. Germany, December 1940: December was too cold and, with the exception of Northwest and Central Germany, too dry. Daily mean temperatures, except for December 3 – 10, were far too low with negative anomalies of about 1.5°C at the coastal regions and 5°C in the Dresden region. Frost and ice days had been 5-10 days above average. There was declining precipitation from west to east (100 –200mm/20-30mm). Russia, December 1940: For this investigation not enough information had been available to say anything about the conditions in western Russia. However, it should be noted that the all time record for the coldest December months in Moscow is said to have been December 1940 (wikipedia/Climate of Moscow).
January 1941 Sweden, January 1941: The month started with a high over Norrland that brought cold air from the Northeast to the southern and middle parts of the country, deepening continuously while moving in the direction of Svealand and Götaland to stay there, and on the 6th pushing extreme cold air to these parts of the country. At the same time a mild westerly air current crossed Norrland in association with low pressure that moved in easterly direction in the north of Scandinavia. Air pressure was high above west and south-western Scandinavia and low in the East, whereby initially warmer air from NW and N moved to the middle and southern parts of the country. The period between the 11th and 21st varied by an exchange of weak low and weak high pressure. On 13th/14th a cyclone with a corresponding precipitation area crossed from NW to the middle part of the country, while high pressure was stationary over northerly Sweden accompanied by extreme cold. On the 21st another high formed over Norrland, thereafter moving to the southern and central parts of the country to remain there until the end of the month, generating extreme cold, especially after the 26th. Together with a cyclone in the south of Sweden the anti-cyclone caused a continuous sharp E-NE wind in Götaland from 21st to 24th, temporarily with plenty of snow in the southern parts of the country.
Fig. D-7; Jan. & Feb. T°C Deviation in Denmark 1890-2005

112 D. Winter 1940/41 a climatic research delight?
In January 1941, southern and central parts of Sweden had been colder than during January 1940, and in some locations colder than even 1860, when most of the meteorological stations in the country had been commissioned (SMHI, 1941). The greatest heat deficit was observed in the inner parts of Götaland and northern Dalarna. Even in South Sweden severe night frost of -20°C and more was observed, which is a comparatively very rare occurrence. Denmark, January 1941: Denmark recorded the coldest January since 1874, with regard to ‘lower than average’ water temperature or too cold water in the Skagerrak. Of particular interest is the fact that Northern Jutland recorded varying temperatures from –20 to –28°C, while Southern Jutland was about six degrees ‘warmer’, recording –16° to –22°C. January 1941 also served Denmark with the record temperature of –30.3 C°, measured near Viborg station on January 29 (Det Danske). It was the lowest temperature measured at the stations of the Danish Meteorological Institute. Until then the lowest temperature recorded was –29.6°C, measured on January 17, 1893 in Holbaek. All light vessels were withdrawn from service south of Copenhagen between January 4th and 16th due to ice formation and until the end of March except for the vessel Drogden. Drogden reported from January 1 to February 7, 1940 permanent freezing temperatures, the lowest being –11.5°C (January 26) and –12.7°C (February 5). Germany, January 1941: January was considerably too cold and, with the exception of large parts of Northern Germany, too wet. With the advance of a Nordic high-pressure area over Scandinavia at the beginning of the month, temperatures decreased by 10-14°C below average, which caused lively NE winds bringing considerable amounts of snow. Around the 6th this high moved to Scottish waters. A depression in the Barents Sea brought mild warming to East Prussia and Silesia from January 10-13. Thereafter two part-depressions formed, one along the Norwegian coast and the other in the Adriatic Sea, again bringing more snow, except to the Northwest of the Reich (Helgoland Bight). Subtropical air arrived via the English Channel with an Atlantic depression on the 19th, with strong thawing for a few days, until cold air from a Greenland high pressure area advanced to middle Europe, moving the frost line from the river Elbe into France generating a 14-15°C below usual mean after Jan. 26th. A cyclone in the Channel region since Jan. 27th was not able to end the freezing period before month’s end. Great Britain, January 1941 There was a lot of snow during and since about the 18th. E.g. snowdrift up to 3m at Hoylake (Merseyside, a severe snowstorm in Scotland, drifts up to 4 meters (Sutherland & Caithness) and a blizzard in north-east England and south-east Scotland, noted at that time as the worst since March 18883.
dd. What did Hesselberg & Birkeland think that caused the cold January 1941? The two already mentioned meteorologists concluded in their work that the second half of the 19th Century got a bit warmer here, and windier there, but there was nothing exceptional. That was only true as long as one excluded the three war winters 1939/40, 1940/41, and 1941/42, and ignored the particularly cold winter in Southern Norway 1940/41. Concerning the winter 1940/41 they actually provided only a list of the “Lowest Temperatures in January 1941” (see below Fig. D-8). There is not any consideration, no reasoning and no word about how this could have come about. Even if they did not do it, the data they compiled are exceptional enough that generations of meteorologists should have picked up the issue. First the data concerning the January 1941 will be presented, followed by some information Hesselberg et al. mentioned concerning the observed changes during the three initial war winters, together with my comments. The January 1941 mean T°C. The last time Norway had uniform winter conditions from the North Cape to the Skagerrak presumably ended with the last Ice Age. Its long coast bordering the 3 See: http://booty.org.uk/booty.weather/climate/1900_1949.htm

D. Winter 1940/41 a climatic research delight 113
North Atlantic and its coastal water hosting warm Gulf currents make it virtually impossible for uniform winter conditions along the entire coast of Norway to prevail for two or three months, as is common in inner continental regions. The winter of 1940/41 proved it once again. Conditions between North and South Norway were significantly different. Generally speaking, the North was close to normal, while the South recorded great anomalies. While the North, north of Bergen, deviated in January 1941 from the average monthly mean only by 1-3°C, the Southern region deviated toward the Atlantic coast side by -5 to -9°C and in the Oslo Fjord and north of the Oslo region between –6 to -12°C from monthly means (all data from Norwegian Year Book). The deviations are calculated vs the mean 1901-1930.
• Oslo/Blindern is recorded with –8.3°C; • As, a few miles south of Oslo with – 9.6°C; • Ferder at the entrance to the Oslofjord with -7°C; • Lyngor (between Ferder and Kristiansand) with –7.9°C, and • Oksoy (near Kristansand) with –7.3°C.
At the western coast, in the Stavanger region, the temperature deviation at Suda is -10.7°C, while two other stations close to the sea, viz. Klepp and Skudenes, differed from the mean monthly average by –6.5°C and –4.9°C respectively. In Tromsø the deviation was –2.5°C, and at Vardø merely -1.7°C. “Lowest Temperatures in January 1941”. Hesselberg and Birkeland compiled a long list of low temperatures, some are shown for Southern Norway in the left Figure (D-8). The data along the Atlantic coast stations from Stavanger up to the North Cape had not been exceptionally cold, although Narvik is listed with –18.9°C and some places in the mountains,
e.g. Nrodli (–36°C), Dividalen (–29.1°C), Karasjok (–46°C), and Karpbukt (–33.9°C) at the Varangafjorden (at the border to Russia). A change of climatic conditions 1939/40 to 1941/42, was observed by Hesselberg and Birkeland, [graphic 5] which is only a selection from several tables, but was not any further commented by them. They were obviously not even willing to see the very pronounced difference between winter and summer months. The ignorance is expressed in the sentence already mentioned at the beginning of this chapter: “After the rapidly rising winter temperatures in the 1930-years the three cold winters 1940-42 initiated a period with somewhat lower temperatures”. The manuscript was only submitted for publication in 1956. There had been a dozen years available to ask at least two questions. What was the reason for the strong winter weather deviation in Norway, and particularly why did the winter 1940/41 come up with record temperatures only a few months after massive naval activities along the entire coast of Norway had taken place.
ee. Discussion
Both Swedish and German meteorological analysis show clearly that the Atlantic ‘weather kitchen’ was working. However, the West Drift directed the cyclones eastwards either north via the Barents Sea or south of the British Isles towards the Mediterranean. Particularly interesting is the low-pressure area coming down from Murmansk with warmer air for eastern Germany just before the middle of the month, while another cyclone arrived from the Adriatic Sea just a few days later. This demonstrates clearly that the Baltic still had some heat in store. All of this together with the move of the initial high-pressure area to Scotland on January 6th demonstrated almost perfectly that the
Fig. D-8; Record low temperatures in January 1941

114 D. Winter 1940/41 a climatic research delight?
northern North Sea was ‘unusually’ cold, particularly the Skagerrak and Kattegat. This attracted and sustained arctic air conditions, forming the basis for producing record low temperatures in southern Norway, and thus establishing that ‘glacial axis’ from Stockholm to London. After all, no January since meteorological observations were first recorded in 1860, had reached such low mean temperatures in northern Dalarna and Värmland and the inner part of Götaland. All of these regions are close to the Norwegian capital Oslo. But particularly temperature data from Denmark strongly indicates that for the winter 1940/41 Skagerrak was the ‘cold bowl’ which stretched actually – as already mentioned - from Stockholm to London.
c. Did the Skagerrak play a special role?
What really happened in the water body of the Skagerrak prior to and during winter 1940/41 will never been known. What is well known is that the regions surrounding the Skagerrak, northern Denmark, western Sweden, and southern Norway had been statistically colder than other regions in Northern Europe. It is so obvious, because it is so extremely exceptional, that this situation could not have happened without those huge naval warfare activities going on since April 1940.
Fig. D-9; Skagerrak T°C D-10; Water T°C structure
in the Skagerrak Fig. D-11; Skagerrak T°C
As science has done nothing during the last 70 years to shed more light on what has happened militarily in the waters of the Skagerrak, and in the air above, we know nothing about how that cold spell came about. Without massive research and engagement we will probably never know further details. This sea area, with its partial great depths (about 700m) and the connection to the Baltic is very special due to an enormous water exchange with the North Atlantic, the North Sea current system, and the low saline coastal current coming out from the Baltic, meandering northwards along the Norwegian coast. Although this may make an identification of the physical burden by the Norwegian Campaign virtually impossible, the naval war issue can not be released, if one wants find out what caused the extreme cold situation around the Skagerrak. It is too obvious that the sea did play a significant role in the extraordinary winter conditions from Oslo to Vyborg. This thesis will be illustrated by a few following points. Could airplanes have bombed the Skagerrak into the cold? The answer to the question is negative, especially when such actions have occurred over many months. The average depth in the Skagerrak is about 300 m, and even at the lowest points of 700m, the water temperature is not

D. Winter 1940/41 a climatic research delight 115
below 6°C. The seasonal water temperature fluctuations are limited to the upper 60 meters of the water column and are in average 6-16°C in August and between 6° and 3°C in January. Even when the sea surface freezes, this is normally only short lasting, because under the layer of ice there is still plenty of heat available. Can the salinity structure have been changed? This can be assumed, but the consequences can not be verified here. Interference in the sea water structure was not limited to bombing, but encompassed the entire available arsenal of weapons, including sea mine barrages. The water is more saline in the depths than at the sea surface. Even if one assumes that naval war has led to significant shifts in the salinity structure, then this question could only be pursued with powerful computer capacity
d. How deep could naval warfare penetrate?
In the previous section it was necessary to admit that the Skagerrak water body is too big and too complex to do better than guessing how the coldest ever January 1941 could establish itself in the Skagerrak region. The question is, whether naval war activities had anything to do with it. In this respect it was mentioned, that it might be appropriate to distinguish between the sea water body sea-wards of the coastline, and those waters inside the line, of which Norway has a large amount. At least their condition can be influential on local and regional weather. Whether that is an issue worth consideration, or to discard as complete nonsense, I can merely suggest not to object to this question outright, but to require a thorough scientific investigation by means nowadays available. The reason for calling on investigating what naval warfare in Norway’s fjords and inland water might have contributed to weather and temperature conditions in winter 1940/41 is quickly explained. During my research I came across a paper by Frogner (1948), in which he analyzed sea water temperatures taken by the Norwegian Fishery Directorate from 1935 to 1943 down to 300 meters at the following four stations: Sognesjoen 1935-43 (near Bergen); Skrova 1937-43 and Eggum 1935-43, and Ingöy, 1936-43 near the North Cape. Frogner notes that the annual periodic extremes are transmitted at Eggum and Ingöy fairly quickly from surface to bottom. At Eggum the minimum near the bottom (200m depth) is reached in the beginning of May. At both places the bottom water seems to originate partly from the sea outside, and is influenced only partly by vertical exchange. The stations at Sognesjoen (Sognes) and Skrova have a more sheltered position than the other two and accordingly they show great differences in the vertical temperature distribution, whereby Sognes seems to have a boundary level at about 100 m depth, and Skrova one at about 200 m depth. In order to find out whether there is a clue in the available data series that show traces of naval war activities I did my own analysis, which relies mainly on available data records of the deepest level (200/300m). My findings for the stations are briefly summarized as follows:
• Ingöy (300m): The seasonal variation is high (~ 2°C), whereby the highest drop seemed to have occurred from about October 1939 until June 1940 by approximately 3°C, as against
Fig. D-12, German sea mine barrages
in the Skagerrak

116 D. Winter 1940/41 a climatic research delight?
the usual 2°C. The deepest mark was reached in June 1941. There was a 1°C lower period, which lasted from about June 1940 to 1943. Whether the first drop in winter 1939/40 is in any way related to the Finnish-Russian war is impossible to answer here, although a number of naval activities took place in proximity of the North Cape at that time. Since December 1940 at the latest, quite a lot of activities had taken place in the very North, from the North Cape to Murmansk. The second drop during winter 1940/41 could well have its origin in military activities in the Norwegian Sea or along the coast of Norway.
• Records at the stations Eggum (200 m) show a very small negative deviation from about June 1940 to June 1942. For Eggum this is hardly traceable. At the Sognes 300m level the data indicate a shift during the time of occupation. The temperatures had not been taken from April to July 1940, which marks a significant difference of about 1°C between the time before and the time after summer 1940, see Figure D-13. The change to lower values may have partly been caused by naval war activities. From 1940-42 the temperatures remained lower than the previous average, while an increase of about 2°C (from 1942 level) occurred in 1943.
• Presumably the even more significant data records for the thesis of this investigation are
those from Skrova (300 m) (68°07’ North, 14°39’East) Figure D-15. The importance of this observation derives from the fact that water at the depth of 300 m is almost totally unaffected by seasonal variations, at the most 0.2°C. From January 1937 (6.8°C) until March 1940 (7.3°C), temperatures increased. The recording of temperatures was stopped from March 30 to June 22, 1940. When recording resumed, the temperatures had dropped by more than one degree to 6°C, followed by temperatures within a range of 6.4 to 5.7°C until the series ended.
Note: There had been three major naval events close to Narvik. There was, e.g. the bloody encounter in the Vestfjord in April, during which the Kriegmarine lost six of the 10 destroyers that participated in the battle. The same situation can be observed at Skrova at 200 meters level (not shown). As Frogner already observed, the seasonal vertical distribution did not reach the 200 m level, the temperature stayed steady within a range of 1°C. Between April and June 1940 also the 200 m level temperature saw a drop of one degree. The decrease remained on a low level until the series ended in 1943. The significant change in the various data records as already mentioned, clearly indicates a possible cause, viz. numerous military activities. On the other hand, it is impossible to assess whether the observed temperature change at depths of 300 m and 200 m will have had any traceable impact on the winter just one half year later. In the case of Skrova it may take much more
Fig. D-13; Sognes T°C at 300 m depth Fig. D-14; Locations Fig. D-15; Skrova T°C at 300 m depth

D. Winter 1940/41 a climatic research delight 117
than half a year. But there were thousands of other places along the Norwegian coast and inside of many fjords, particularly in the south of Norway and the Skagerrak, with naval activities, able to stir and mix warm and cold water layers that eventually invited powerful high pressure to take control over Scandinavia and the Northern North Sea from mid December 1940 and January 1941.
e. The sea ice winter 1940/41
aa. Initial remarks The previous section paid particular attention to the cold January 1941 in the Skagerrak region during the German assault on Norway. Whether it left any marks in the set-up and duration of the sea ice conditions in the Skagerrak can not be answered, simply because there is not enough information available. Hesselberg and Birkeland (1956) refer to a photo showing pack ice, with the caption: “The ice-conditions in Skagerrak 2 km south of the lighthouse Lille Torungen January 25th 1941”. That is all of the information from them, and there is nothing in sight to fill the gap. The Danish ice map of January 30, 1941 (below, D-19), merely covers the Skagerrak with question marks. Although there are other gaps as well, e.g. the ice maps drawn by the German services which are said to have been lost, it is impossible to draw a fairly comprehensive picture here. The most interesting point of this ice winter is that despite of its overall severity, it is only third among the three war winters, and that the Baltic had not been subjected to naval warfare operations at sea for a considerable period of time, a situation very different during the autumn and early winter in 1939/40 and 1941/42. In this war winter (1940 and 1942) the sea ice reached the maximum cover of 420,000 km2, in winter 1940/41 only 370,000 km2, which is rank 10 during the last century. That does not make this sea ice winter less, but more interesting, as it can be regarded as evidence, that naval warfare did contribute to sea ice conditions in the first and third war winter. For this reason an outline will be given, based on material published in the 1940s or 1950s. However, the interested reader should compare the information about this sea ice winter with those of the other two war winters.
Fig. D-16 Sea ice in winter 1940/41 Fig. D-17; Sea ice in winter 1940/41
bb. The Finnish perspective – Risto Jurva et al.4
4 Jurva, Risto and Palosuo, Erkki; (1959): ‘Die Eisverhältnisse in den Finnland umgebenden Meeren in den Wintern 1938 – 1945 und die Baltischen Eiswochen in den Wintern 1938–39’, Meerentutkimuslaitoksen Julkaisu Havsforskningsinstitutets Skrift, No. 188, Helsinki 1959.

118 D. Winter 1940/41 a climatic research delight?
R. Jurva and E. Palosuo regard the winter as exceptional, although less severe than in 1939/40. The first icing appeared in the most northern part of the Bay of Bothnia on October 20th. Real icing started on November 2nd, but only toward the end of the month fast ice formed in the inner bights of the Gulf of Bothnia and the Gulf of Finland. There had been two cold periods in December which were severe towards the end of the month with temperatures between –20° and -30°C, lasting until January 3rd. At that time a fast-ice-bridge between Finland and the Åland islands was formed, about three weeks earlier than average. The open sea in the Gulf of Bothnia was still ice free. Although the time since January 11th until February was very cold in the northern Baltic ice established only after January 24th. At the same time the Danish fairways and the southern Baltic iced (Fig. D-19), and at Kolberg (Kolobrzeg) the cover reached 30km seawards around February 7th (Fig. D-16). During the next days wind moved northwards and freed the entire coast of ice. In the western Baltic the ice remained until about the middle of March (Fig. D-17), in the Finish region the ice cover got a second maximum as late as March 28th, due to low temperatures, which lasted until April 11th, keeping a substantial ice cover in place (Fig. D-18). From thereon ice decreased, and the last ice disappeared in the Gulf of Finland on May 19th and in the Gulf of Bothnia by May 30th.
cc. C.J. Oestman from Sweden C.J. Oestman starts his lengthy ice report5 with the notion already mentioned (Chapter A1) that two severe ice winters are infrequent and happened the last time 1915/16 and 1916/17 (more in Chapter I), and mentioning further that: The winter 1940-41 was very cold, but not as cold as the winter 1939-40. In southern Sweden, however, January 1941 was colder than January 1940 and, moreover, the coldest January since 1814. The strong frost commenced about the middle of December and continued to the beginning of April, only interrupted by short mild periods.
• ___Ice formed along all our coasts during January, which is absolutely a fortnight earlier than normal at the Swedish west coast. During February solid ice increased on the Gulf of Bothnia and the Baltic, but decreased in the Skagerrak and the Kattegat. During March the ice increased especially around Gotland. On June 6th all waters were free of ice.
• ___The thickness of ice was on average equal in size during these two winters, and the measured maximum 120 cm.
• ___With the exception of the Skagerrak, the Kattegat and the southern Baltic, the ice period was longer in the winter 1940-41 than in 1939-40.”
dd. Data from the German Baltic coast.
In 1961 the German Hydrographical Institute published the data from the beginning and end of sea ice observed at stations in West-Germany6 since 1900. The main ice conditions in the Baltic at 18 locations are summarized as follows:
5 Oestman, C.J.; ‘Isvintern 1940-41 – En jämförselse med 1939-40’, Statens Met-Hydro. Anst., Meddelanden Ser. Uppsatzer, No. 38, Stockholm 1941, p. 2-10.
Fig. D-18; Long lasting sea ice in spring 1941

D. Winter 1940/41 a climatic research delight 119
• __in the north of Kiel, open sea : January 16 to March 20, 66 days; • __Lübeck/Travemünde open sea: January 09 –March 15, 60 days; • __Fehmarnsund: January 17 – March 08, 48 days.
ee. DMK from Denmark
A brief excerpt from the 14 page Danish paper prepared by the Danish Meteorological Institute7, first:
• “The frost that began just before the middle of December was the cause for the beginning of icing, which started at the Northern coast of Lolland and a bit later among others at some fjords in Eastern Jutland and in the Isefjord; any noticeable harm to shipping, however, was observed nowhere in this month.
• January was very cold, the coldest January since 1874. On very few days average daily temperatures reached degrees a little above the freezing point; otherwise continuous frost with degrees below zero prevailed, which was very considerable on Januar 27th till 30th: in Northern Jutland –20° till -29°, and in Southern Jutland and on the isles –16° till –22°. The absolutely lowest temperature of this month (measured near Viborg on January 20th) was –30,3°C, which is the lowest temperature measured at the stations of the Meteorologiske Institut in this country; up to then the lowest temperature was –29.6° (measured on January 17th, 1893 in Holbæk).”
Fig. D-19; Sea ice in winter 1941 Fig. D-20; Winter T°C Copenhagen
And hereafter a few excerpts from the English Summary:
• “The winter 1940-41 was very cold, still as a total not as cold and lasting as the preceding winter, but on the other hand it put the record of the low temperature. As to the amount of cold the order of winters is: 1939-40, 1940-41, 1928-29, 1923-24, 1916-17, 1921-22 and so on. The frost commenced a short time before the middle of December and continued till
6 DHI-Eisbeobachtung; Deutsches Hydrographisches Institut, ‚Eisbeobachtungen – 1900/01 – 1959/60’, Nr. 17, Hamburg 1961. 7 Det Danske; Det Danske Meteorologiske Institut; ‘Is- og besejlingsforholdene i de danske Farvande i Vinteren 1939-40; 1940-41; 1941-42; 1947, Kobenhavn.

120 D. Winter 1940/41 a climatic research delight?
far into February, only interrupted by a few mild days. January was the coldest since 1874, and at the close of the month a temperature of –30.3°C was registered,
• __thickness of the ice; about 50 cm have been measured in many places where the ice was stationary, but also in greater distances from shores 40-60 cm have been recorded in several cases and even piles measuring 4-9 m have been encountered.
• __for a total of days; six localities had ice in 101-109 days, 71 localities in 75-100 days; the lowest number 7 days, was registered at Hundested; one harbour was free of ice (Karrebæksminde)”
Remark: No explanation is given for the low ice conditions at Hundested and Karrebæksminde, which are both located on the island of Zealand, one in the north, the other in the south, and Copenhagen at the east side of the island.
ff. German North Sea coast.
From the same source as mentioned for the German Baltic coast, the ice data for German locations along the North Sea coast are indicated from south to north, selected from about 50 stations:
• __Borkum isle: December 23 – February 12, 40 days; • __Norderney isle (mud-flats): December 23 – February 18, 57 days; • __Norderney (sea-side): January 17 – February 16 (26 days); • __Cuxhaven: December 23 – February 27, 56 days; • __Tönningen: December 21 – March 13, 83 days; • __Sylt island (List): January 03 – February 28, 51 days.
The icing started between 3 to 4 weeks earlier than at Baltic locations, sometimes only 50 km apart, which is probably due to extensive naval activities in the German Bight and North Sea.
gg. Commenting the ice season But it seems not too difficult to imagine that sea ice conditions would have been much more severe, and even longer lasting, if the Baltic had been exposed to heavy naval operations over a longer period of time. As this can be proven for the 1st and 3rd war winter, the necessary investigation about the possible relevance for the 2nd war winter on sea ice conditions, and weather, can be left unsolved for the time being.
f. Summing up a winter of scientific delight What a surprise. The winter is the less remarkable among the three extraordinary war winters, but as a research subject it is not less interesting. The war winter 1940/41 made it only to the third rank, but at a few locations it was second or even first. In January 1940 the region from Bergen, Copenhagen and Stockholm was record breaking, and that has something to do with naval war activities, from the English Channel to Narvik, without involving the Baltic throughout the entire year. Instead huge naval capacities had been employed during the German occupation of Norway and France in spring and summer in all sea areas west of the Kattegat. Thereafter the German war machinery increased its pressure on Britain to surrender, or to face landing troops at their shores. The sea around Great Britain and up to northern Norway was under conditions that had never been seen before. The sea water heat and salinity structure in the upper sea layers of a dozen meters depth was altered in a way as if a not ending storm had been at work over several months. During the autumn season that means cooling the water down earlier and to lower levels as the statistical average would indicate. It could be shown that the winter offers a number of significant opportunities to investigate the meteorological processes and conditions of this winter. It is possible to distinguish between main

D. Winter 1940/41 a climatic research delight 121
sea areas of naval operation in Northern Europe, namely the North Sea and the Baltic8. It is possible to identify the cold areas of the winter covering Northern Europe deep into Russia. It can be established that an extreme cold corridor during the principle winter months stretched form the west coast of Great Britain, east-north-east-wards via Skagerrak, and the Baltic, towards Archangels in northern Russia (TM8, p. 109). That alone is an indicator of the influence of the sea space in Western Europe on winter conditions, and this sea space was subject to severe naval war influence on the sea structure. The influence of this sea space is furthermore underlined by the fact that cold winter conditions were more pronounced in the west during the early phase of winter than further east. The appearance of sea ice in the German Bight by December 20th and record cold temperatures around the Skagerrak during the entire January 1940 are strong points in searching for the cause of the coldness in the sea region around Britain and the North Sea. This makes the sea conditions in the Skagerrak particularly interesting. For example the sea surface water temperatures (SST) at two Norwegian Skagerrak stations, Ferder and Torungen, had been below average towards the pervious years (1937-1939) during the months August to November 1940, see Figure below. What surprises, is that there had been above normal SST in December 1940 and that the sea ice cover during the record cold January 1941 had been modest. In Stockholm it was the coldest since 1814, and presumably as well as in the Oslo and northern Denmark region, were all time low records for the month of January had been registered. Shouldn’t that have caused at least a temporary significant sea ice cover? To answer this question other research facilities would be needed, as the Skagerrak is a very complex entity. With a 700m deep water body and mean temperatures never below 6°C, the Skagerrak has huge heat reserves available throughout the whole winter season. That puts the subject out of bounds to be discussed here in any detail, including the interesting question whether any naval operation and war measures (e.g. sea mines, depth charges, shelling, etc) hampered the freezing process? Presumably we will never know what happened off the coast line in the open sea. That must not necessarily apply for inland water areas, which saw also a lot of naval operations, and Norway has had a lot of them. The influence of naval warfare on the water body could be strongly linked to observed temperature shifts at depth of 300 meters. For a couple of years, only interrupted during the time of occupation, the Norwegian Fishery Directorate measured the water temperature at considerable depths. At the two stations investigated here, Sognes and Skrova, the temperature level was forced to a ~1°C lower level precisely during the time the Kriegmarine occupied Norway. Any prudent researcher would at least ask the question, whether that is an obvious correlation with war activities. Also in this case, it is the job of science to provide the answer to a very interesting and important question.
8 The naval war in the Mediterranean is here regarded as an independent matter.
Fig. D-21; Based on data: Frogner (1948)

122 D. Winter 1940/41 a climatic research delight?
The same can be said concerning the sea ice season 1940/41 in the Baltic. It is possible to prepare a fairly complete picture of the state of sea ice during the ice season. This investigation reproduces four ice maps, 3 (p. 117f) for the Baltic and 1 for the Kattegat (p.119). In each case the timing and duration could be subject to interesting analysis. The process and severity support the naval war thesis. The absence of major naval activities prevented the Baltic to reach the highest level of sea ice cover, respectively the severity of the 1st and 3rd war winter.
,
Fig. D-22; Winter temperatures 1880 to 1955 Fig. D-23; The Skagerrak in winter 1941 The uniqueness of the winter in the southern region of Norway had been noted by Hesselberg and Birkeland soon after the war. Although they realised that they published record data, they did not show the slightest curiosity why the three war winters happened just at the time of a major war, and the exceptional conditions in Norway only few months after hundreds of sea battles and war activities along the Norwegian shores occurred. In conclusion, there is no better explanation as that naval warfare had relentlessly contributed to the overall extremely cold conditions all over Northern Europe in winter 1940/41.
Text excerpt from "Spring Offensive" in TIME, April 15 1940.
The Attack. Before the first crashing chords of the new Berlin overture were heard, the orchestra began tuning in the pit. A British armed vessel off Norway's west coast fought two German submarines. Fishermen took ashore half a dozen dead, 40-10-50 wounded, of both nationalities. The Britisher and one submarine went down. British submarines were in the Skagerrak, past German minefields. Near Lillesand, on Norway's southeast tip, a British sub sent two torpedoes crashing into the hull of the 5,261-ton German freighter Rio de Janeiro. The world knew she had slammed a troop transport when Norwegian fishermen reported picking up live and dead German soldiers in field uniform. The Rio de Janeiro had had aboard 500 soldiers, 80 horses. Where were they bound? Why? The overture began. Through the Skagerrak steamed a fleet of 125 German armed ships including one pocket battleship, either Admiral Scheer or Lutzow. Norway ordered a blackout of every lighthouse on her coast. Into the Oslo Fjord steamed four warships—German. Norwegian coast defence batteries went into action and residents of Oslo fled to their cellars as they heard the door-slamming of the pieces and the bark of the naval guns in reply.
Fig. D-24; German naval ships in a Norwegian fjord. Photo # 71397 US Naval Historical Center.